Cell culture-based profiling across mammals reveals DNA repair and metabolism as determinants of species longevity
- Brigham and Women's Hospital, Harvard Medical School, United States
- University of Michigan Medical School, United States
- University of Michigan, United States
- Albert Einstein College of Medicine, United States
- University of Rochester, United States
- Broad Institute, United States
Figures
Figure 1
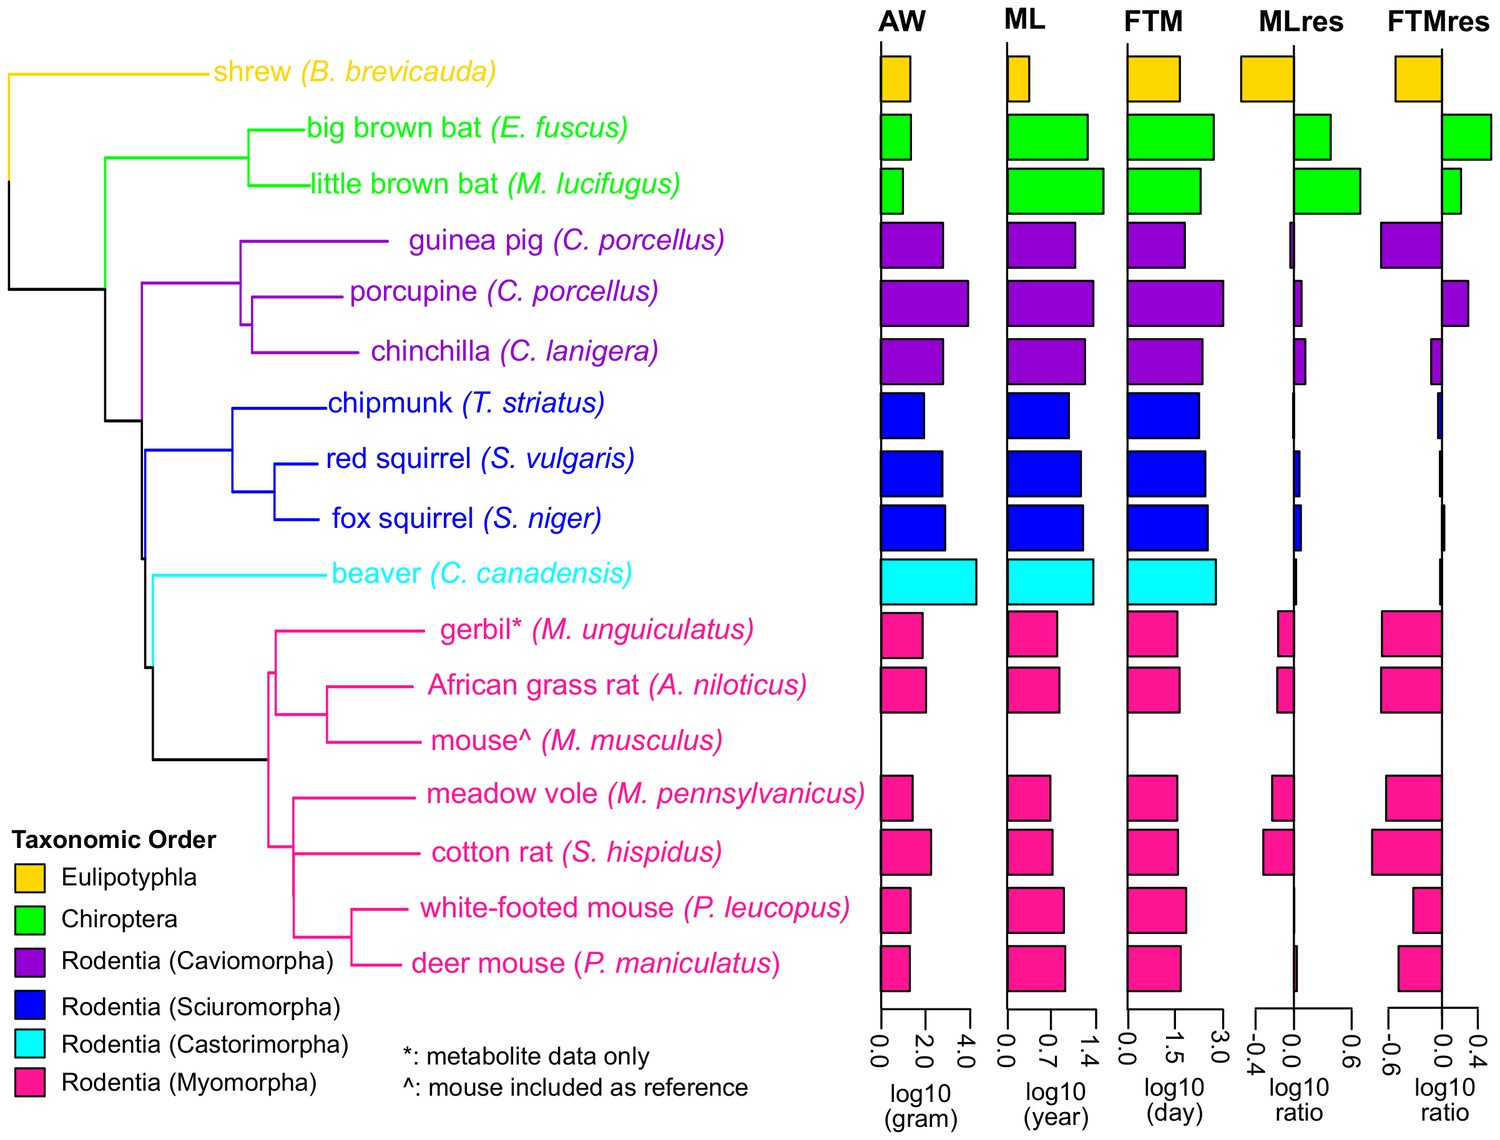
Phylogenetic relationship among species used in the study.
The tree was constructed using Neighbor-Joining method based on nucleotide sequences. Shrew was used as the out-group. Gerbil was collected for metabolite data only and mouse was included as reference. The species are colored by taxonomic order. Adult Weight (AW), Maximum Lifespan (ML), Female Time to Maturity (FTM), Maximum Lifespan Residual (MLres), and Female Time to Maturity Residual (FTMres) of these species are displayed in log10 scale.
-
Figure 1—source data 1
Species and samples used in the current study.
(A) Species and traits information. Life history traits of adult weight (AW, in grams), maximum lifespan (ML, in years), and female time to maturity (FTM, in days) of these species were obtained from Anage database (Tacutu et al., 2013). Since the life history data were not available for meadow vole, the data of a related species Microtus arvalis were used instead. Maximum lifespan residual (MLres) and female time to maturity residuals (FTMres) were computed based on the allometric equations MLres = ML/(4.88×AW0.153) and FTMres = FTM/(78.1×AW0.217), respectively. (B) RNA sequencing and read mapping to ortholog sets. Read mapping statistics are based on STAR. De novo assembly was performed by Trinity. (C) Read mapping to publically available genomes. For the species with publicly available genomes, the reads were also aligned to the full genomes for mapping rate comparison. The numbers of annotated genes were based on the published annotations. (D) Metabolite profiling. Metabolite profiling was performed on selected species only.
- https://doi.org/10.7554/eLife.19130.003
Figure 2 with 1 supplement
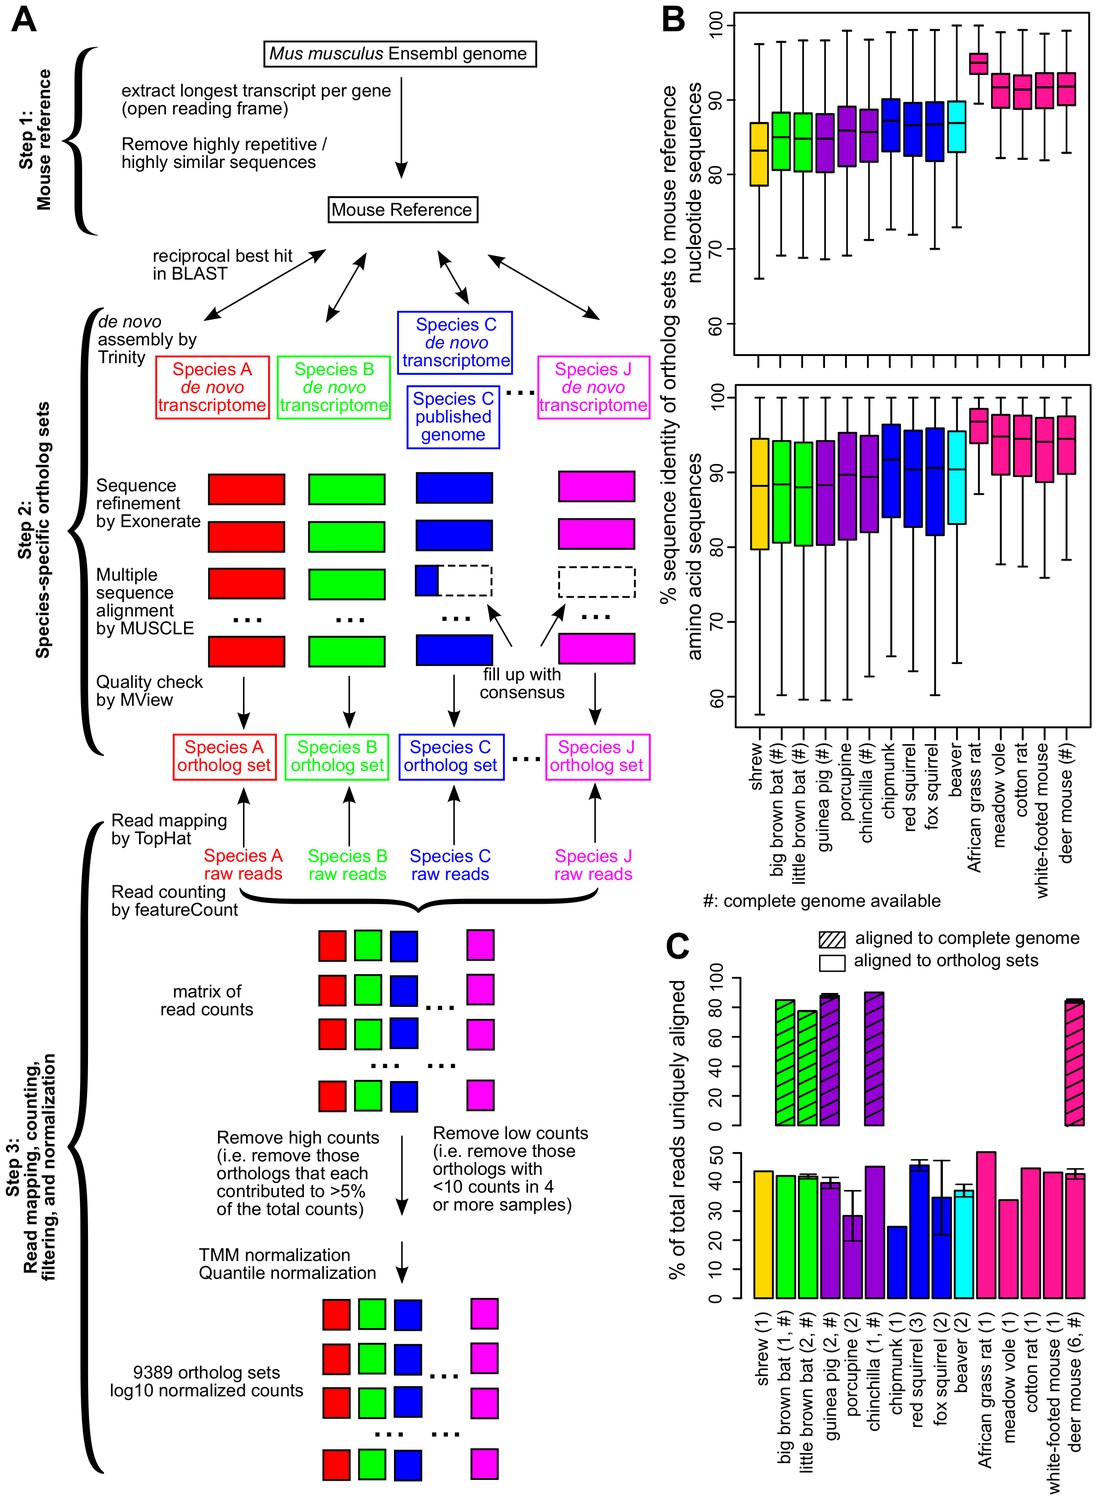
Cross-species analysis of gene expression in cultured skin fibroblasts.
(A) Pipeline to obtain the species-specific ortholog sets and expression values. See Materials and methods or a more detailed description of the methodology. (B) Sequence identity of ortholog sets compared to mouse. Nucleotide and amino acid sequence identity of the ortholog sets in each species was compared to mouse reference (mouse was set as 100%). The ortholog sequences were based on de novo assembled transcriptomes, as well as NCBI genomes (if available; indicated by ‘#’). The box plot shows the distribution across the 9389 gene orthologs, with the central bars indicating median values. (C) Read alignment rates for mapping to complete genomes and ortholog sets. Percent of total reads that could be uniquely aligned to the complete genomes (if available, indicated by ‘#’; shaded bars) or to the ortholog sets are shown. Error bars refer to standard error of mean. Number of samples (biological and technical replicates) per species is indicated in parenthesis.
Figure 2—figure supplement 1
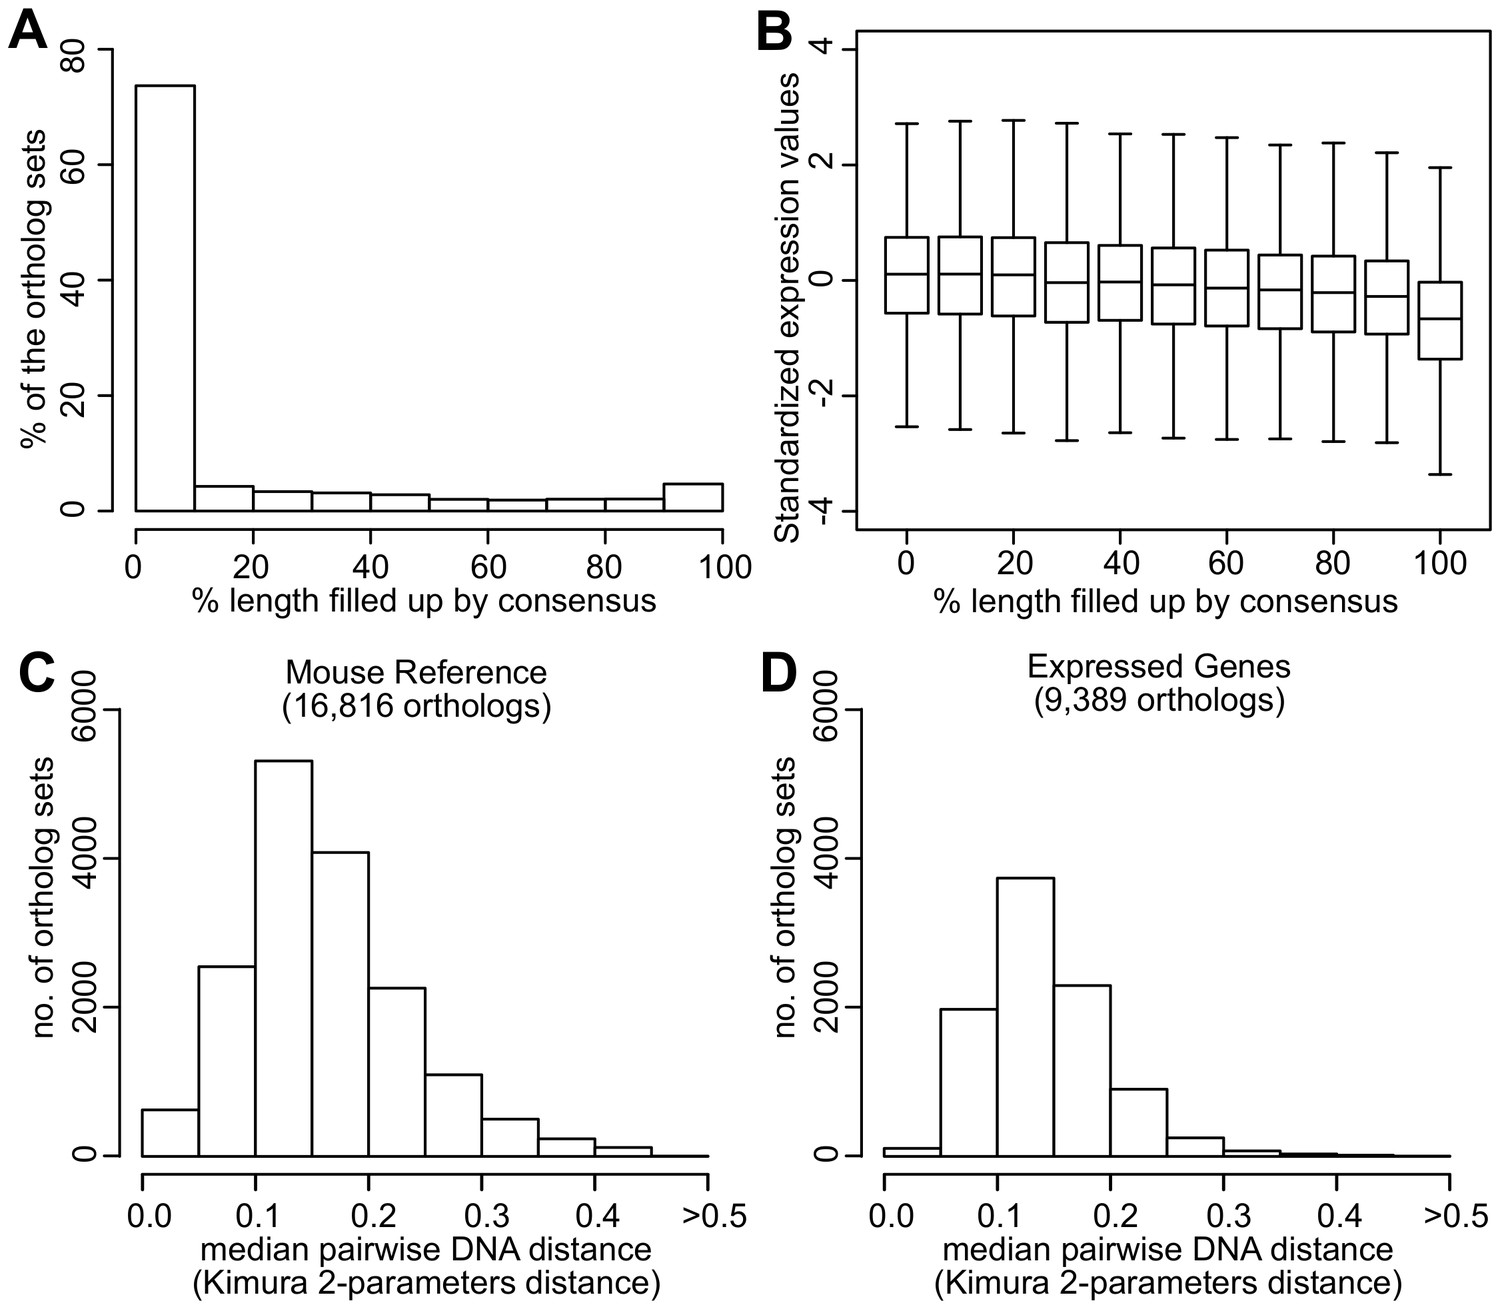
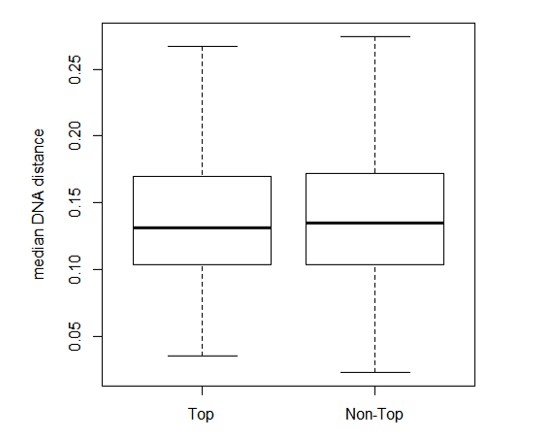
Quality assessment of orthologs.
(A) Percentage of ortholog sets filled up using consensus. Horizontal axis indicates the percentage of sequence length filled up by consensus. For example, 74% of the ortholog sets did not require filling up or were filled up <10% of the sequence length. Five percent of the ortholog sets were filled up 90–100% of the sequence length. (B) Standardized expression values of ortholog sets filled up using consensus. Within each ortholog set, the expression values were standardized to mean = 0 and standard deviation = 1. Distribution of the median pairwise DNA distance among (C) the Mouse Reference orthologs and (D) the expressed orthologs. The DNA distanced is based on Kimura 2- parameters distance.
Figure 3 with 1 supplement
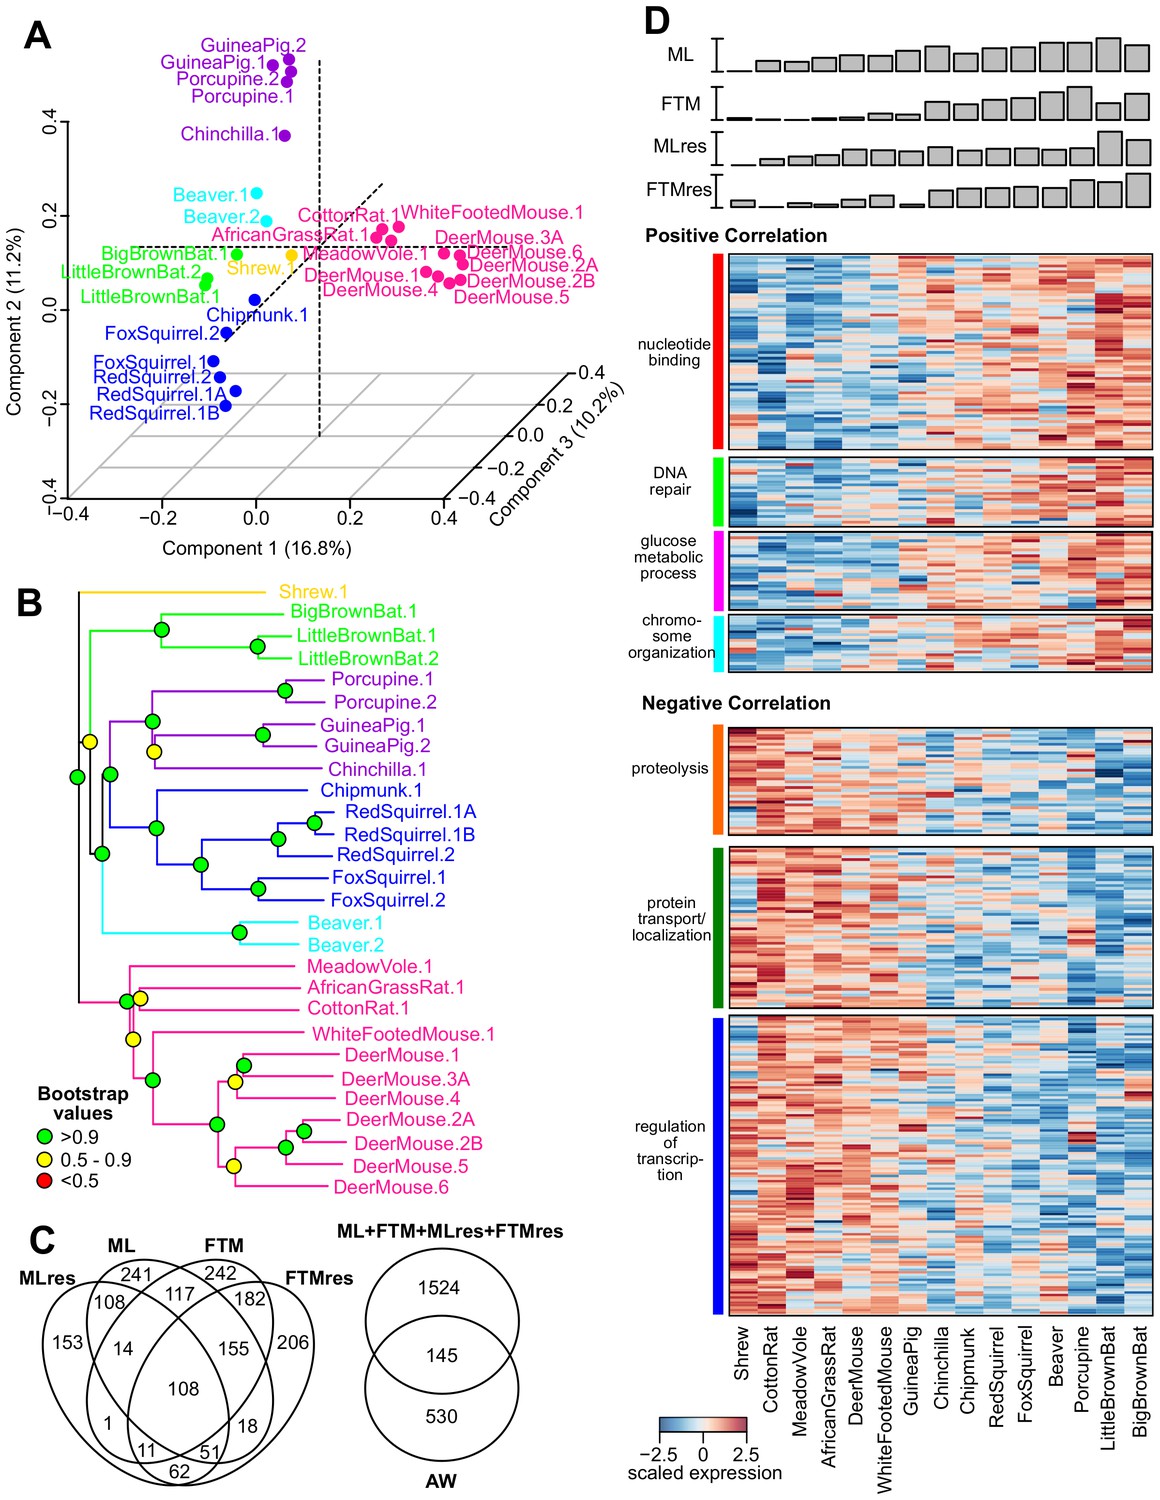
Gene expression variation and correlation with longevity.
(A) Projection of the first three Principal Components (PCs) in Principal Component Analysis. Values in parenthesis indicate percentage of variance explained by each of the PCs. Points are colored by taxonomic order (same color scheme as in Figure 1) (B) Gene expression phylogram. Color of the nodes indicates the result of 1000 times bootstrap. (C) Overlap of genes associating with Adult Weight and indicated longevity traits. AW: Adult Weight; ML: Maximum Lifespan; FTM: Female Time to Maturity; MLres: Maximum Lifespan Residual; FTMres: Female Time to Maturity Residual. (D) Heat map showing expression patterns of the top enrichment pathways. Species are arranged in the order of increasing longevity (the four longevity traits are scaled between 0 and 1).
Figure 3—figure supplement 1
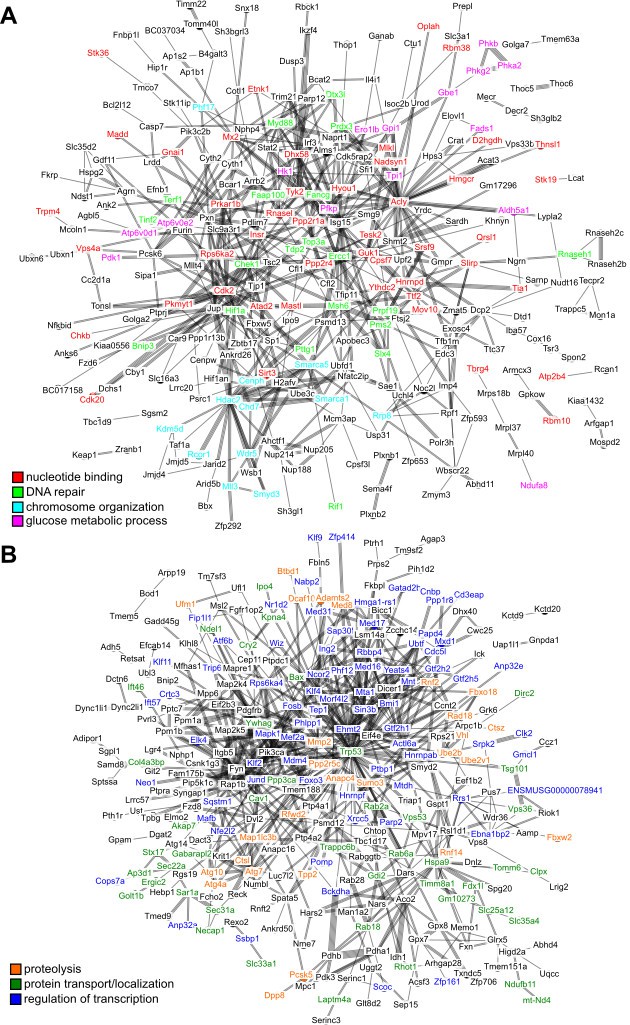
Interaction network among the top hits in (A) positive and (B) negative correlation with longevity.
The lines represent interaction based on STRING database (mouse genes). Selected gene names are colored based on the enriched pathways (see Table 1). Only the connected nodes are shown.
Figure 4
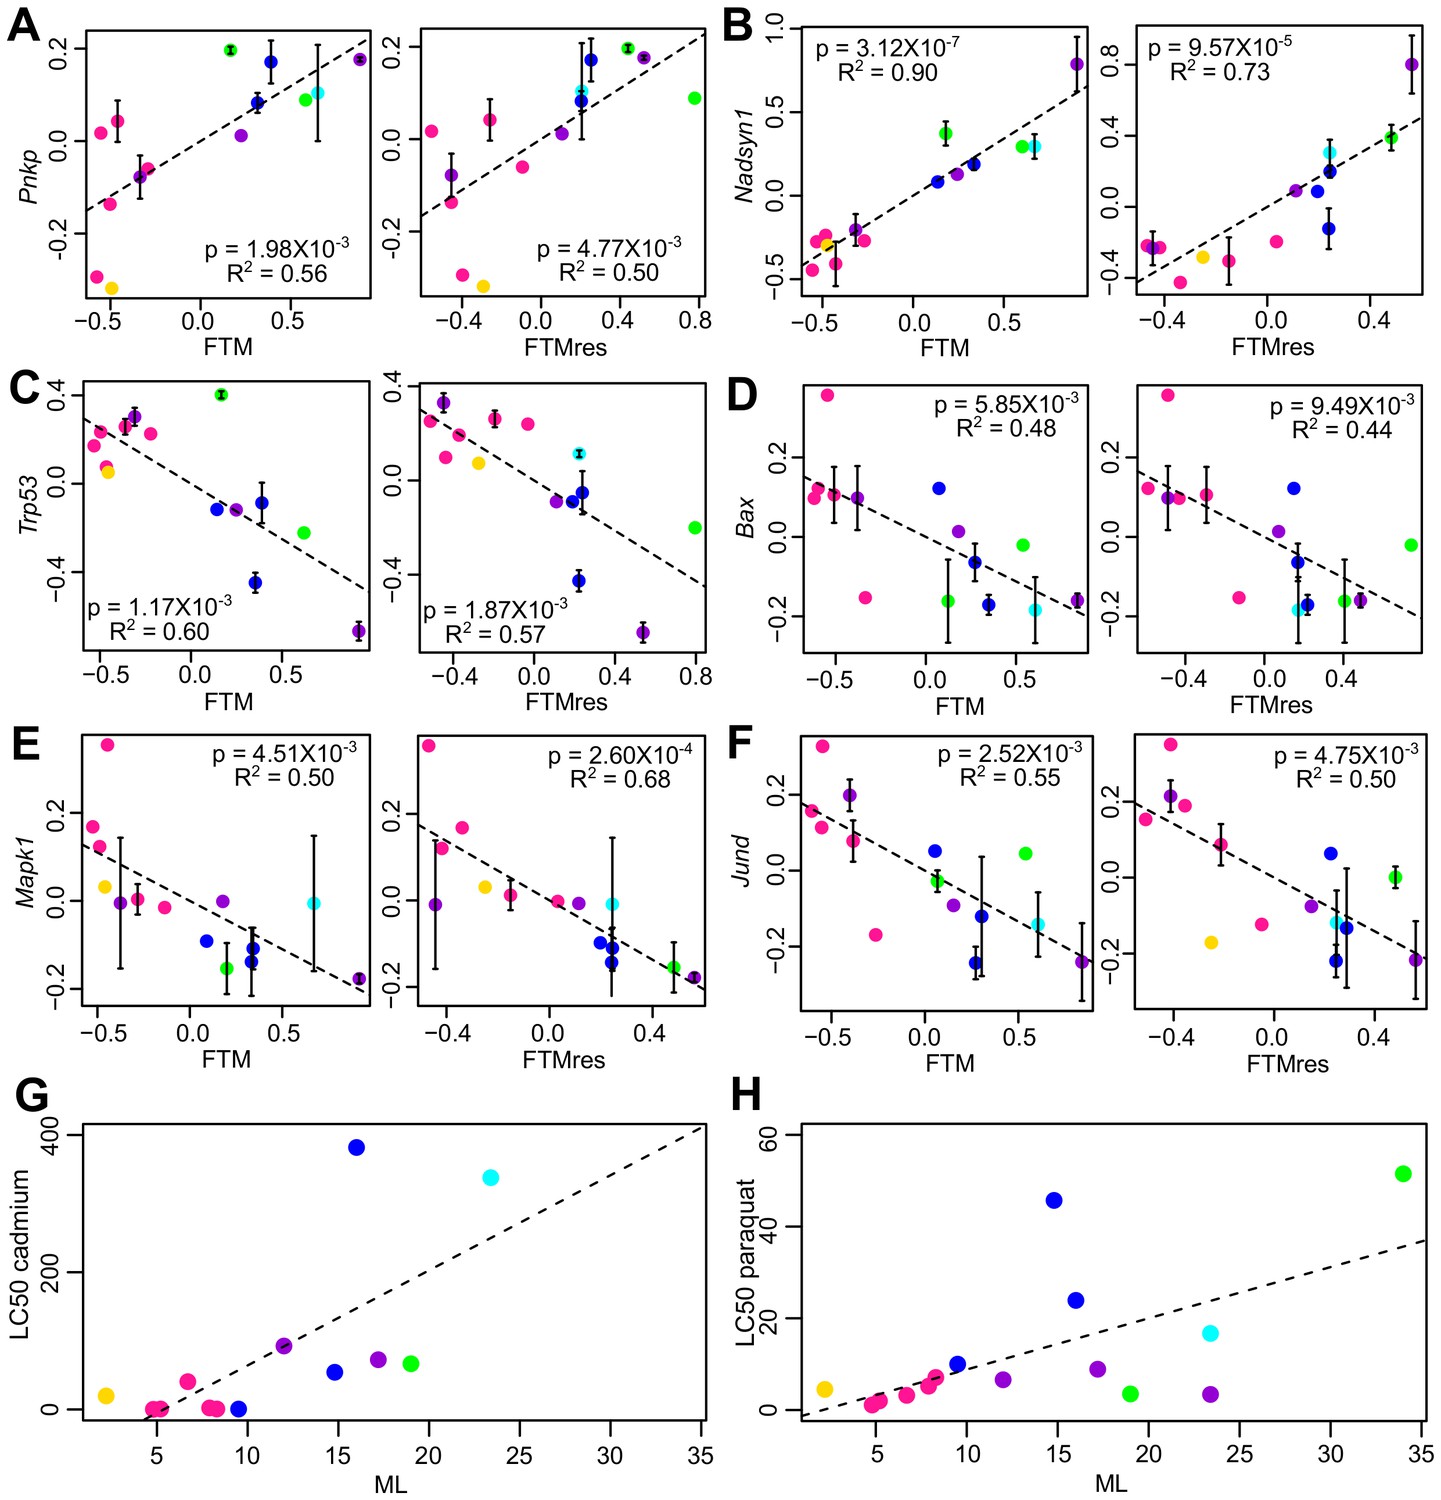
Selected genes and stress resistance conditions with significant correlation to longevity.
(A) Pnkp and (B) Nadsyn1 show positive correlation with the longevity traits. (C) Trp53, (D) Bax, (E) Mapk1, and (F) Jund show negative correlation with the longevity traits. In each plot, the gene expression values (vertical axis) and the longevity traits (horizontal axis; FTM: Female Time to Maturity; FTMres: Female Time to Maturity Residual) are centered at 0 on log10 scale and then transformed by the best-fit variance-covariance matrix under phylogenetic regression (i.e. to remove the phylogenetic relationship). The potential outlier point has been removed and the remaining points are shown on the plot and colored by taxonomic group (same color scheme as in Figure 1). The regression slope p value (i.e. p value.robust) and R2 value are indicated. Error bars indicate standard error of mean. Resistance to (G) cadmium and (H) paraquat treatments. In each plot, the lethal dose (LD50) values (vertical axis) and the longevity traits (horizontal axis; ML: Maximum Lifespan) are plotted on ordinary scale (without log transformation). The regression slope p values are 9.16 × 10⁻³ and 1.39 × 10⁻², respectively.
Figure 5 with 1 supplement
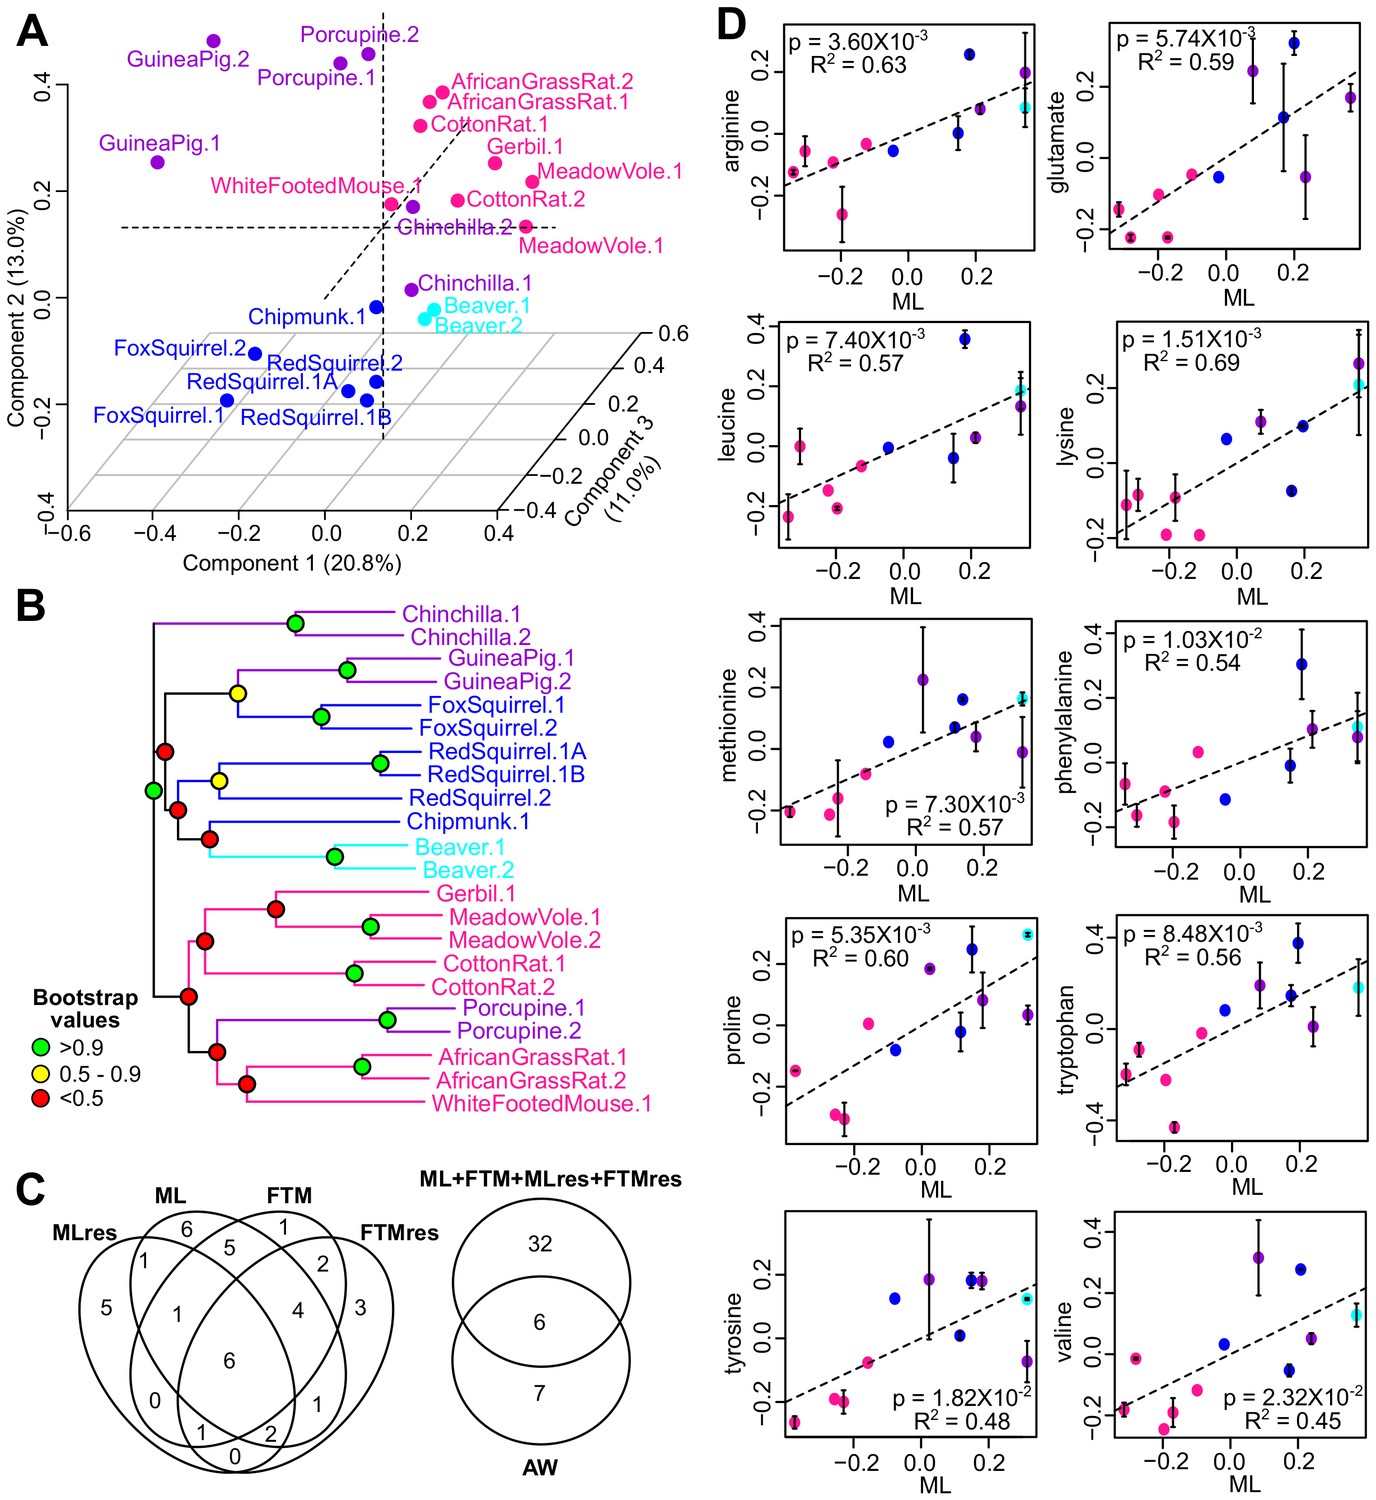
Metabolite variation and correlation with longevity.
(A) Projection of the first three Principal Components (PCs) in Principal Component Analysis. Values in parenthesis indicate percent of variance explained by each of the PCs. Points are colored by taxonomic order (same color scheme as in Figure 1) (B) Metabolite phylogram. Color of the nodes indicates the result of 1000 times bootstrap. (C) Overlap of metabolites associating with Adult Weight and longevity traits. AW: Adult Weight; ML: Maximum Lifespan; FTM: Female Time to Maturity; MLres: Maximum Lifespan Residual; FTMres: Female Time to Maturity Residual. (D) Amino acids showing positive correlation with Maximum Lifespan (ML). In each plot, the amino acid levels (vertical axis) and the longevity traits (horizontal axis) are centered at 0 on log10 scale and then transformed by the best-fit variance-covariance matrix under phylogenetic regression (i.e. to remove the phylogenetic relationship). The potential outlier point has been removed and the remaining points are shown on the plot and colored by taxonomic group. The regression slope p value (i.e. p value.robust) and R2 value are indicated. Error bars indicate standard error of mean.
Figure 5—figure supplement 1
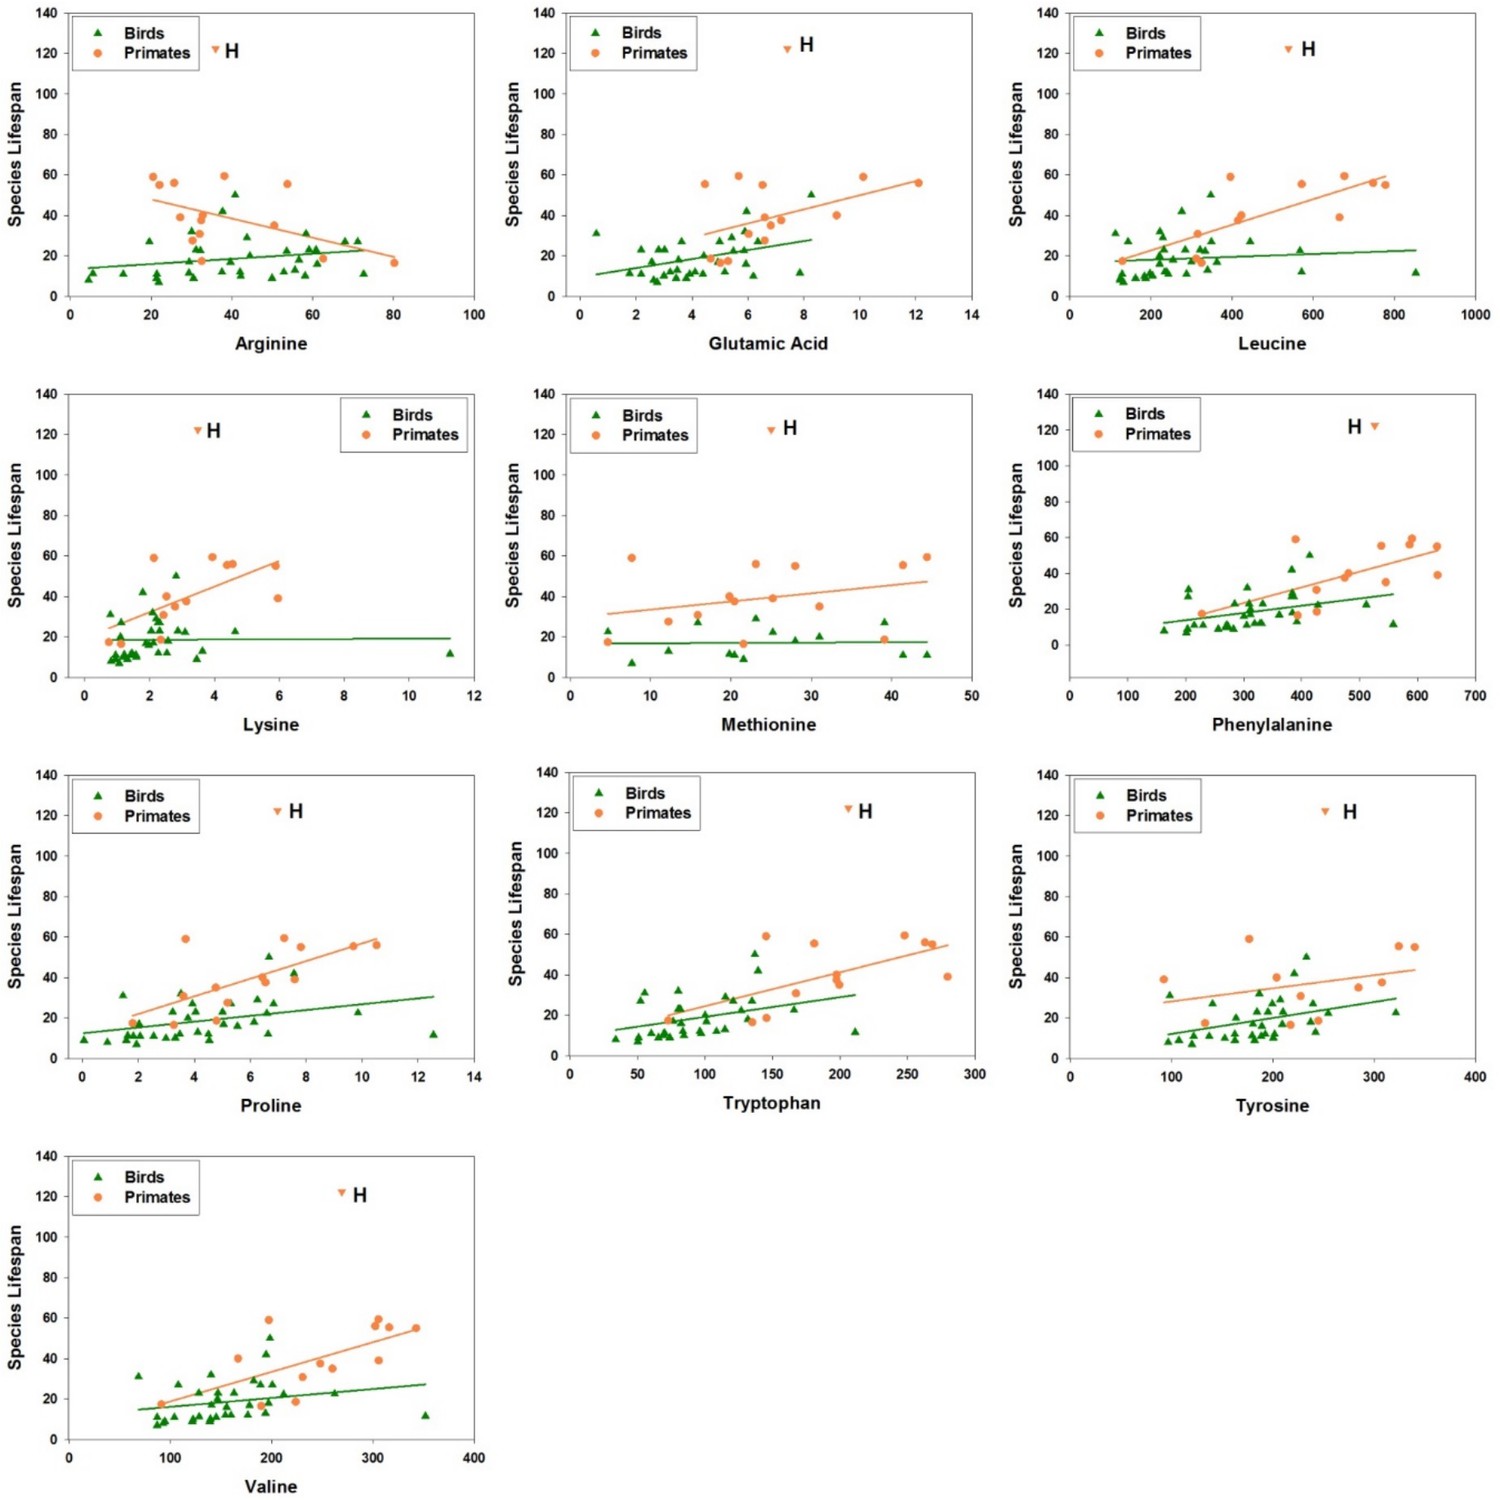
Amino acid levels in primate and bird fibroblasts correlate positively with species maximum lifespan.
Each point represents a different species of bird (green triangles) or non-human primate (orange circles), with linear regression lines shown separately for each group of species. Data for human fibroblasts are presented (orange triangle; 'H'), but did not contribute to the regression lines or significance and slope estimates shown in Table 2.
Author response image 1
Tables
Table 1
Pathway enrichment analysis of genes with significant correlation with the longevity traits.
The genes were supported by at least two longevity traits (p value.robust < 0.01 and p value.max < 0.05). Pathway enrichment was performed using DAVID. The percentages of positive or negative correlating genes belonging to each pathway were indicated in parentheses. Only selected pathways are shown here. GO (BP): Gene Ontology (Biological Process). GO (BP): Gene Ontology (Molecular Functions). SP/PIR: SwissProt and Protein Information Resource. See Table 1—source data 1 for more details.
Annotation cluster | Enriched terms and genes | No. of genes | p Value |
|---|---|---|---|
Positive Correlation Cluster No. 1 (15%) | GO (MF): adenyl nucleotide binding | 50 | 5.25 × 10⁻³ |
GO (MF): nucleotide binding | 64 | 1.21 × 10⁻² | |
Acly, Atad2, Atp2b4, Cdk2, Cdk20, Chd7, Chek1, Chkb, Cpsf7, D2hgdh, Dgkq, Dhx58, Dock6, Ero1lb, Etnk1, Fastkd5, Fn3krp, Gnai1, Guk1, Hk1, Hmgcr, Hnrnpd, Hyou1, Insr, Madd, Map4k5, Mastl, Mlkl, Mov10, Msh6, Mx2, Nadsyn1, Oplah, Pdk1, Pfkp, Phka2, Phkg2, Pkmyt1, Pms2, Pnkp, Ppp2r4, Prkar1b, Qrsl1, Rbm10, Rbm15b, Rbm38, Rhot2, Rnasel, Rps6ka2, Sacs, Sirt3, Slirp, Smarca1, Smarca5, Srsf9, Stk19, Stk36, Tbrg4, Tesk2, Thnsl1, Tia1, Top3a, Trpm4, Ttf2, Tyk2, Vps4a, Ythdc2 | |||
Positive Correlation Cluster No. 2 (4%) | SP/PIR: DNA damage | 14 | 1.16 × 10⁻³ |
SP/PIR: DNA repair | 12 | 4.25 × 10⁻³ | |
GO (BP): cellular response to stress | 16 | 1.01 × 10⁻¹ | |
Bnip3, C17orf70, Chek1, Dtx3l, Ercc1, Errfi1, Fancg, Hif1a, Mapkbp1, Msh6, Myd88, Pms2, Pnkp, Prdx3, Prpf19, Pttg1, Rad51b, Rif1, Rnaseh1, Slx4, Tdp2, Terf1, Tinf2, Top3a, Wrap53 | |||
Positive Correlation Cluster No. 4/5 (4%) | GO (BP): glucose metabolic process | 11 | 1.22 × 10⁻³ |
GO (BP): hexose metabolic process | 11 | 5.68 × 10⁻³ | |
GO (BP): generation of precursor metabolites and energy | 15 | 4.59 × 10⁻³ | |
Aldh5a1, Atp2b4, Atp6v0d1, Atp6v0e2, Ero1lb, Fads1, Gbe1, Gpi1, Hexa, Hk1, Insr, Ndst1, Ndufa8, Pdk1, Pfkp, Pgp, Phka2, Phkb, Phkg2, Prkar1b, Sdhaf3, Tmx4, Tpi1, Trpm4, Tsc2 | |||
Positive Correlation Cluster No. 6 (4%) | SP/PIR: chromatin regulator | 11 | 1.61 × 10⁻² |
GO (BP): chromosome organization | 17 | 2.22 × 10⁻² | |
Bnip3, Cenph, Chd7, Dtx3l, Ercc1, H2afv, Hdac2, Jade1, Kdm5d, Kmt2c, Pttg1, Rcor1, Rrp8, Smarca1, Smarca5, Smyd3, Terf1, Tinf2, Wdr5, Wrap53 | |||
Negative Correlation Cluster No. 1 (9%) | GO (BP): modification-dependent protein catabolic process | 27 | 2.39 × 10⁻⁴ |
SP/PIR: ubiquitin conjugation pathway | 26 | 3.35 × 10⁻⁴ | |
GO (BP): proteolysis | 36 | 1.09 × 10⁻² | |
Adamts2, Agtpbp1, Anapc4, Atg10, Atg4a, Atg7, Btbd1, Ctsl, Ctsz, Dcaf10, Dda1, Dpp8, Fbxl17, Fbxl20, Fbxo18, Fbxw2, Kcmf1, Map1lc3b, Med8, Mmp2, Mycbp2, Oma1, Pcsk5, Pgpep1, Pmepa1, Ppp2r5c, Rad18, Rfwd2, Rnf14, Rnf2, Rnf6, Sumo3, Tpp2, Ube2b, Ube2v1, Ufm1, Vhl | |||
Negative Correlation Cluster No. 2 (9%) | GO (BP): protein localization | 38 | 4.67 × 10⁻⁵ |
GO (BP): protein transport | 34 | 7.99 × 10⁻⁵ | |
Agap1, Akap7, Ap3d1, Atg10, Atg4a, Atg7, Bax, Cav1, Clpx, Cnih1, Col4a3bp, Cry2, Dirc2, Ergic2, Fdx1l, Fkbp15, Gabarapl2, Gdi2, Gm10273, Golt1b, Hspa9, Ift46, Ipo4, Kif1bp, Kpna4, Laptm4a, Lrp4, mt-Nd4, Mtch1, Ndel1, Ndufb11, Necap1, Ppp3ca, Rab18, Rab2a, Rab6a, Rhot1, Sar1a, Sec22a, Sec31a, Sec62, Slc25a12, Slc29a1, Slc33a1, Slc35a4, Snx12, Snx13, Stx17, Timm8a1, Tomm6, Trappc6b, Trp53, Tsg101, Vps36, Vps53, Ywhag | |||
Negative Correlation Cluster No. 3 (18%) | GO (BP): regulation of transcription | 74 | 1.62 × 10⁻⁵ |
SP/PIR: transcription regulation | 55 | 1.04 × 10⁻³ | |
Actl6a, Agtpbp1, Ak6, Anp32a, Anp32e, Atf6b, Bckdha, Bmi1, Ccdc59, Cd3eap, Cdc5l, Cggbp1, Clk2, Cnbp, Cops7a, Crtc3, Cry2, Csrp2, Ebna1bp2, Ehmt2, Elk4, Ergic2, Fbxo18, Fip1l1, Fosb, Foxo3, Gatad2b, Gid8, Gmcl1, Gtf2h1, Gtf2h2, Gtf2h5, Harbi1, Hlx, Hmga1-rs1, Hnrnpab, Hnrnpf, Ift57, Ing2, Ints4, Ipo4, Jund, Klf11, Klf2, Klf4, Klf9, Kpna4, Mafb, Mapk1, Mdm4, Med16, Med17, Med31, Med8, Mef2a, Mettl8, Mmp2, Mnt, Morf4l2, Mta1, Mtdh, Mxd1, Mycbp2, Nabp2, Ncor2, Neo1, Nfe2l2, Nr1d2, Papd4, Parp2, Phf12, Phlpp1, Pkig, Pomp, Pop5, Ppp1r8, Ppp2r5c, Ppp3ca, Ptbp1, R3hdm4, Rab18, Rad18, Rbbp4, Rfwd2, Rnf14, Rnf2, Rnf6, Rps6ka4, Rrs1, Sap30l, Sav1, Scoc, Sfmbt1, Sin3b, Snrk, Sqstm1, Srpk2, Ssbp1, Tep1, Tgfbr3, Trim35, Trip6, Trp53, Tsg101, Ube2b, Ube2v1, Ubtf, Ufm1, Vhl, Vps36, Wiz, Xrcc5, Yeats4, Zbtb14, Zfp414, Zfp637, Zfp655, Zfp710, Zfp821 | |||
-
Table 1—source data 1
Phylogenetic regression of gene expression against longevity traits.
Regression against (A) Adult Weight; (B) Maximum Lifespan; (C) Female Time to Maturity; (D) Maximum Lifespan Residual; and (E) Female Time to Maturity Residual. ‘coef.all’, ‘p value.all’, and ‘q value.all’ refer to the regression slope, p value, and FDR-adjusted q value using all the species. ‘p value.robust’ and ‘q value.robust’ refer to the statistics after removing the potential outlier point. ‘p value.max’ and ‘q value.max’ refer to the maximal (least significant) regression p value and q value when each one of the species was left out, one at a time. Only genes with p value.robust<0.01 and p value.max<0.05 are shown. (F) Top hits identified by two or more longevity traits. The p value.robust against each of the four longevity traits (ML, FTM, MLres, and FTMres) as well as adult weight (AW) are shown. These genes were the input for pathway enrichment analysis. Pathway enrichment analysis of genes showing (G) positive and (H) negative correlation with longevity traits. Enrichment was performed using DAVID with default settings. Only the top 10 clusters are shown. (I) System level analyses of gene functions. The numbers of shared genes between longevity associated genes (either positively or negatively or both) and human aging genes, essential genes, transcription factor genes, and housekeeping genes are shown. The enrichment p value was calculated by Fisher’s exact test with two different background gene sets.
- https://doi.org/10.7554/eLife.19130.009
Table 2
Amino acid levels showing consistent positive correlation with longevity traits.
For the mammalian fibroblast dataset, the number of longevity traits (out of Maximum Lifespan; Female Time to Maturity; Maximum Lifespan Residual; and Female Time to Maturity Residual) with significant positive correlation with the amino acid levels at two different cut-offs (p value.robust < 0.01 and p value.robust < 0.05) are shown. For the primate and bird fibroblast dataset, the regression was performed using primate data only, bird data only, and the pooled data of both. The regression slope p value < 0.05 are in bold.
Amino acid | Mammalian fibroblasts | Primate and bird fibroblasts | ||||||
|---|---|---|---|---|---|---|---|---|
No. of longevity traits (out of four) with significant correlation | Regression slope p value with species maximum lifespan | Regression slope p value with species maximum lifespan residual | ||||||
p value.robust < 0.01 | p value.robust < 0.05 | Primates only | Birds only | Primates and birds | Primates only | Birds only | Primates and birds | |
arginine | 3 | 4 | 3.4 × 10⁻² | 8.6 × 10⁻² | 3.1 × 10⁻² | 3.8 × 10⁻¹ | 1.1 × 10⁻² | 2.1 × 10⁻² |
glutamate | 2 | 4 | 6.5 × 10⁻² | 1.8 × 10⁻² | 1.1 × 10⁻² | 4.6 × 10⁻² | 2.8 × 10⁻¹ | 1.3 × 10⁻¹ |
histidine | 0 | 4 | 9.4 × 10⁻² | 6.0 × 10⁻² | 4.3 × 10⁻² | 2.3 × 10⁻¹ | 1.4 × 10⁻¹ | 1.7 × 10⁻¹ |
leucine | 2 | 4 | 2.9 × 10⁻³ | 6.0 × 10⁻² | 4.8 × 10⁻³ | 1.4 × 10⁻² | 5.9 × 10⁻¹ | 2.3 × 10⁻¹ |
lysine | 3 | 3 | 9.8 × 10⁻³ | 8.2 × 10⁻² | 1.4 × 10⁻² | 9.1 × 10⁻² | 2.9 × 10⁻¹ | 2.5 × 10⁻¹ |
methionine | 1 | 3 | 3.2 × 10⁻¹ | 1.4 × 10⁻² | 2.7 × 10⁻² | 3.0 × 10⁻¹ | 3.0 × 10⁻² | 4.9 × 10⁻² |
phenylalanine | 1 | 4 | 9.8 × 10⁻³ | 1.2 × 10⁻³ | 2.1 × 10⁻⁴ | 8.2 × 10⁻² | 1.3 × 10⁻¹ | 1.2 × 10⁻¹ |
proline | 1 | 4 | 4.4 × 10⁻³ | 3.9 × 10⁻⁴ | 3.6 × 10⁻⁵ | 3.5 × 10⁻² | 1.2 × 10⁻¹ | 5.4 × 10⁻² |
tryptophan | 2 | 4 | 9.2 × 10⁻³ | 7.8 × 10⁻⁴ | 1.2 × 10⁻⁴ | 2.6 × 10⁻² | 2.5 × 10⁻¹ | 1.5 × 10⁻¹ |
tyrosine | 1 | 3 | 3.2 × 10⁻¹ | 8.8 × 10⁻³ | 1.8 × 10⁻² | 4.3 × 10⁻¹ | 1.7 × 10⁻¹ | 2.9 × 10⁻¹ |
valine | 0 | 3 | 1.2 × 10⁻² | 5.4 × 10⁻³ | 1.0 × 10⁻³ | 2.0 × 10⁻¹ | 2.8 × 10⁻¹ | 3.2 × 10⁻¹ |
-
Table 2—source data 1
Phylogenetic regression of metabolite levels against longevity traits.
Regression against (A) Adult Weight; (B) Maximum Lifespan; (C) Female Time to Maturity; (D) Maximum Lifespan Residual; and (E) Female Time to Maturity Residual. ‘coef.all’, ‘p value.all’, and ‘q value.all’ refer to the regression slope, p value, and FDR-adjusted q value using all the species. ‘p value.robust’ and ‘q value.robust’ refer to the statistics after removing the potential outlier point. ‘p value.max’ and ‘q value.max’ refer to the maximal (least significant) regression p value and q value when each one of the species was left out, one at a time. Only genes with p value.robust < 0.01 and p value.max < 0.05 are shown. (F) Top hits identified by two or more longevity traits. The p value.robust against each of the four longevity traits (ML, FTM, MLres, and FTMres) as well as adult weight (AW) are shown. These metabolites were the input for pathway enrichment analysis. Pathway enrichment analysis of metabolites showing (G) positive and (H) negative correlation with longevity traits. Enrichment was performed based on hypergeometric statistics. (I) Top hits identified by two or more longevity traits, using cut-off of p value.robust < 0.05. The p value.robust against each of the four longevity traits (ML, FTM, MLres, and FTMres) as well as adult weight (AW) are shown.
- https://doi.org/10.7554/eLife.19130.014
Additional files
-
Supplementary file 1
Gene expression values.
(A) Raw counts. (B) log10 normalized values.
- https://doi.org/10.7554/eLife.19130.015
-
Supplementary file 2
Metabolite levels.
(A) Raw values. (B) log10 normalized values.
- https://doi.org/10.7554/eLife.19130.016
Download links
A two-part list of links to download the article, or parts of the article, in various formats.
Downloads (link to download the article as PDF)
Open citations (links to open the citations from this article in various online reference manager services)
Cite this article (links to download the citations from this article in formats compatible with various reference manager tools)
Cell culture-based profiling across mammals reveals DNA repair and metabolism as determinants of species longevity
eLife 5:e19130.
https://doi.org/10.7554/eLife.19130


