Ribosomal mutations promote the evolution of antibiotic resistance in a multidrug environment
- The Broad Institute of MIT and Harvard, United States
- Massachusetts General Hospital, United States
- Harvard Medical School, United States
- Texas A&M University, United States
- Harvard T.H. Chan School of Public Health, United States
Figures
Figure 1 with 2 supplements
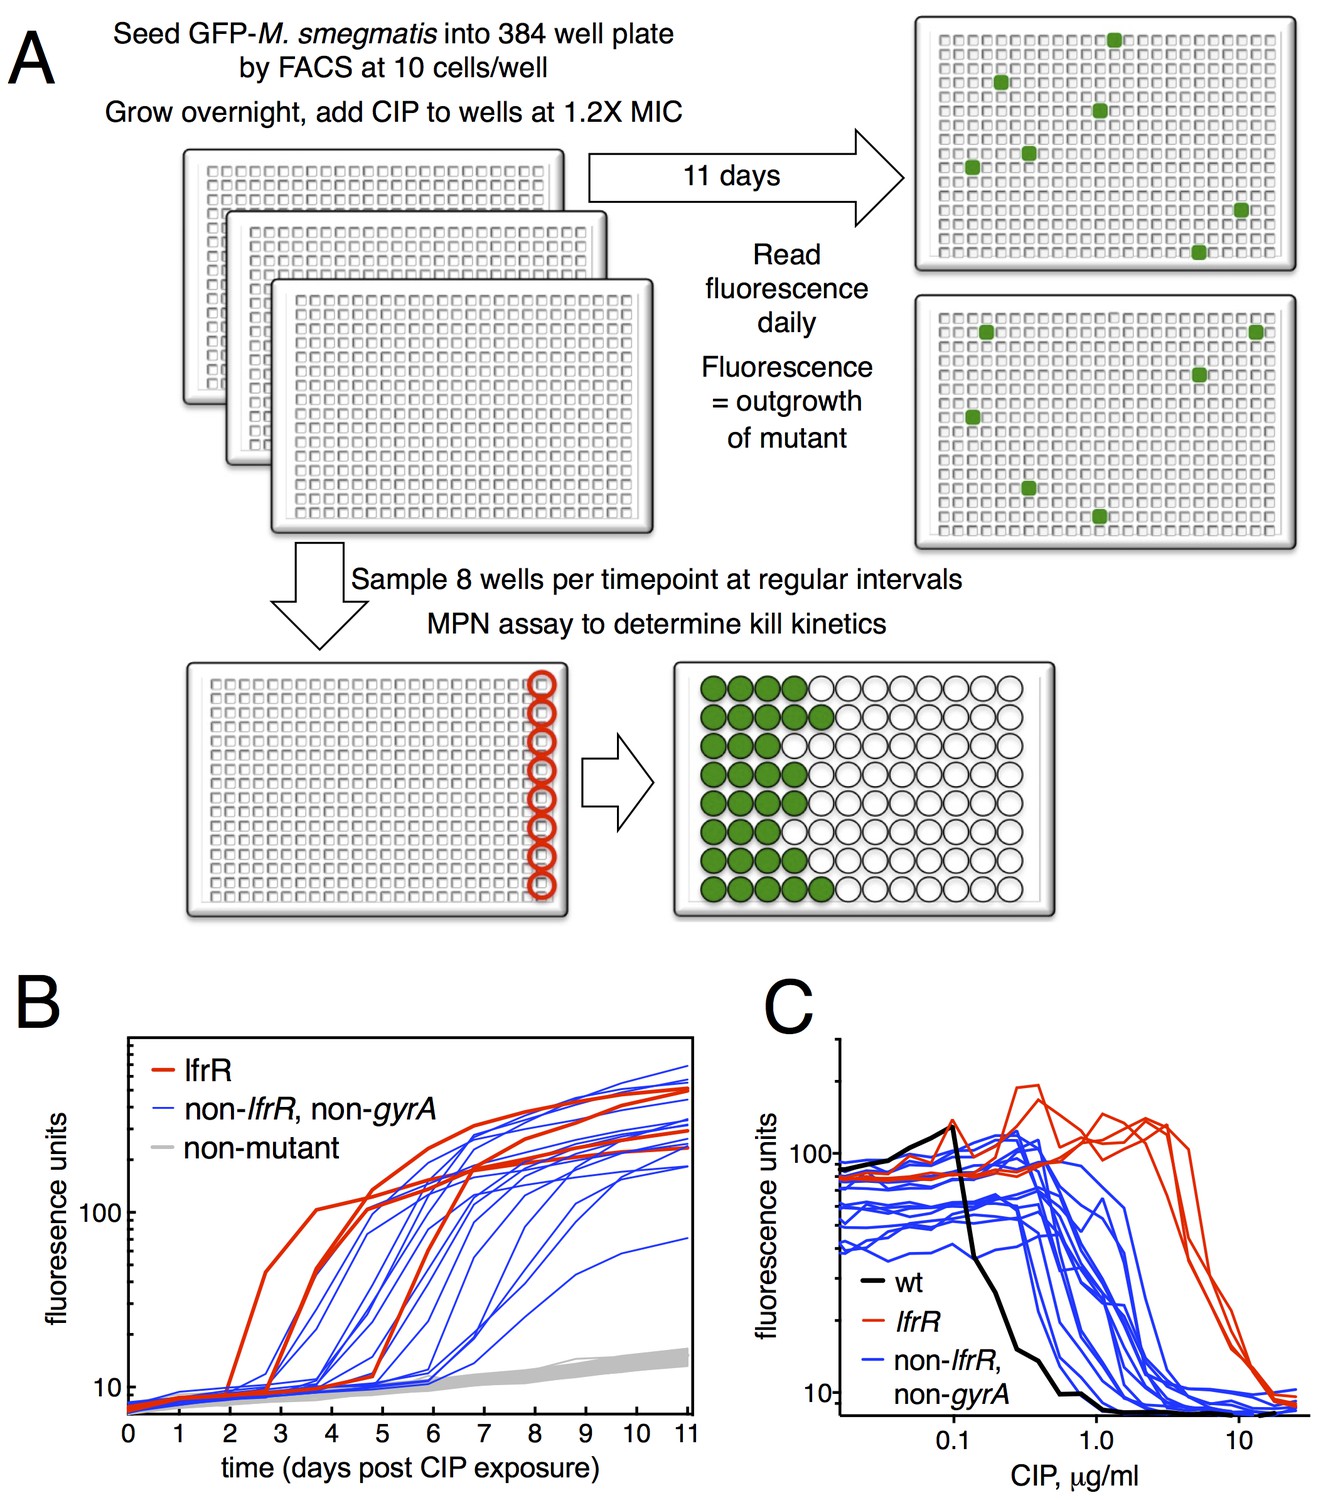
Selection of mutants at low ciprofloxacin concentration in 384 well plates.
(A) Schematic of the selection strategy. Starting at t = −16 hr, 10 M. smegmatis cells are introduced into wells of three 384 well microtiter plates containing 15 µl of growth medium and grown overnight at 37°C. At t = 0, 15 µl of medium containing CIP are added to yield a final CIP concentration of 0.3 µg/ml. Plates were sealed with foil and placed at 37°C. At t = 0 and at roughly daily intervals afterwards, plates 1 and 2 were read in a fluorimeter (485 ex., 538 em., 530 cutoff). Plate three was used to monitor bacterial survival; at regular intervals, the foil seal was cut and peeled to expose a subset of 8 wells that were harvested using a robotic pipettor and serially diluted (10-fold). Growth of serial dilutions was measured after one week and the bacterial population at the time of harvest was then calculated using most-probable number method. Frequency of resistant mutants is calculated by the equation:. (B) Emergence of mutants in 0.3 μg/ml CIP. Outgrowth was detected by fluorescence (y-axis). Each line represents a single well followed over time (x-axis). (C) CIP sensitivity of wild-type M. smegmatis (black) compared with lfrR mutants (red) and non-lfrR, non-gyrA mutants (blue). Each line represents a unique mutant and illustrates outgrowth as measured by fluorescence (y-axis) as a function of CIP concentration (x-axis). Data are the average of duplicate wells.
Figure 1—figure supplement 1
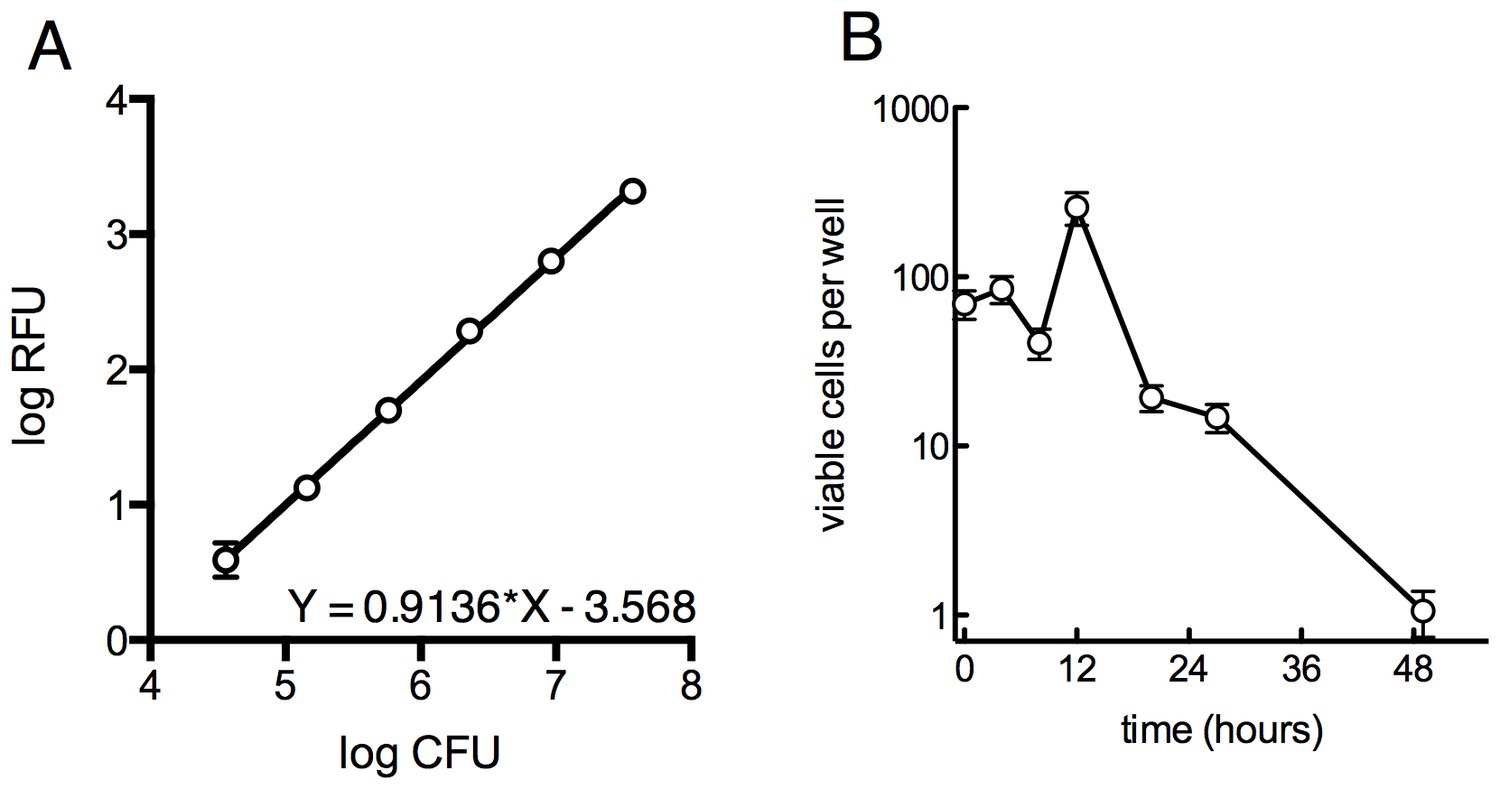
Survival of overall bacterial population during selection and determination of limit of detection for outgrowth of a well.
(A) Determination of the limit of detection by fluorescence. GFP-expressing M. smegmatis was serially diluted in 4-fold steps and 30 µl was distributed into a 384-well plate and read as above. Samples were plated on solid medium to determine the CFU per well. Approximately 105 cells are required for a signal 10 units above background. Average of 4 replicates ± SD. (B) Viable cells per well over the first 48 hr of treatment as measured by MPN, ±95% CI.
Figure 1—figure supplement 2
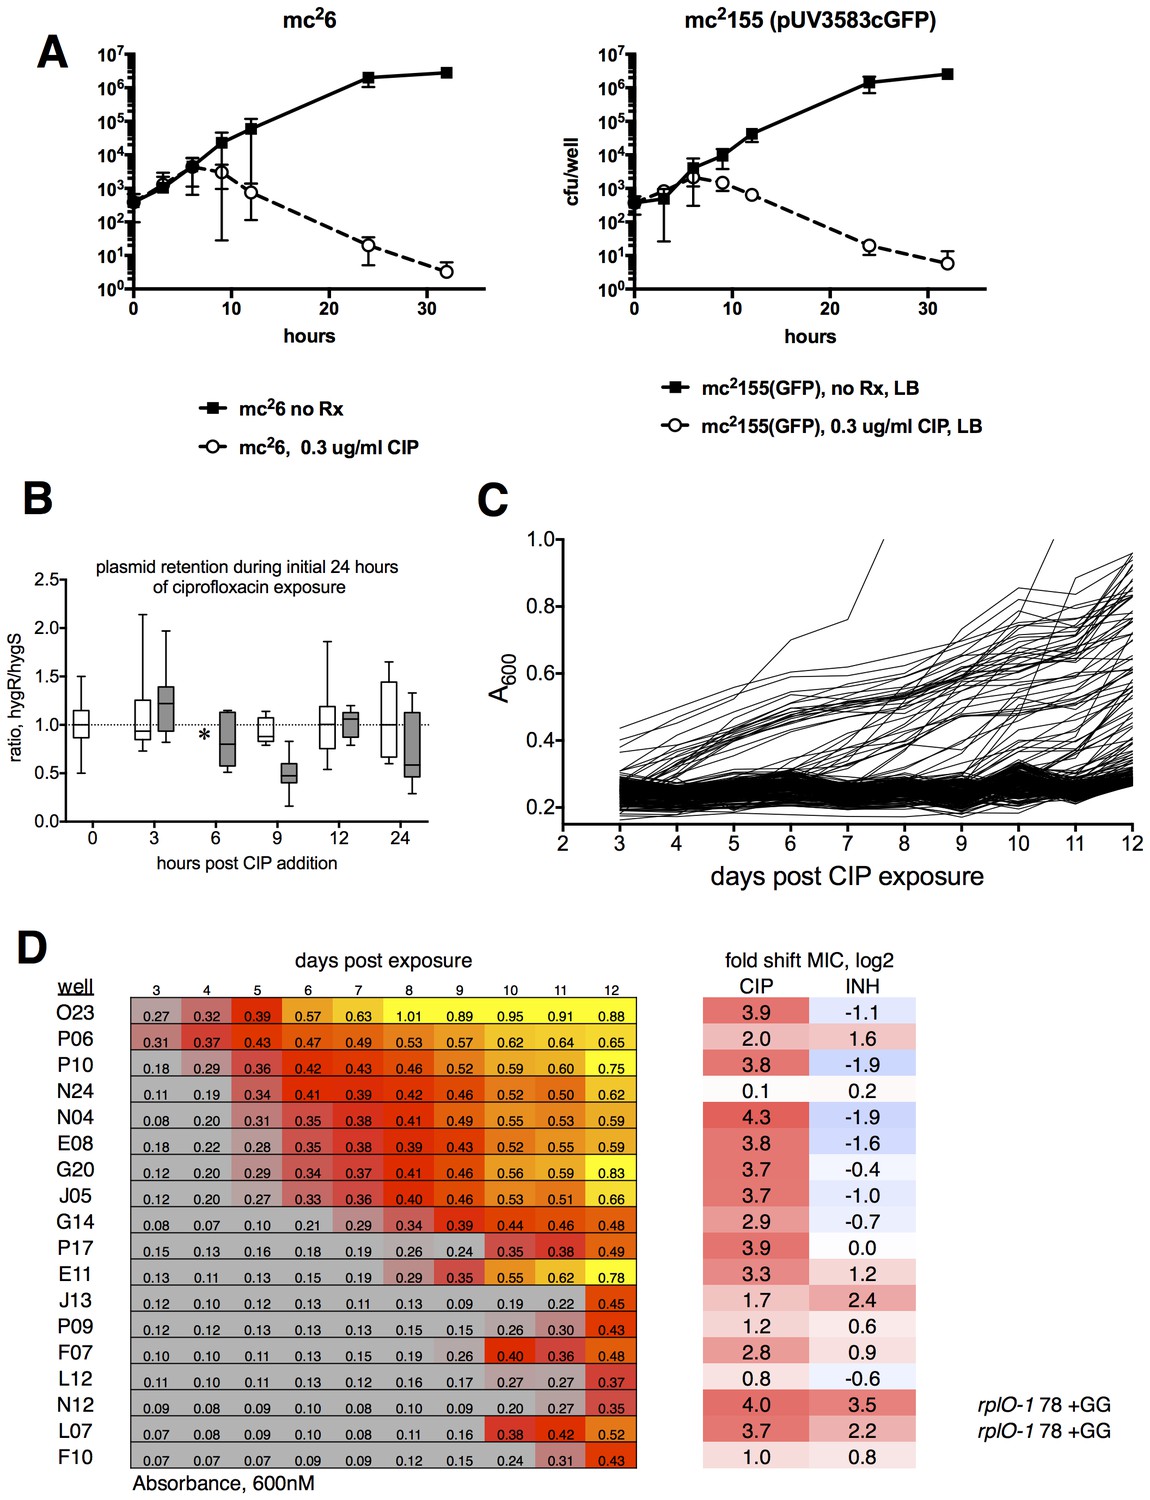
Ribosomal mutants can be isolated from a true wild-type M. smegmatis strain (mc26), demonstrating that the fluoroquinolone resistance of ribosomal mutants is not linked to the highly transformable mutant phenotype of mc2155.
(A) Kill kinetics of M. smegmatis mc26 (left) and mc2155(pUV3583cGFP) after exposure to 0.3 µg/ml ciprofloxacin in 384-well plates in the absence of hygromycin selection. Killing was assessed at each of the timepoints shown on the x-axis by harvesting eight wells, which were then serially diluted in four fold steps, after which 5 µl of each dilution were spotted onto rectangular petri dishes; colonies were counted after 2 and 3 days of growth. Error bars indicate the standard deviation. Outliers were not excluded from this analysis. The nearly identical kill kinetics of the two strains as assayed by cfu formation on non-selective growth medium confirms that the outgrowth of GFP positive wells when mc2155(pUV3583cGFP) is exposed to ciprofloxacin in the absence of hygromycin selection is unrelated to differential plasmid retention by this highly transformable strain. (B) Assessment of plasmid loss in mc2155(pUV3583cGFP) during the time period shown in A. Colonies were plated on both LB and LB containing 50 µg/ml hygromycin B. The box-and whisker plot shows the ratio of hyg-resistant to hyg-sensitive colonies at each time point for the eight wells harvested. Open boxes are the untreated mc2155(pUV3583cGFP), and shaded boxes are mc2155(pUV3583cGFP) exposed to 0.3 µg/ml ciprofloxacin at t = 0. Whiskers indicate 5–95% CI. Plasmid stability appears to be only slightly affected in the presence of ciprofloxacin, contradicting the possibility that plasmid loss played a role in the pattern of outgrowth observed in the original selection depicted in Figure 1. (C) Outgrowth of M. smegmatis mc26 ciprofloxacin-resistant mutants under section in 0.3 µg/ml ciprofloxacin over 12 days. A total of 60 wells showed detectable fluorescence by day 12, yielding a mutation frequency of 1.86 × 10⁻⁵ based on the peak population of approximately 4.4 × 10³ bacteria per well observed 6 hr after initial exposure to ciprofloxacin in panel A. (D) Outgrowth, phenotypic, and genotypic characterization of selected wells. Outgrowth during the assay is indicated by increasing A600nm and is heatmapped to highlight the timing and intensity of growth. After 12 days, representative wells were harvested and further expanded in 4 ml cultures with 0.3 µg/ml CIP prior to assaying for ciprofloxacin and INH sensitivity. PCR sequencing of mutants N12 and L07 revealed identical GG insertions in rplO, resulting in a frameshift and premature truncation of the protein. The lfrR open reading frame and gyrA QRDR were unchanged in these mutants.
Figure 2 with 1 supplement
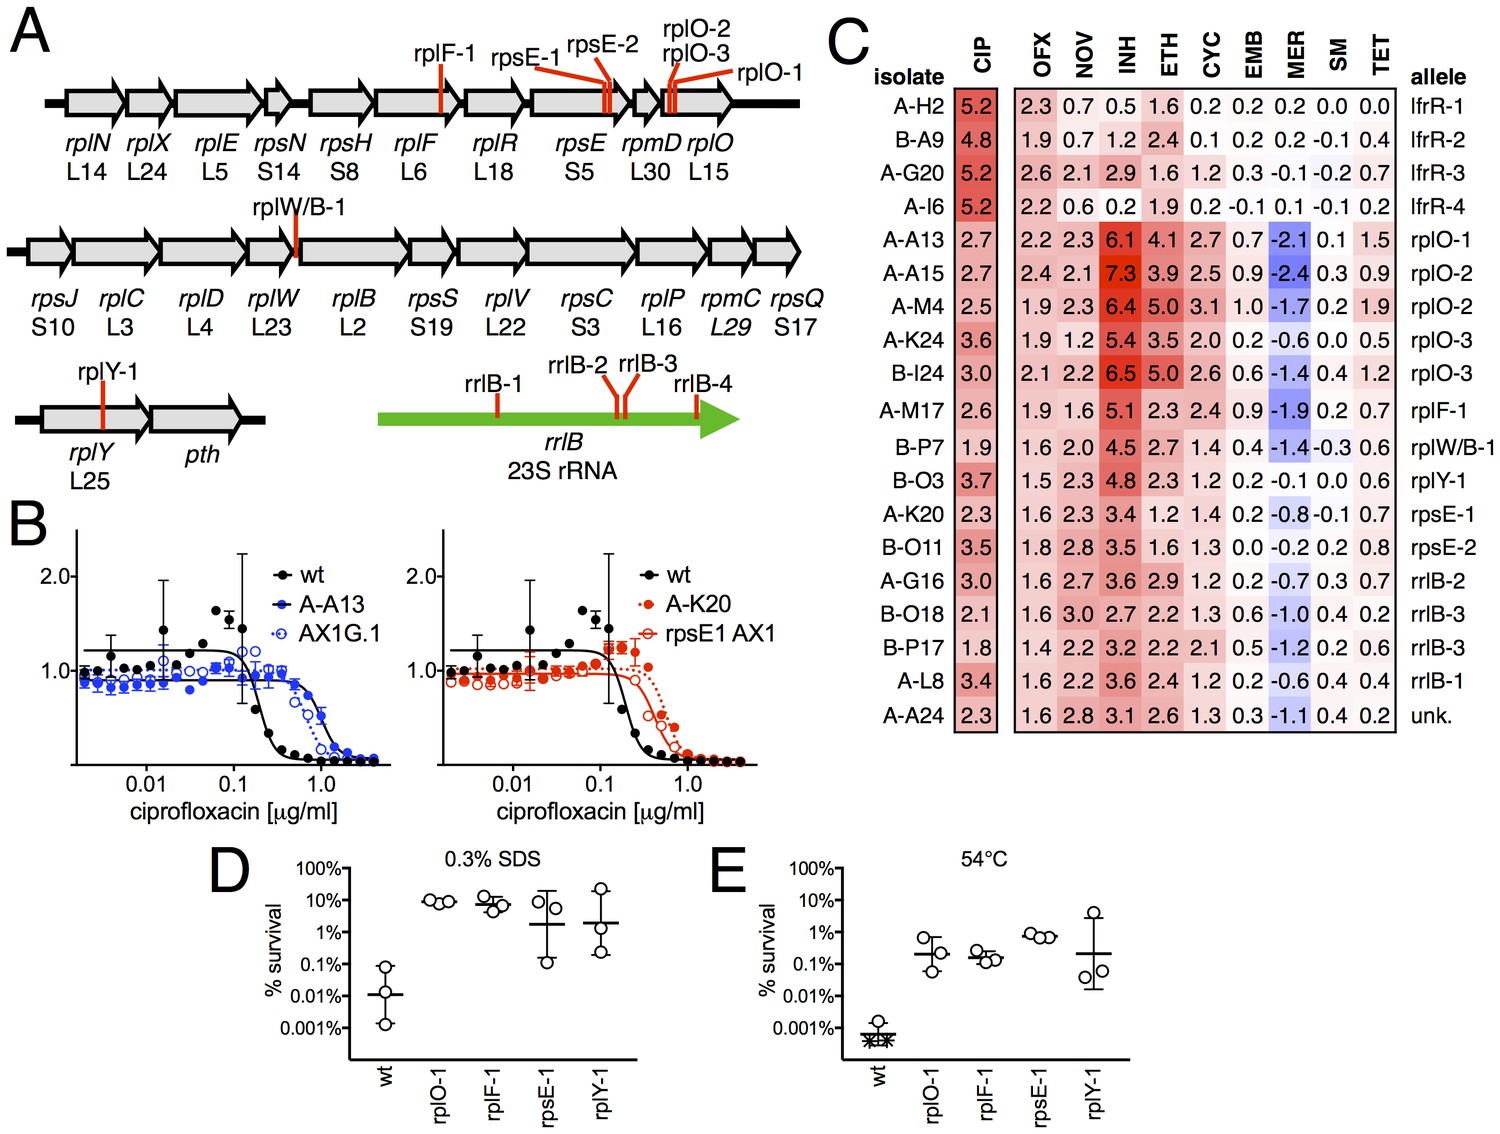
Ribosomal mutants are resistant to multiple antibiotics and environmental stressors.
(A) Schematic of the four regions of the M. smegmatis chromosome in which mutations in ribosomal components were found. Detailed descriptions of the mutations are provided in Table 1. (B) Introduction of the rplO-1 or rpsE-1 allele via homologous recombination (yielding AX1G.1 and rpsE1 AX1, respectively) confirms these mutations confer ciprofloxacin resistance. All strains carry pUV3583c and express GFP. Fluorescence of wild-type, mutant, and allelic-exchange derived strains was measured after 2 days of antibiotic exposure. Y axis is GFP signal normalized to untreated controls, x-axis = 1.41 fold (√2) dilution series of antibiotic, data are average of duplicate wells. (C) Numbers and shading show the IC50 shift (log2 transformed) of 19 mutants to a panel of antibiotics. Red = resistance, blue = sensitivity. OFX = ofloxacin, NOV = novobiocin, INH = isoniazid, ETH = ethionamide, CYC = cycloserine, EMB = ethambutol, MER = meropenem, SM = streptomycin, TET = tetracycline. (D) Bacteria were exposed to 0.3% SDS for 1 hr, and survival was measured by plating for colony forming units.. Dots represent individual biological replicates, each assayed in duplicate. * indicates < level of detection (approximately 0.0005%). For all mutants tested, <0.05 relative to wt (student’s T-test, survival data log transformed). Lines represent mean ± SE. For rpsE-1, p=0.054 relative to wt (student’s T-test, survival data log transformed), all others p<0.05. (E) Bacteria were incubated at 54°C for 2 hr. Data represented and analyzed as in (C).
Figure 2—figure supplement 1
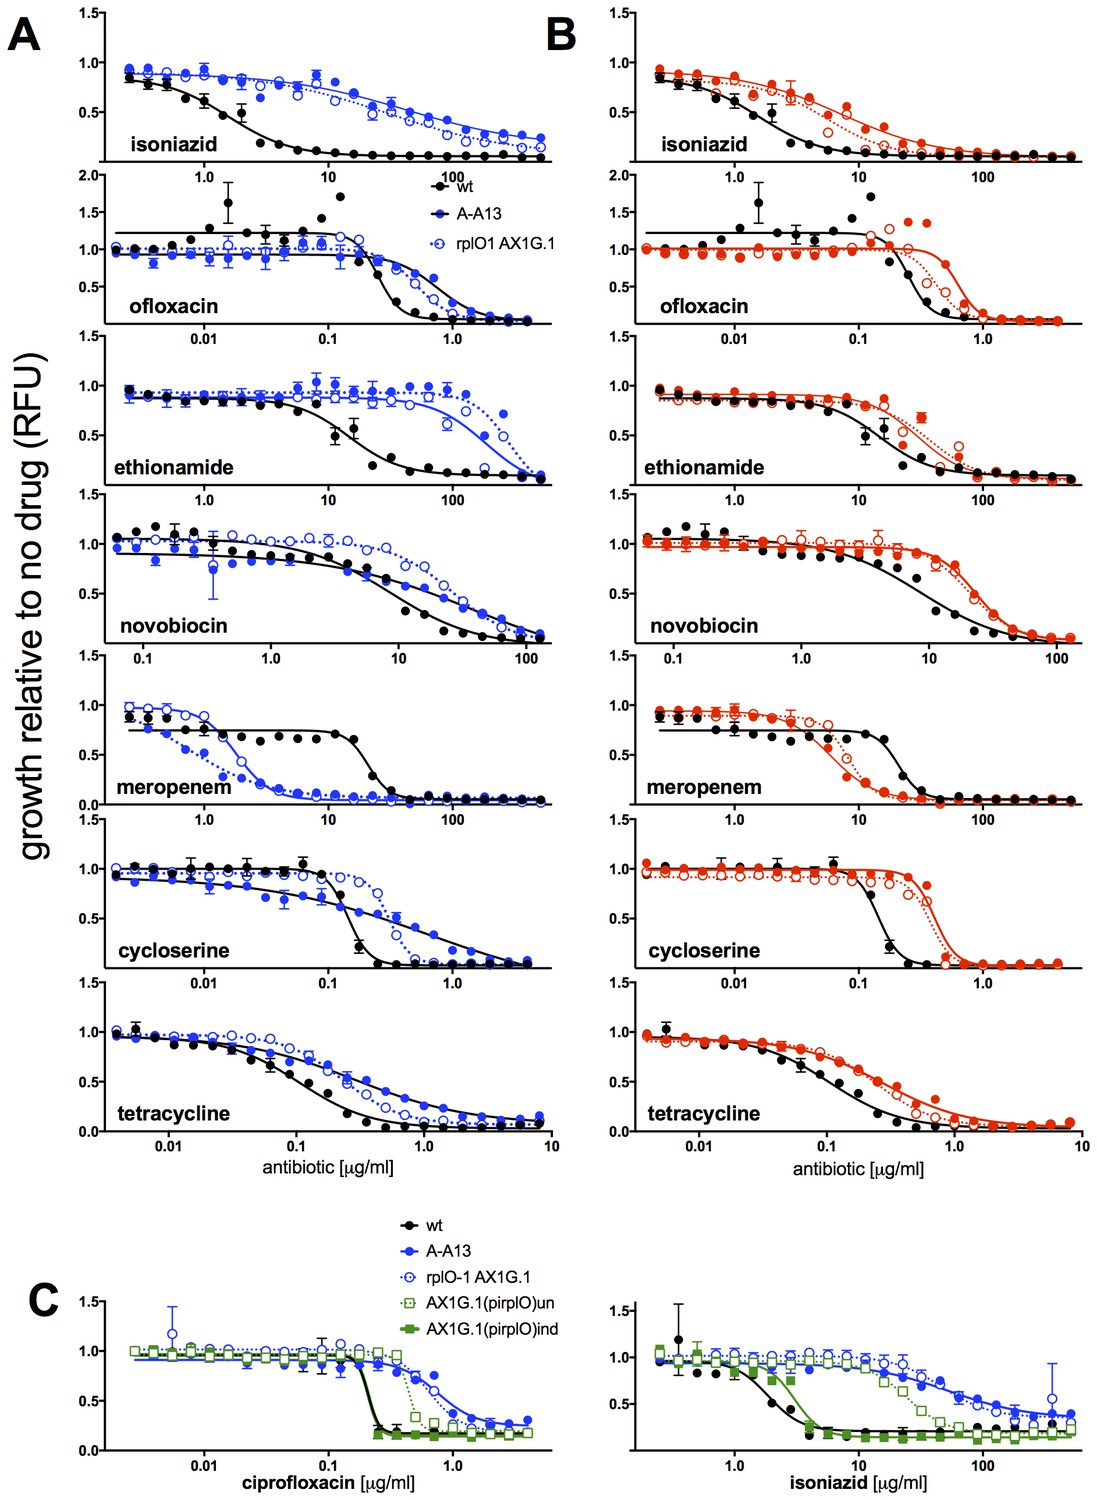
MICs of rplO-1 and rpsE-1 allelic exchange mutants.
All strains carry pUV3583c and express GFP. Assays were carried out in 384 well plates. In (A) and (B), fluorescence of wild-type, mutant, and allelic-exchange derived strains was measured after 2 days of antibiotic exposure. Y axis is GFP signal normalized to untreated controls. In (C), optical density (A600 nm) is used as the readout, and is also normalized to untreated controls. In (C), the allelic exchange mutant rplO-1 AX1G.1 was transformed with a plasmid carrying a tetracycline-inducible wt rplO allele, and the behavior of this strain was measured both uninduced (open green boxes) and induced with 50 ng/mL anhydrotetracycline (solid green boxes).
Figure 3 with 1 supplement
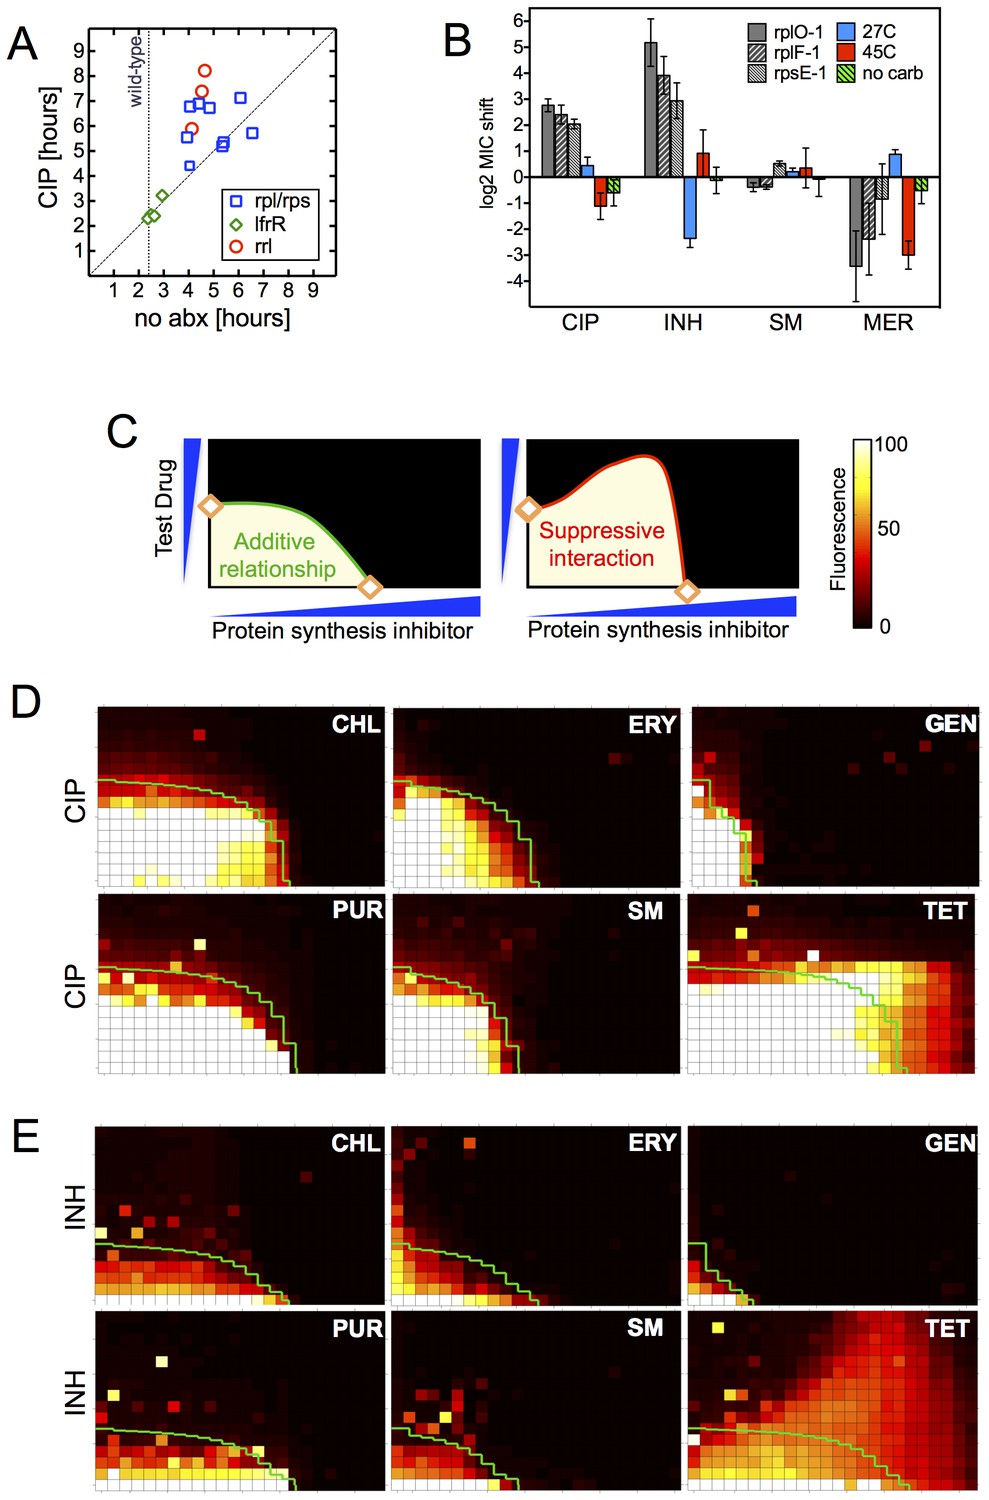
Resistance is not a simple consequence of slowed growth or general inhibition of translation.
(A) Doubling times in antibiotic-free medium (x-axis) or 0.3 μg/ml CIP (y-axis), each dot represents an individual mutant. (B). Shifts in antibiotic sensitivity upon altering growth rate of wild type bacteria by temperature or carbon availability (dextrose/glucose-free medium). Error bars = 95% confidence intervals. See Figure 3—figure supplement 1C for growth rates. (C) Checkerboard assay description: 384-well plates contain increasing concentrations of protein synthesis inhibitors along the x-axis and a second test antibiotic on the y-axis. Growth of M. smegmatis mc2155 (pUV3583cGFP) is measured by fluorescence. If the antibiotics are non-interacting then growth would follow the additive isobole in green (top box, see Supplementary Materials and methods). Antagonistic interactions extend growth beyond the isobole (bottom box). (D) Interaction of protein synthesis inhibitors chloramphenicol (CHL), erythromycin (ERY), gentamycin (GEN), puromycin (PUR) and streptomycin (SM) with CIP. (E) Same as (D) using INH. Tetracycline is unique in demonstrating antagonistic interactions with CIP and INH, phenocopying the ribosomal mutations.
Figure 3—figure supplement 1
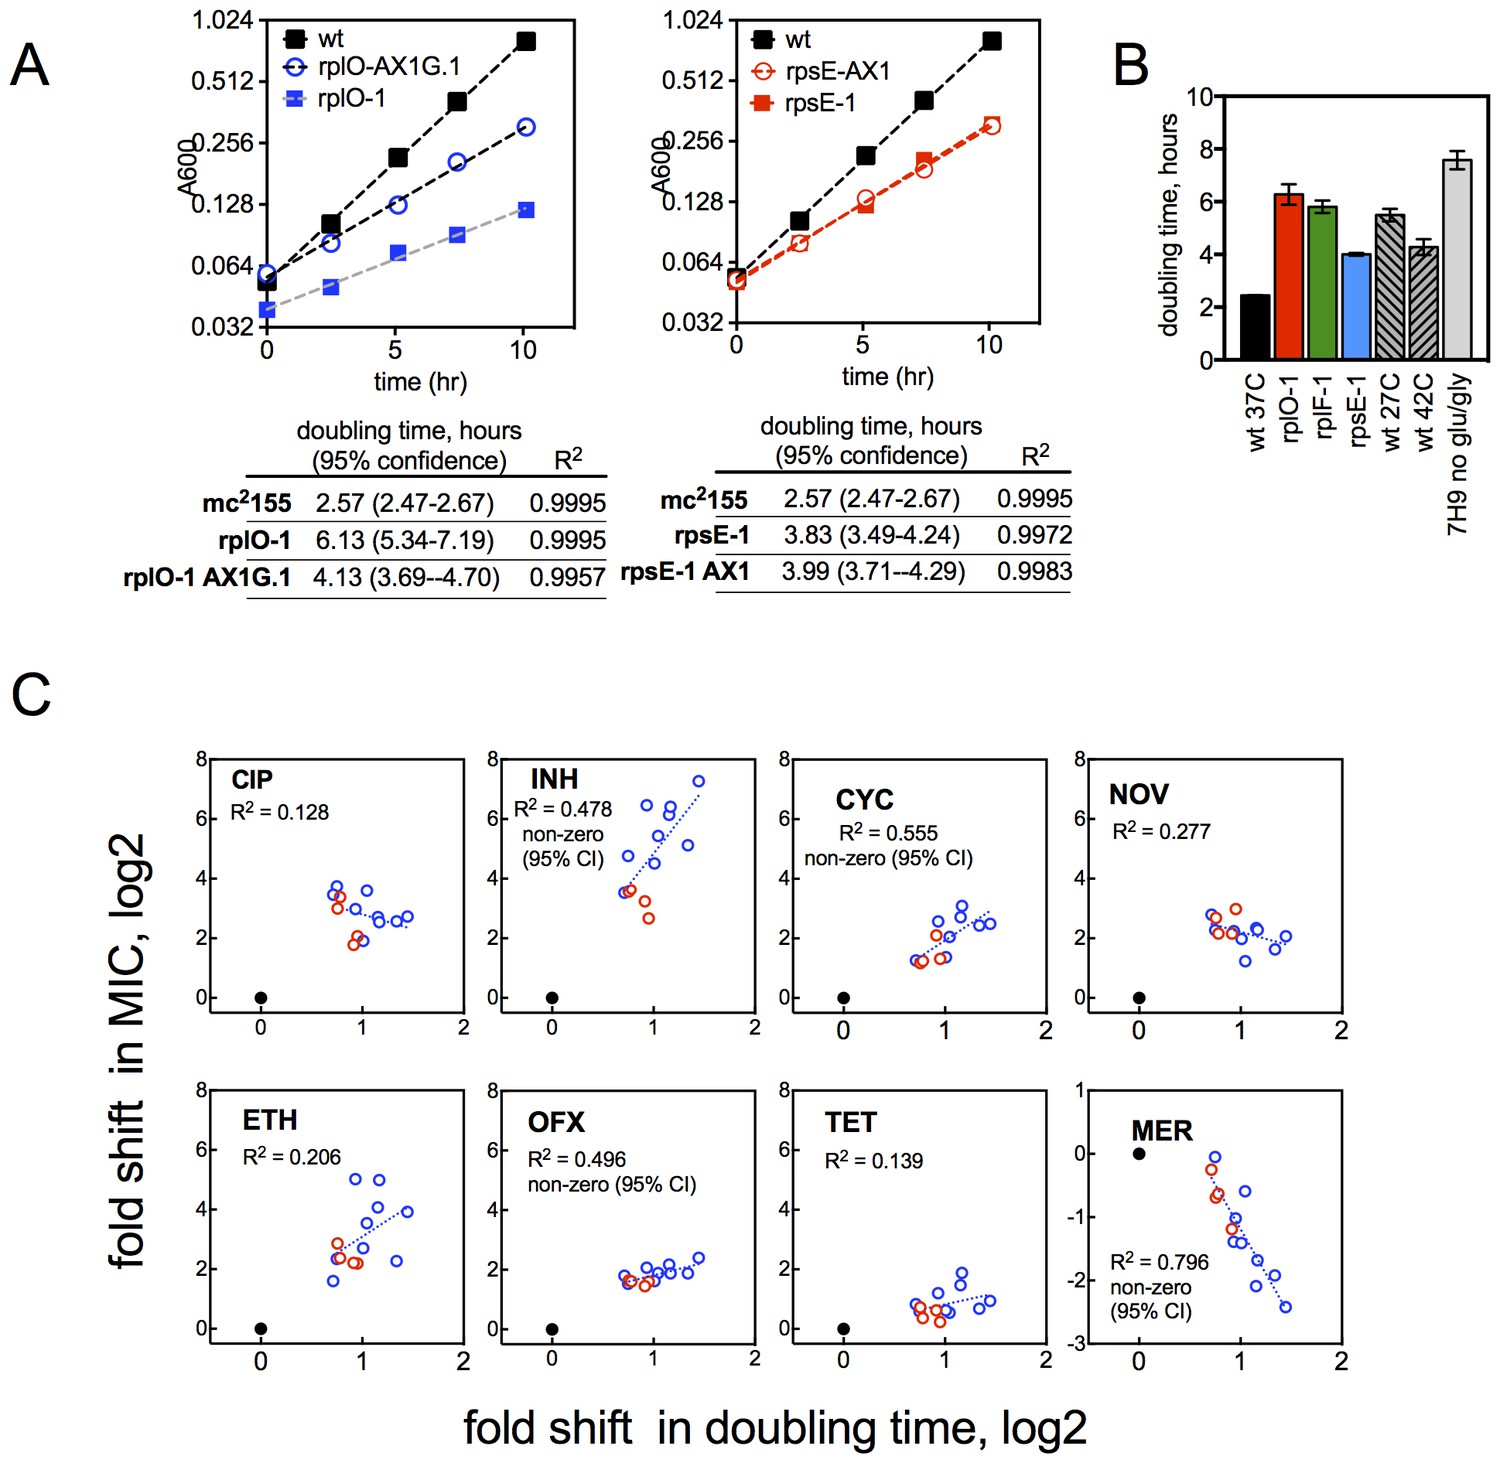
Growth rates of mutants and their relationship with resistance levels.
(A) Growth rates of allelic exchange mutants. All strains were grown in 30 ml volumes in foil-sealed Erlenmeyer flasks at 37°C with shaking. At regular intervals, cultures were sampled and density measured based on absorbance at 600 nM. Doubling times were calculated by fitting a line to log2 transformed absorbance values using GraphPad Prism. (B) Doubling times under conditions tested in Figure 3C, with mutants shown for comparison. Mean ±95% CI. (C) Changes in MIC plotted against the doubling time of each mutant for CIP and INH. Dashed line = linear regreasion of data; lfrR mutants, where known to be due to efflux, and the parental strain were excluded from the regression analysis. Doubling time (x-axis) was measured as described in Methods and y-axis is the fold shift in MIC (measured as IC50, determined as described in Methods). CIP = ciprofloxacin, INH = isoniazid, OFX = ofloxacin, SM = streptomycin, NOV= novobiocin, CYC = cycloserine, ETH = ethionamide, MER = meropenem, TET = tetracycline, EMB = ethambutol. Dots represent individual mutants. Black dot is parent, rps/rpl mutants are blue and rrlB mutants are red. Panels note whether the 95% confidence interval of the slope of the fitted line does not span zero, supporting a correlation.
Figure 4 with 3 supplements
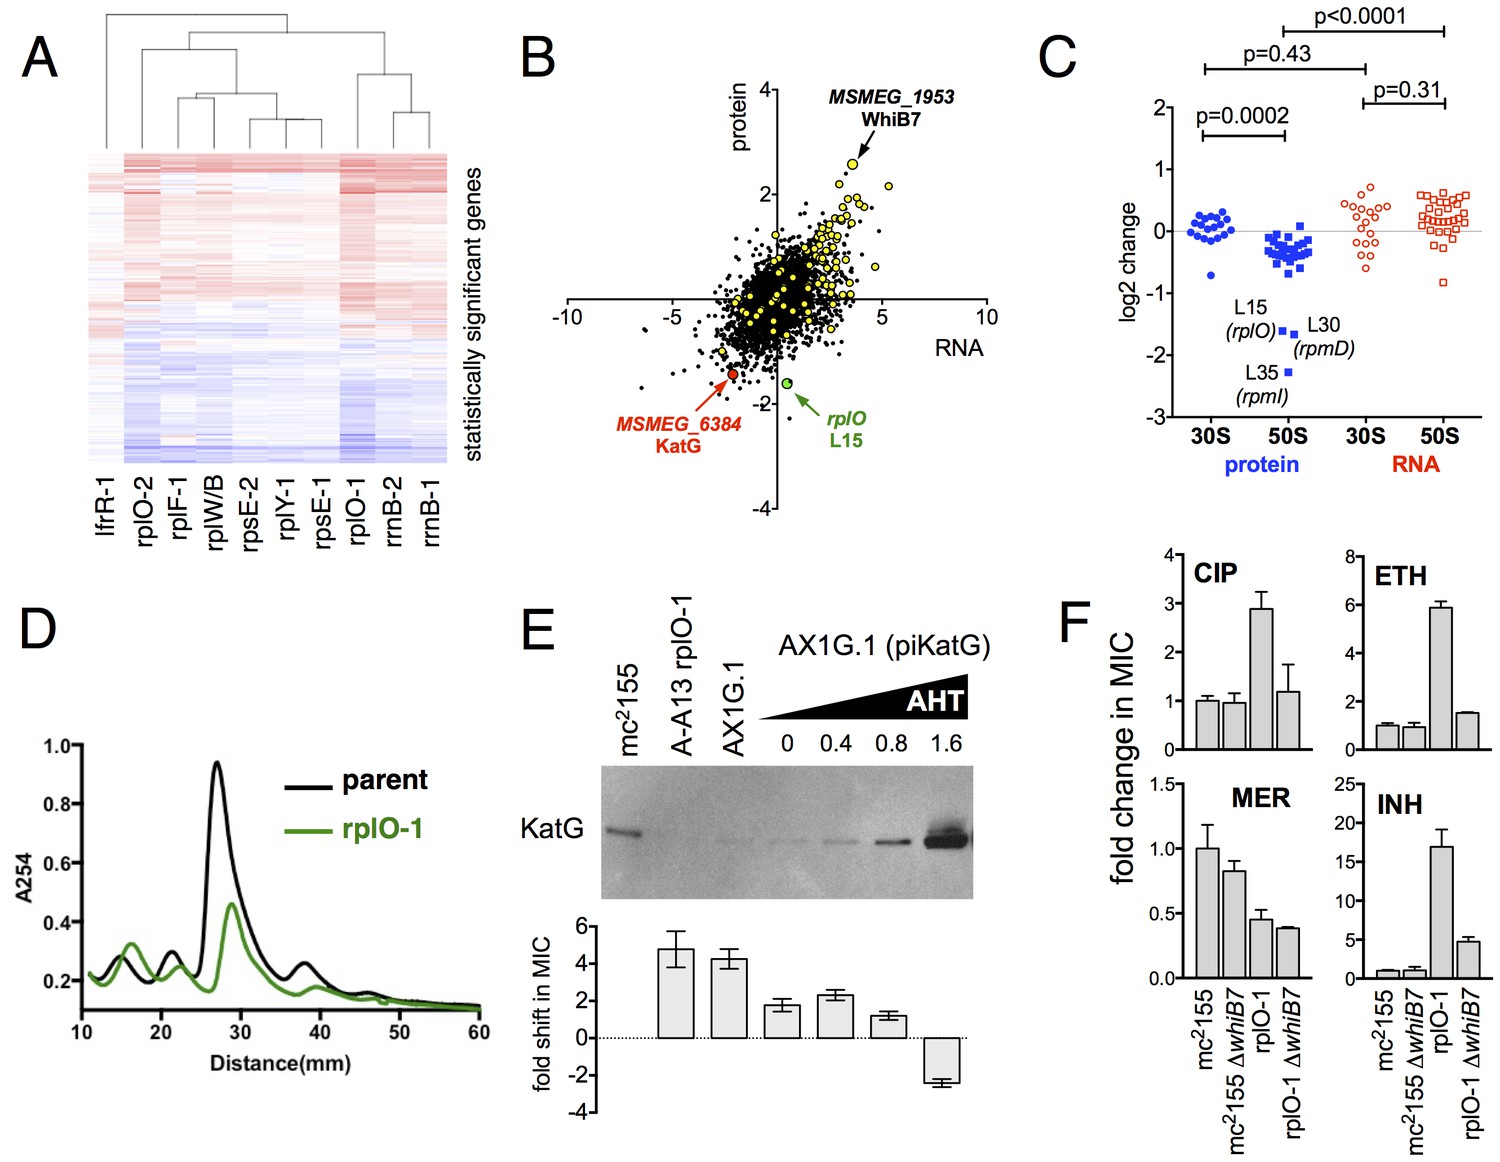
Alterations of the proteome and transcriptome implicate katG and the whiB7 regulon in the altered antibiotic sensitivity of the ribosomal mutants; restoration of wild-type KatG levels restores INH sensitivity.
(A) Hierarchical clustering of transcriptional alterations in representative ribosomal mutants, with lfrR-1 mutant included for comparison. For clustering, any genes whose expression is altered at least twofold and has an adjusted p value of <0.05 in any mutant is included. Source data are available as a Supplement. (B) Correlation between changes in RNA levels (x-axis) and protein levels (y-axis) in the rplO-1 mutant relative to wild type, plotted as log2 of fold change. Changes in both RNA and protein abundance are the averages of two replicate experiments. MSMEG_6384 (KatG) is highlighted in red and RplO (L15) is highlighted in green. Genes upregulated in MSMEG_6129 mutant (Bowman and Ghosh, 2014) (DOI: 10.1111/mmi.12448, supplementary file mmi12448-sup-0002-ts2.xls) are highlighted in yellow. See (C) Alterations in abundance of ribosomal proteins in the rplO-1 mutant relative to is parent strain as detected by iTRAQ (blue), and the corresponding changes in transcript abundance as determined by RNAseq (red). Student’s T-test used for comparing datasets. (D) Comparison of ribosomal preparations separated on 10–40% sucrose density gradient, revealing impaired ribosome assembly in the rplO-1 mutant (green line). (E) Western blot of KatG protein levels in rplO-1 (A–A13), rplO-1 allelic exchange mutant AX1G.1, and rplO-1 AX1G.1 expressing KatG from an AHT-inducible plasmid at various AHT concentrations, shown above a plot of INH MIC under those conditions. As the expression of KatG is restored to wild-type levels, INH susceptibility is also restored. (F) Deletion of whiB7 restores wild-type sensitivity to CIP and ETH but not INH or MER in an rplO-1 background. MICs (IC50) were calculated in PRISM using the ECAnything function to fit outgrowth across a 2-fold dilution series of each drug, and bars show mean ± SD of 2–4 biological replicates.
-
Figure 4—source data 1
Input for Figure 4A: DESeq2 output for all genes with padj <0.05 and twofold change in expression in any strain analyzed.
- https://doi.org/10.7554/eLife.20420.012
Figure 4—figure supplement 1
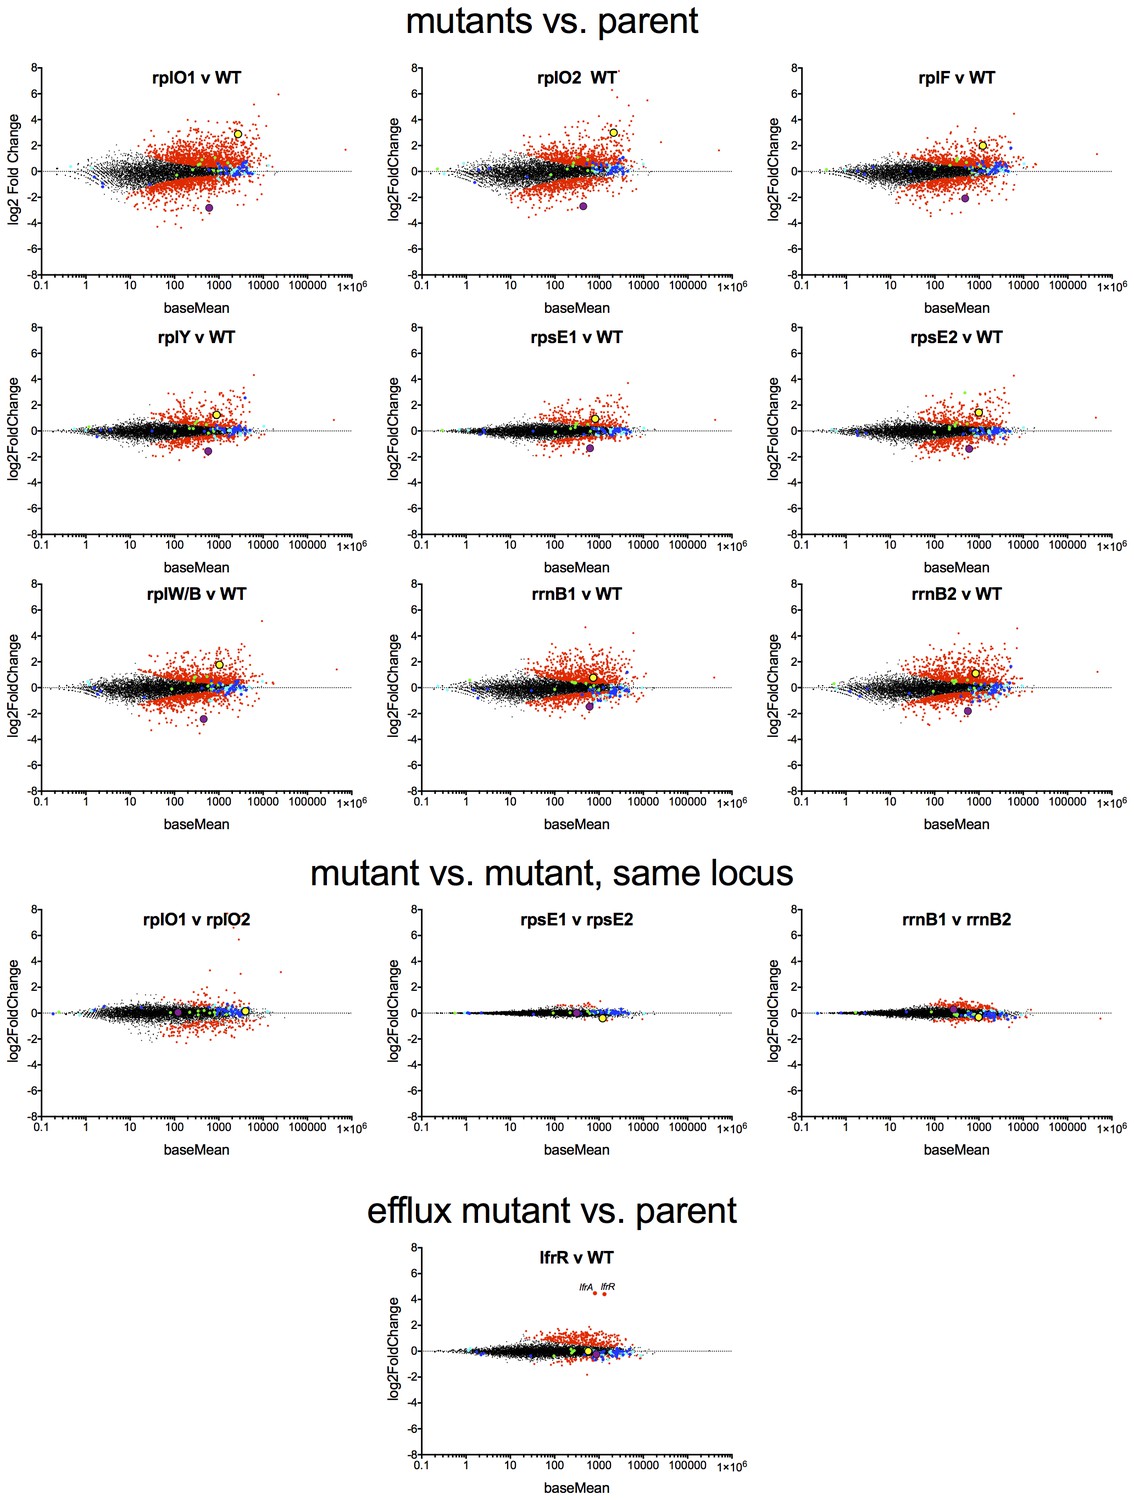
MA plots of the DESeq2 output relative to the parent for nine ribosomal mutants and lfrR mutant, highlighting whiB7 (yellow dot) and katG (purple dots).
Components of the large ribosome are blue and small ribosome are green.
Figure 4—figure supplement 2
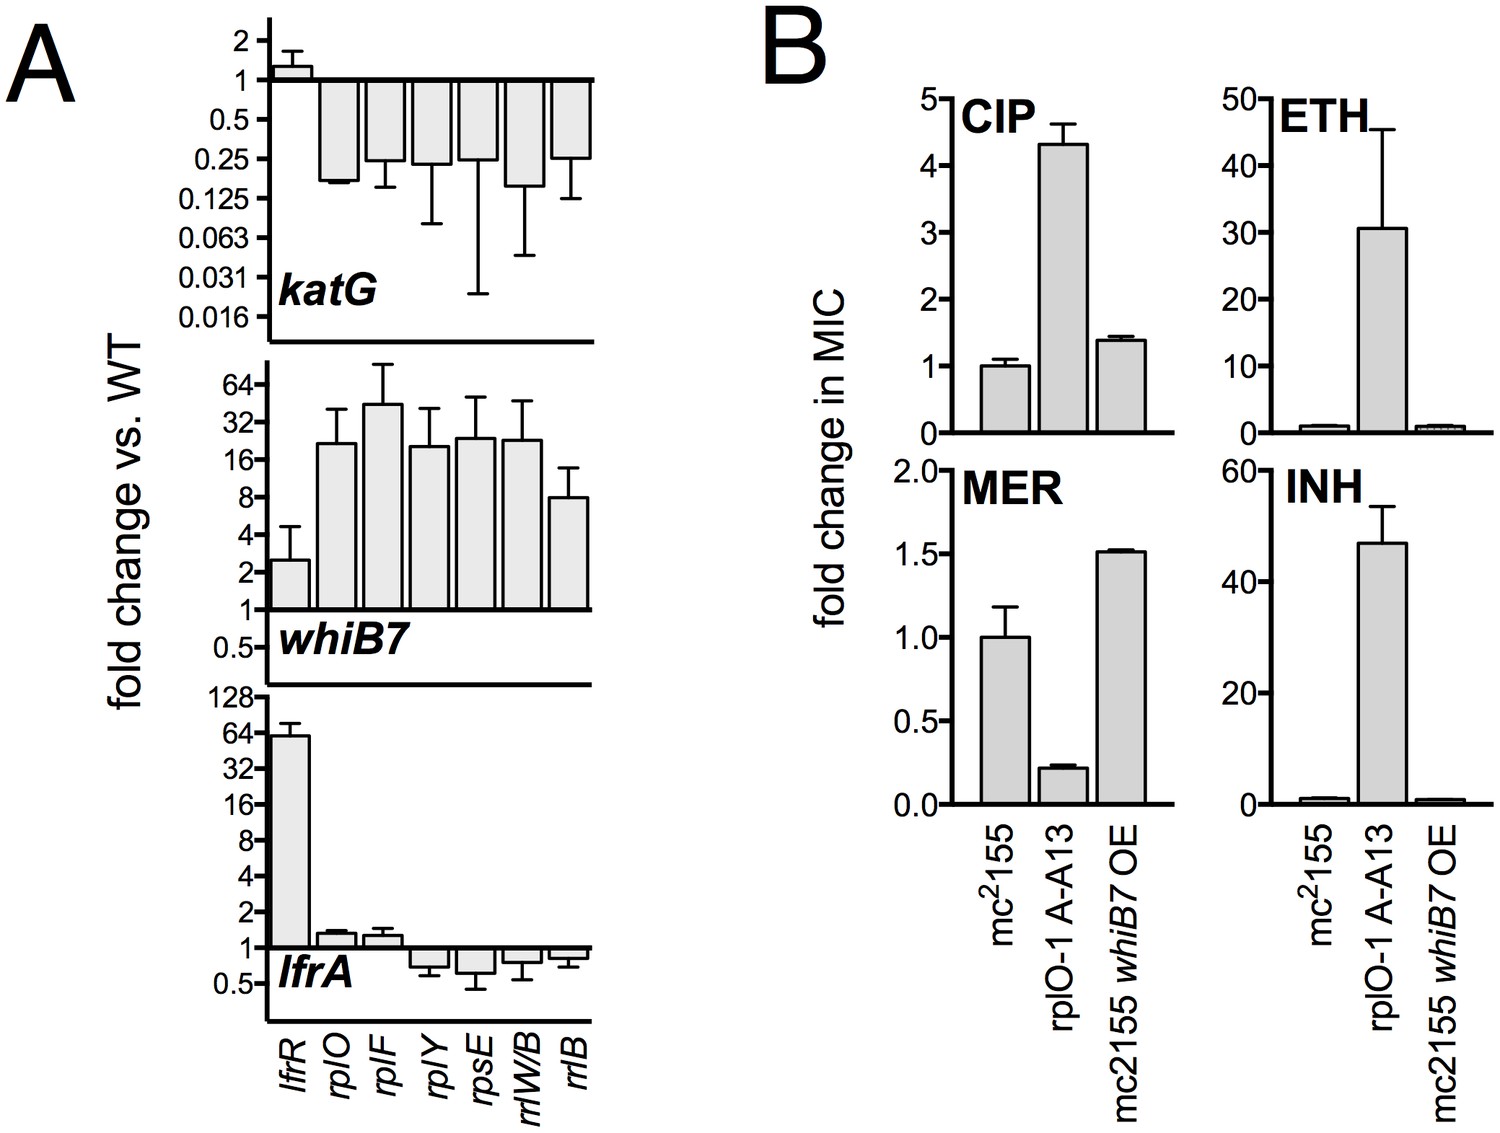
Confirmation of transcriptional changes by PCR and impact of WhiB7 overexpression on antibiotic susceptibility.
(A) qRT-PCR confirmation of relevant transcriptional changes across a panel of mutant representing each affected ribosomal locus. Expression levels were normalized to sigA. Mean values of two experiments, each run in duplicate. Error bars = SE. (B) Constitutive expression of WhiB7 from the strong Psmyc promoter on a episomal plasmid does not reproduce the resistance profile of the rplO-1 mutant. Data are the average of 2 biological replicates ± SD.
Figure 4—figure supplement 3
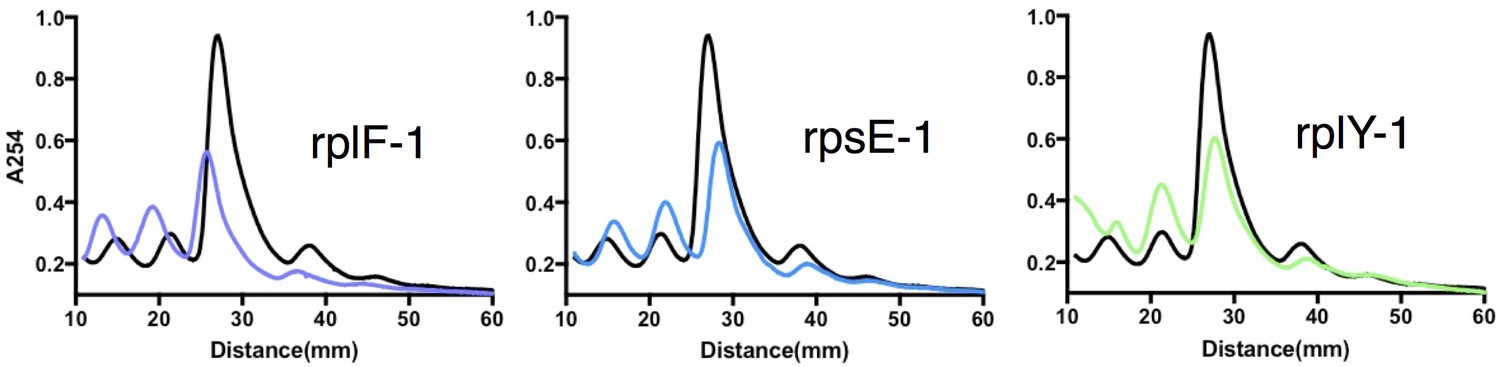
Sucrose density gradient profiles of ribosomes isolated from rplF-1, rpsE-1 and rplY-1 mutants, methods as described in Figure 4D.
https://doi.org/10.7554/eLife.20420.015
Figure 5

An evolutionary cycle for the acquisition of high-level resistant mutants without fitness cost.
(A) Ribosomal mutations arise during simultaneous selection in two antibiotics. Frequency (per input cell) of resistant mutants from three replicate cultures (individual dots) in CIP (0.3 µg/ml, C), INH (25 µg/ml, I) or CIP and INH in combination (0.3 µg/ml / 25 µg/ml, C+I). C+I predicted = the product of the measured frequencies for each drug individually. (B) Prolonged survival of rplO-1 (red), or rplF-1 (green) relative to wild-type (black) bacteria exposed to 3.5 µg/ml CIP in 384 well plates. (C) Increased frequency of emergence of CIP mutants resistant to >3.5 µg/ml CIP derived from each of the genetic backgrounds in (B), ** = p<0.05, student’s T-test. (D) The growth defect of an rplO-1 mutant (red bar) is reversed after serial passage of 3 independent cultures (hatched bars) to levels similar to wild-type cells (gray bar) (E) Restoration of wild-type CIP and INH sensitivities after serial passage (shading as in D). Dots represent strains shown in (D), with the mutational trajectory indicated by arrows. The x and y axes show the level of susceptibility to CIP and INH. (F) Deletion in rplO (black) leads to a shifted rplO-1 reading frame (red). Compensatory insertions (green) or deletions (black) in rplO-1r1-3 restore the original reading frame (blue). (G) Growth defect of the rplO-1 mutation (red bar) is maintained after acquisition of a gyrA mutation (rplO-1-gyrA, yellow and red hatched bar). Continued passage of rplO-1-gyrA in CIP restores wild-type growth rates (solid yellow bar) (H) Loss of INH resistance after continued selection in CIP Dots represent strains shown in (G), with the mutational trajectory again indicated by arrows. The x and y axes show the level of susceptibility to CIP and INH. (shading as in G).
Tables
Table 1
Genotypes of mutants from primary screen. Polymorphisms relative to M. smegmatis mc2155. Coordinates based on position in open reading frame except for B-P7, where genome position is used.
Mutant | Allele | Gene(s) Mutated | Consequence |
|---|---|---|---|
A-A13 | rplO-1 | rplO 82ΔT (L15) | L15 frameshift @ AA 28 of 147 |
A-A15 | rplO-2 | rplO 77ΔA (L15) MSMEG_3872 398ΔTC | L15 frameshift @ AA 26 of 147 Precorrin-8X methylmutase frameshift AA 133 0f 208 |
A-G16 | rrlB-2 | rrlB G2296T | non-coding, 23S rRNA |
A-G20 | rrlB-4/lfrR-3 | rrlB C904A lfrR T452C | non-coding, 23S rRNA LfrR F151S |
A-H2 | lfrR-1 | lfrR C31A | LfrR R11S |
A-I6 | lfrR-4 | lfrR 63+C | LfrR frameshift @ AA 22 of 189 |
A-K20 | rpsE-1 | rpsE 599-606ΔAGAGTGAA | S6 frameshift @ AA 200 OF 214 |
A-K24 | rplO-3 | rplO 74-77ΔGTGA | L15 frameshift @ AA 26 of 147 |
A-L8 | rrlB-1 | rrlB G2199T | non-coding, 23S rRNA |
A-M4 | rplO-2 | rplO 77ΔA | L15 frameshift @ AA 26 of 147 |
A-M17 | rplF-1 | rplF 481-482ΔAA | L6 frameshift @ AA 161 of 179 |
B-A9 | lfrR-2 | lfrR C98A | LfrR A33E |
B-I24 | rplO-3 | rplO 74-77ΔGTGA | L15 frameshift @ AA 26 of 147 |
B-O3 | rplY-1 | rplY 45ΔG | L25 frameshift @ AA 16 of 215 |
B-O11 | rpsE-2 | rpsE 630+GC | S6 frameshift @ AA 210 OF 214 |
B-O18 | rrlB-3 | rrlB G2891C | non-coding, 23S rRNA |
B-P7 | rplW/B-1 | 1539202ΔGCAGAGA* | intergenic |
B-P17 | rrlB-3 | rrlB G2891C | non-coding, 23S rRNA |
Table 2
Evolved strains with additional mutations.
Name | Parent strain | Phenotype | Second mutation | Consequence |
|---|---|---|---|---|
rplO-lfrR-1 | rplO-1 (A-A13) | CIP MIC > 3.5 µg/ml | lfrR 427+C | LfrR frameshift |
rplO-lfrR-2 | rplO-1 (A-A13) | CIP MIC > 3.5 µg/ml | lfrR 440+C | LfrR frameshift |
rplO-lfrR-3 | rplO-1 (A-A13) | CIP MIC > 3.5 µg/ml | lfrR T128G | LfrR V43G |
rplO-lfrR-4 | rplO-1 (A-A13) | CIP MIC > 3.5 µg/ml | lfrR 172+ACC | LfrR 58+H |
rplO-lfrR-5 | rplO-1 (A-A13) | CIP MIC > 3.5 µg/ml | lfrR 440+C | LfrR frameshift |
rplO-lfrR-6 | rplO-1 (A-A13) | CIP MIC > 3.5 µg/ml | lfrR 118+G | LfrR frameshift |
rplO-gyrA-1 | rplO-1 (A-A13) | CIP MIC > 3.5 µg/ml | gyrA G265C | GyrA G89A |
rplO-1r1 | rplO-1 (A-A13) | wt growth rate | rplO 89+G | L16 SK28-29RR |
rplO-1r2 | rplO-1 (A-A13) | wt growth rate | rplO 61-96Δ* | L16 ΔRVGRGEGRRGKT |
rplO-1r3 | rplO-1 (A-A13) | wt growth rate | rplO 80+G | L16 S28P |
rplO-gyrA-1r6 | rplO-gyrA-1 | wt growth rate | rplO 89+G | L16 SK28-29RR |
-
*=CGCGTCGGTCGTGGTGAGGGCCGAAGGGCAAGACC.
Table 3
Genotypes of individual colonies from freezer stock derived from well A-G20. Colony 15 failed to grow.
Colony | rrlB genotype | lfrR genotype |
|---|---|---|
A-G20-1 | rrlB C904A | wt |
A-G20-2 | rrlB C904A | wt |
A-G20-3 | rrlB C904A | wt |
A-G20-4 | rrlB C904A | wt |
A-G20-5 | rrlB C904A | wt |
A-G20-6 | rrlB C904A | wt |
A-G20-7 | rrlB C904A | wt |
A-G20-8 | rrlB C904A | wt |
A-G20-9 | rrlB C904A | wt |
A-G20-10 | rrlB C904A | wt |
A-G20-11 | rrlB C904A | wt |
A-G20-12 | rrlB C904A | wt |
A-G20-13 | rrlB C904A | wt |
A-G20-14 | rrlB C904A | lfrR T452C |
A-G20-15 | ND | ND |
A-G20-16 | rrlB C904A | wt |
A-G20-17 | rrlB C904A | wt |
A-G20-18 | rrlB C904A | lfrR T452C |
A-G20-19 | rrlB C904A | wt |
A-G20-20 | rrlB C904A | wt |
A-G20-21 | rrlB C904A | wt |
A-G20-22 | rrlB C904A | lfrR 63+C |
A-G20-23 | rrlB C904A | wt |
A-G20-24 | rrlB C904A | lfrR T452C |
Additional files
-
Supplementary file 1
Primers and Plasmids.
- https://doi.org/10.7554/eLife.20420.019
-
Supplementary file 2
227 genes showing significant regulation (padj <0.05) in all ribosomal mutants.
- https://doi.org/10.7554/eLife.20420.020
-
Supplementary file 3
Comparison of transcripts and proteins regulated >2 fold in the rplO-1 mutant.
- https://doi.org/10.7554/eLife.20420.021
Download links
A two-part list of links to download the article, or parts of the article, in various formats.
Downloads (link to download the article as PDF)
Open citations (links to open the citations from this article in various online reference manager services)
Cite this article (links to download the citations from this article in formats compatible with various reference manager tools)
Ribosomal mutations promote the evolution of antibiotic resistance in a multidrug environment
eLife 6:e20420.
https://doi.org/10.7554/eLife.20420


