Analyzing native membrane protein assembly in nanodiscs by combined non-covalent mass spectrometry and synthetic biology
- J W Goethe-University, Germany
Figures
Figure 1
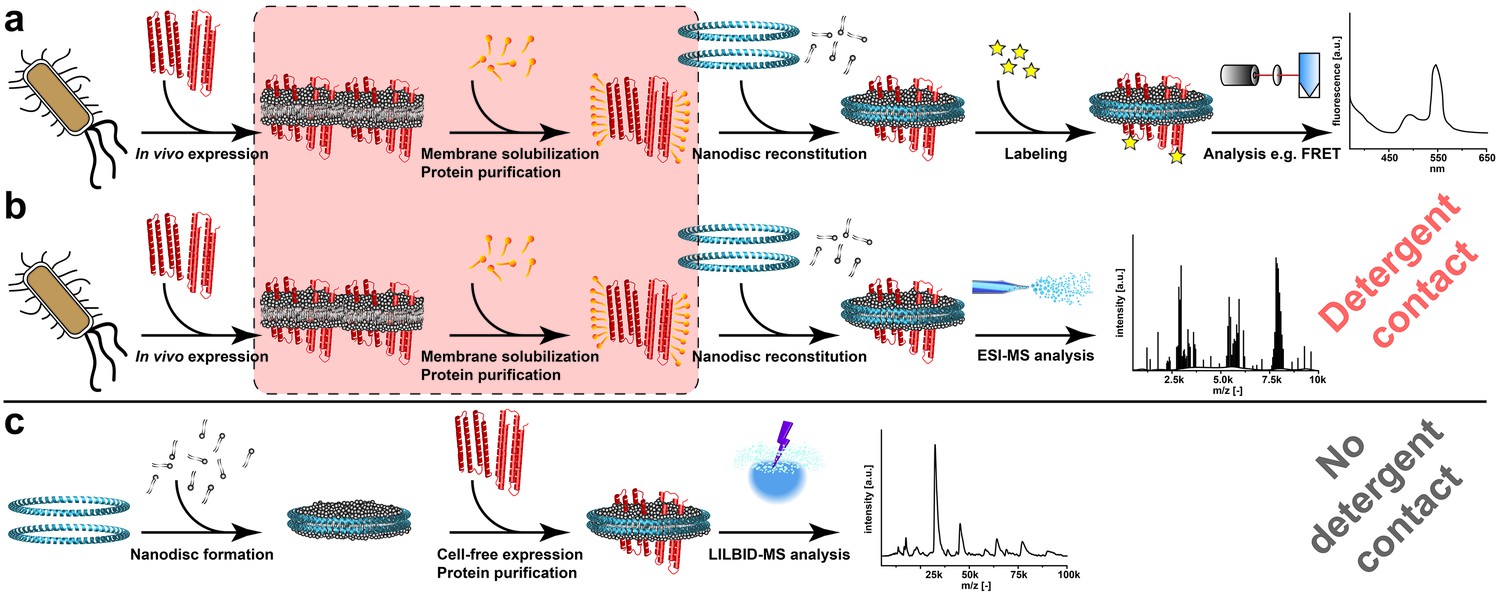
Processes for membrane protein complex characterization.
(a and b) Workflows implementing cellular expression and detergent solubilization of membrane proteins. (a) Membrane protein analysis with non-MS-related methods. (b) Membrane protein analysis with ESI-MS. (c) Proposed method combining cell-free co-translational membrane insertion with LILBID-MS analysis. Detergents and lipids are highlighted in orange and grey, respectively. The membrane scaffold protein is represented by blue helices and membrane proteins with red helices. The critical membrane extraction step is emphasized by the red box.
Figure 2 with 3 supplements
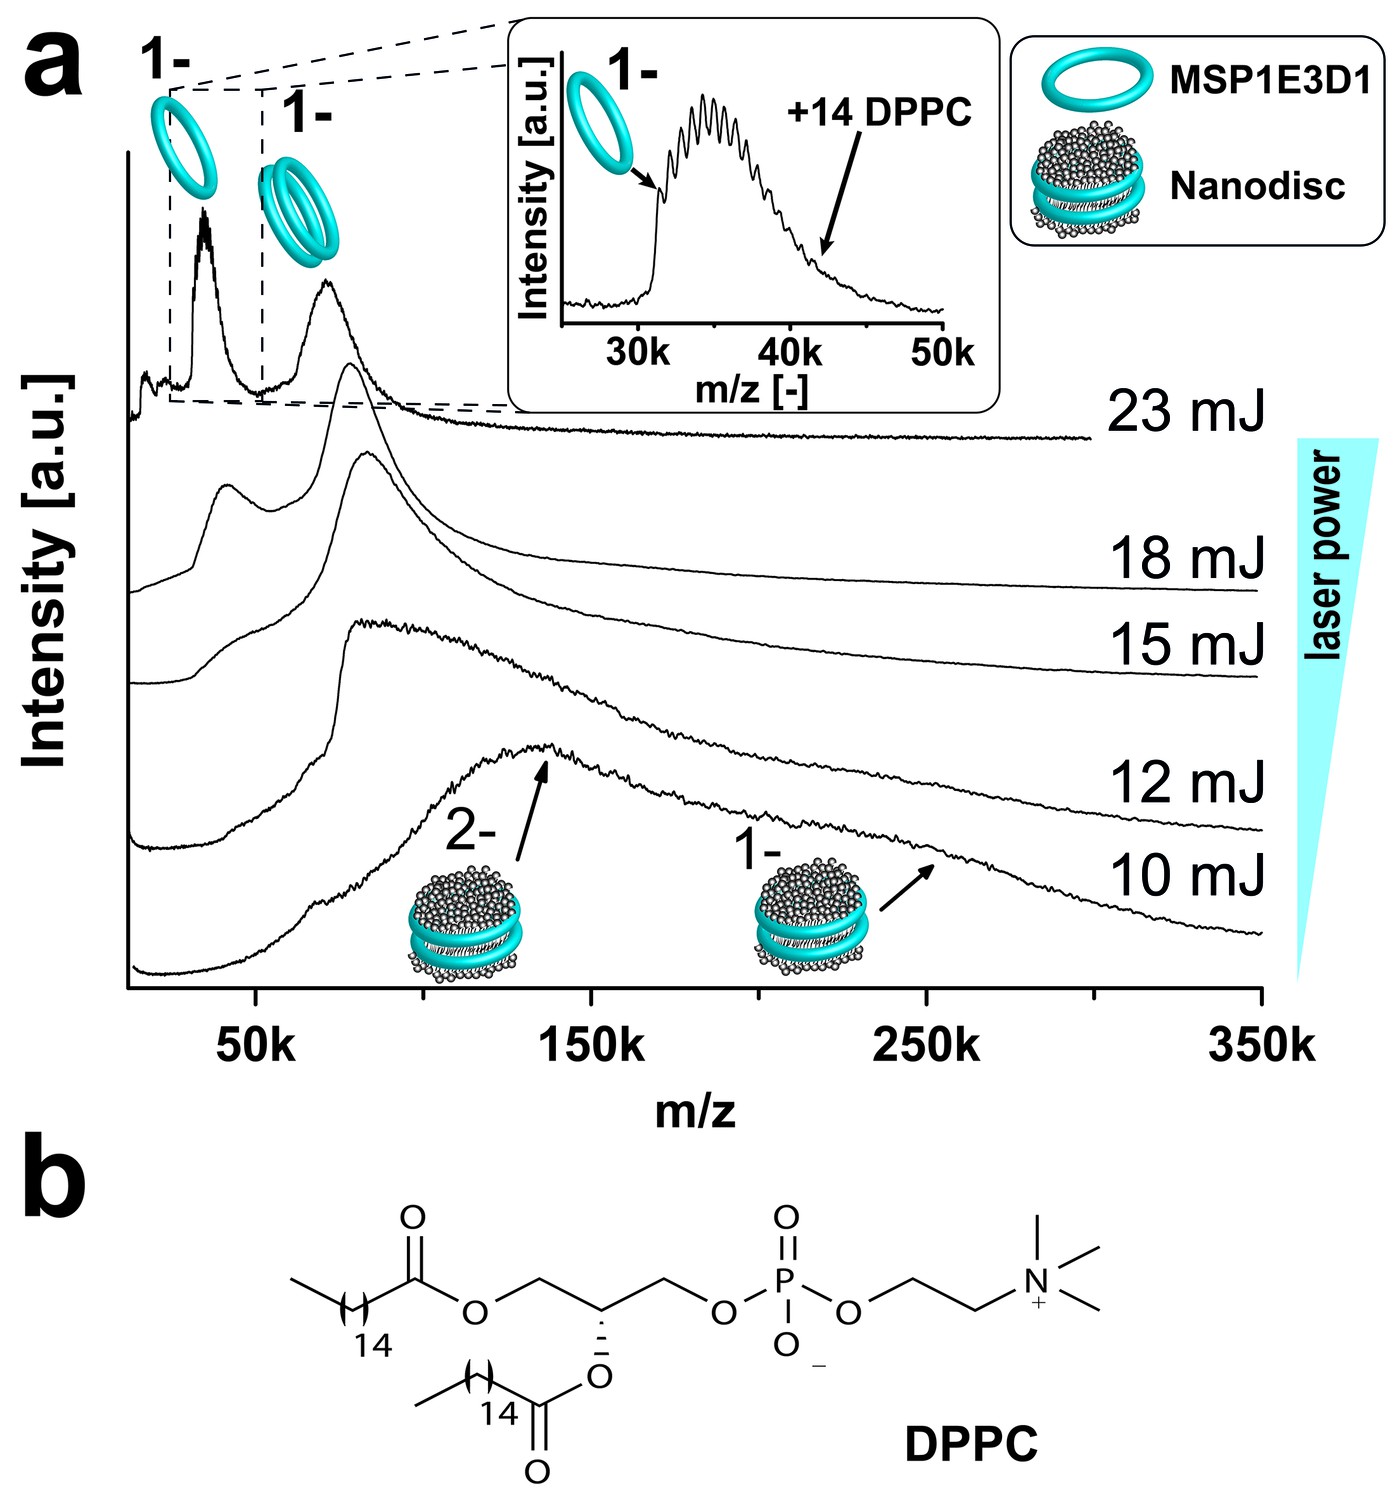
Adjusting LILBID-MS conditions for nanodiscs analysis.
Pictograms illustrate complexes of the corresponding peaks and are labeled with the particle charge in the gas-phase. (a) The different laser intensities are indicated. The monomer region of MSP1E3D1 with lipid attachments is enlarged in the inset. (b) Structure of the lipid DPPC used for nanodisc formation.
Figure 2—figure supplement 1

LILBID-MS analysis of nanodiscs assembled with different scaffold protein derivatives.
Pictograms illustrate particles of the corresponding peaks. The different laser intensities are indicated. (a) LILBID-MS spectra of nanodiscs (DMPG) assembled with MSP1E3D1, MSP1 or MSP1D1ΔH5. (b) Size exclusion profiles of nanodiscs (DMPC) with three different scaffold proteins on a Superdex 200 3.2/30 increase column with a flow rate of 0.075 ml/min. The inset illustrates final MSP1E3D1 (DMPC) nanodisc homogeneity as analyzed by negative stain electron microscopy.
Figure 2—figure supplement 2
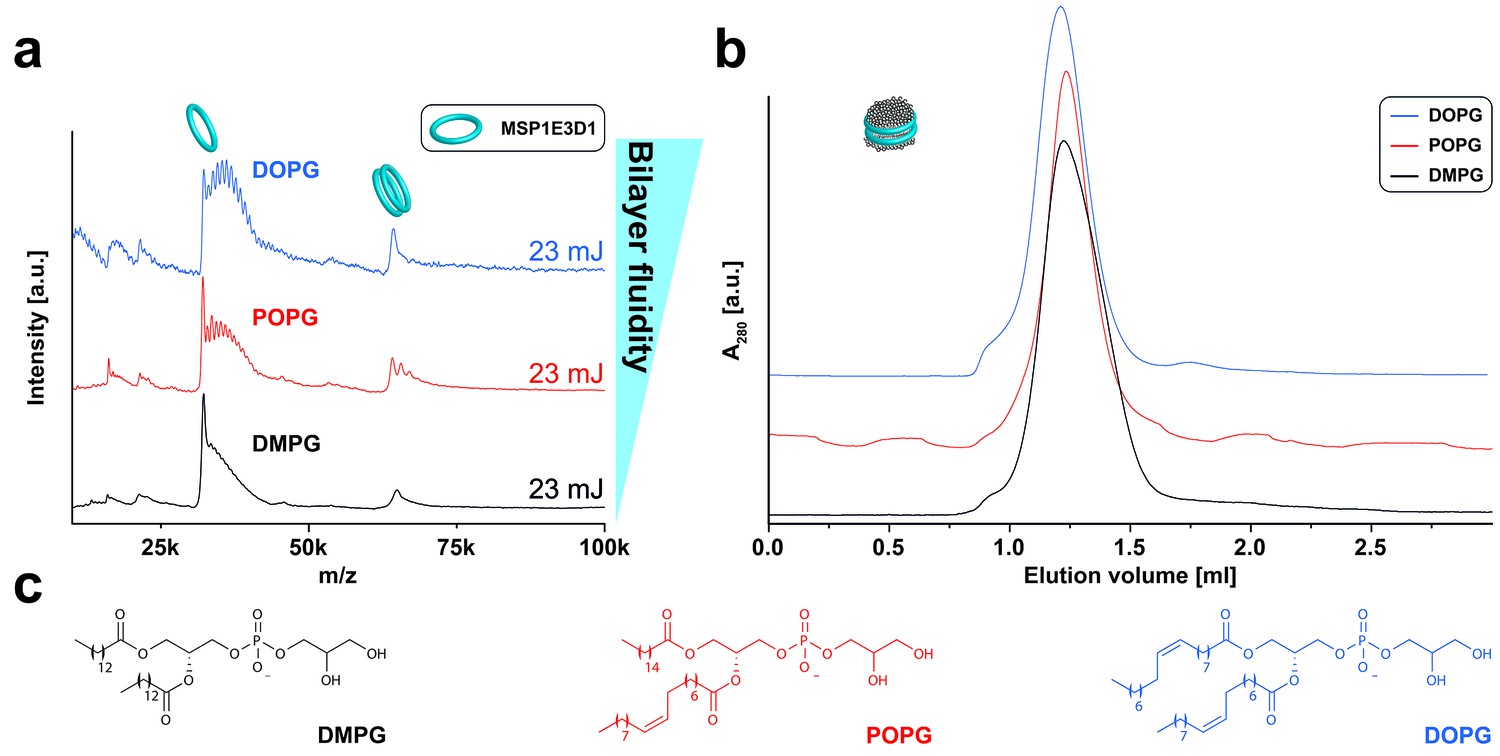
LILBID-MS analysis of MSP1E3D1 nanodiscs assembled with lipids containing different chain length and saturation state.
Pictograms illustrate the detected particles. The different laser intensities are indicated. (a) LILBID-MS spectra of nanodiscs containing the indicated lipids. (b) Corresponding size exclusion profiles of the nanodiscs on a Superdex 200 3.2/30 column with a flow rate of 0.050 µl/min. (c) Structures of the lipids used for nanodisc formation.
Figure 2—figure supplement 3
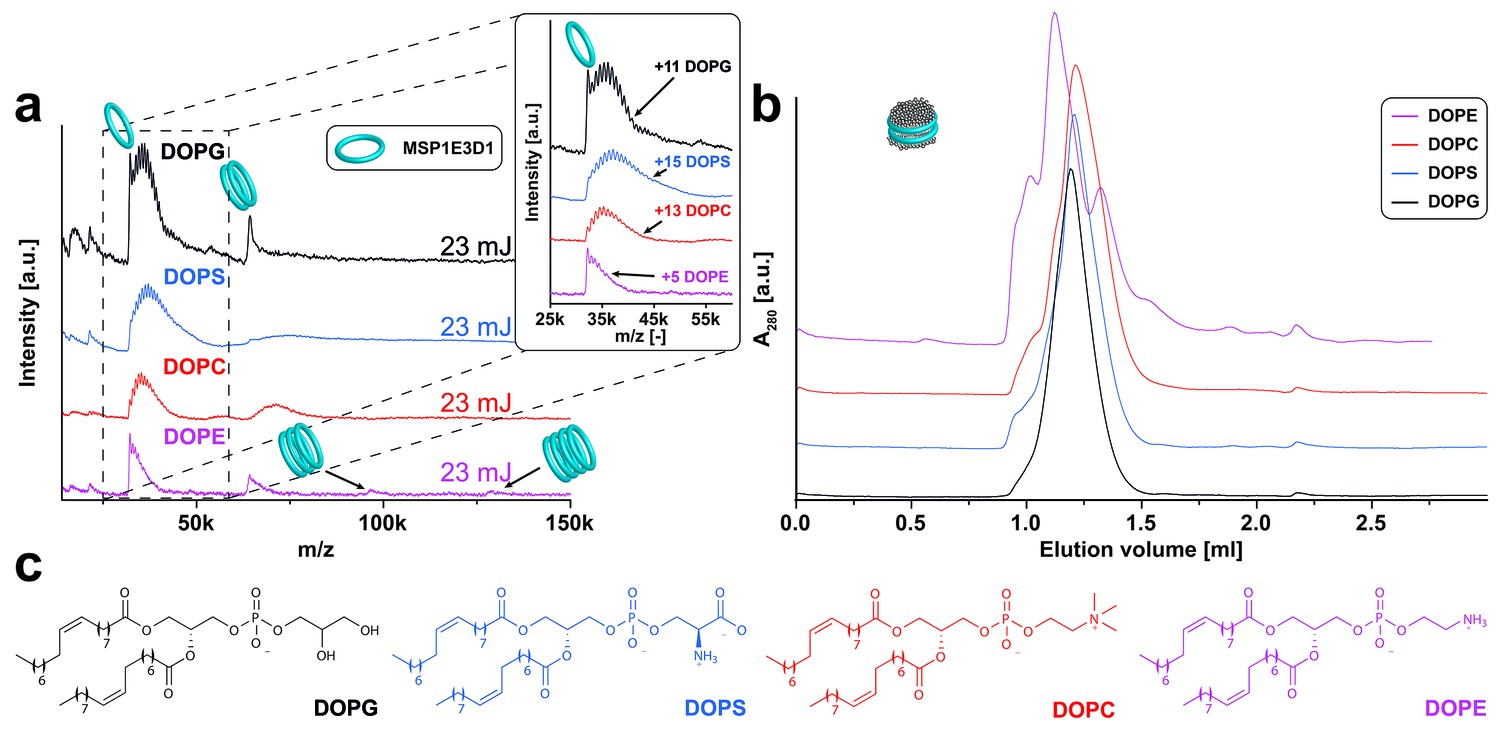
LILBID-MS analysis of MSP1E3D1 nanodiscs assembled with lipids containing different head groups.
Pictograms illustrate the detected particles. The different laser intensities are indicated. (a) LILBID-MS spectra of nanodiscs containing the indicated lipids. The monomer region of MSP1E3D1 with lipid attachments is enlarged in the inset. In the case of DOPE, the scaffold protein trimer and tetramer complexes indicate inhomogeneous nanodiscs or possibly aggregation further supported by the corresponding size exclusion profile. (b) Corresponding size exclusion profiles of the nanodiscs on a Superdex 200 3.2/30 increase column with a flow rate of 0.075 µl/min. (c) Structures of the lipids used for nanodisc formation.
Figure 3

LILBID-MS analysis of MSP1E3D1 nanodiscs assembled with lipid mixtures.
Pictograms illustrate the detected particles. The applied laser intensity is indicated. (a) LILBID-MS spectra of nanodiscs containing the indicated lipid mixtures as well as single lipid types. (b) Corresponding size exclusion profiles of the nanodiscs on a Superdex 200 3.2/30 increase column with a flow rate of 0.075 µl/min. (c) LILBID-MS spectra of MSP1E3D1 (DMPG) (top) and MSP1E3D1 (DMPG/cardiolipin) nanodiscs (bottom). Circles and squares highlight peaks generated by DMPG or cardiolipin molecules attached to MSP1E3D1 monomers. (d) Structures of lipids used for nanodisc formation.
Figure 4 with 1 supplement
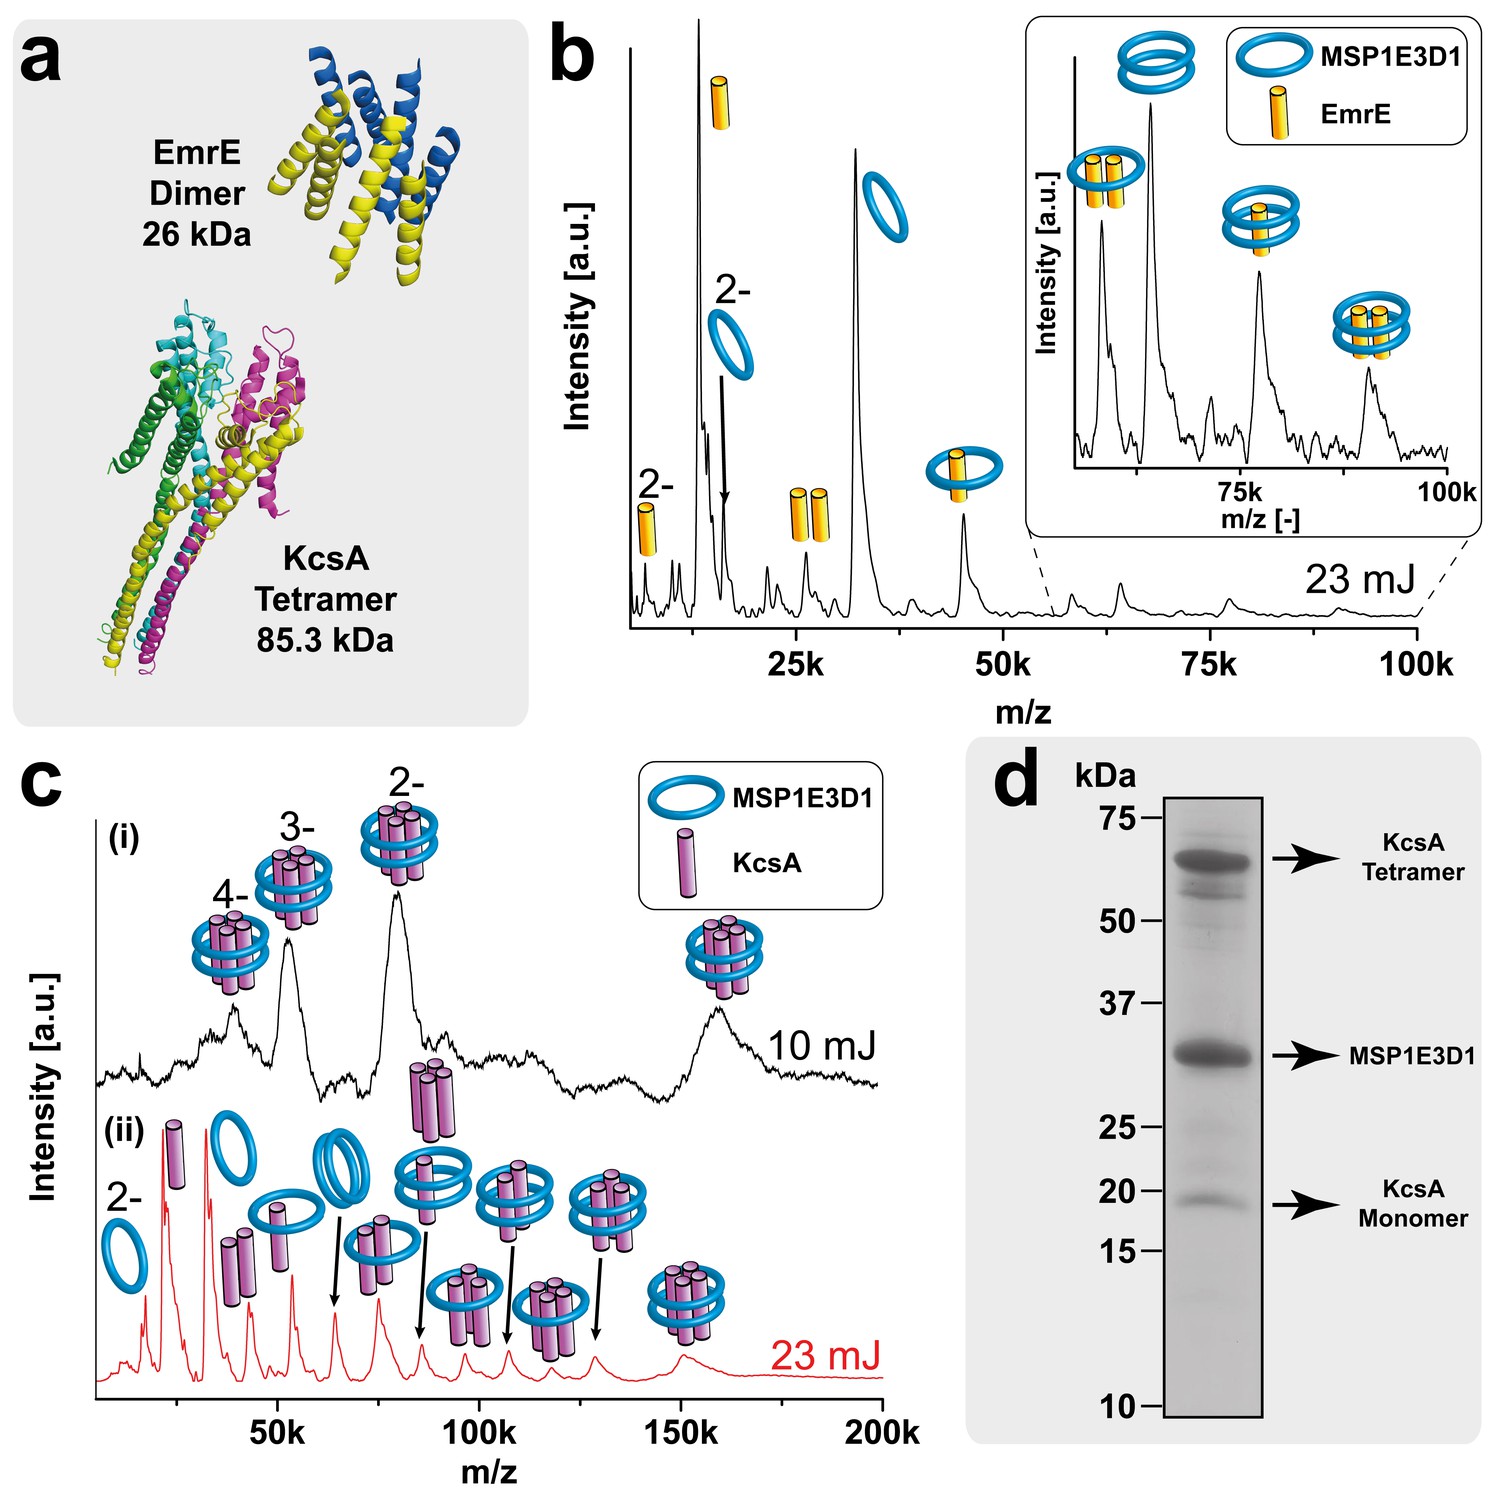
LILBID-MS analysis of KcsA and EmrE nanodisc complexes.
Pictograms in mass spectra illustrate the assigned complex for every peaks. Charge states are indicated if they differ from 1-. The different laser intensities are indicated. (a) 3D structures and mass of KcsA (PDB: 3EFF) and EmrE (PDB: 2I68) (b) Mass spectrum of EmrE MSP1E3D1 (DMPG) complexes. Free monomer and dimer can be dissociated from the scaffold proteins. (c) KcsA MSP1E3D1 (DMPG) complexes analyzed at different laser conditions. Under soft conditions, (i) the KcsA tetramer with two scaffold proteins appears with one to four charges. Higher desorption laser energy (ii) leads to dissociation of scaffold or KcsA proteins. Monomer and dimer of KcsA without scaffold proteins are visible, but free tri- and tetramer cannot yet be unambiguously assigned due to overlap with other species. (d) SDS-PAGE analysis of the KcsA MSP1E3D1 (DMPG) sample allowed verifying the formation of SDS stable tetramer.
Figure 4—figure supplement 1
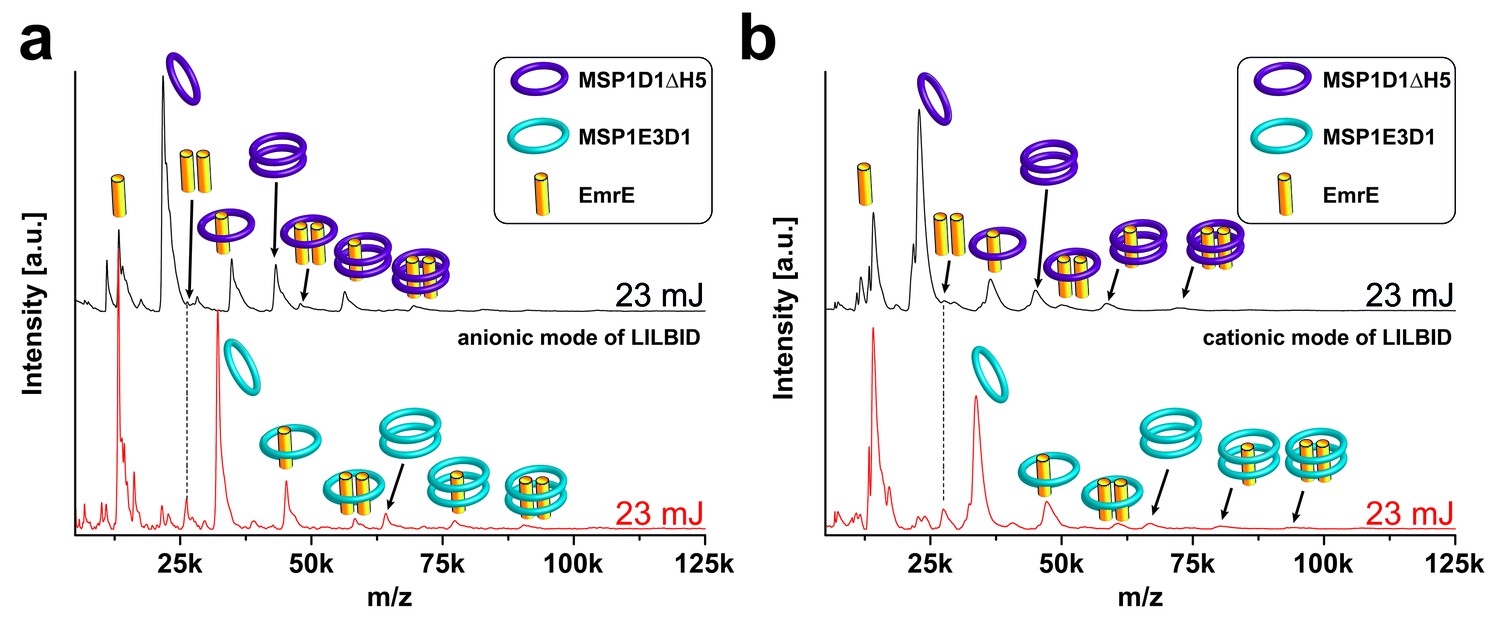
LILBID-MS analysis of nanodiscs with different ionization modes.
Pictograms illustrate the detected particles. The different laser intensities are indicated. EmrE was co-translationally inserted into nanodiscs of two different sizes. (a) Anionic mode. (b) Cationic mode. The dashed lines highlight signals of the EmrE dimer.
Figure 5
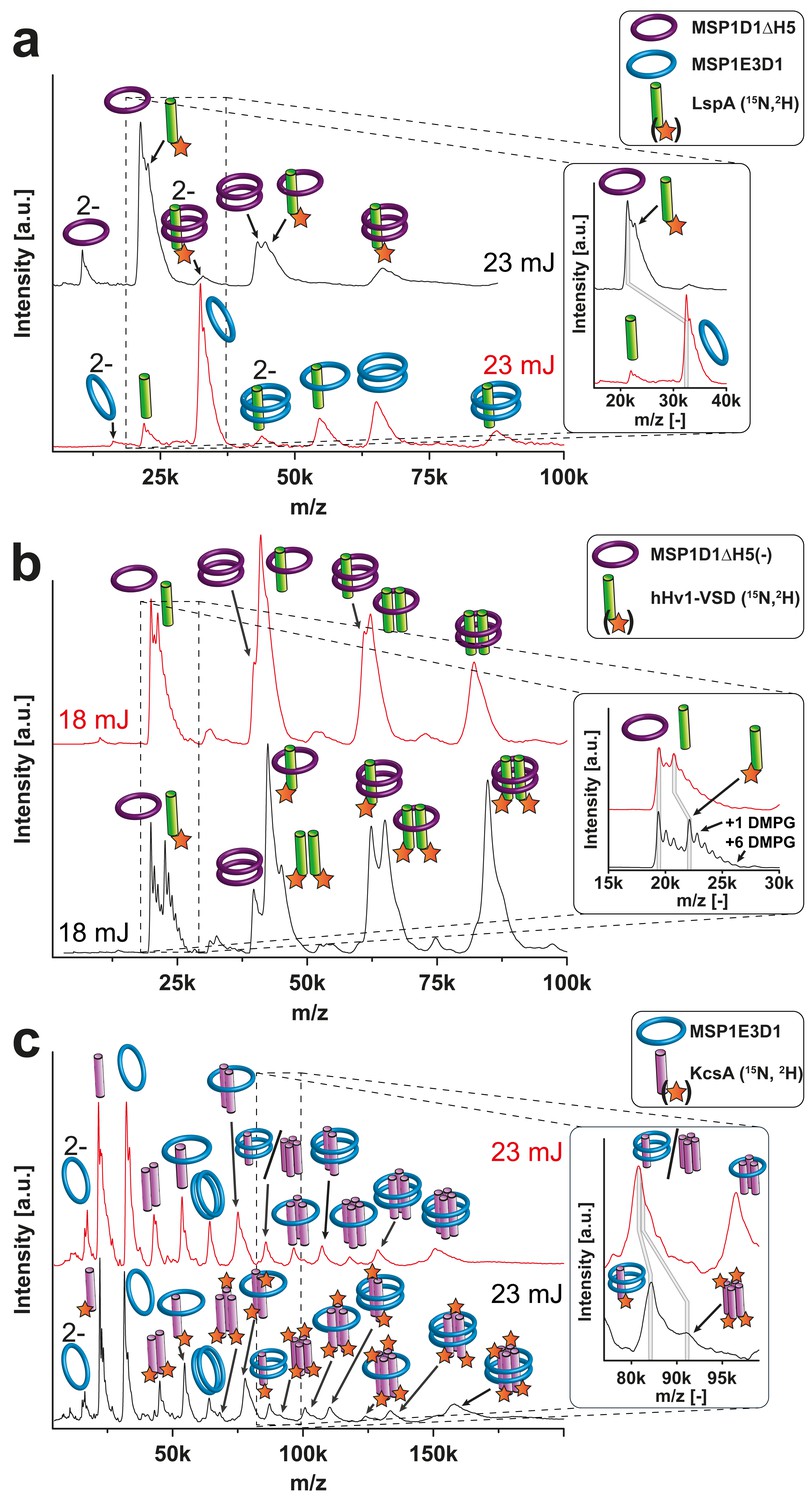
Resolution refinement by isotopic labeling or scaffold protein exchange.
Relevant mass shifts reducing the peak overlap are highlighted in the insets. Pictograms illustrate the corresponding complex of detected peaks and asterix highlight heavy isotope-labeled protein as indicated. The different laser intensities are indicated. (a and c) Spectra of labeled and non-labeled samples are shown by a black and a red line, respectively. (a) hHv1-VSD in nanodiscs using MSP1D1ΔH5 scaffold proteins (19.49 kDa). Labeling shifts the hHv1-VSD monomer about 2 kDa. (b) KcsA MSP1E3D1 (DMPG) complexes. Mass shift for the free KcsA tri- and tetramer (3.63 and 4.48 kDa, respectively) are sufficient to stop overlap with other species. (c) Spectra of LspA MSP1D1ΔH5 (DMPC) complexes in black and of LspA MSP1E3D1 (DMPG) complexes in red. 15N, 2H labeled LspA (22.57 kDa) could not be sufficiently separated from MSP1D1ΔH5 (21.46 kDa). However, spectra of unlabeled LspA (21.52 kDa) inserted into MSP1E3D1 discs show no overlap.
Figure 6 with 1 supplement
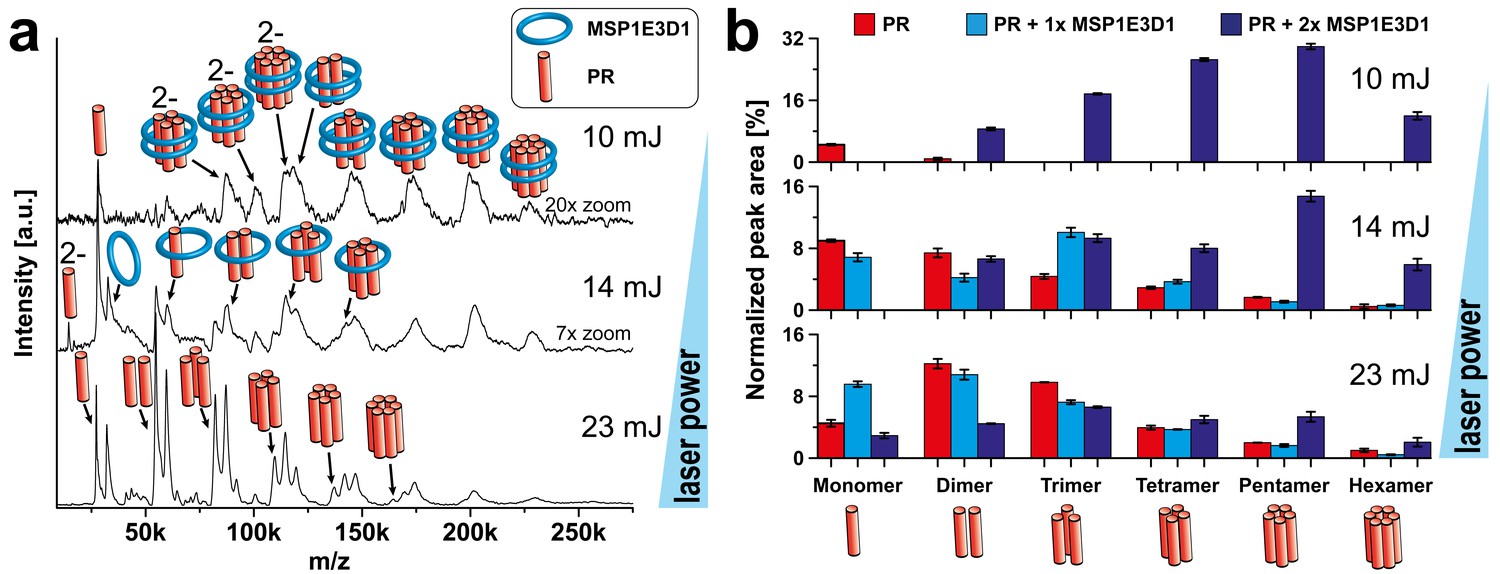
Complex analysis of PR with varying laser conditions.
LILBID-MS spectra of cell-free expressed PR with increasing laser power (a) and corresponding statistical analysis of the abundance of different complex species (b). The different laser intensities are indicated and pictograms illustrate the corresponding complex of the detected peaks. (a) PR in nanodiscs composed of MSP1E3D1 and DMPG shows up to hexameric complexes with two attached scaffold molecules. With elevated laser powers, these complexes get more and more disrupted and plain PR complexes without scaffold attachments can be detected. This is nicely illustrated by the statistical analysis (b) of the spectra shown in (a). Using low-laser intensities mainly PR complexes associated to scaffold proteins can be detected. The values of the bars correspond to the means of 2–3 measurements and the error bars display the standard deviation.
Figure 6—figure supplement 1
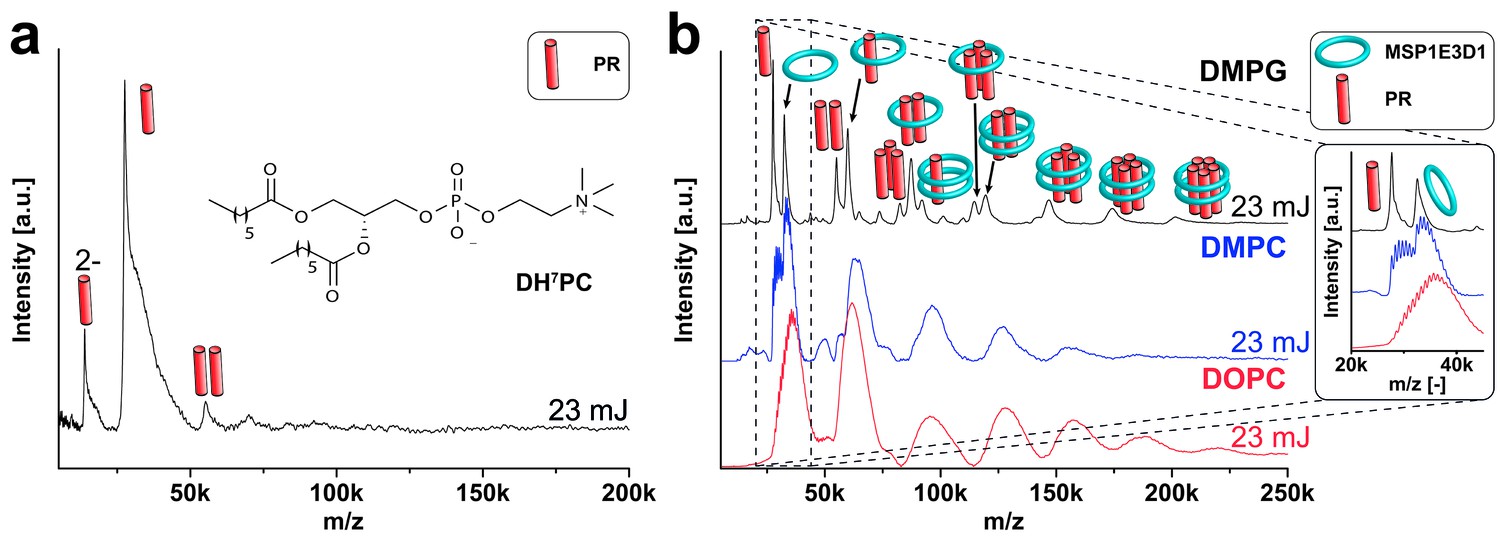
Analysis of PR expressed into different hydrophobic environments.
PR synthesized in the presence of DH7PC and GDN and purified with 0.1% of the lipid-like detergent DH7PC (chemical formula in the inlet) exhibits mainly a monomeric state with a small fraction of dimer (a). In (b) spectra of PR expressed in the presence of nanodiscs with different lipids (DMPG, DMPC, DOPC) are shown. The detected complexes seem to be unaltered, whereas the peak width increases as seen for empty nanodiscs. The different laser intensities are indicated and pictograms illustrate the corresponding complex of detected peaks.
Figure 7
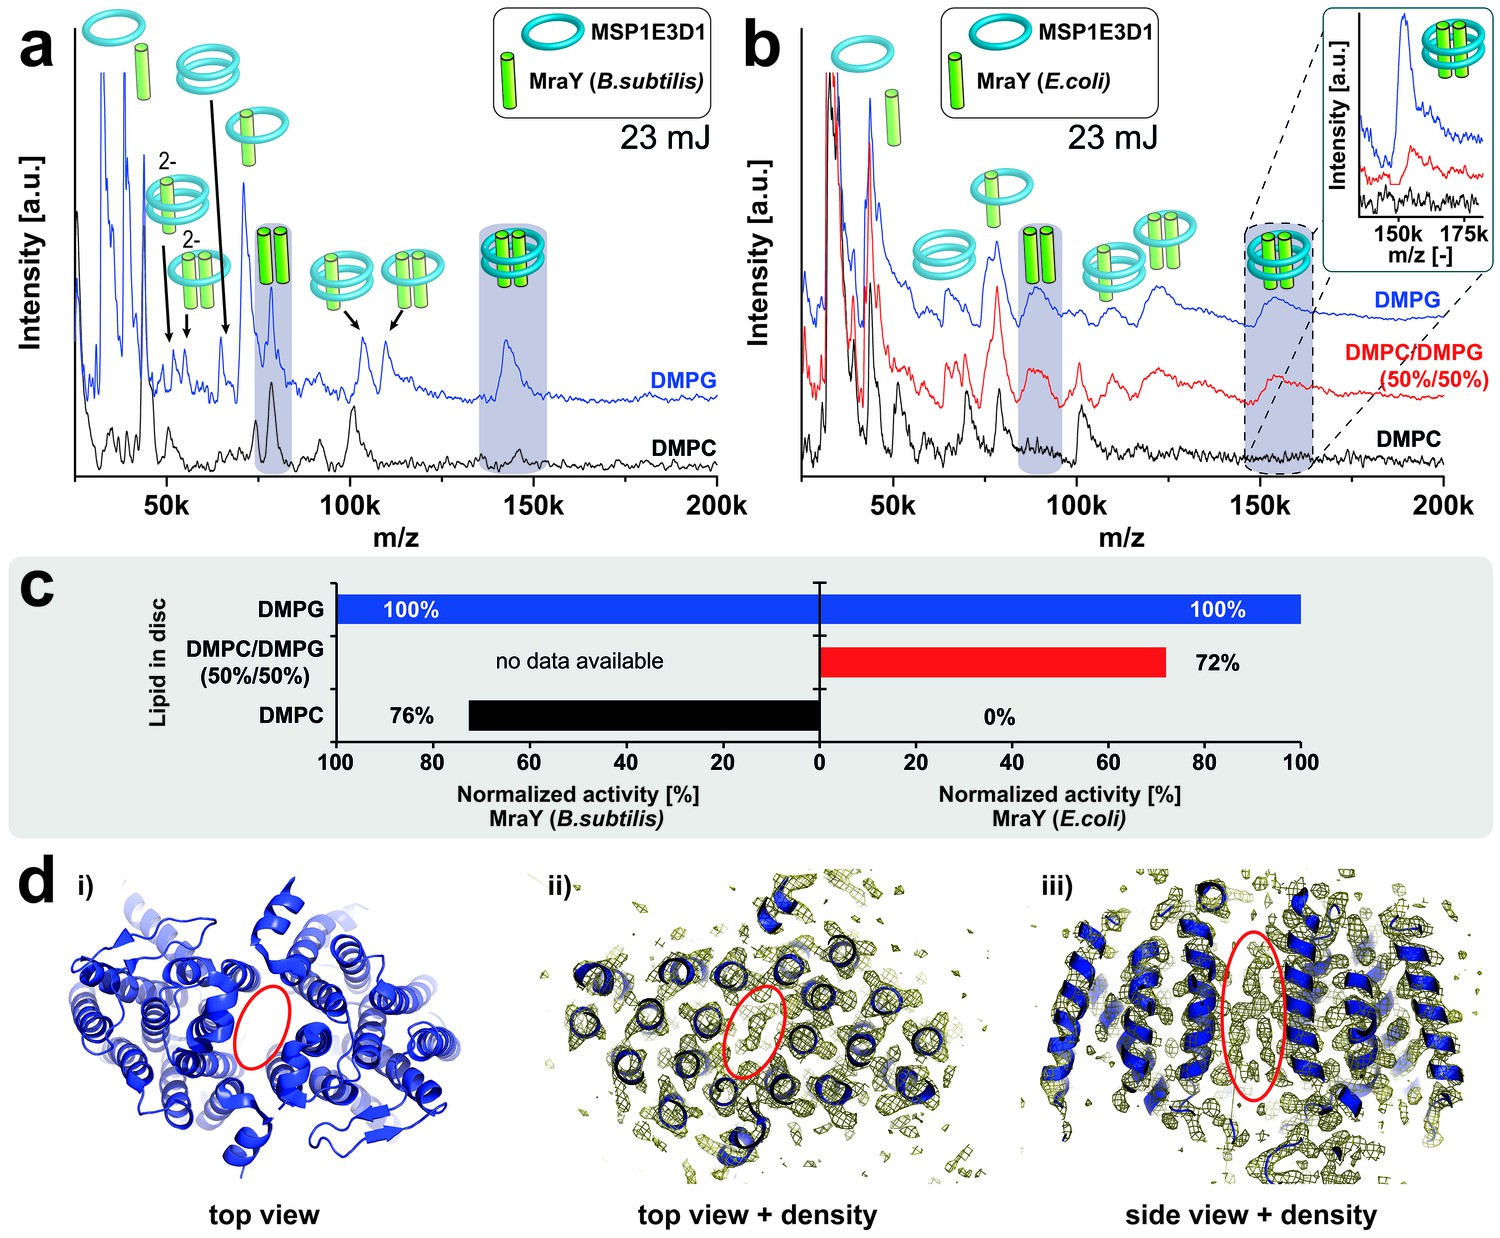
Lipid related effect on structure and function of E. coli MraY.
LILBID-MS spectra of B. subtilis MraY (a) and E. coli MraY (b) in MSP1E3D1 nanodiscs with different lipids. Pictograms illustrate the composition of detected signals and lipids for each sample are indicated. Grey boxes in spectra highlight MraY dimer signals with and without scaffold protein. The different laser intensities are indicated. The inset shows a close-up of the MraY dimer region with scaffold measured under high-mass conditions. (c) Enzymatic activity of B. subtilis and E. coli MraY in nanodiscs with corresponding lipids (Henrich et al., 2016). (d) 3D crystal structure of A. aeolicus MraY (PDB: 4 J72). Electron density maps of top and side views indicate a hydrophobic tunnel within the dimer interface potentially filled with lipid molecules as highlighted by a red ellipse (Chung et al., 2013).
Tables
Table 1
Characteristics of nanodiscs and contained bilayer for used combinations of different scaffold proteins with various lipids.
Scaffold | Nanodisc diameter [nm] | Lipid | Protein:lipid ratio in nanodisc reaction mix | Attached lipids (LILBID) | Transition tempature [°C] | Headgroup charge Σ charges | Hydrophobic tail | |
|---|---|---|---|---|---|---|---|---|
Double bonds | Length | |||||||
MSP1D1ΔH5 | 8 | DMPC | 1:50 | 15 | 24 | 0 | 0 | 14 |
DMPG | 1:45 | 6 | 23 | −1 | 0 | 14 | ||
MSP1 | 10 | DMPC | 1:80 | 17 | 24 | 0 | 0 | 14 |
DMPG | 1:70 | 9 | 23 | −1 | 0 | 14 | ||
MSP1E3D1 | 12 | DMPC | 1:115 | 19 | 24 | 0 | 0 | 14 |
DMPG | 1:110 | 11 | 23 | −1 | 0 | 14 | ||
DPPC | 1:100 | 18 | 41 | 0 | 0 | 16 | ||
POPG | 1:90 | 15 | −2 | −1 | 0/1 | 16/18 | ||
DOPC | 1:80 | 21 | −17 | 0 | 2 | 18 | ||
DOPG | 1:80 | 20 | −18 | −1 | 2 | 18 | ||
DOPS | 1:90 | 20 | −11 | −1 | 2 | 18 | ||
DOPE | 1:80 | 8 | −16 | 0 | 2 | 18 | ||
Mixtures | Lipid ratio | |||||||
DMPG/DMPC | 1:115 | 11 | 50/50 | −1/0 | 0/0 | 14/14 | ||
DMPG/Cardiolipin | 1:120 | 12 | 90/10 | −1/–2 | 0/0 | 14/14 | ||
DMPG/Inositol | 1:110 | 15 | 50/50 | −1/–1 | 0/0;1 | 14/16;18 | ||
DMPC/Cholesterol | 1:115 | 23 | 90/10 | 0/0 | 0/ n.d. | 14/ n.d. | ||
E. coli total lipids | 1:50 | n.i. | n.d. | n.d. | n.d. | n.d. | ||
-
n.d. = not defined.
-
n.i. = not investigated.
Table 2
Construct list combining full name, size and expression system with the abbreviation. The theoretical masses of the different constructs are calculated by the Expasy tool protparam according to the primary sequence. Based on that the theoretical molecular weights of labeled proteins are calculated by the addition of masses of the single amino acids subtracted by the number of water molecules corresponding to the number of peptide bonds.
Protein | Molecular weight [kDa] | Full name | Reference | |
|---|---|---|---|---|
Theoretical | Experimental | |||
PR | 27.09* | 27.19* | Proteorhodopsin (green variant) | |
KcsA | 21.33/22.70† | 21.38/22.77† | pH-gated potassium channel KcsA | - |
Emre | 13.00 | 13.09 | Multidrug transporter EmrE | |
LspA | 21.52/22.83† | 21.63/22.84† | Lipoprotein signal peptidase | |
hHv1-VSD | 20.80/22.28† | 20.89/22.20† | Human proton channel - voltage sensing domain | |
Bs-MraY | 37.88 | 37.93 | Phospho-N-acetylmuramyl-pentapeptide-transferase B.subtilis | |
Ec-MraY | 42.22 | 42.29 | Phospho-N-acetylmuramyl-pentapeptide-transferase E.coli | |
MSP1 | 25.3 | 25.40 | Membrane scaffold protein | |
MSP1E3D1 | 31.96 | 32.08 | Membrane scaffold protein | |
MSP1D1ΔH5 | 19.49‡/21.46 | 19.53‡/21.50 | Membrane scaffold protein | |
-
* Molecular mass according to covalent coupling of all trans-retinal.
-
† Molecular mass according to heavy isotope labeling.
-
‡ Molecular mass according to cleavage of the His6-tag.
Download links
A two-part list of links to download the article, or parts of the article, in various formats.
Downloads (link to download the article as PDF)
Open citations (links to open the citations from this article in various online reference manager services)
Cite this article (links to download the citations from this article in formats compatible with various reference manager tools)
Analyzing native membrane protein assembly in nanodiscs by combined non-covalent mass spectrometry and synthetic biology
eLife 6:e20954.
https://doi.org/10.7554/eLife.20954


