Direct measurement of TRPV4 and PIEZO1 activity reveals multiple mechanotransduction pathways in chondrocytes
- Max Delbruck Center for Molecular Medicine, Germany
- School of Medical Sciences, University of New South Wales, Australia
Figures
Figure 1 with 1 supplement
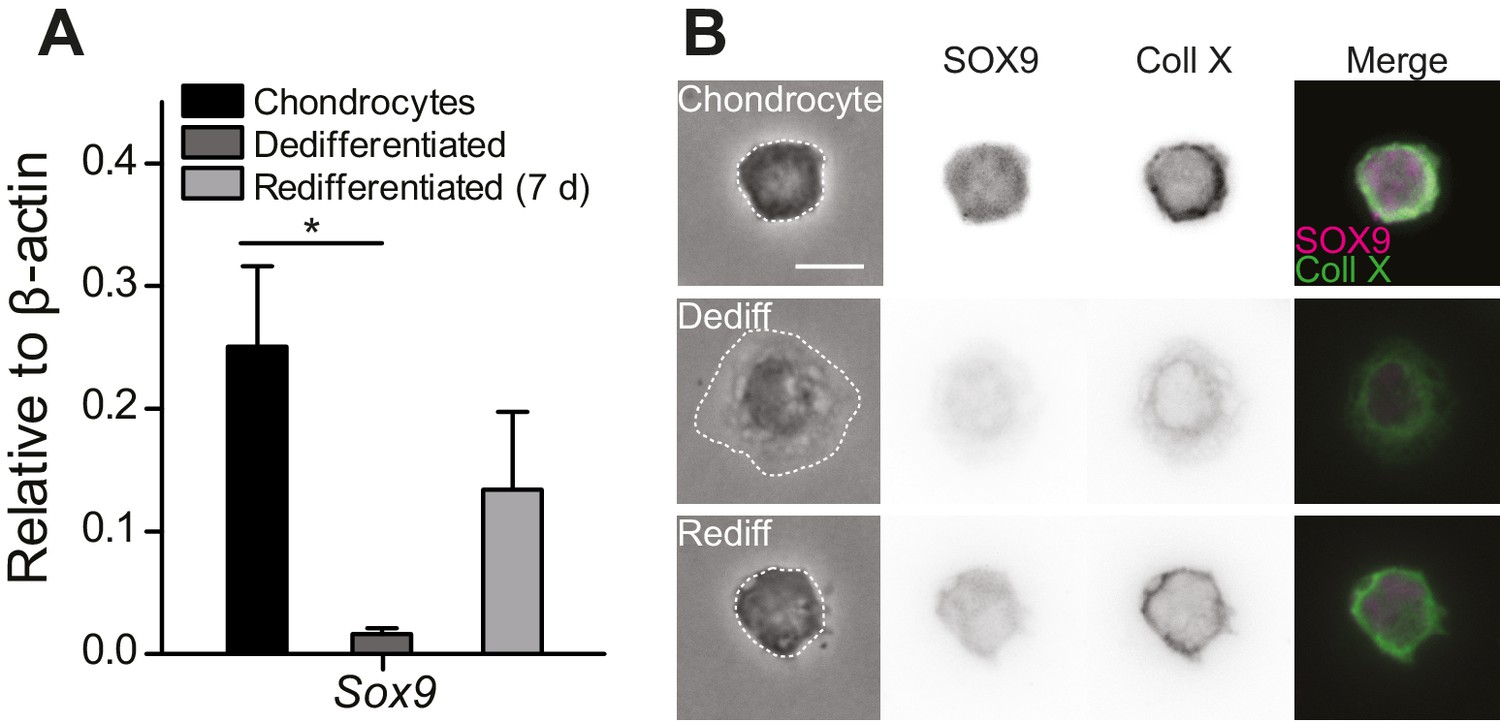
Primary, murine chondrocyte culture.
(A) Transcript levels of the transcription factor Sox9 in just harvested chondrocytes, dedifferentiated cells (post 7 days in monolayer culture) and redifferentiated chondrocytes (recovered from 2D plastic and encapsulated in alginate for 7 days). Data are displayed as mean ± s.e.m. Note, significantly less Sox9 transcript was detected in the population of dedifferentiated cells (one-way ANOVA, Tukey Post-hoc test *p=0.035; n ≥ 3.) (B) Phase contrast and epi-fluorescent images representative of the morphological differences between chondrocytes, dedifferentiated and redifferentiated cells. SOX9 was detected in the nucleus and Collagen X at the membrane of chondrocytes and redifferentiated cells, but not the dedifferentiated population (inverted images and overlay). Scale bar 10 µm.
Figure 1—figure supplement 1

Schematic diagram of the isolation and culture of primary murine chondrocytes.
(A) Knees and femoral heads were isolated from 4- to 5-day-old mouse pups to obtain chondrocytes. A fraction of the isolated cells were encapsulated in alginate to maintain their differentiation state and the rest were expanded in 2D tissue-culture flasks. When passaged less than three times, the cells could be recovered from the flasks and redifferentiated by encapsulation in 3D alginate beads. For pillar array experiments, cells were recovered by dissolving the alginate and then seeded on arrays. The dedifferentiated population of the studied cells were those that dedifferentiated in situ. (B) Chondrocytes with circular morphology exhibit a higher SOX9 intensity. After redifferentiation in alginate, chondrocytes were recovered, seeded on glass coverslips, fixed and labelled with anti-SOX9 antibody. Samples were imaged using epifluorescent and bright-field imaging. A measure of the morphology of the cells (degree of circularity determined from bright-field images where 1 defines a perfect circle) was plotted against the SOX9 signal (derived from epifluorescent imaging where intenstity was normalized to the highest intensity measured in each sample). Data are displayed as individual values of intensity and circularity. n = 144 cells. (C) Representative images of cells corresponding to the marked points (red and blue) within the graph. On the basis of the morphology and SOX9 signal, we refer to the round cells as chondrocytes (red point) and the fibroblast-like as dedifferentiated cells (blue point). Scale bar 10 μm.
Figure 2

Mechanoelectrical transduction currents in primary cells isolated from mouse cartilage.
(A) Deflection stimuli applied via cell-matrix contact points. Left panel: cartoon of pillar array experiment, stimuli are applied by deflecting a pilus subjacent to a cell that is concurrently monitored using whole-cell patch-clamp (blue indicates stimulator probe and orange the patch pipette.) Right panel: bright-field image of a chondrocyte seeded on the pillar array. Successive images of the movement of the highlighted pilus demonstrate the degree of movement corresponding to the stimuli used in this study (B) Deflection-gated mechanoelectrical transduction currents in chondrocytes. Bright-field image of a chondrocyte and corresponding example traces of deflection-gated currents (red). (C) Deflection-gated mechanoelectrical transduction currents in dedifferentiated cells. Bright-field image of a dedifferentiated cell and representative traces of deflection-gated currents (blue). (D) Comparison of current kinetics. Left panel indicates values measured (latency (magenta), activation time constant (τ1, blue) and current decay (τ2, green)). Data are displayed as individual values (chondrocytes: red, dedifferentiated cells: cyan), mean ± s.e.m. superimposed in black.
-
Figure 2—source data 1
Electrophysiological characteristics of WT chondrocytes and WT dedifferentiated cells.
Chondrocytes were isolated from C57Bl/6 mice. For each sample (chondrocyte phenotype and dedifferentiated phenotype) the number of litters, recorded cells and number of cells that respond to pillar deflections are shown along with the total number of stimulation points (corresponding to the number of distinct pili deflected) and the total number of measurements (i.e. individual deflections). For each recorded current, the latency and the current amplitude were measured, and the activation time constant and current decay were obtained from a mono-exponential fit of the data. The mean ± s.e.m. and the median are displayed for each kinetic parameter.
- https://doi.org/10.7554/eLife.21074.006
Figure 3
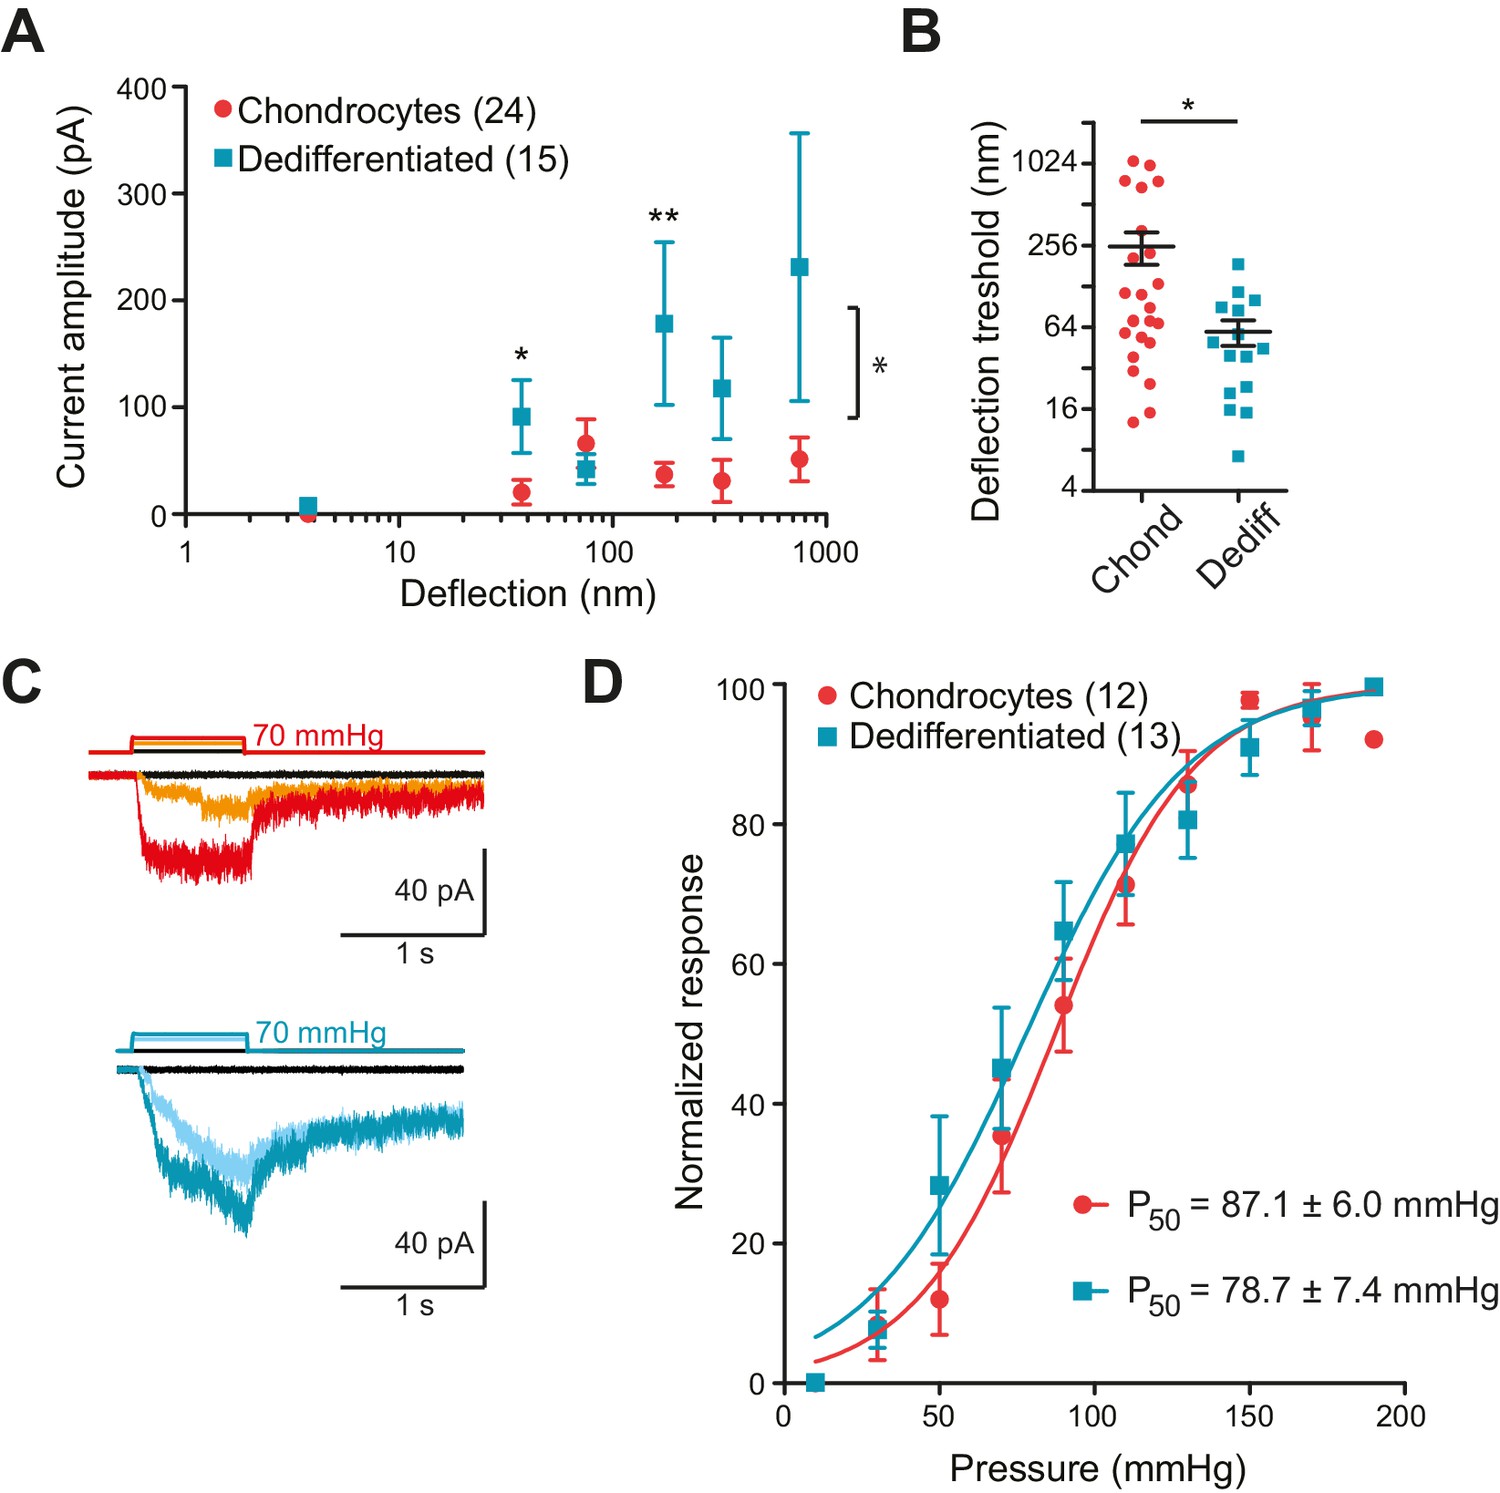
Chondrocytes and dedifferentiated cells display distinct mechanosenstivity to substrate deflections.
(A) Stimulus-response graph of deflection-gated currents in chondrocytes (red circles) and dedifferentiated cells (cyan squares). Measurements from an individual cell were binned according to stimulus size and current amplitudes were averaged within each bin, then across cells, data are displayed as mean ± s.e.m. For stimuli between 10–50 and 100–250 nm, the dedifferentiated cells exhibit significantly larger currents. (Mann-Whitney test *p=0.02 and **p=0.004, respectively, n = 24 chondrocytes and 15 dedifferentiated cells.) Additionally, an ordinary two-way ANOVA indicates that the cell-types differ in their overall response (*p=0.03). (B) Chondrocytes and dedifferentiated cells display distinct deflection thresholds to substrate deflections. A threshold was calculated by averaging the smallest deflection that resulted in channel gating, for each cell. The threshold for chondrocytes, 252 ± 68 (mean ± s.e.m., n = 24) was significantly higher than that calculated for dedifferentiated cells 59 ± 13 (mean ± s.e.m., n = 15) (Mann-Whitney, *p=0.028). (C) Representative traces from HSPC recordings of stretch-activated currents from outside-out patches pulled from chondrocytes (upper panel) and dedifferentiated cells (lower panel). (D) Stimulus-response curve of pressure-gated currents in chondrocytes (red) and dedifferentiated cells (cyan), normalized to maximal amplitude measured for each sample. (Data are displayed as mean ± s.e.m., n = 12 chondrocytes, 13 dedifferentiated cells.).
-
Figure 3—source data 1
Statistical comparison of mechanoelectrical transduction currents, chondrocytes vs dedifferentiated cells.
(A) Statistical comparison of deflection-gated mechanoelectrical transduction responses. For each individual cell, currents were binned in the indicated size ranges (in nm) and the current amplitudes within each bin averaged and then averaged across cells. Bins were subsequently tested for normal distribution and subsequently compared with a Student’s t-test (parametric data sets) or a Mann Whitney test (non-parametrical data). The p values are shown for significant comparisons, ‘NS’ indicates no significant differences and ‘NA’ is shown when all measurements within a bin were equal to zero. The number of compared points is shown in brackets. An ordinary two-way ANOVA was used to compare the cellular response over the range of stimuli, reported are the p value and F statistic (including DFn, DFd). (B) Statistical comparison of stretch-gated mechanoelectrical transduction in chondrocytes. Chondrocytes were isolated from WT mice, expanded and encapsulated in alginate. After deposition on coverslips for measurement, cells were analyzed using HSPC. For each condition, the number of litters, recorded membrane patches and maximal current (pA) are shown. Data are displayed as mean ± s.e.m. Conditions were compared with Student’s t-test (parametric data sets), and the p values are shown for significant comparisons, ‘NS’ indicates no significant.
- https://doi.org/10.7554/eLife.21074.008
Figure 4 with 1 supplement
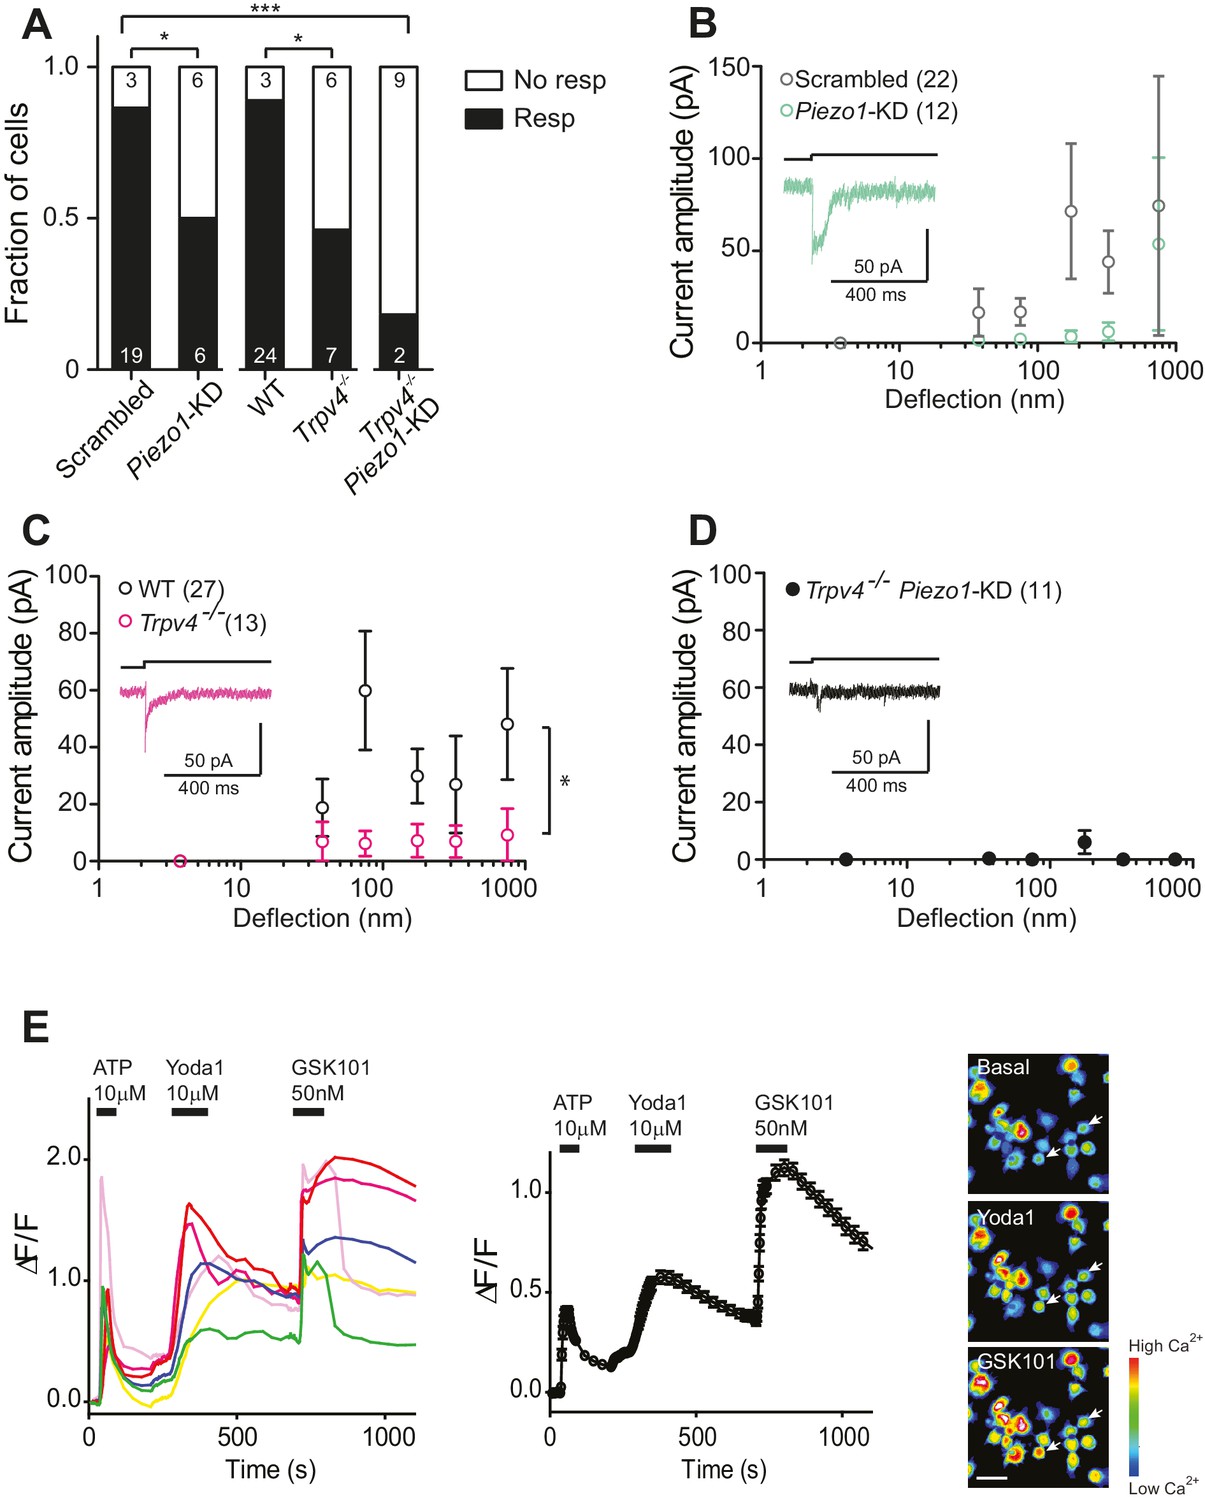
Substrate-deflection gated currents are mediated by PIEZO1 and TRPV4.
(A) Fraction of chondrocytes that responded with at least with one mechanically gated current in response to deflection stimuli. Knockdown of Piezo1 resulted in significantly fewer responsive cells compared with cells treated with non-targeting miRNA (scrambled) (Fisher´s exact test, *p=0.04). Trpv4-/- chondrocytes were significantly less likely to respond to deflection stimuli compared with WT cells (Fisher’s exact test, *p=0.03). When the miRNA against Piezo1 was expressed in Trpv4-/- chondrocytes, the response further decreased compared with the WT chondrocytes transfected with a scrambled miRNA (***p=0.002, Fisher’s exact test). (B) Stimulus-response graph of the deflection-gated currents in chondrocytes transfected with a scrambled miRNA (gray open circles, n = 22 cells) or Piezo1-targeting miRNA (green open circles, n = 12 cells). Data are displayed as mean ± s.e.m., and a representative trace of the mechanosensitive currents is shown as insert (green line). (C) Cells isolated from a Trpv4-/- mouse are significantly less sensitive to deflections, in comparison with WT cells. Stimulus-response graph of the mechanically gated currents triggered by pillar deflections in WT chondrocytes (black open circles, n = 27 cells) and Trpv4-/- chondrocytes (magenta open circles, n = 13 cells). The Trpv4-/- cells are significantly less responsive to substrate deflections (ordinary two-way ANOVA, *p=0.04). Data are displayed as mean ± s.e.m. A representative trace is shown as insert (magenta line). (D) Stimulus-response graph of Trpv4-/- chondrocytes transfected with a Piezo1-targeting miRNA. Data are displayed as mean ± s.e.m. (n = 11 cells). Chondrocytes from the Trpv4-/- mouse treated with Piezo1-targeting miRNA were significantly less sensitive to substrate deflections, in comparison with WT cells treated with scrambled miRNA (ordinary two-way ANOVA, *p=0.04). A representative trace is shown as insert (black line). (E) Flourometric calcium imaging of chondrocyte responses to Yoda1 and GSK1016790A. Cells were perfused with ATP (10 µM), Yoda1(10 µM) and GSK1016790A (GSK101, 50 nM) as indicated by black bars and changes in [Ca2+] were monitored by using the Ca2+ responsive dye, Cal520. In the left panel, traces correspond to intensity changes in individual cells and in the right panel is a plot representing the average of all cells (as mean ± s.e.m.). Example images are presented of cells before activation, during application of Yoda1 and of GSK1016790A. Scale bar 20 µm. Each cell that responded to ATP was included in the analysis (400 cells, two preparations).
-
Figure 4—source data 1
Electrophysiological characteristics of WT, Trpv4-/- and miRNA-treated chondrocytes.
(A) Electrophysiological characteristics of WT, Trpv4-/- and miRNA-treated chondrocytes. Chondrocytes were isolated from C57Bl/6 and Trpv4-/- mice, expanded, transfected (in the case of Scrambled and Piezo1 miRNA constructs) and encapsulated in alginate. For each condition, the number of litters, recorded cells and number of cells that respond to pillar deflections are shown. The total number of stimulation points (corresponding to the number of distinct pili deflected) and the total number of measurements (i.e. individual deflections) are displayed. For each recorded current, the latency and the current amplitude were measured, and the activation time constant and current decay were obtained from a mono-exponential fit of the data. The mean ± s.e.m. and the median are displayed for each kinetic parameter. (B) Statistical comparison of deflection-gated mechanoelectrical transduction responses. For each individual cell, currents were binned in the indicated size ranges (in nm) and the current amplitudes within each bin averaged and then averaged across cells. Bins were tested for normal distribution and subsequently compared with a Student’s t-test (parametric data sets) or a Mann-Whitney test (non-parametrical data). The p values are shown for significant comparisons, ‘NS’ indicates no significant differences and ‘NA’ is shown when all measurements within a bin were equal to zero or data were not enough to perform the comparison. The number of compared points is shown in brackets. An ordinary two-way ANOVA was used to compare the cellular response over the range of stimuli, reported are the p value and F statistic (including DFn, DFd).
- https://doi.org/10.7554/eLife.21074.010
Figure 4—figure supplement 1
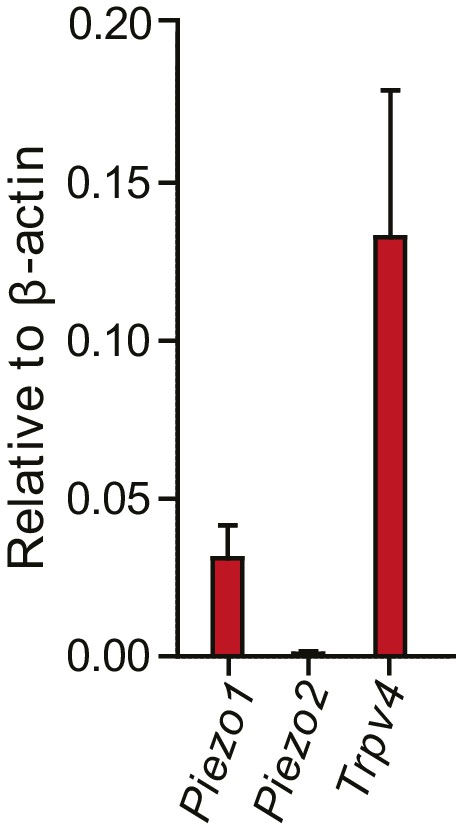
Normalized transcript levels of Piezo1, Piezo2 and Trpv4 in primary chondrocytes.
Knees and femoral heads were isolated from litters of C57Bl/6 mouse pups to obtain isolated chondrocytes. The chondrocytes from one litter were pooled to obtain mRNA, which was retro-transcribed to cDNA for RT-qPCR analysis. In these freshly-harvested chondrocytes, Piezo1 and Trpv4 transcripts were detected; however, Piezo2 was not reliably detected in our samples. The transcript levels were normalized against β-actin. n = 5 preparations.
Figure 5
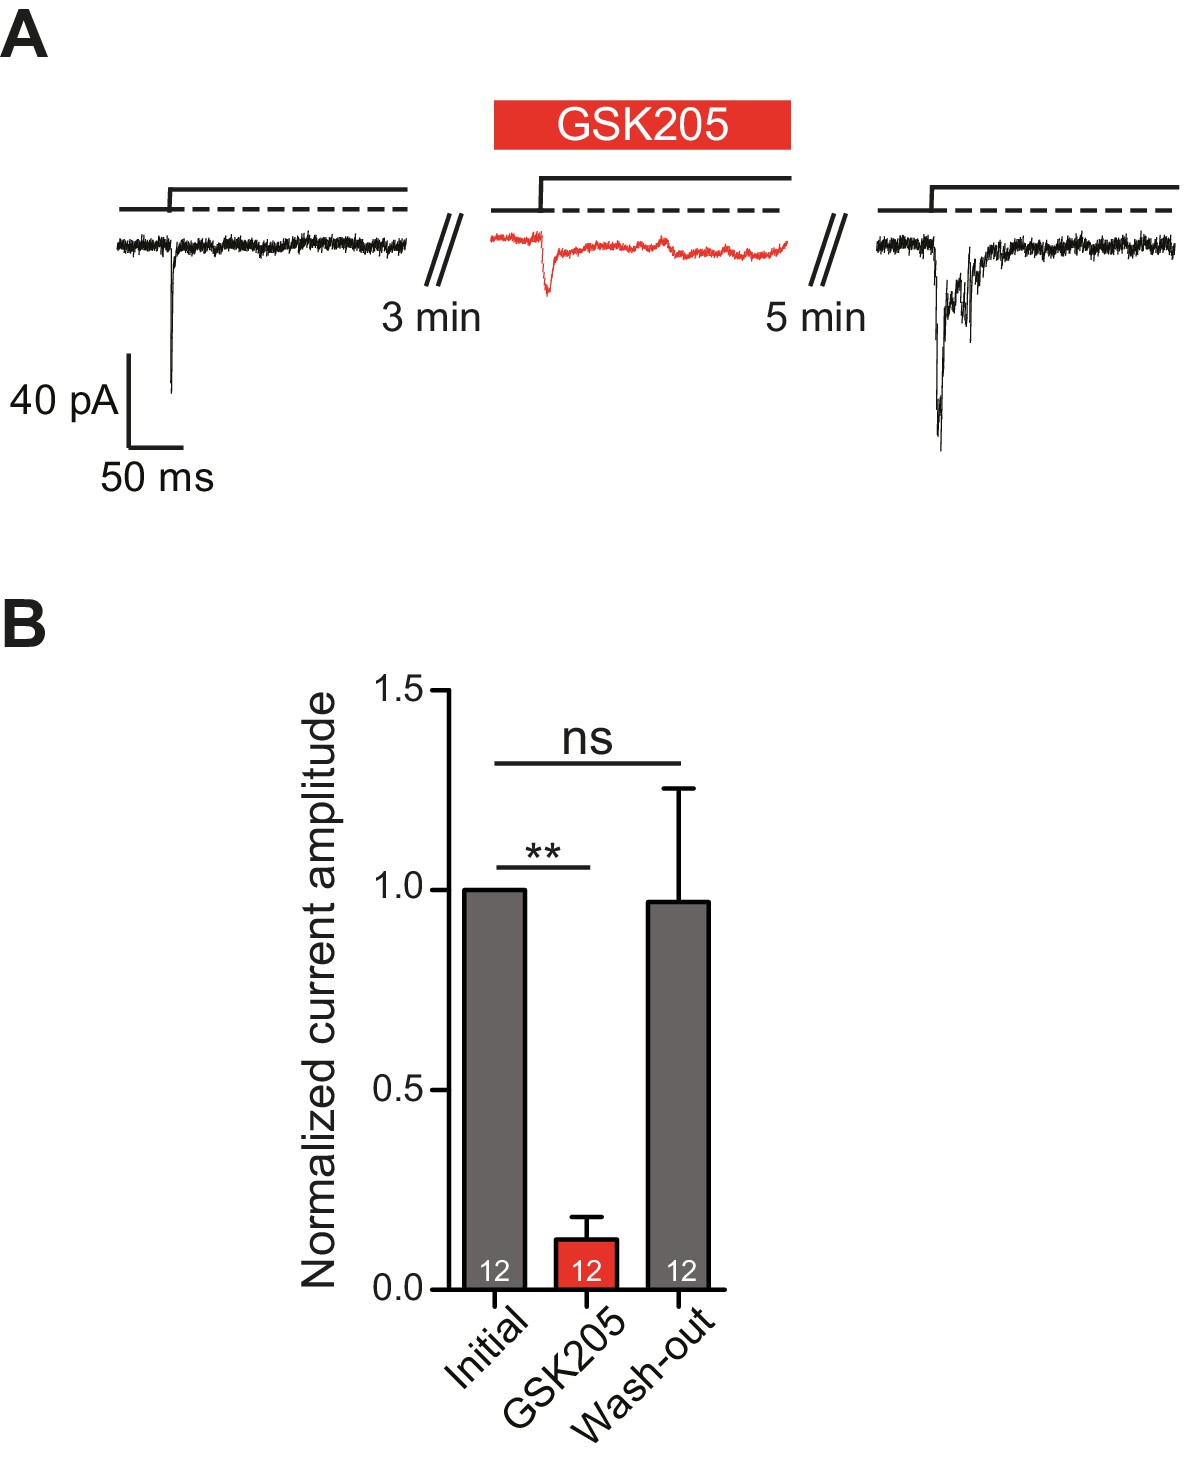
TRPV4 directly mediates deflection-gated currents in primary chondrocytes.
(A) Representative traces of currents gated by pillar deflections before, during and after the wash out of the TRPV4 antagonist GSK205 (10 µM, 3 min). (B) Quantification of the inhibition of the current during the GSK205 application, the current amplitude was normalized against pre-treatment currents. Data represent average of 12 measurements. (One-way ANOVA, matched measures with Dunnett’s post-hoc test for multibple comparisons. **p=0.01; ns = not significant).
Figure 6 with 2 supplements
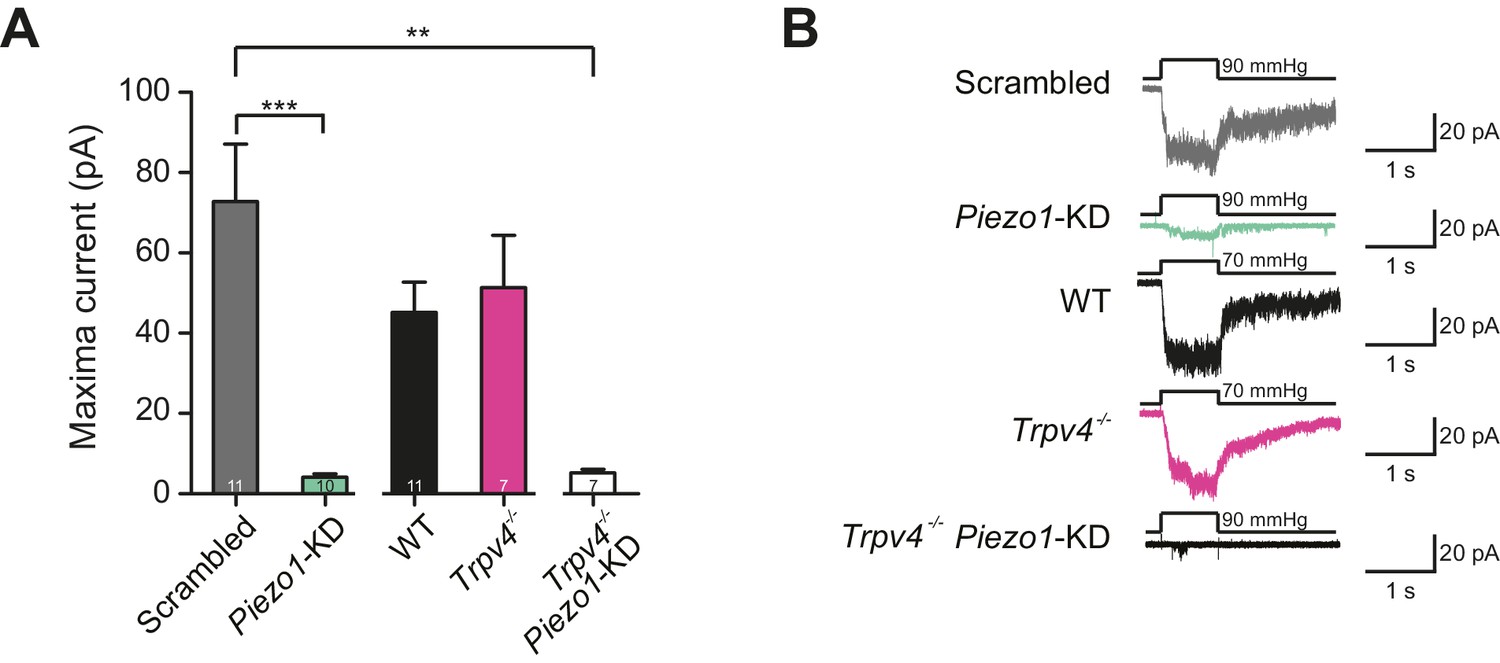
Murine chondrocytes display a stretch-sensitive current dependent on PIEZO1 but not TRPV4.
(A) Comparison of maximal current induced by membrane stretch in outside-out patches isolated from chondrocytes. HSPC experiments were performed in membrane patches isolated from chondrocytes that were either: WT transfected with scrambled miRNA, WT transfected with Piezo1-targeting miRNA, WT, Trpv4-/- or Trpv4-/- transfected with Piezo1-targeting miRNA. WT chondrocytes transfected with Piezo1-targeting miRNA display significantly smaller maximal current amplitudes than WT chondrocytes transfected with scrambled miRNA (n = 11 and 10 patches, respectively, unpaired Student’s t-test, ***p=0.0002). In contrast, peak current amplitude in Trpv4-/- chondrocytes was indistinguishable from that measured in WT chondrocytes. The treatment of Trpv4-/- chondrocytes with Piezo1-targeting miRNA led to a significant reduction in peak current amplitude compared to WT cells treated with scrambled miRNA (n = 7 and 11 patches, respectively, unpaired Student’s t-test, **p=0.002). Number of Trpv4-/--Piezo1-KD chondrocytes: 11 scrambled-miRNA; 10 Piezo1-miRNA; 11 WT; 7 Trpv4-/-; 7 Trpv4-/-: Piezo1-miRNA. (B) Example traces of currents measured using HSPC in outside-out patches.
-
Figure 6—source data 1
Statistical comparison of stretch-gated mechanoelectrical transduction in chondrocytes.
Chondrocytes were isolated from WT and Trpv4-/- mice, expanded, transfected (in the case of Scrambled and Piezo1 miRNA constructs) and encapsulated in alginate. For each condition, the number of litters, recorded membrane patches and maximal current (pA) are shown. Data are displayed as mean ± s.e.m. Conditions were compared with Student’s t-test (parametric data sets) and the p values are shown for significant comparisons, ‘NS’ indicates no significant.
- https://doi.org/10.7554/eLife.21074.014
Figure 6—figure supplement 1
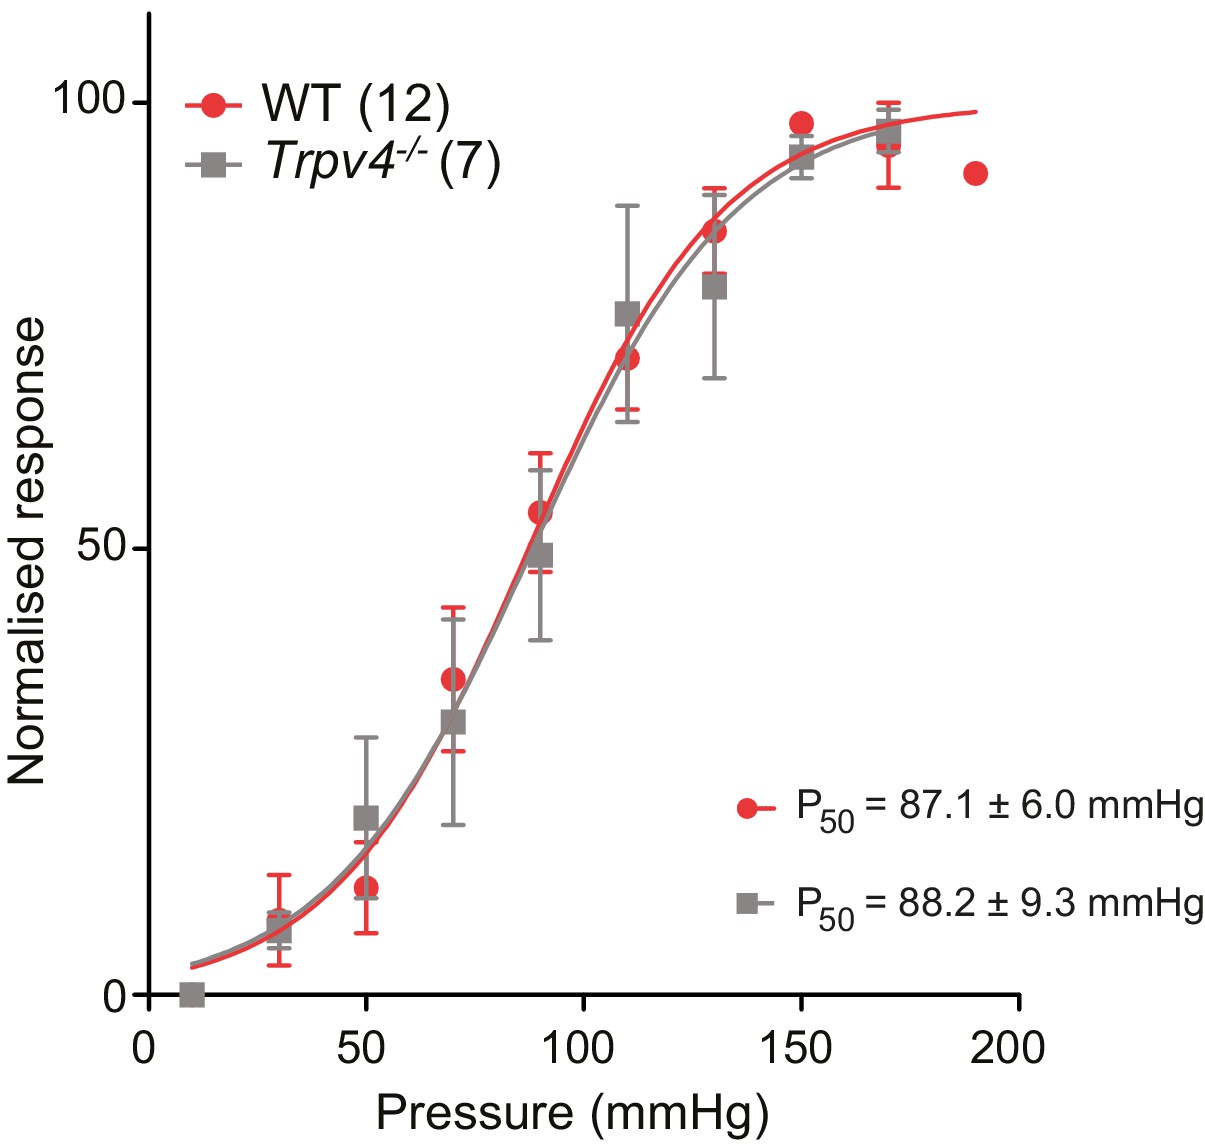
The P50 measured in WT and Trpv4-/- chondrocytes using HSPC is not significantly different.
Stimulus-response curves obtained from outside-out patches pulled from WT or Trpv4-/- chondrocytes and stimulated with positive pressure steps (10-150 mmHg). Individual normalized responses were pooled and averaged. Individual fits to a sigmoidial equation were averaged to obtain P50 values. The P50 for WT and for Trpv4-/- chondrocytes is 87.1 ± 6.0 mmHg (n = 12) and 88.2 ± 9.3 mmHg (n = 7) respectively. Data are presented as mean ± s.e.m.
Figure 6—figure supplement 2
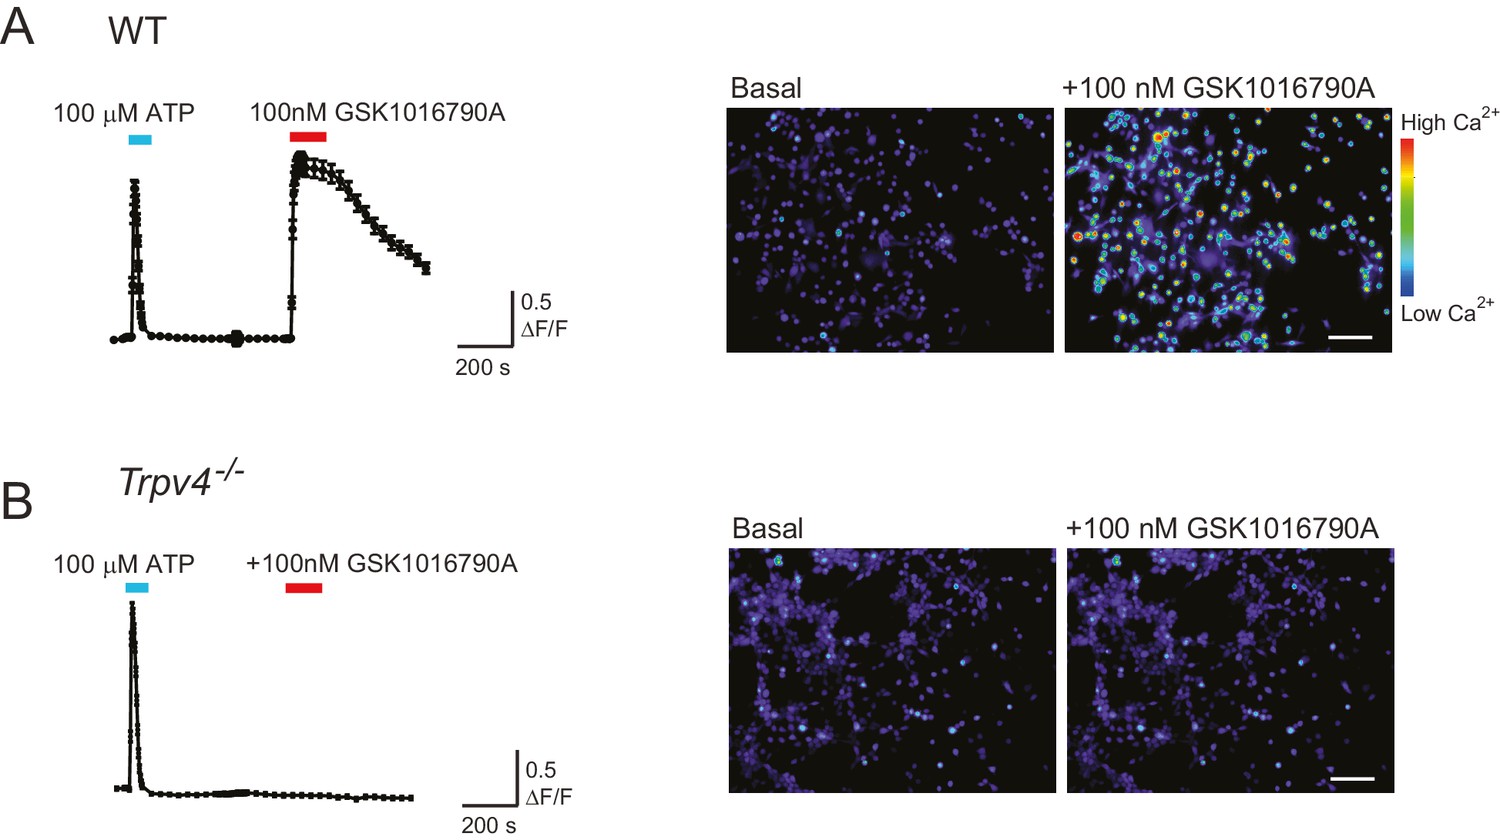
WT chondrocytes respond to the TRPV4 agonist GSK101 but not chondrocytes isolated from a Trpv4-/- mouse.
(A) WT chondrocytes respond to the application of TRPV4 agonist GSK1016790A (GSK101). Intensiometric epifluorescent imaging was used to demonstrate the presence of functional TRPV4 in WT, murine chondrocytes. Cells were loaded with the fluorescent calcium dye Cal520-AM, stimulated with ATP (100 μM, addition indicated by a cyan line) as a positive control to demonstrate viability and then treated with GSK101 (100 nM, application indicated by red line). The average ratio of fluorescence signal intensity: the ratio of the intensity of the fluorescence signal/baseline was plotted against time. The right panel displays example images of the fluorescence intensity before and during treatment with GSK101. n = 4 different preparations. Scale bar 50 μm. (B) Trpv4-/- chondrocytes do not respond to the addition of GSK101. Trpv4-/- chondrocytes were treated with ATP to confirm their viability and subsequently with GSK101; the average signal shows that the Trpv4-/- chondrocytes respond to ATP but not to the TRPV4 agonist (cyan line indicates the application of ATP to the sample and the red of GSK101). Example images are presented in the right hand panel. Scale bar 50 μm.
Figure 7 with 2 supplements

TRPV4 is efficiently gated by substrate deflections.
(A) HEK-293 cells were used as a heterologous system to test stretch- indentation- and deflection-mediated currents. In the left panel is a cartoon of the HSPC experiment (stretch), in the center, indentation and on the right of the pillar array experiment (deflection). (B) PIEZO1 is efficiently gated by membrane stretch, indentation and substrate deflection. Left panel: example trace of PIEZO1-mediated current in an HSPC experiment, center panel: example trace from indentation experiment, right panel: example trace of PIEZO1-mediated current activated by substrate deflection. (cyan) (C) TRPV4 is efficiently gated by substrate deflection. Left panel: example trace (black) of HSPC of TRPV4 in outside-out patches isolated from HEK-293 cells. Center panel: example trace from HEK-293 cells expressing TRPV4 in response to indentation. Right panel: TRPV4 activation by substrate deflections in HEK-293 cells.
Figure 7—figure supplement 1
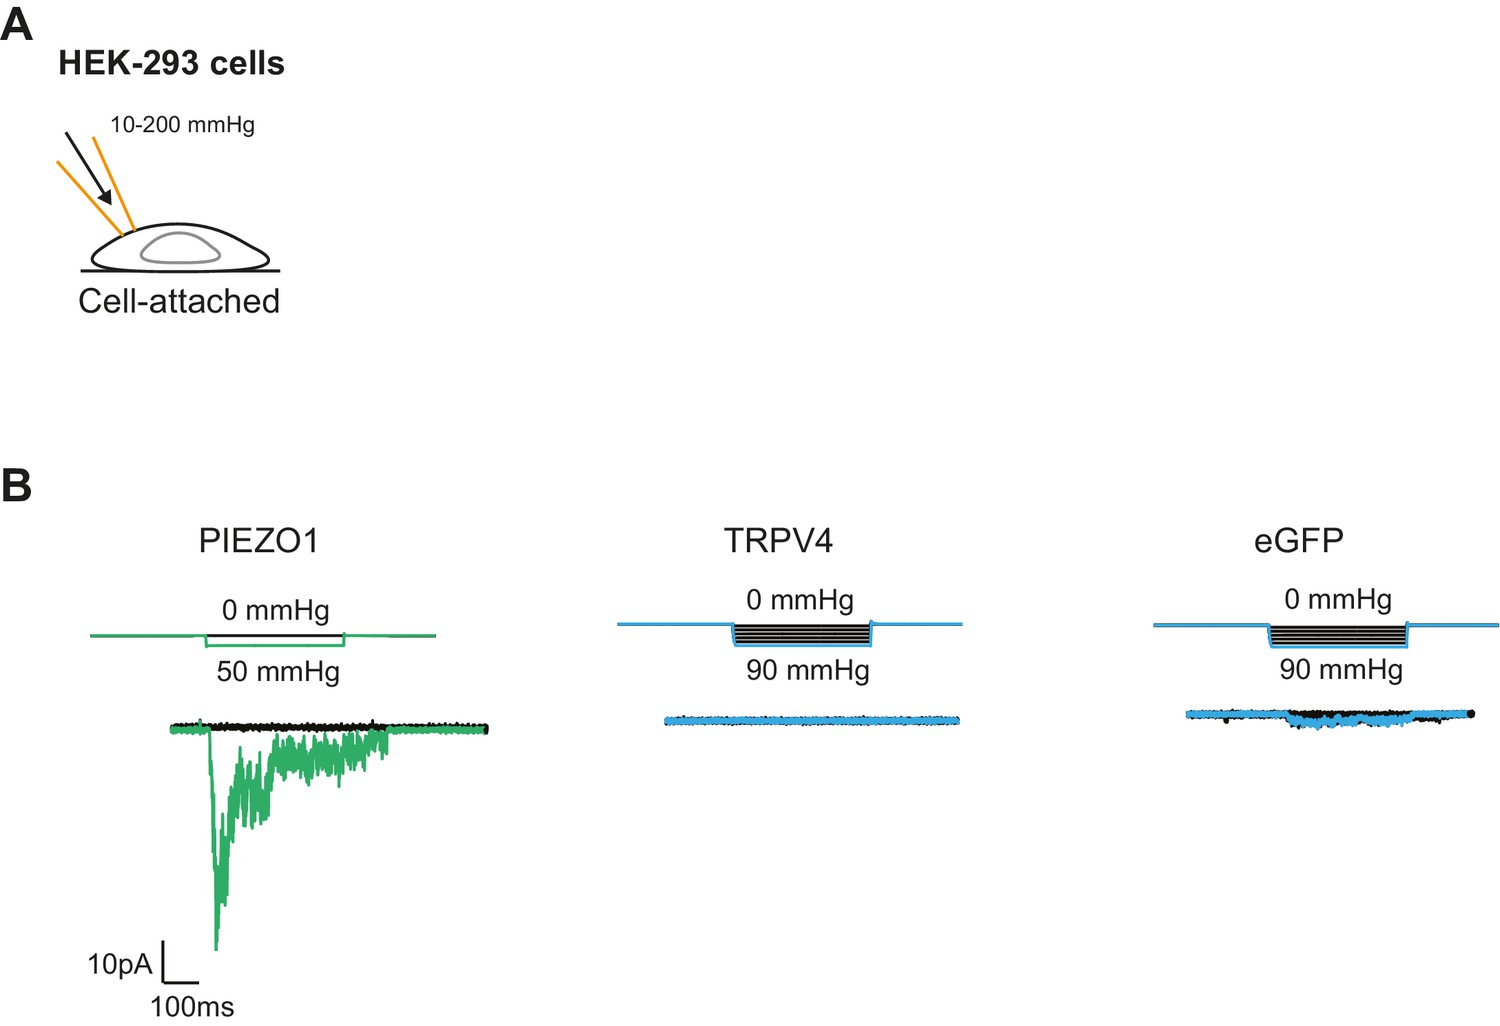
Mechanical stimulation of cell-attached patches in HEK-293 cells overexpressing PIEZO1 or TRPV4.
(A) Schematic of the cell-attached configuration together with the HSPC. (B) Example traces of mechanically gated currents elicited by HEK-293 cells expressing PIEZO1, TRPV4 or eGFP as a negative control. Membrane potential was held at −60 mV and pressure steps between 10 and 200 mmHg were applied. PIEZO1, n=6 cells; TRPV4, n=10 cells; eGFP, n=8 cells.
Figure 7—figure supplement 2
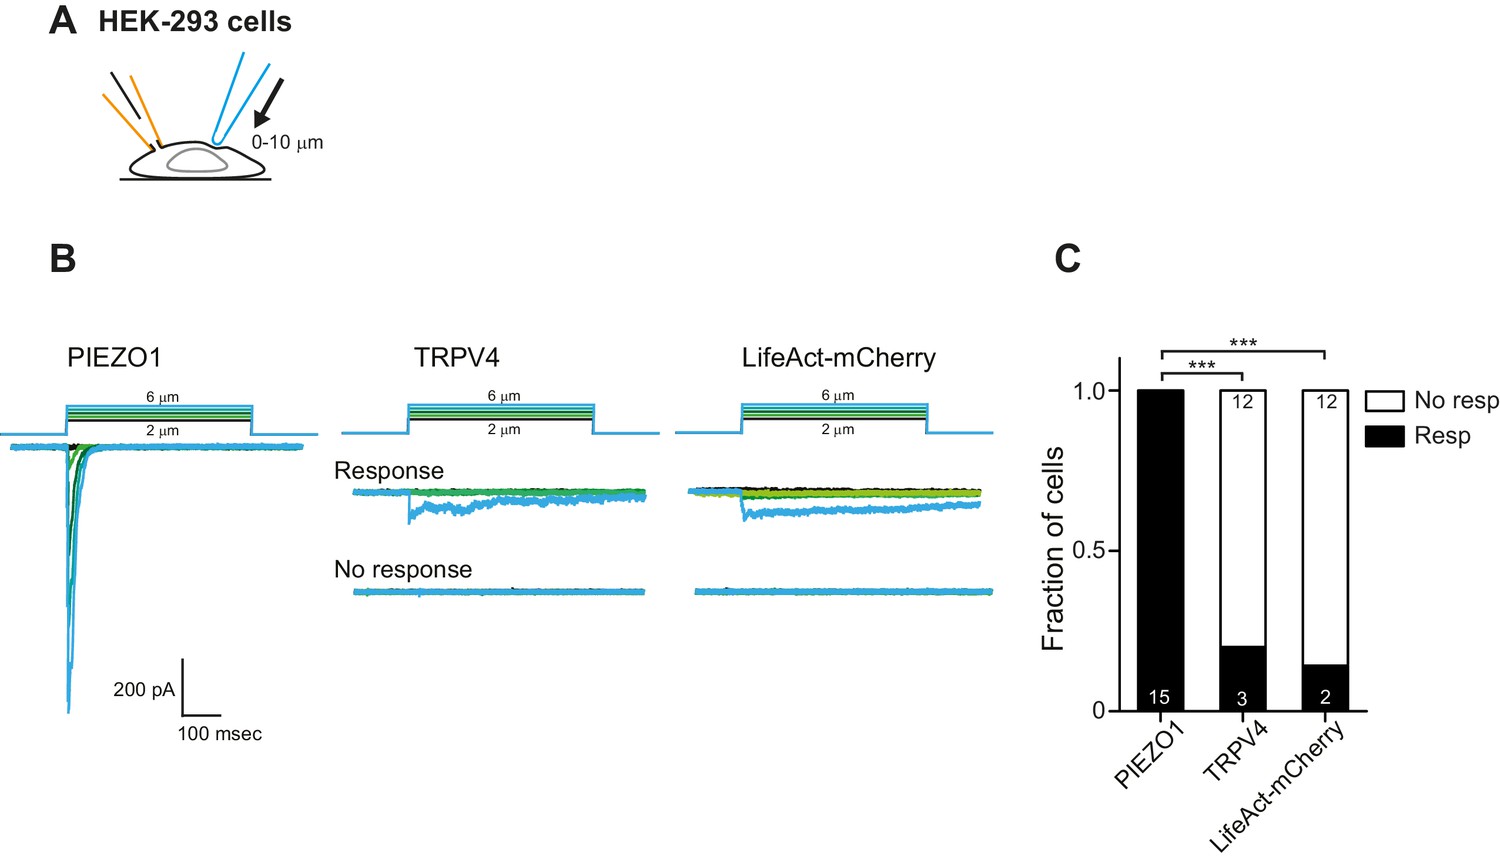
Mechanical indentation of HEK cells overexpressing PIEZO1 or TRPV4.
(A) Schematic of mechanical indentation in whole-cell patch clamp configuration. (B) Example traces of indentation-mediated currents from HEK-293 cells expressing PIEZO1, TRPV4 or LifeAct-mCherry as negative control. (C) Categorical plot of the number of cells that responded to the indentation stimuli with at least one current (Fisher’s exact test, ***p<0.0001).
Figure 8 with 1 supplement
Deflection-mediated activation of TRPV4.
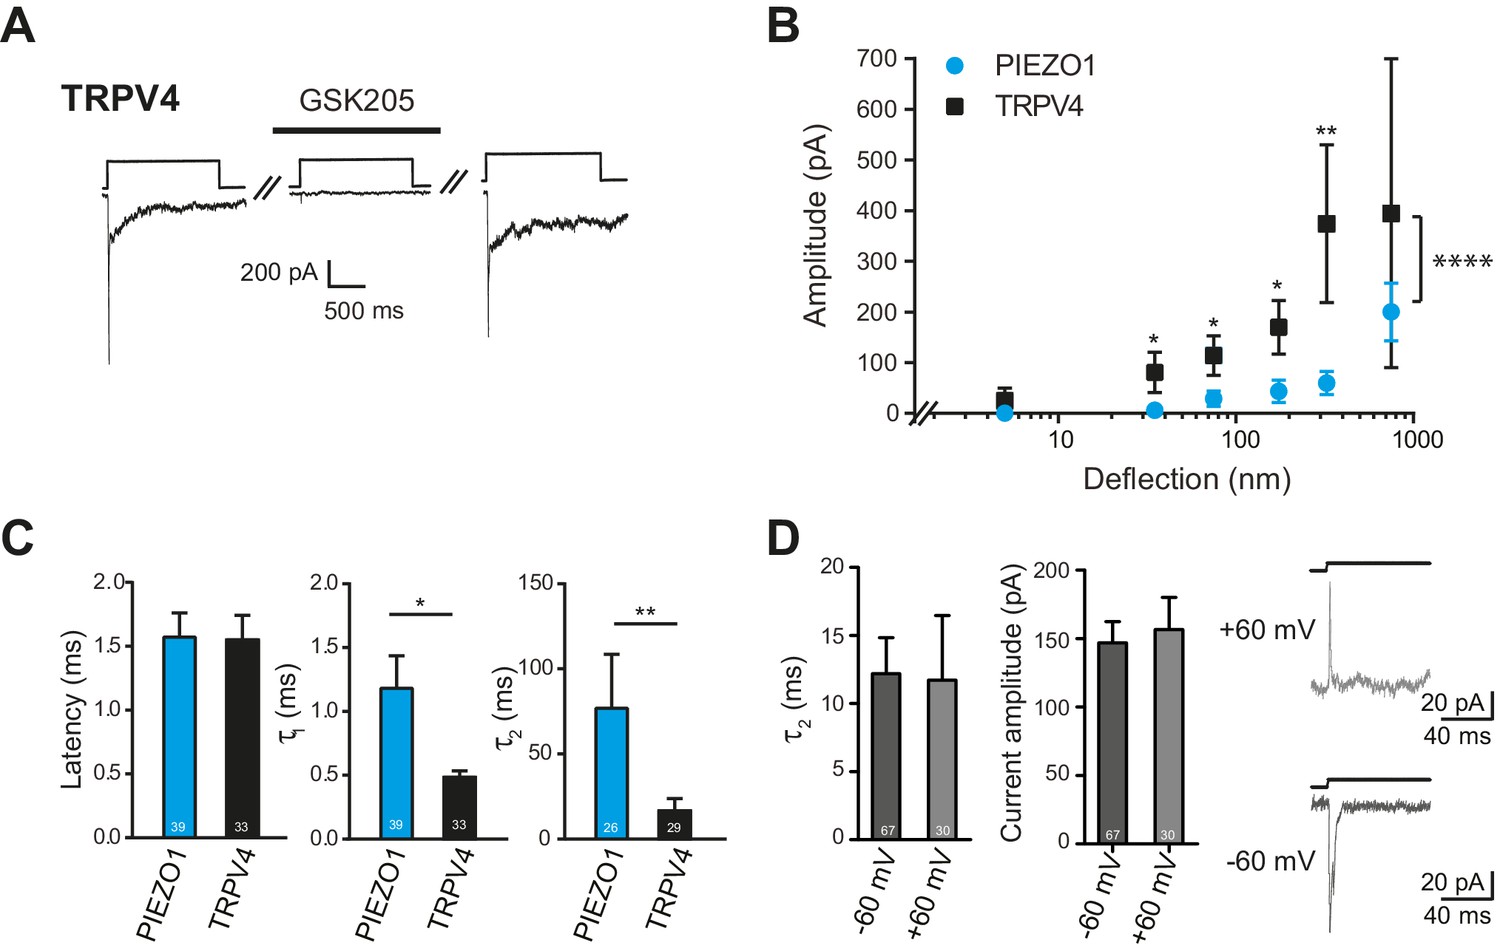
(A) The deflection-gated current observed in HEK-293 cells expressing TRPV4 is reversibly blocked by the TRPV4-specific antagonist, GSK205 (10 μM, 3 min) (B) TRPV4 is more sensitive to substrate deflections than PIEZO1, in HEK-293 cells. Stimulus-response plots of current amplitude vs the magnitude of pillar deflection demonstrates that with stimulus sizes of 10–50, 50–100, 100–250, 250–500 nm cells expressing TRPV4 (black squares) (n = 8 cells) respond with significantly larger current amplitude than cells expressing PIEZO1 (cyan circles) (n = 12 cells) (see source data for details). In addition, the TRPV4 response is significantly different to the PIEZO1 response (two-way ANOVA, ****p<0.0001). (C) The kinetics of the deflection-gated currents. No differences were observed in the latency of current activation. However, both current activation (τ1) and current decay (τ2) values were significantly faster for TRPV4-mediated currents than PIEZO1-mediated currents. (Student’s t-test; *p=0.04; **p=0.005). (D) Inactivation of TRPV4 at positive and negative potentials. Deflection stimuli were applied to HEK-293 cells expressing TRPV4 at – 60 mV and +60 mV. The current decay (τ2) and current amplitude values did not depend on the membrane holding potential (n = 67 currents, −60 mV; 30 currents, 60 mV; Mann-Whitney U test). Data collected from 16 cells over five experiments. Example traces are presented in the right hand panel.
-
Figure 8—source data 1
Electrophysiological characteristics of HEK-293 cells overexpressing either TRPV4 or PIEZO1.
(A) Electrophysiological characteristics of HEK-293 cells overexpressing either TRPV4 or PIEZO1. HEK-293 cells were transiently transfected with a plasmid encoding either TRPV4 or PIEZO1. For each condition the number of transfections, total number of recorded cells and number of stimuli are indicated. For each recorded current, the latency and the current amplitude were measured, and the activation time constant and current decay were obtained from a mono-exponential fit. Every kinetic parameter is shown as mean ± s.e.m. (B) Statistical comparison of deflection-gated mechanoelectrical transduction responses. For each individual cell, currents were binned in the indicated size ranges (in nm) and the current amplitudes within each bin averaged and then averaged across cells. Bins were subsequently tested for normal distribution and subsequently compared with a Student’s t-test (parametric data sets) or a Mann Whitney test (non-parametrical data). The p values are shown for significant comparisons, ‘NS’ indicates no significant differences. The number of compared points is shown in brackets. An ordinary two-way ANOVA was used to compare the cellular response over the range of stimuli, reported are the p value and F statistic (including DFn, DFd).
- https://doi.org/10.7554/eLife.21074.021
Figure 8—figure supplement 1
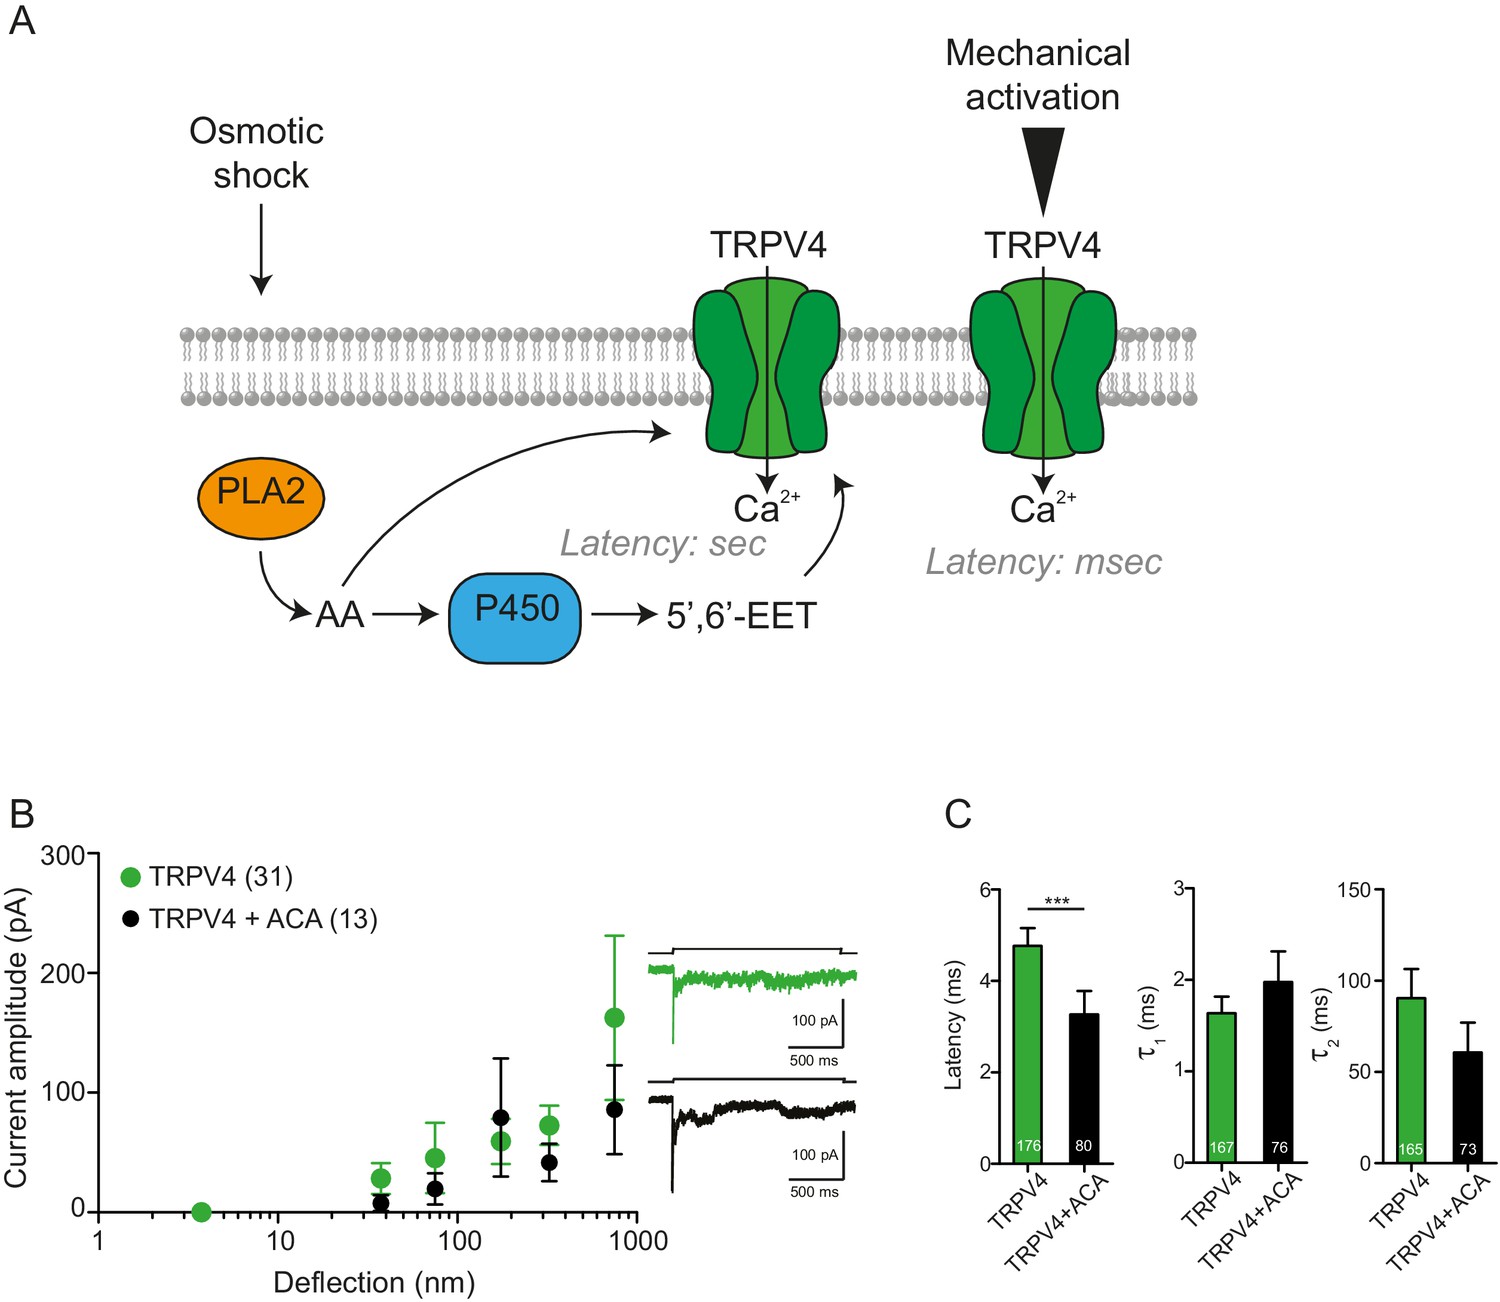
PLA2 is not involved in the activation by pillar-deflection of TRPV4
(A) Scheme of the TRPV4 signaling pathway activated after hypotonic stress compared with TRPV4 activation by pillar displacement. After the hypotonic change, PLA2 produces arachidonic acid (AA), which can activate TRPV4. Subsequently, AA is used as a substrate by the P450 epoxygenase to produce 5’,6’-EET, which also activates TRPV4. This activation takes place in seconds. On the right side of the panel, TRPV4 activation by pillar deflections is shown; in this case, the latency of activation is in the milliseconds range. (B) N-(p-Amylcinnamoyl)anthranilic acid (ACA) does not inhibit the activation of mechanically gated currents triggered by pillar deflections. Stimulus-response graphs of HEK cells overexpressing TRPV4 (green circles) compared with TRPV4 in the presence of ACA (black circles, at least 3 min of incubation after breaking through the cell; 20 μM in the intracellular solution). On the right panel, example traces of the mechanically gated currents are shown. (C) Kinetics of the deflection-gated currents from B. The kinectics were compared using Mann-Whitney test.
Author response image 1
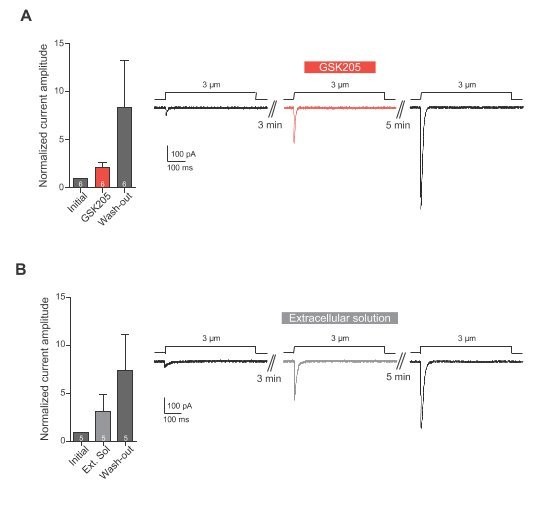
(A) Indentation of Neuro2A cells. Neuro2A cells were indented using a glass probe and resulting mechanically-gated currents were monitored using whole-cell patch-clamp. Indentation stimuli were applied before, during and after application of GSK205 (10 µM, 3 min; washout 5 min). Current amplitudes were normalised against pre-treatment currents. (B) Indentation experiments were repeated on cells treated with Extracellular solution instead of GSK205. Data represents average ± s.e.m., n = 6 cells (GSK205) vs 5 cells (negative control), from two separate experiments.
Download links
A two-part list of links to download the article, or parts of the article, in various formats.
Downloads (link to download the article as PDF)
Open citations (links to open the citations from this article in various online reference manager services)
Cite this article (links to download the citations from this article in formats compatible with various reference manager tools)
Direct measurement of TRPV4 and PIEZO1 activity reveals multiple mechanotransduction pathways in chondrocytes
eLife 6:e21074.
https://doi.org/10.7554/eLife.21074


