Lineage commitment of embryonic cells involves MEK1-dependent clearance of pluripotency regulator Ventx2
- Aix Marseille Univ, CNRS, France
Figures
Figure 1 with 2 supplements
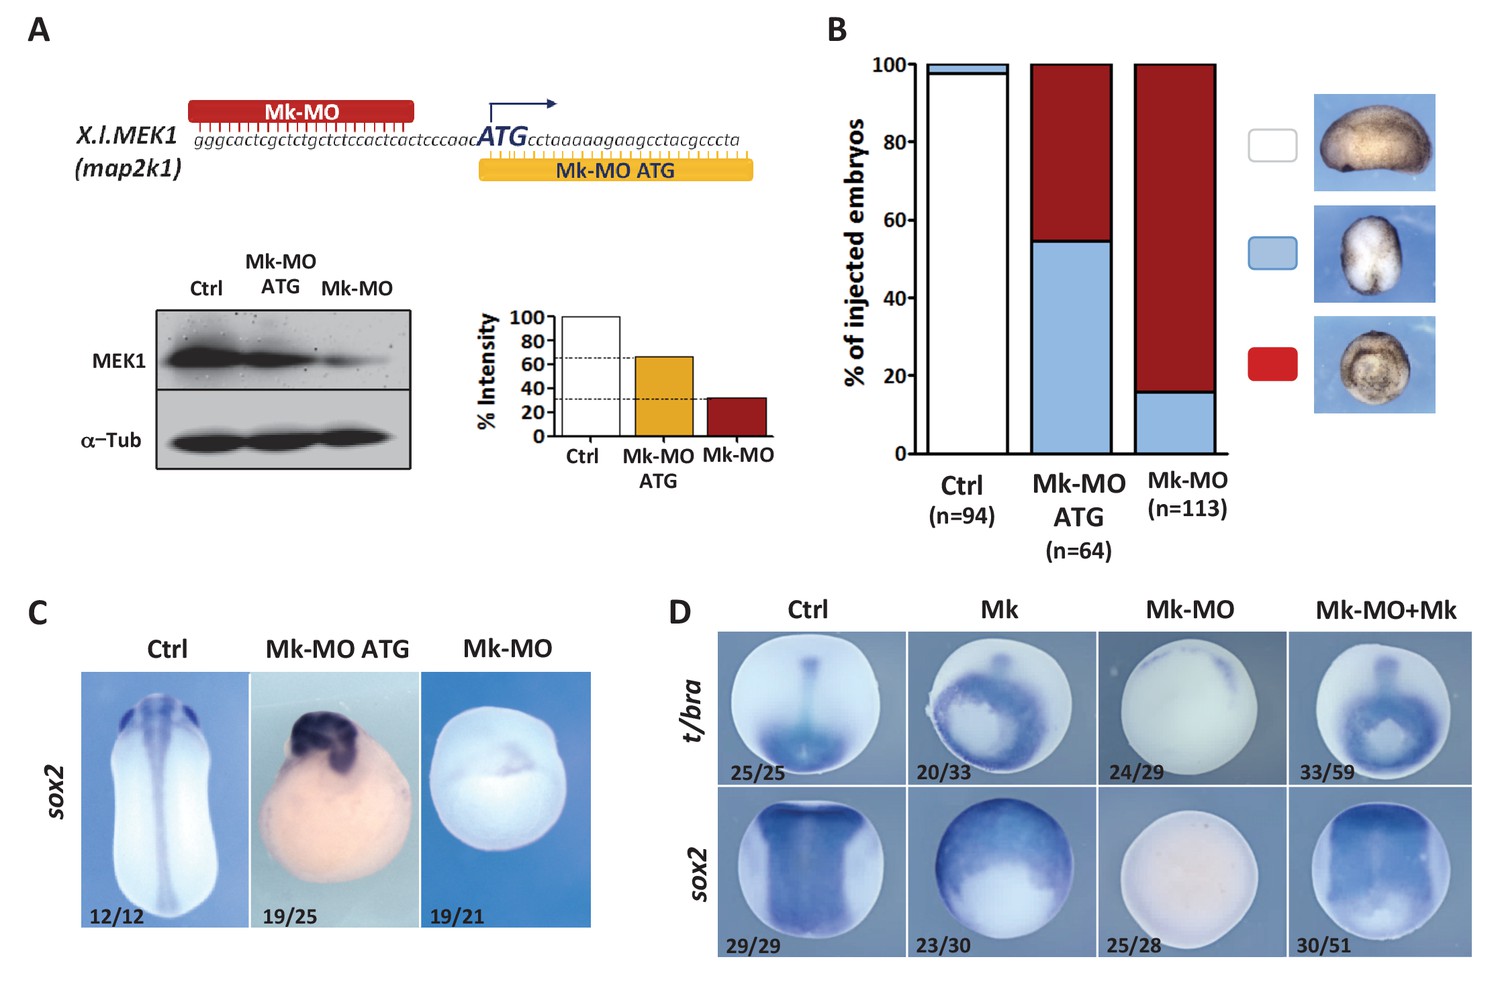
MEK1 depletion impairs embryonic development.
(A) Mk-MO and Mk-MO ATG were designed to target MEK1 translation. Western blot analysis of blastula stage nine embryos injected with 25 ng per blastomere of either MO at the 4 cell stage revealed reduced MEK1 translation. α-Tubulin was used as a loading control. Control embryos were uninjected. The histogram shows the normalized intensity of MEK1 signals relative to control. (B) Embryos were injected as in (A) and morphology was analyzed at tailbud stage. (C) Embryos injected as in (A) were stained with Sox2 probe to highlight defective axis formation and neural tissue differentiation. (D) Embryos were injected at the 2 cell stage with 25 ng Mk-MO per cell, and at the 4- cell stage with 400 pg of mammalian MEK1 (Mk) RNA per cell and processed for WISH analysis at late gastrula stage 13 with t/bra probe to highlight the mesoderm (dorso-vegetal view) and with sox2 to highlight the neurectoderm (dorsal view). In C and D, the number of embryos exemplified by the photograph over the total number of embryos analyzed is indicated.
Figure 1—figure supplement 1
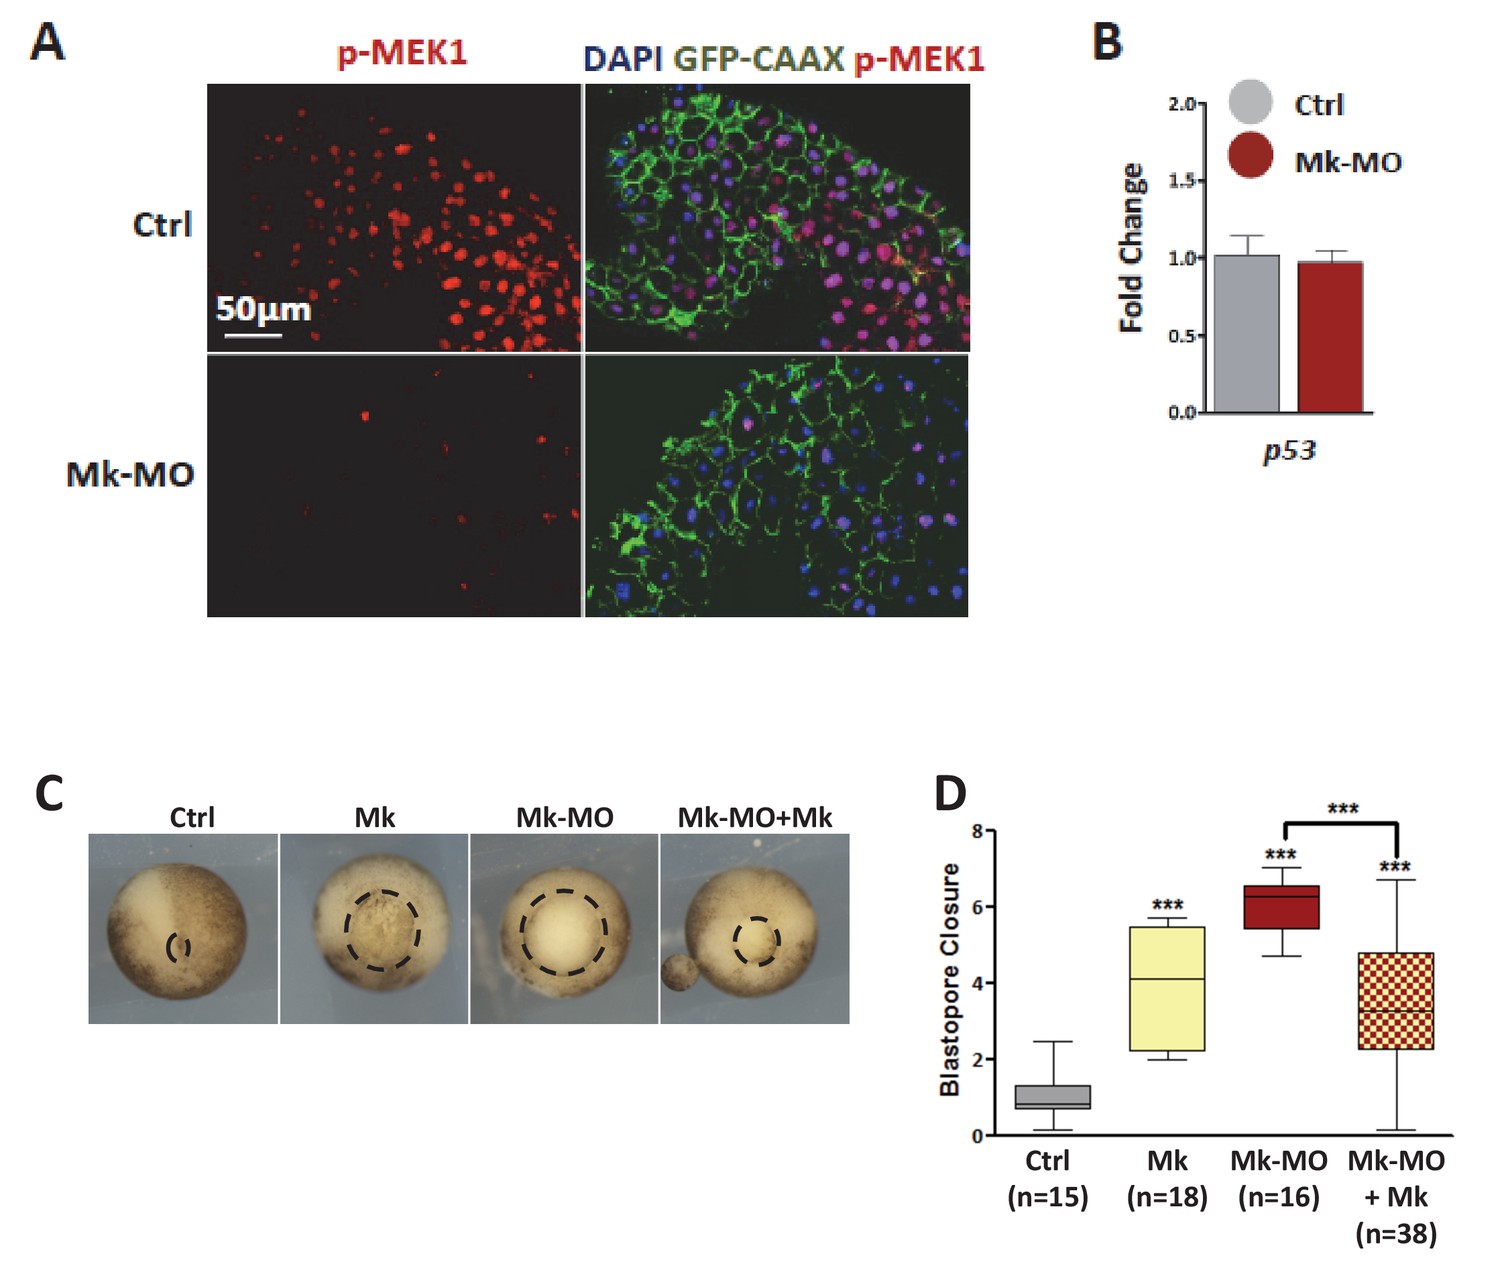
MEK1 depletion by morpholinos.
(A) Four-cell embryos were injected in each blastomere with 50 pg GFP‐CAAX mRNA with or without 25 ng Mk-MO, fixed at blastula stage 9, cryosectioned and stained with anti-phospho-MEK1 antibody. The pMEK1 signal was severely reduced or lost in cells injected with Mk-MO. (B) Four-cell embryos were injected in each cell with 25 ng Mk-MO, collected at early gastrula stage 10.5 and processed for RT-qPCR to quantify p53 expression levels. Mk‐MO did not induce p53 expression. (C) Two-cell embryos were injected twice with 25 ng Mk-MO in each blastomere, followed by injection at 4 cell stage of hamster MEK1 mRNA (Mk; 400 pg per blastomere). In order to score progress through gastrulation pictures were taken from live stage 13 gastrula embryos (vegetal view). (D) Blastopore closure was scored by calculating the ratio of blastopore diameter of injected embryos to the mean of blastopore diameter of uninjected control embryos. Bars represent maximum and minimum values, and lines represent the mean. The number of embryos analyzed in each condition is displayed on the graph. For statistical analysis, samples were compared by Mann-Whitney test (99% confidence intervals were applied; ***p≤0.0001).
-
Figure 1—figure supplement 1—source data 1
Values of blastopore closure ratios.
Details are shown in Figure 1—figure supplement 1 and Materials and methods.
- https://doi.org/10.7554/eLife.21526.004
Figure 1—figure supplement 2
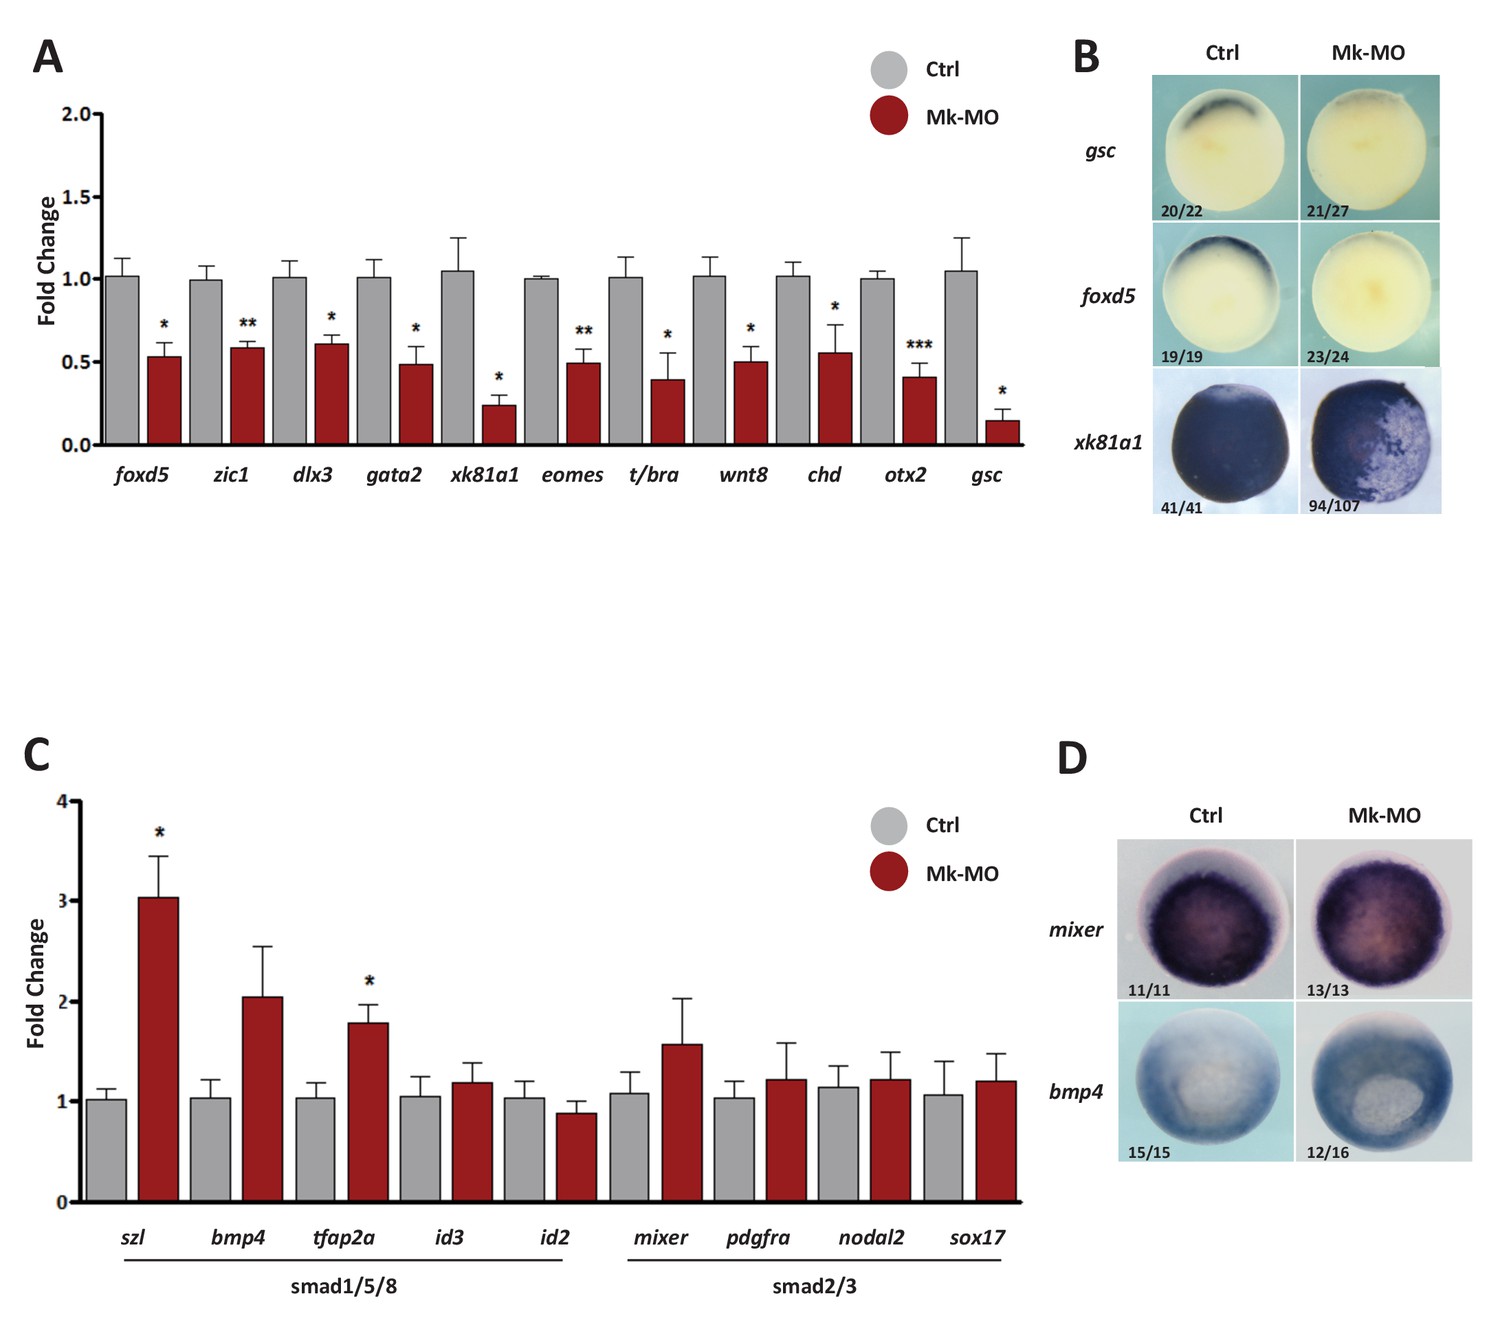
Gene expression analysis of MEK1-depleted gastrula embryos.
(A–D) Four-cell embryos were injected in each blastomere with 25 ng Mk-MO, collected at early gastrula stage 10.5 and processed for RT-qPCR to quantify changes in the expression levels of pro-differentiation markers (A), or changes in the expression levels of BMPs (Smad1/5/8) and Activin/Nodal (Smad2/3) signaling targets (C). For all qPCR graphs, error bars represent s.e.m. values of four independent experiments with two technical duplicates. For statistical analyses, samples from injected embryos were compared with samples from uninjected control embryos by Unpaired Student’s t-test. *p<0.05, **p<0.005, ***p<0.0001. (B,D) Some embryos from the same experiment were processed for WISH with the indicated probes. Note that embryos stained for xk81a1 (epidermis) were injected with 25 ng Mk-MO in one ventral animal blastomere at 16-cell stage and collected at late gastrula stage 13. In B and D, the number of embryos exemplified by the photograph over the total number of embryos analyzed is indicated.
Figure 2 with 2 supplements
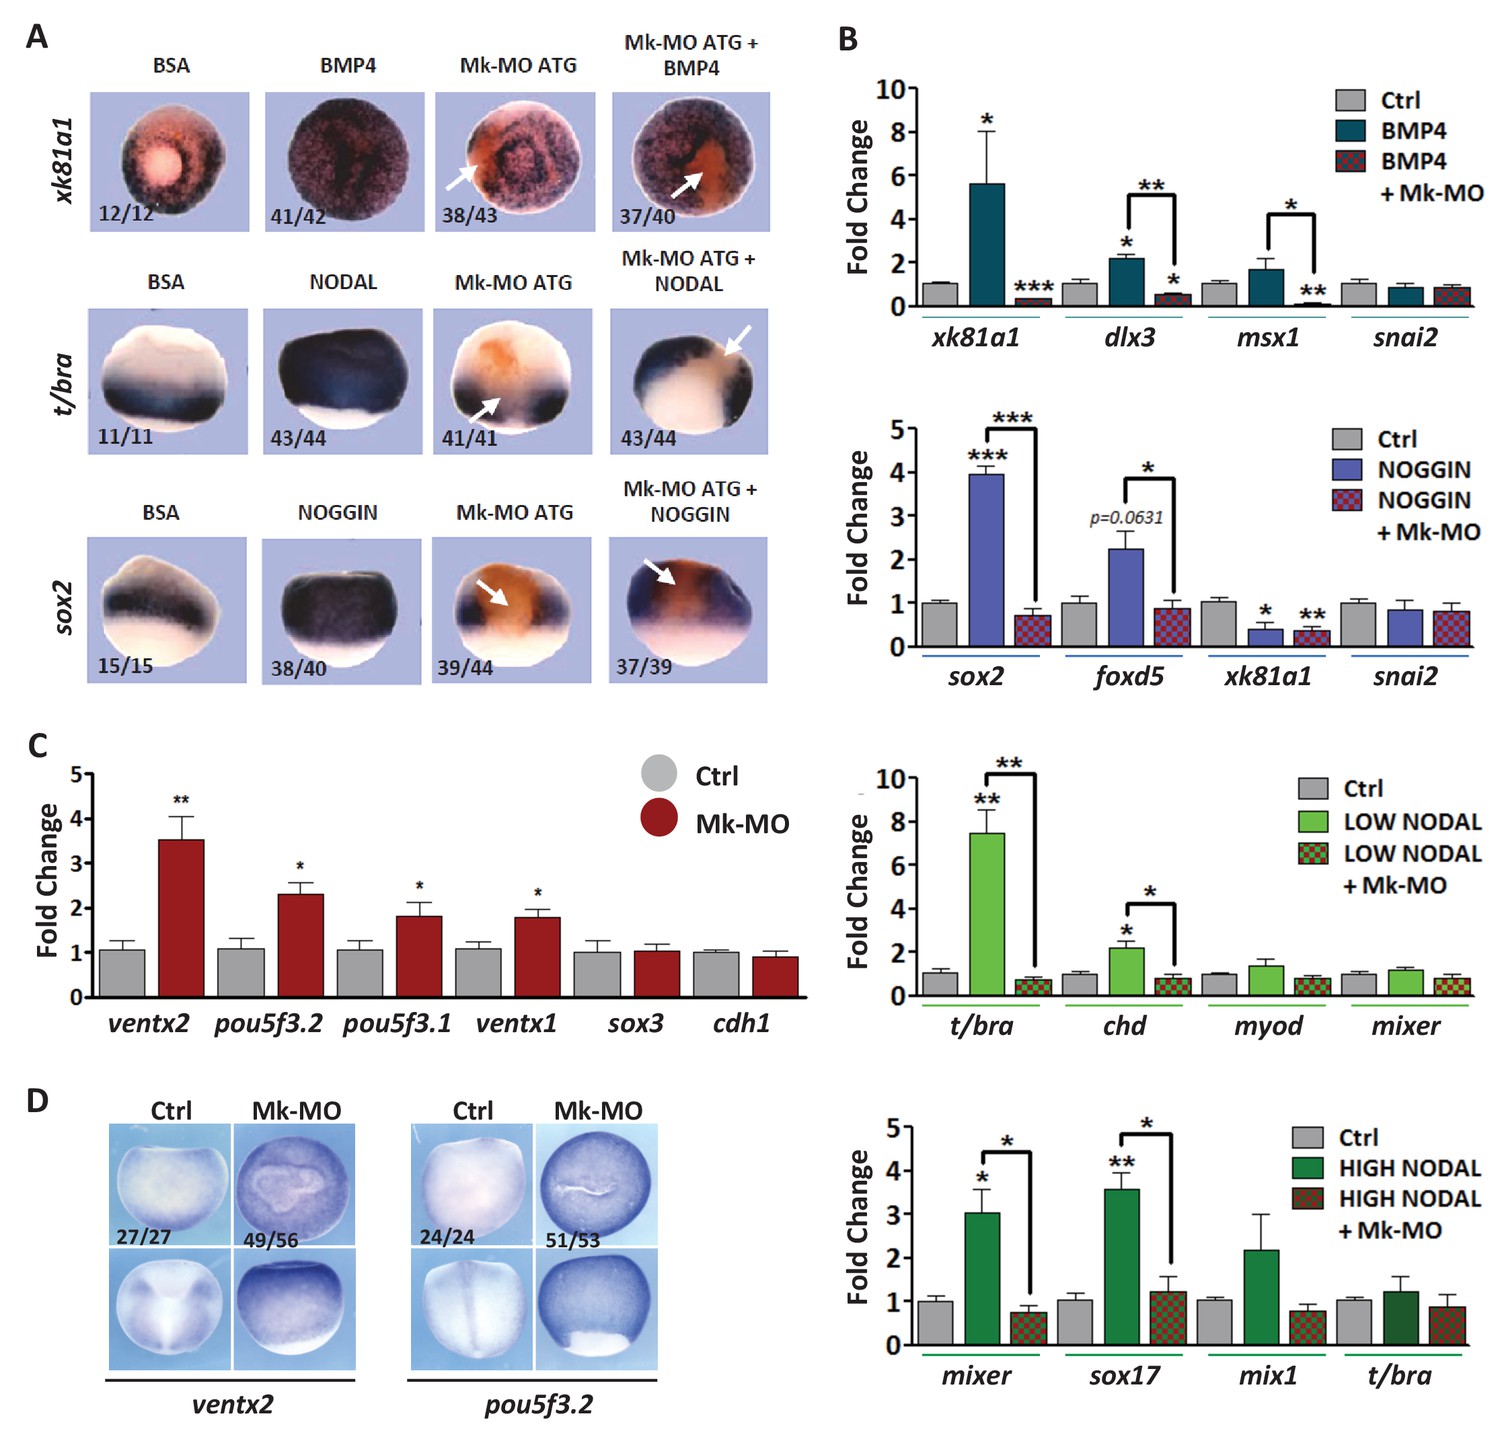
MEK1 depletion affects cell competence to exit pluripotency and enter into differentiation.
(A) Sixteen-cell embryos were injected in one animal blastomere with 25 ng Mk-MO ATG and 2.5 ng FLDX. Next, these embryos were injected at blastula stage 8.5 with recombinant BMP4 (2 ng), NODAL (10 ng), or NOGGIN (36 ng) proteins into the blastocoele, collected at early gastrula stage 10.5, and processed for WISH with xk81a1 (epidermis, animal view), t/bra (mesoderm, lateral view), and sox2 (neural tissue, dorsal view). FLDX (orange staining) was used to trace Mk-MO injected cells (white arrows). (B) Four-cell embryos were injected with 25 ng Mk-MO per blastomere, animal caps were explanted at blastula stage 8.5 and cultured in the presence of 20 ng/ml BMP4, 100 ng/ml NOGGIN, 20 ng/ml NODAL (low), or 200 ng/ml NODAL (high) until late gastrula stage 13, and processed for RT-qPCR. (C) Four-cell embryos were injected with 25 ng Mk-MO per blastomere, collected at stage 10.5 and processed for RT-qPCR. (D) Embryos injected as in (C) were processed for WISH analysis at late gastrula stage 13 with pou5f3.2 (oct25) and ventx2 probes. a: animal view; v: ventral view; l: lateral view; d: dorsal view. For all qPCR graphs, error bars represent s.e.m. values of four independent experiments with two technical duplicates. For statistical analyses, samples were compared with the respective control by Unpaired Student’s t-test. *p<0.05, **p<0.005. ***p<0.0001. In A and D, the number of embryos exemplified by the photograph over the total number of embryos analyzed is indicated.
Figure 2—figure supplement 1
Neural induction in vivo depends on MEK1 activity.
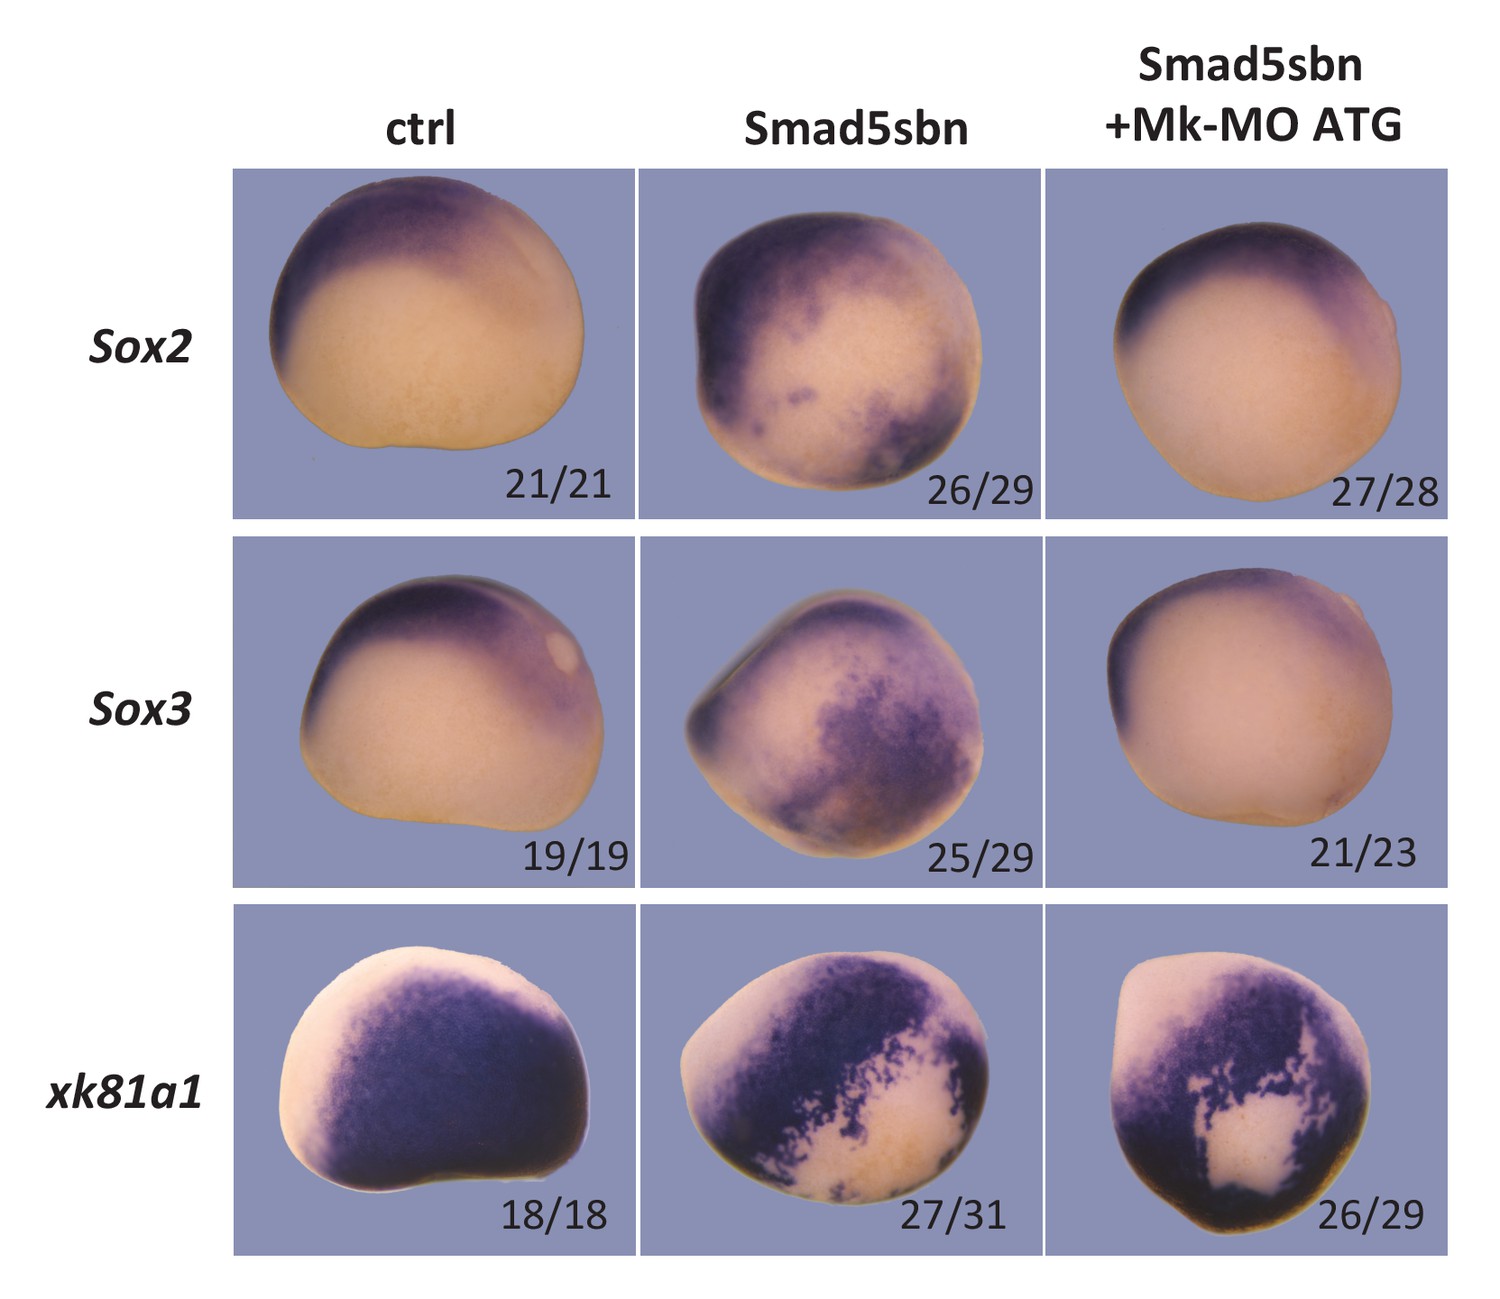
Sixteen-cell embryos were injected in one ventral-animal blastomere with 3 ng of dominant-negative Smad5 (Smad5sbn) mRNA and 25 ng Mk-MO ATG, as indicated. Embryos were fixed at late gastrula stage 13, and processed for WISH with the indicated probes. The number of embryos exemplified by the photograph over the total number of embryos analyzed is indicated. Lateral views.
Figure 2—figure supplement 2
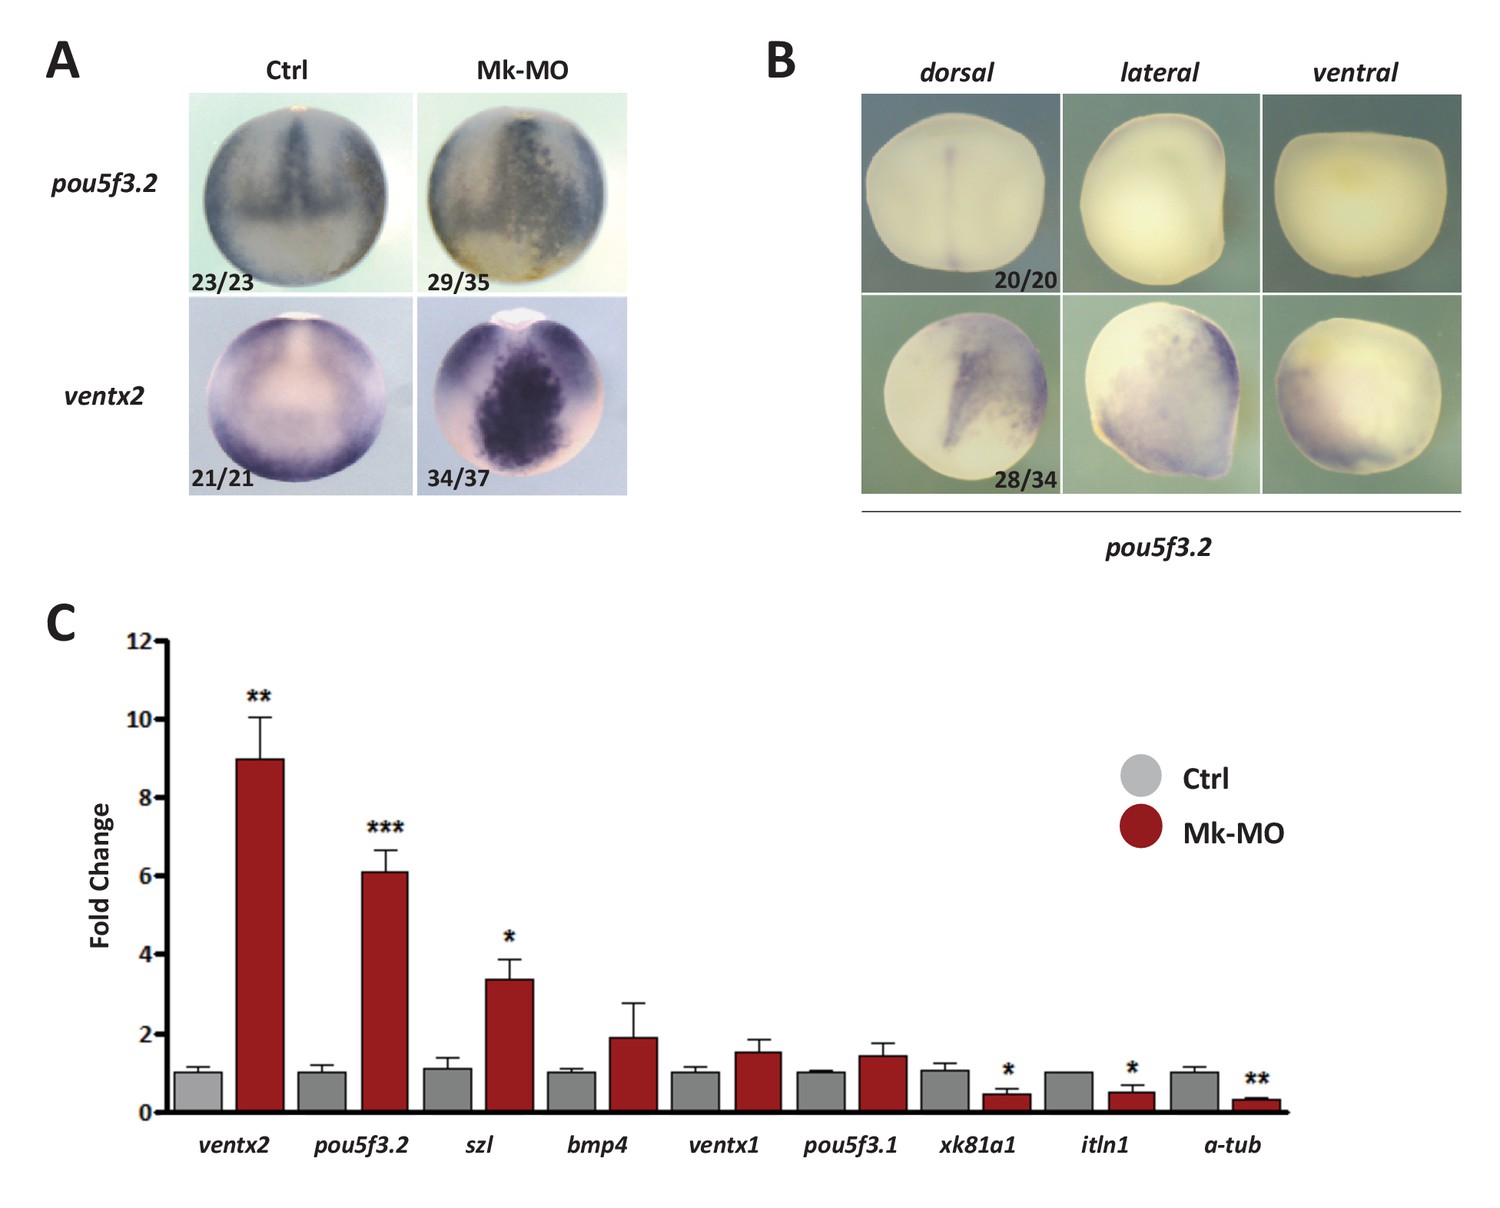
MEK1 is required to inhibit the expression of the pluripotency genes pou5f3.2 and ventx2.
(A) Embryos injected with 25 ng Mk-MO at 16-cell stage in one animal dorsal blastomere were grown until late gastrulation stage 13 and processed for WISH with pou5f3.2 and ventx2 probes. (B) Embryos injected with 25 ng Mk-MO at 16 cell stage in one animal ventral blastomere were grown until mid-neurula stage 18 and processed for WISH with pou5f3.2 probe. (C) Four-cell embryos were injected in each blastomere with 25 ng Mk-MO and grown until blastula stage 9, when animal caps were isolated, cultured in vitro until late gastrula stage 13 and then processed for RT-qPCR. In A and B, the number of embryos exemplified by the photograph over the total number of embryos analyzed is indicated.
Figure 3 with 1 supplement
MEK1 is required for Ventx2 clearance and asymmetric distribution during cell division.
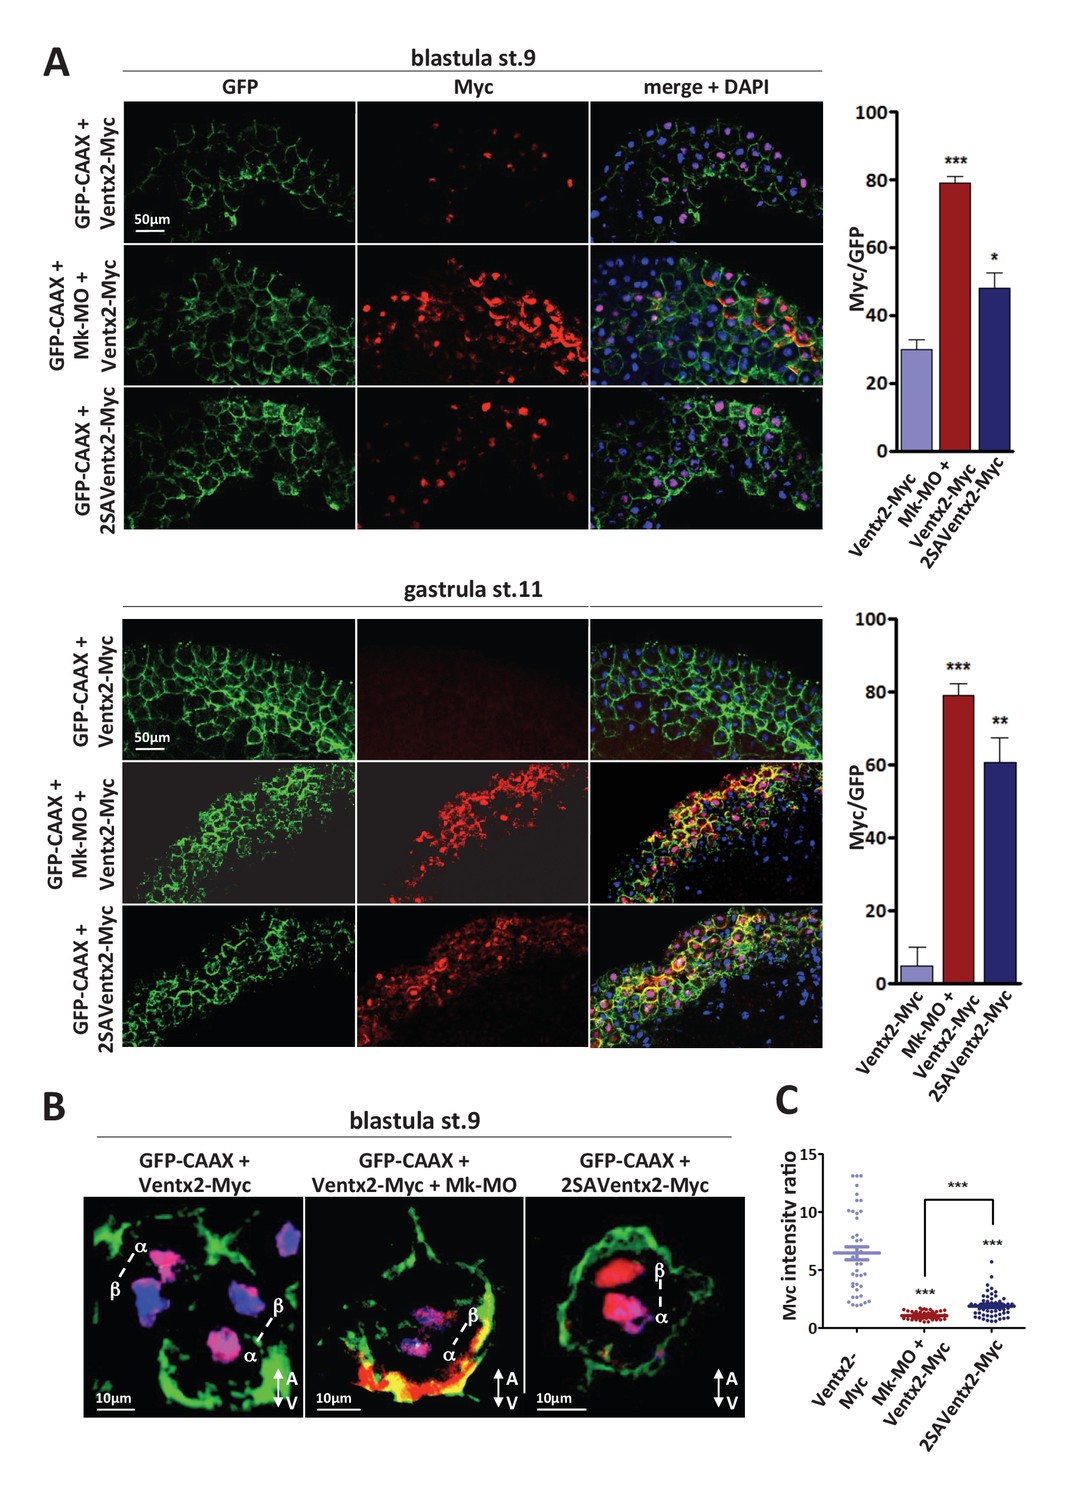
(A,B) Four-cell embryos were injected in each cell with 50 pg GFP-CAAX, 50 pg Ventx2-Myc, 50 pg 2SAVentx2-Myc RNAs, and 25 ng Mk-MO, as indicated. Embryos were fixed at blastula stage 9, or gastrula stage 11, cryosectioned and processed for anti-Myc (red), and anti-GFP (green) immunostaining, and DNA was stained with DAPI (blue). Graphs show the percentage of Myc positive nuclei (DAPI positive) over the total number of injected cells (GFP positive) from four independent experiments. (B) 3D reconstruction of confocal slices of mitotic Myc positive nuclei labeled by DAPI from stage nine sectioned embryos. Sister mitotic chromosomes are referred to as α (more intense Myc staining), and β (less intense Myc staining). The A-V arrows indicate the animal-vegetal axis. Note the asymmetric cortical Ventx2-Myc signal in the MEK1 morphant cell. (C). The graph shows the ratios of Myc signal intensity betweenα and β sister nuclei.
-
Figure 3—source data 1
Myc signal intensity ratios between daughter nuclei.
Each value corresponds to the ratio calculated from one individual confocal slice between α and β daughter nuclei (see legend to Figure 3 and Materials and methods for further details).
- https://doi.org/10.7554/eLife.21526.010
Figure 3—figure supplement 1
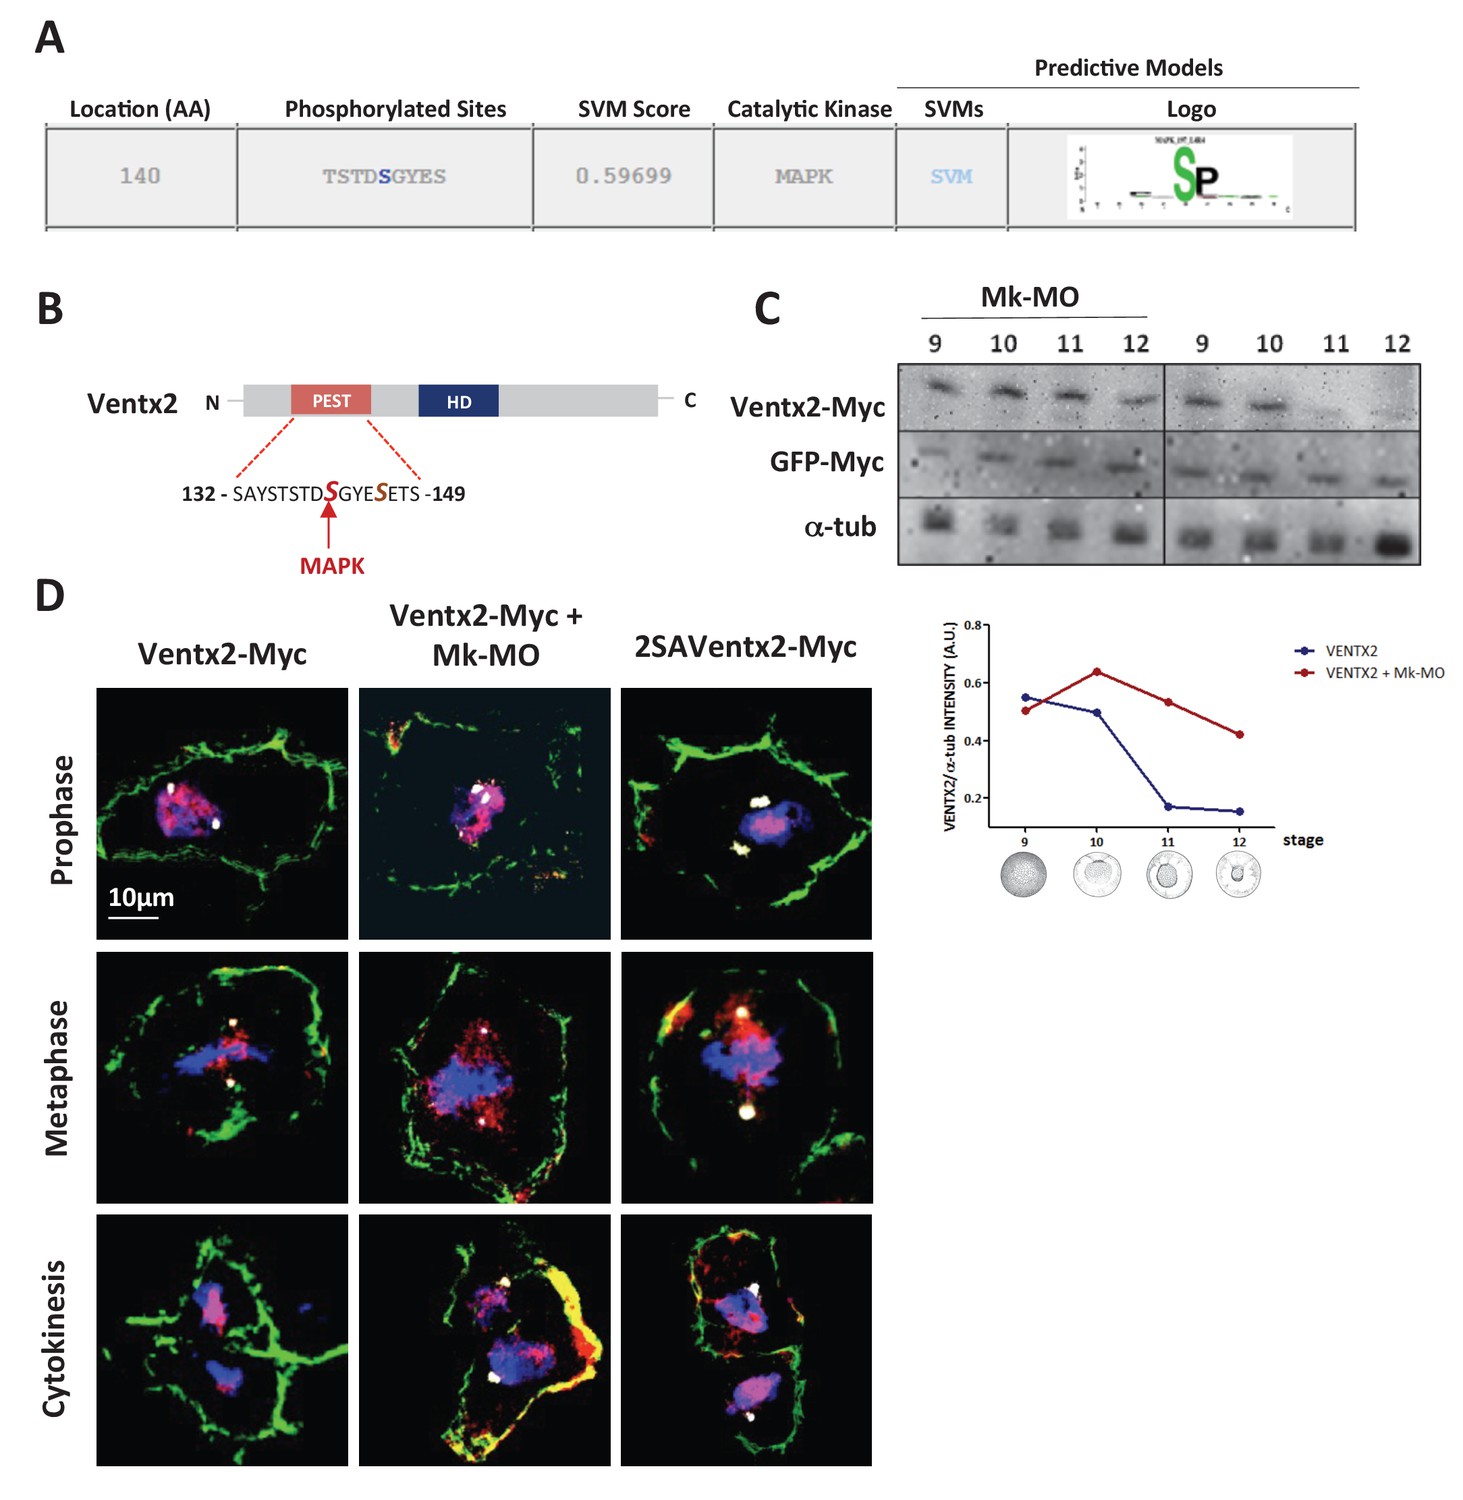
Ventx2 degradation and asymmetric distribution require MEK1 activity.
(A) In silico analysis of phosphorylation sites in the Ventx2 protein and prediction of kinases involved, with Kinasephos2 software. (B) Schematic representation of the Ventx2 protein. HD indicates the homeodomain (blue box), and the PEST destruction motif is highlighted in red. Note that Serine 140, which is required for Ventx2 degradation, is a predicted target of MAPK. (C) 50 pg Ventx2-Myc RNA was injected into both blastomeres at the two-cell stage. 50 pg GFP-Myc-RNA was co-injected as an internal loading control. Embryos were allowed to develop until the indicated stages, and exogenous Ventx2 was detected by anti-Myc immunostaining on Western blot. The graph shows the ratios of Ventx2-Myc over a-tub signals measured from the Western blot. (D) Four-cell embryos were injected in each cell with 50 pg GFP-CAAX, 50 pg Ventx2-Myc, 50 pg 2SAVentx2-Myc RNAs and with 25 ng Mk-MO as indicated. Embryos were fixed at blastula stage 9, cryosectioned and processed for anti-Myc (red), anti-GFP (green) and anti-g-tubulin (centrosomes, white) immunostaining, and DNA was stained with DAPI (blue). Panels represent compiled confocal slices to visualize entire mitotic nuclei.
Figure 4 with 1 supplement
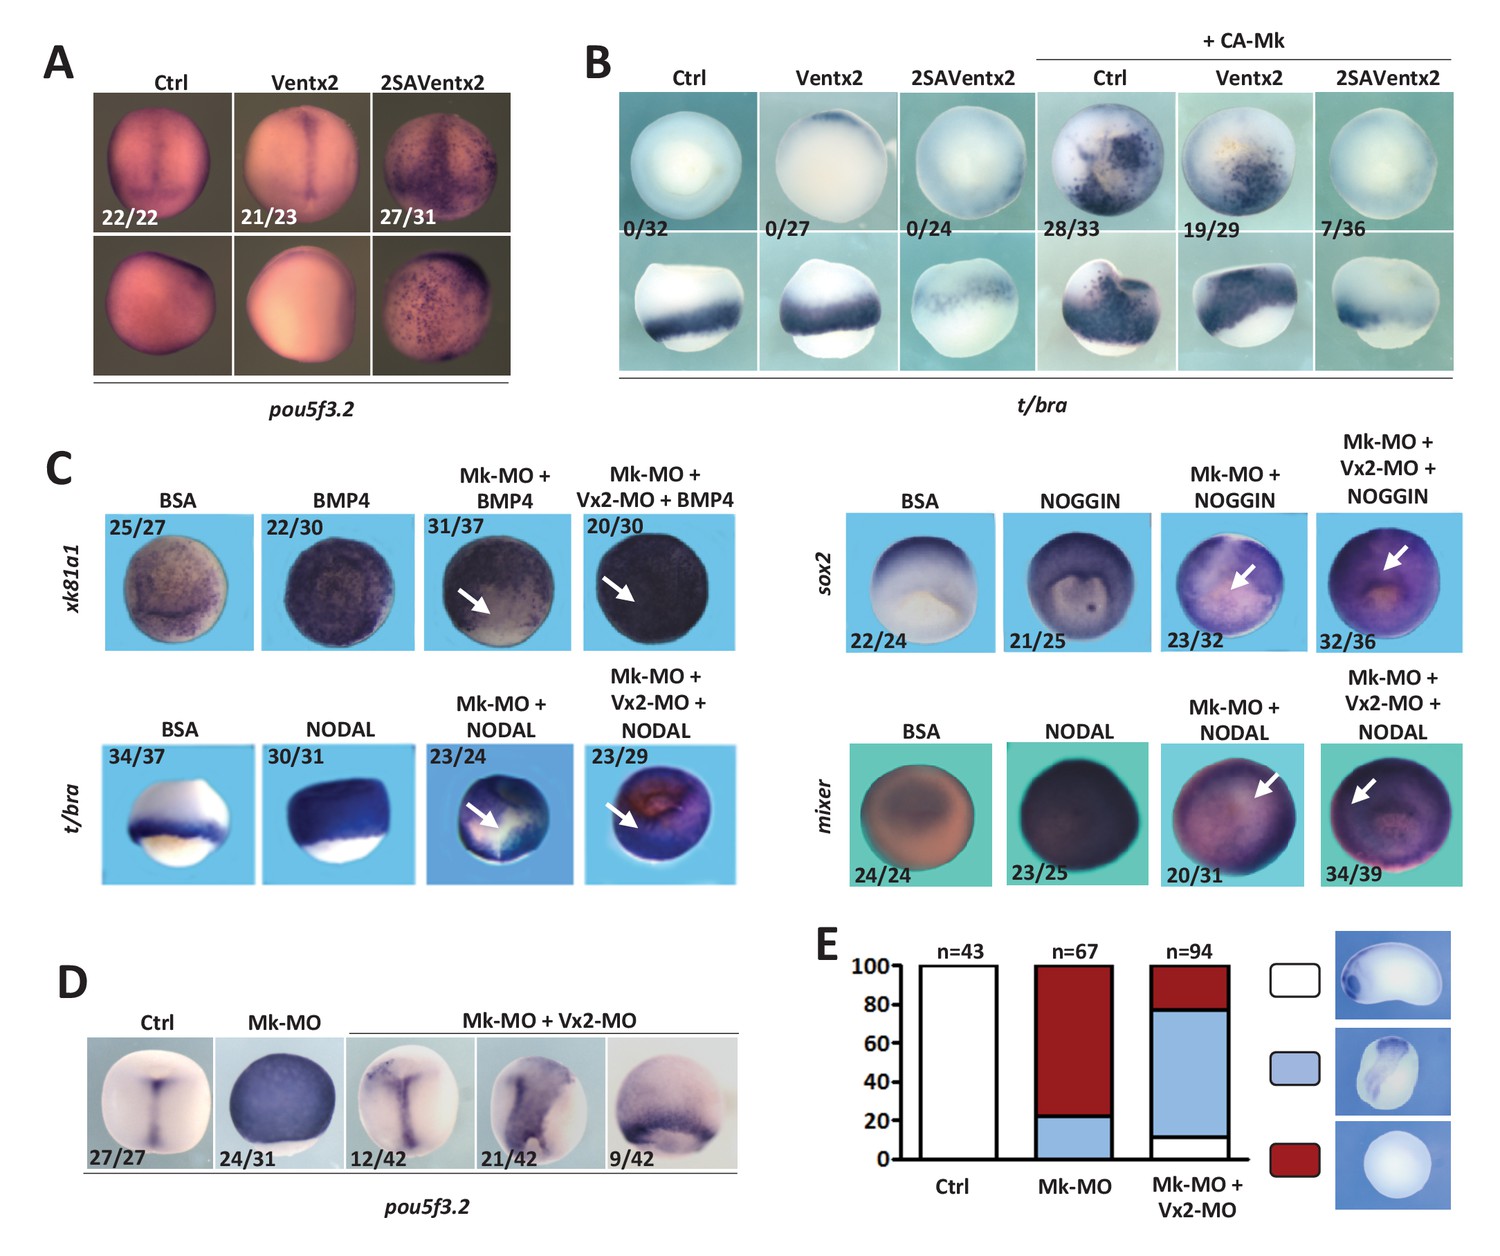
Ventx2 knockdown rescues the competence of MEK1-deficient cells to differentiate.
(A) 4 cell embryos were injected in each cell with 50 pg Ventx2-Myc or 50 pg 2SAVentx2-Myc RNAs, and processed for WISH analysis at late gastrula stage 13 with pou5f3.2 probe. Stabilized 2SAVentx2 maintains ectopic pou5f3.2 expression. Top row dorsal view, bottom row lateral view. (B) Embryos injected as in (A), with or without 500 pg CA-Mk RNA per blastomere, were processed for WISH analysis at early gastrula stage 10.5 with t/bra probe. The number of embryos with ectopic t/bra expression is indicated in each condition. Stabilized 2SAVentx2 counteracts CA-Mk activity. Top row animal view, bottom row lateral view. (C) Sixteen-cell embryos were injected in one animal blastomere with 50 pg GFP-CAAX RNA, 25 ng Mk-MO and 7.5 ng Vx2-MO, as indicated. Next, these embryos were injected at blastula stage 8.5 with recombinant BMP4 (2 ng for xk81a1 induction, animal view), NODAL (5 ng for t/bra induction, lateral view; 50 ng for mixer (endoderm) induction, animal view), or NOGGIN (36 ng for sox2 induction, animal view) proteins into the blastocoel, collected at early gastrula stage 10.5, and processed for WISH. Mk-MO injected domains are indicated by white arrows. (D) Four-cell embryos were injected in each blastomere with 25 ng Mk-MO alone or with 7.5 ng Vx2-MO, collected at late gastrula stage 13 and processed for WISH with pou5f3.2 probe. (E) Embryos injected as in (D) were collected at tailbud stage 25, processed for WISH with sox2 probe, and scored. Ventx2 knockdown partially restores development of MEK1-deficient embryos. MEK1/Ventx2 double knockdown rescue assays were repeated five times. In A and C, the number of embryos exemplified by the photograph over the total number of embryos analyzed is indicated.
Figure 4—figure supplement 1
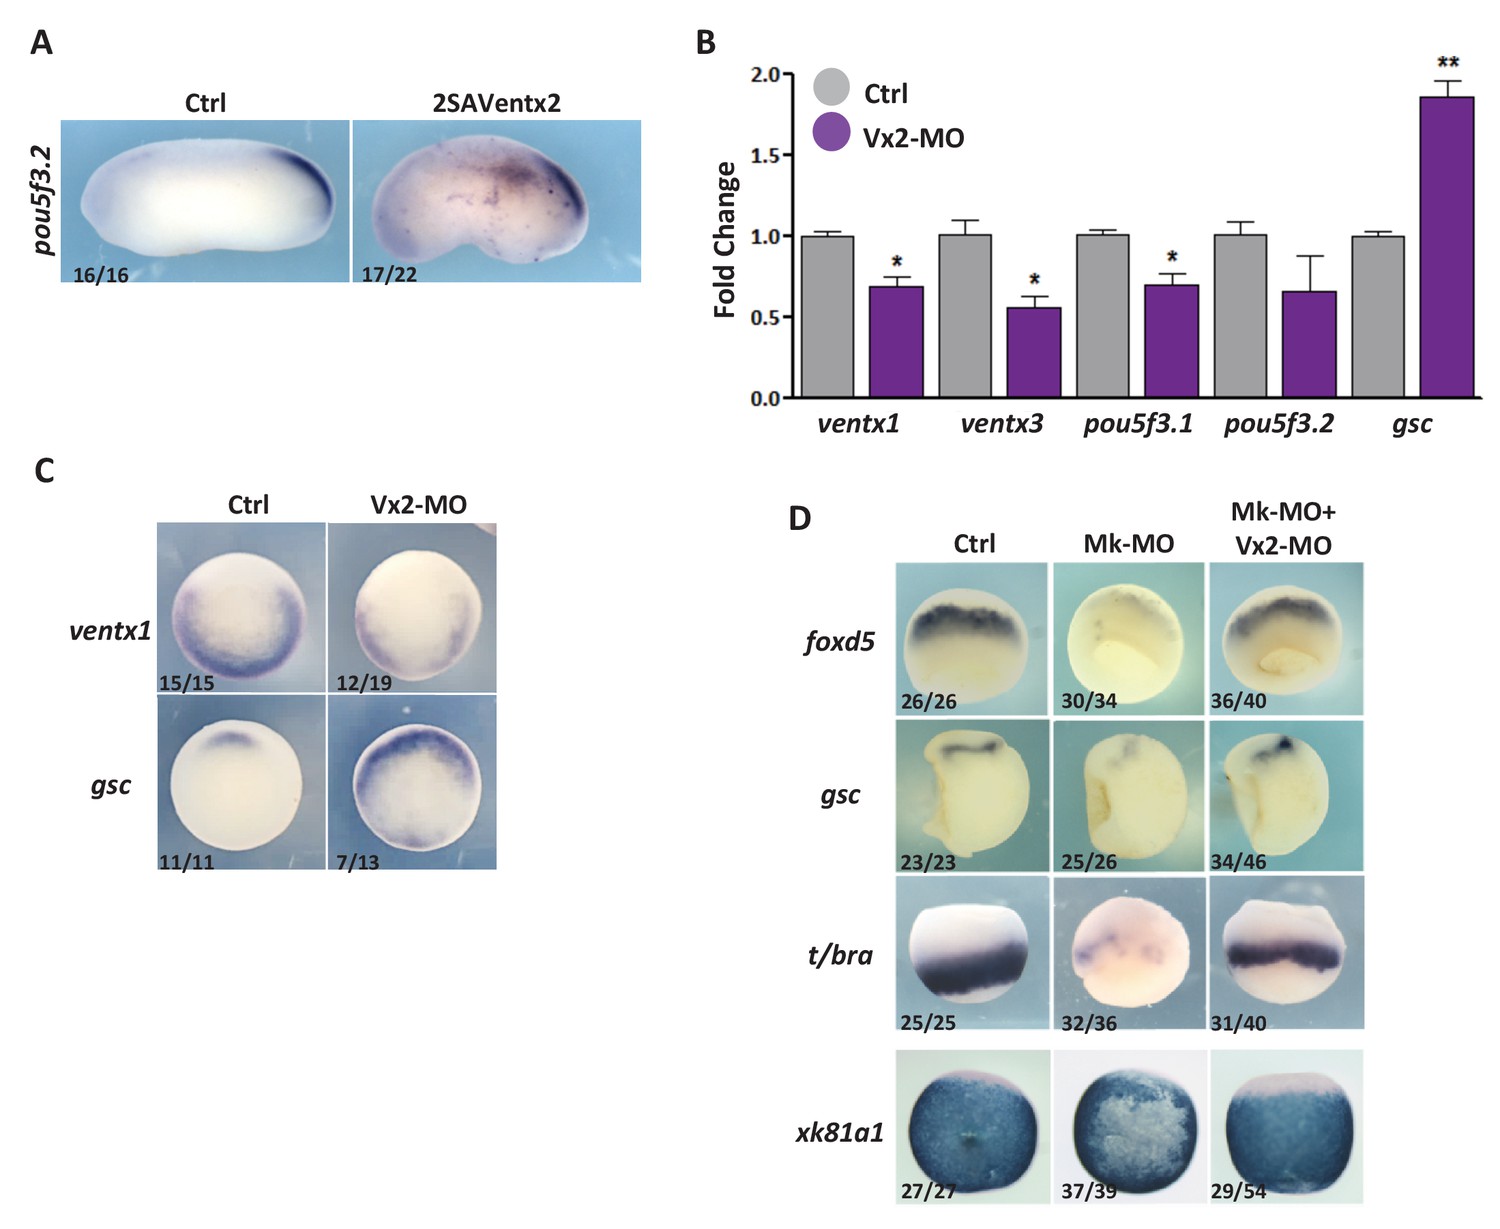
Ventx2 knockdown restores germ-layer formation in MEK1-deficient embryos.
(A) Four-cell embryos were injected with 50 pg 2SAVentx2-Myc RNA per cell, fixed at tailbud stage 25 and processed for WISH with pou5f3.2 probe. (B) Four-cell embryos were injected with 30 ng Ventx2-MO (Vx2-MO) per blastomere, collected at stage 10.5 and processed for RT-qPCR. (C) Embryos injected as in B were processed for WISH analysis at early gastrula stage 10.5 with ventx1 and gsc probes (vegetal view). (D). Four-cell embryos were injected with 25 ng Mk-MO, with or without 7.5 ng Vx2-MO, in each blastomere, collected at gastrula stage 10.5, and processed for WISH with indicated probes. Note that embryos stained for xk81a1 (epidermis) were injected in one ventral animal blastomere at 16 cell stage and collected at late gastrula stage 13. Embryos stained for gsc were hemisectioned prior to staining to improve probe penetration. In A and D, the number of embryos exemplified by the photograph over the total number of embryos analyzed is indicated. For the RT-qPCR graph, error bars represent s.e.m. values of three independent experiments with two technical duplicates. For statistical analysis, samples from injected embryos were compared with samples from uninjected control embryos by Unpaired Student’s t-test. *p<0.05, **p<0.005, ***p<0.0001.
Additional files
-
Supplementary file 1
GSK3 is not a negative regulator of the pluripotency gene network and is not required for MEK1-dependent Ventx2 clearance in vivo.
(A) Four-cell embryos were injected with 300 pg DN-GSK3 RNA per blastomere. Embryos were collected at stage 25 and processed for WISH analysis with sox2 probe. DN-GSK3 efficiently induced secondary body axes, indicating that the dose used was functional. (B) Embryos injected as in (A), were collected at stage 10.5 and processed for RT-qPCR. (C-D) Embryos injected as in (A) were processed for WISH analysis at early gastrula stage 10.5 with gsc (C, vegetal view) and ventx2 (D, top: vegetal view, bottom: animal view) probes. (E) Embryos injected at the 8 cell stage with 300 pg DN-GSK3 RNA in one dorsal animal blastomere were processed for WISH analysis at late gastrula stage 13 with pou5f3.2 and ventx2 probes (anterior view). (F-G) Four-cell embryos were injected in each cell with 50 pg GFP-CAAX, 50 pg Ventx2-Myc, and 25 ng Mk-MO (F), or 50 pg GFP-CAAX, 50 pg Ventx2-Myc and 300 pg of DN-GSK3 (G) Animal caps were explanted at blastula stage nine and cultured until gastrula stage 11, fixed and processed for anti-Myc (red), and anti-GFP (green) immunostaining, and DNA was stained with DAPI (blue). Note that Ventx2-Myc is detectable only in MEK1 depleted caps. For the qPCR graph, error bars represent s.e.m. values of three independent experiments with two technical duplicates. For statistical analyses, samples were compared with the respective control by Unpaired Student’s t-test. *p<0.05, **p<0.005. In C, D and E, the number of embryos exemplified by the photograph over the total number of embryos analyzed is indicated. In F and G scale bar is 20 μm.
- https://doi.org/10.7554/eLife.21526.014
-
Supplementary file 2
Phylogenetic tree of Ventx deuterostome genes.
Boxes indicate members with orthology relationship, like coelacanth Ventx, Xenopus Ventx2 and human VENTX (blue arrows). Sequences were collected from ENSEMBL, JGI, A-STAR and NCBI public databases (see Supplementary file 4). Ventx homeodomain sequences were aligned using Jalview software (RRID:SCR_006459) and the phylogenetic tree was obtained by Neighbor Joining analysis of percentage identity.
- https://doi.org/10.7554/eLife.21526.015
-
Supplementary file 3
The Evolutionary history of Ventx family genes.
(A) Synteny of the Ventx genomic region in gnathostomes. Blue dotted boxes indicate species-specific gene duplication events. Note that a triplication event, giving rise to Ventx1, Ventx2 and Ventx3, occurred in the last common ancestor of tetrapods. One or more Ventx paralogs was subsequently lost during squamata, archosaura and testudina evolution. Mammals lost both Ventx1 and Ventx3 paralogs and exclusively kept Ventx2. Mouse represents an extreme case with a total loss of Ventx genes. (B) Simplified tree of vertebrates, which displays typical situations regarding the number of Ventx genes in main evolutionary branches.
- https://doi.org/10.7554/eLife.21526.016
-
Supplementary file 4
EMBOSS prediction of PEST destruction motifs in Ventx orthologs.
- https://doi.org/10.7554/eLife.21526.017
-
Supplementary file 5
Probes used for WISH.
- https://doi.org/10.7554/eLife.21526.018
-
Supplementary file 6
Primers used for RT-QPCR.
- https://doi.org/10.7554/eLife.21526.019
-
Source data 1
Related to Supplementary file 2.
VENTX homeodomain sequences.
- https://doi.org/10.7554/eLife.21526.020
Download links
A two-part list of links to download the article, or parts of the article, in various formats.
Downloads (link to download the article as PDF)
Open citations (links to open the citations from this article in various online reference manager services)
Cite this article (links to download the citations from this article in formats compatible with various reference manager tools)
Lineage commitment of embryonic cells involves MEK1-dependent clearance of pluripotency regulator Ventx2
eLife 6:e21526.
https://doi.org/10.7554/eLife.21526


