Cryo-EM structures of the autoinhibited E. coli ATP synthase in three rotational states
- The Victor Chang Cardiac Research Institute, Australia
- Nanyang Technological University, Singapore
- University of Oxford, United Kingdom
- The University of New South Wales, Australia
Figures
Figure 1
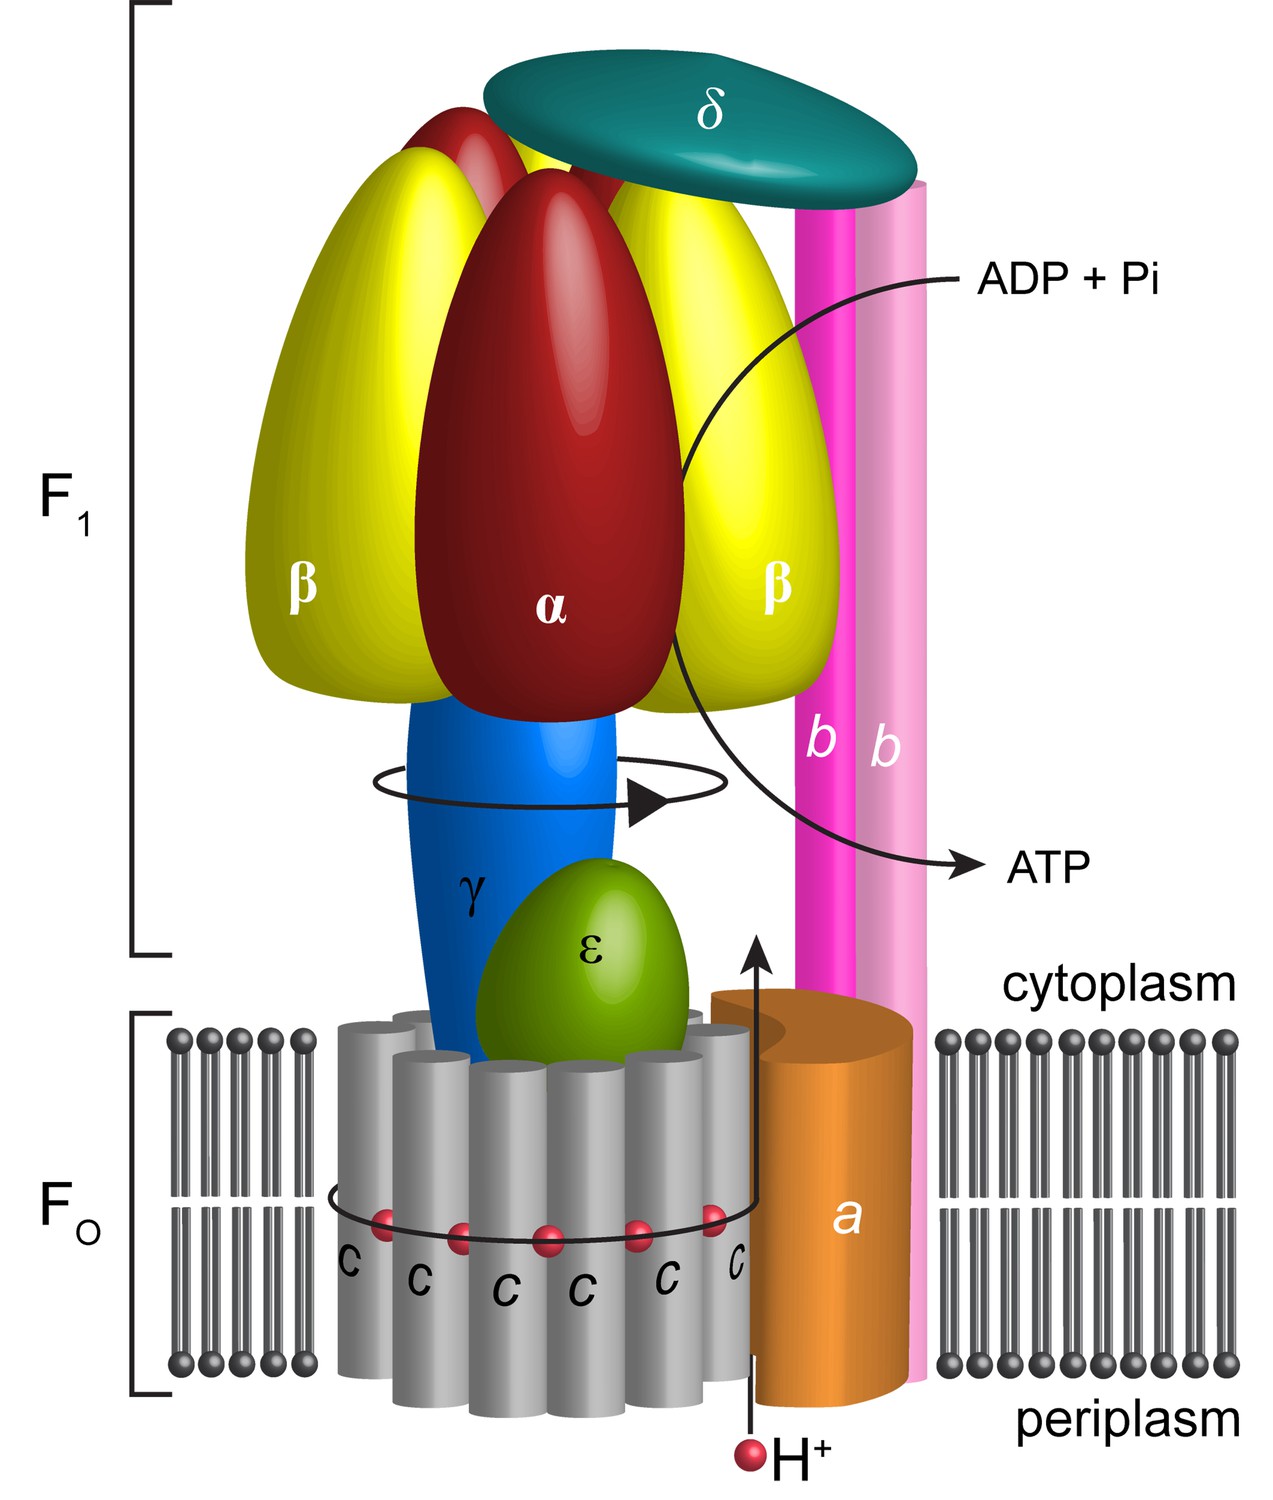
Schematic illustration showing the arrangement of subunits in E. coli F-ATPase.
Subunits α in red, β in yellow, γ in blue, ε in green, c in grey, a in orange, b in magenta or pink, and δ in teal. The proton path and ATP synthesis are labeled accordingly.
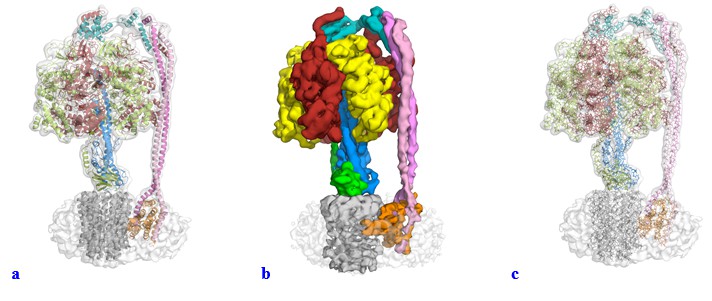
Figure 2 with 10 supplements
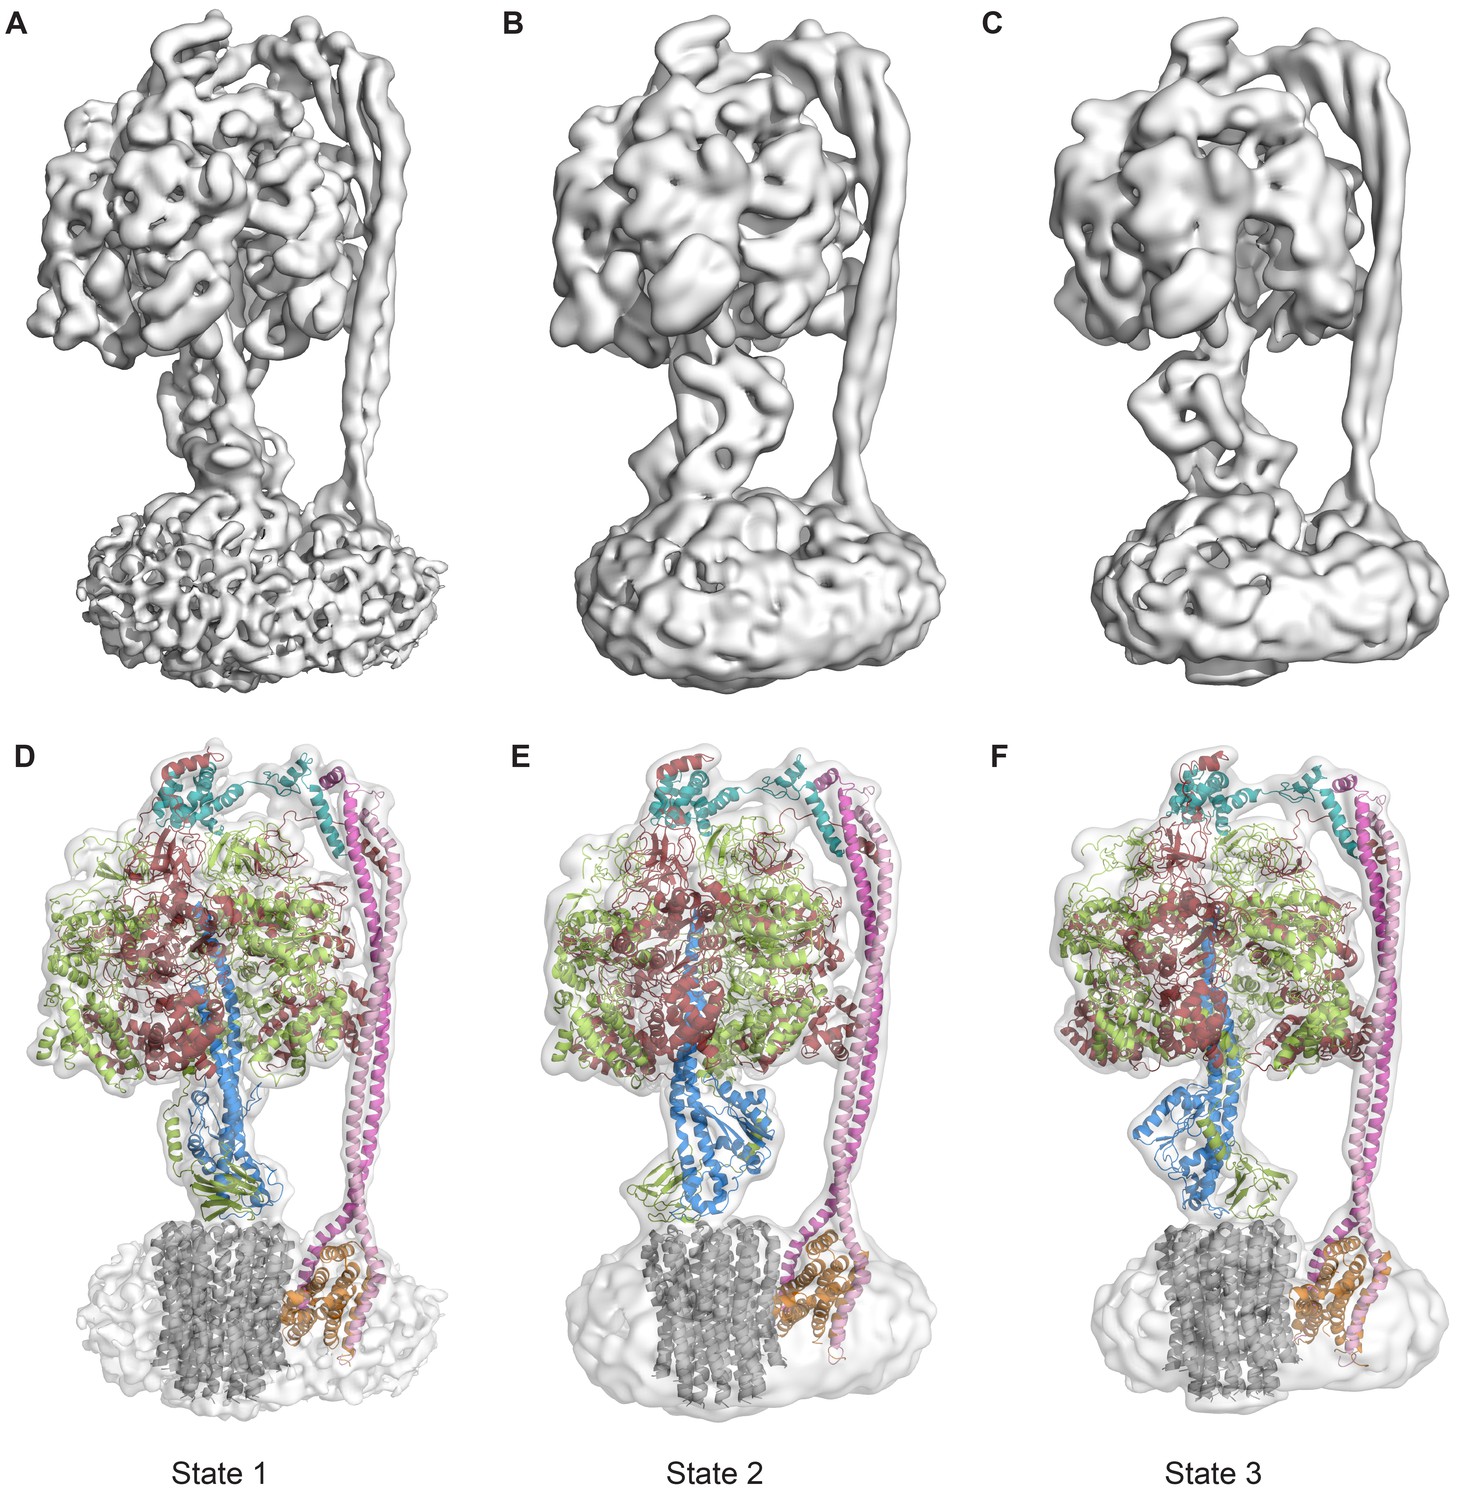
The three states of the autoinhibited E. coli F-ATPase.
(A–B) Cryo-EM maps shown as surface representation, states 1, 2 and 3, respectively, resulting from rotation of the central stalk by 120°. (D–F) Molecular models built into the cryo-EM maps shown as cartoon representation. Subunits α in red, β in yellow, γ in blue, ε in green, c in grey, a in orange, b in magenta or pink and δ in teal.
-
Figure 2—source data 1
Data collection and image processing statistics.
- https://doi.org/10.7554/eLife.21598.005
Figure 2—figure supplement 1
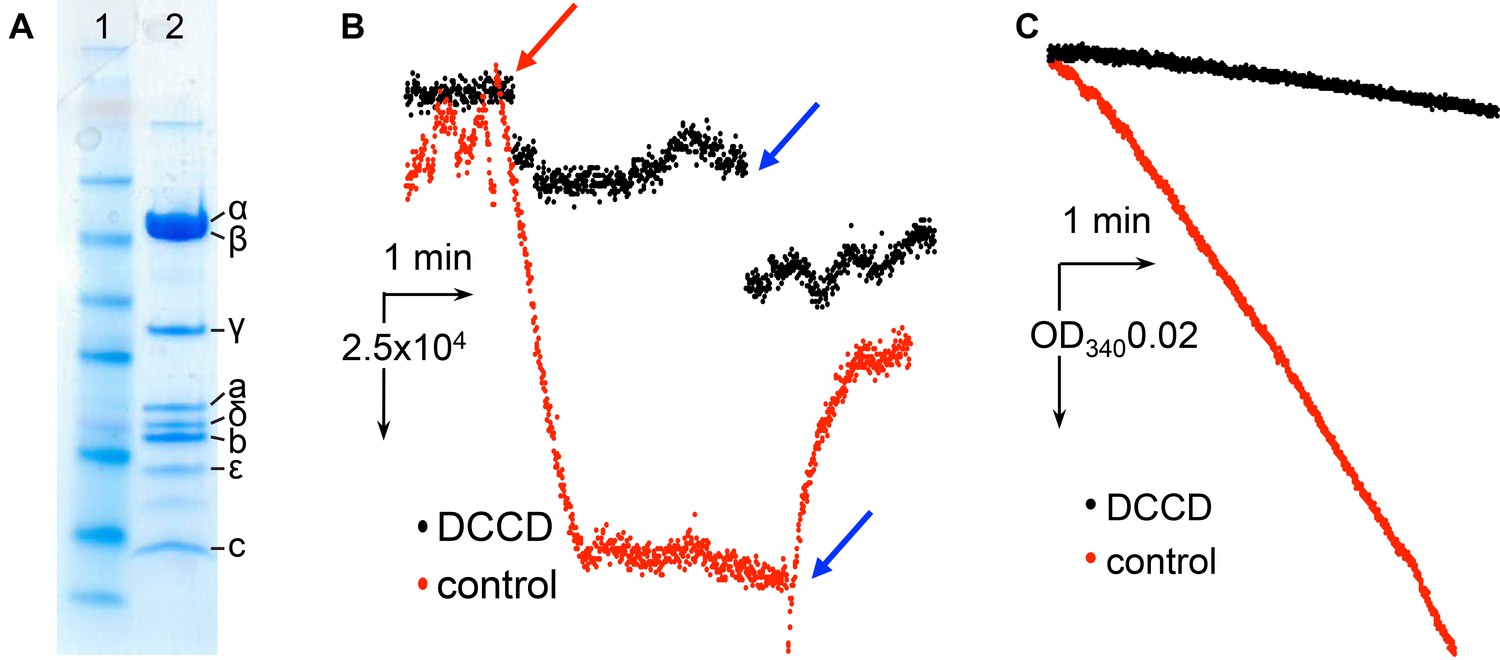
Characterization of E.coli F1Fo ATP synthase used for cryo-EM.
(A) SDS page gel showing protein purity. Lane1: SeeBlue Plus2 marker. Lane 2: E. coli F-ATPase. (B) Inhibition of ATP-hydrolysis-driven proton pumping by F1Fo in the presence of and without 50 µM DCCD. The protein was reconstituted into proteoliposomes and assayed for ACMA quenching as described in the Materials and methods. Red arrow marks addition of ATP, blue arrows indicate addition of the uncoupler FCCP. (C) Inhibition of ATP hydrolysis by isolated F1Fo in the presence of 50 µM DCCD. The protein was inhibited with and without 50 µM DCCD and assayed with the ATP regenerating system as described in Materials and methods.
Figure 2—figure supplement 2
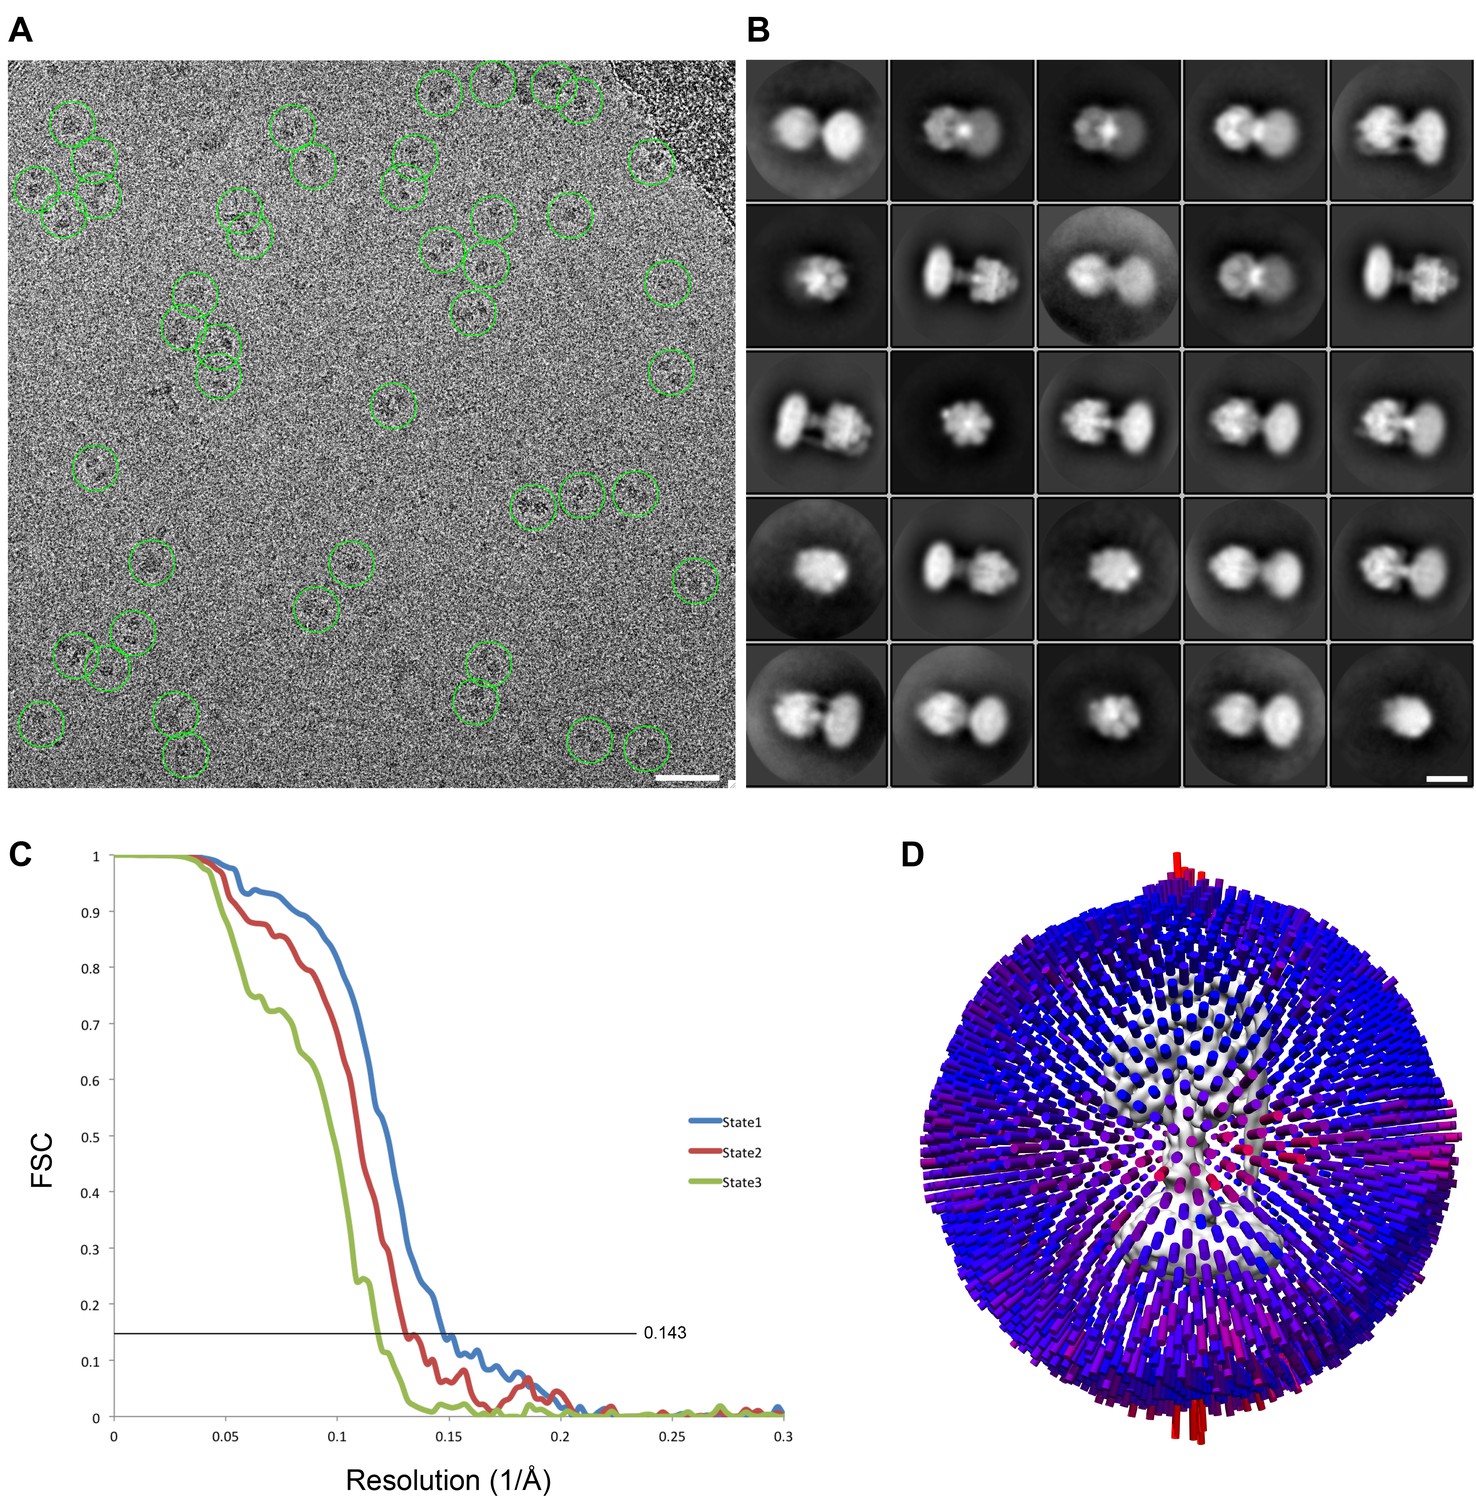
cryoEM analysis.
(A) Representative micrograph with picked particles, scale bar = 500 Å. (B) 25 highest populated classes from round 1 2D classification, scale bar = 100 Å. (C) Gold standard FSC plots of States 1, 2 and 3. (D) Orientation distribution of particles in the State one reconstruction.
Figure 2—figure supplement 3
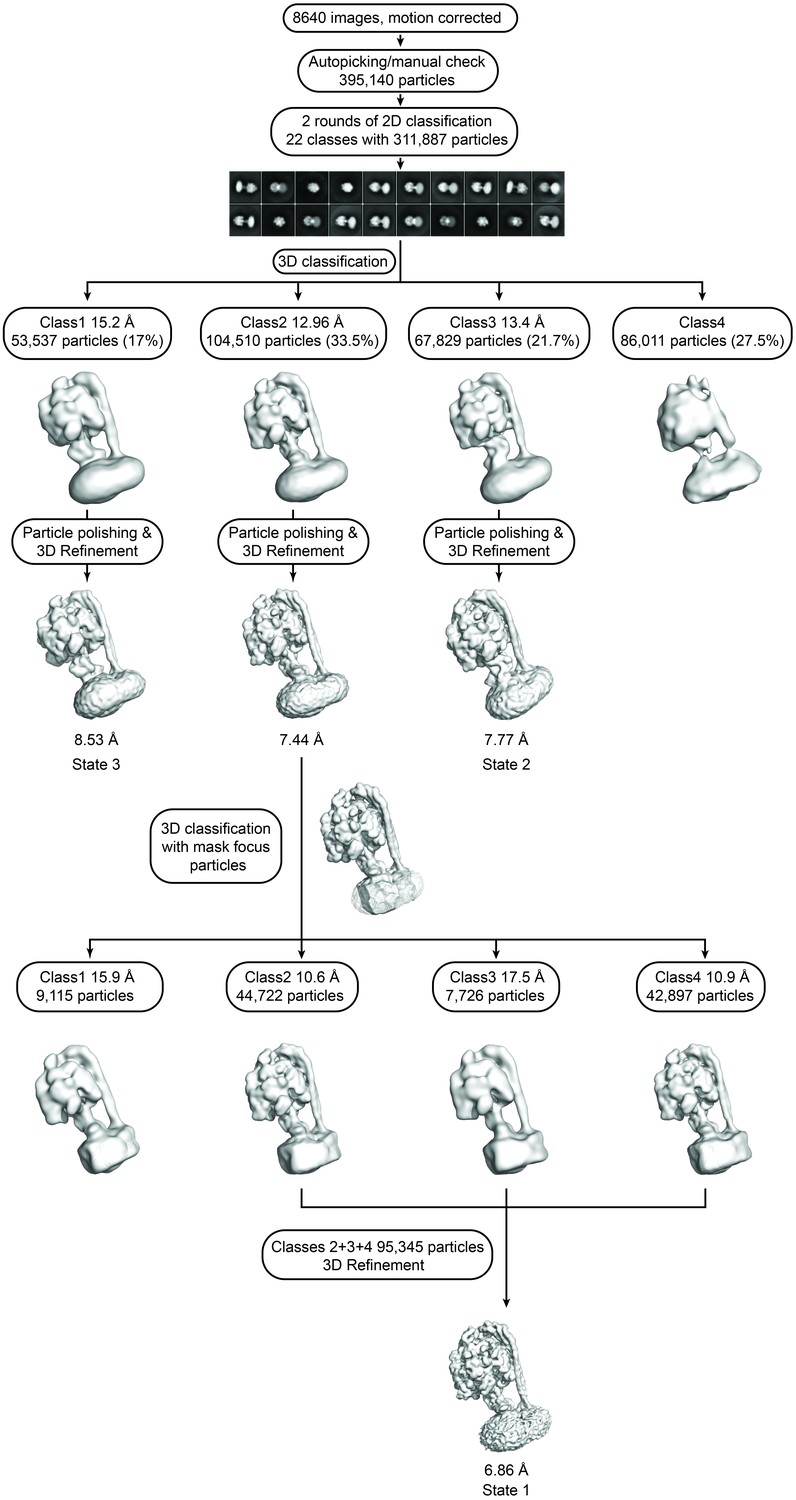
Flowchart describing cryoEM data analysis.
https://doi.org/10.7554/eLife.21598.008
Figure 2—figure supplement 4
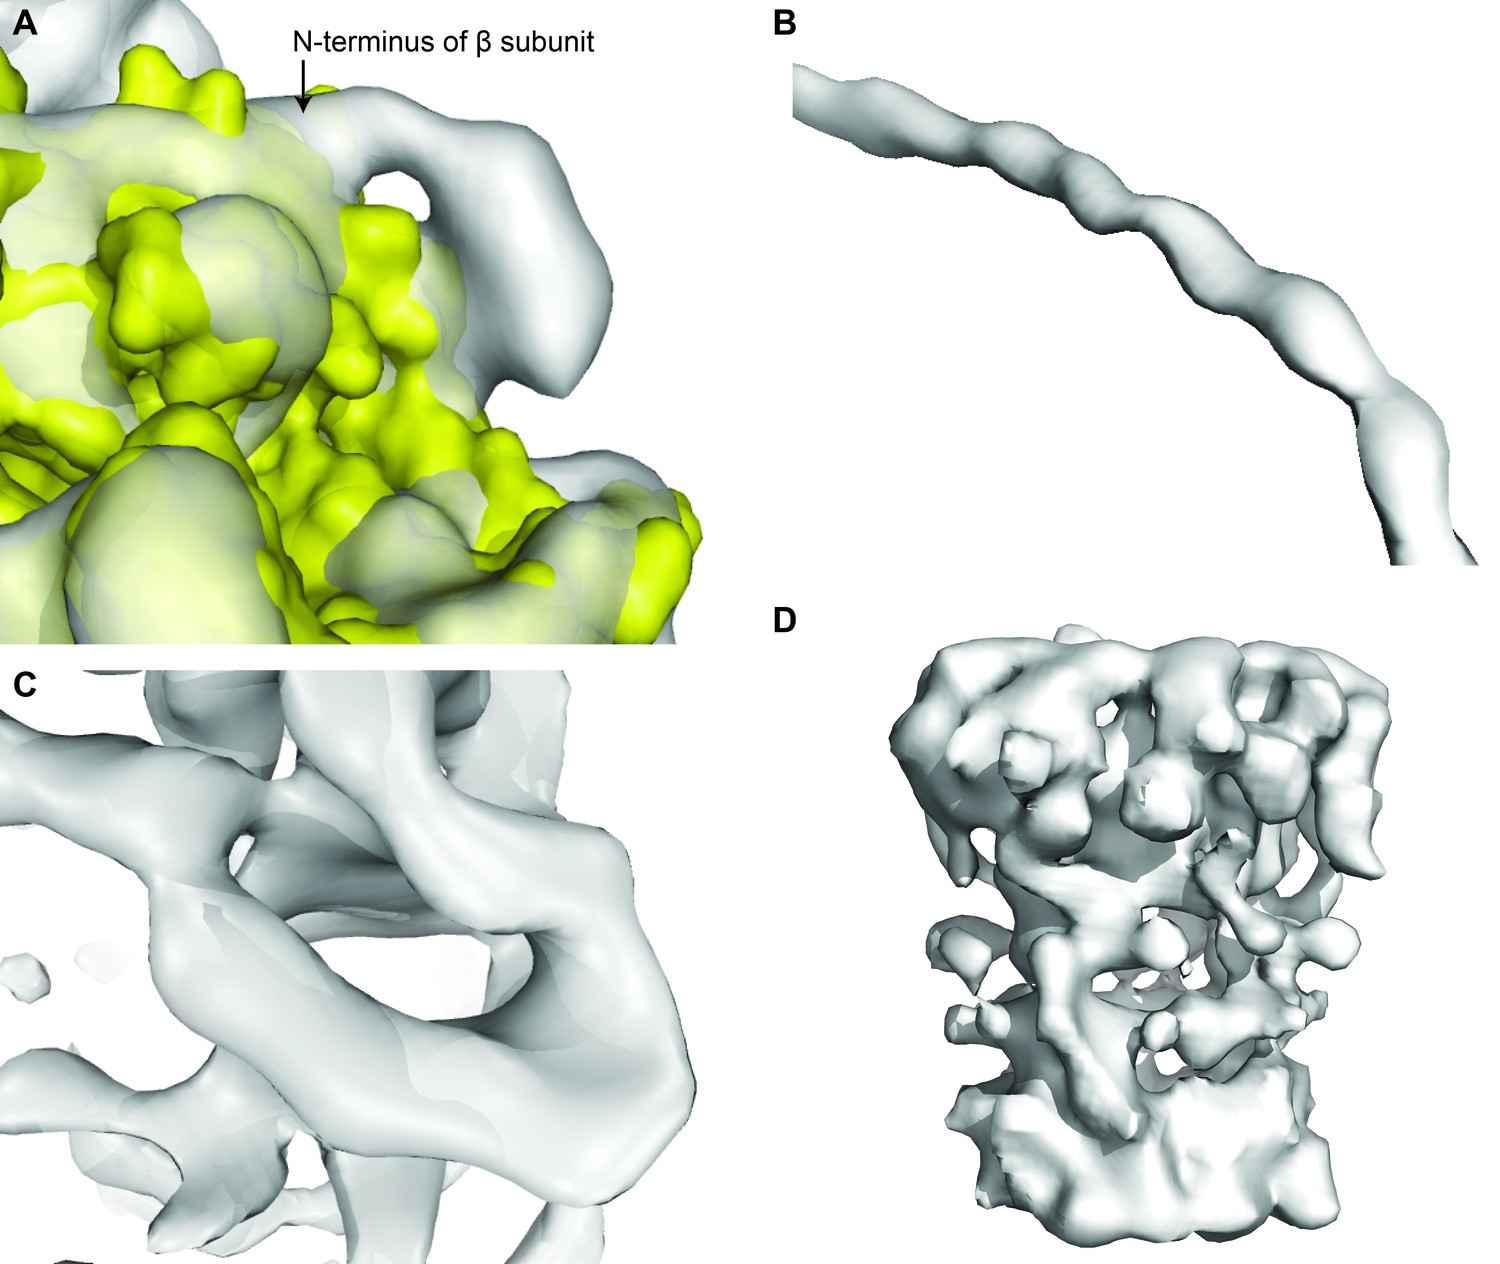
Examples of the electron density map of State 1, to highlight strengths and weaknesses.
(A) Extra density at the N-terminus of subunit β shows 6xHis-tag. (B) Helical register visible in the density for the peripheral stalk. (C) β barrel of the ε subunit. (D) Poor density for the c-ring.
Figure 2—figure supplement 5
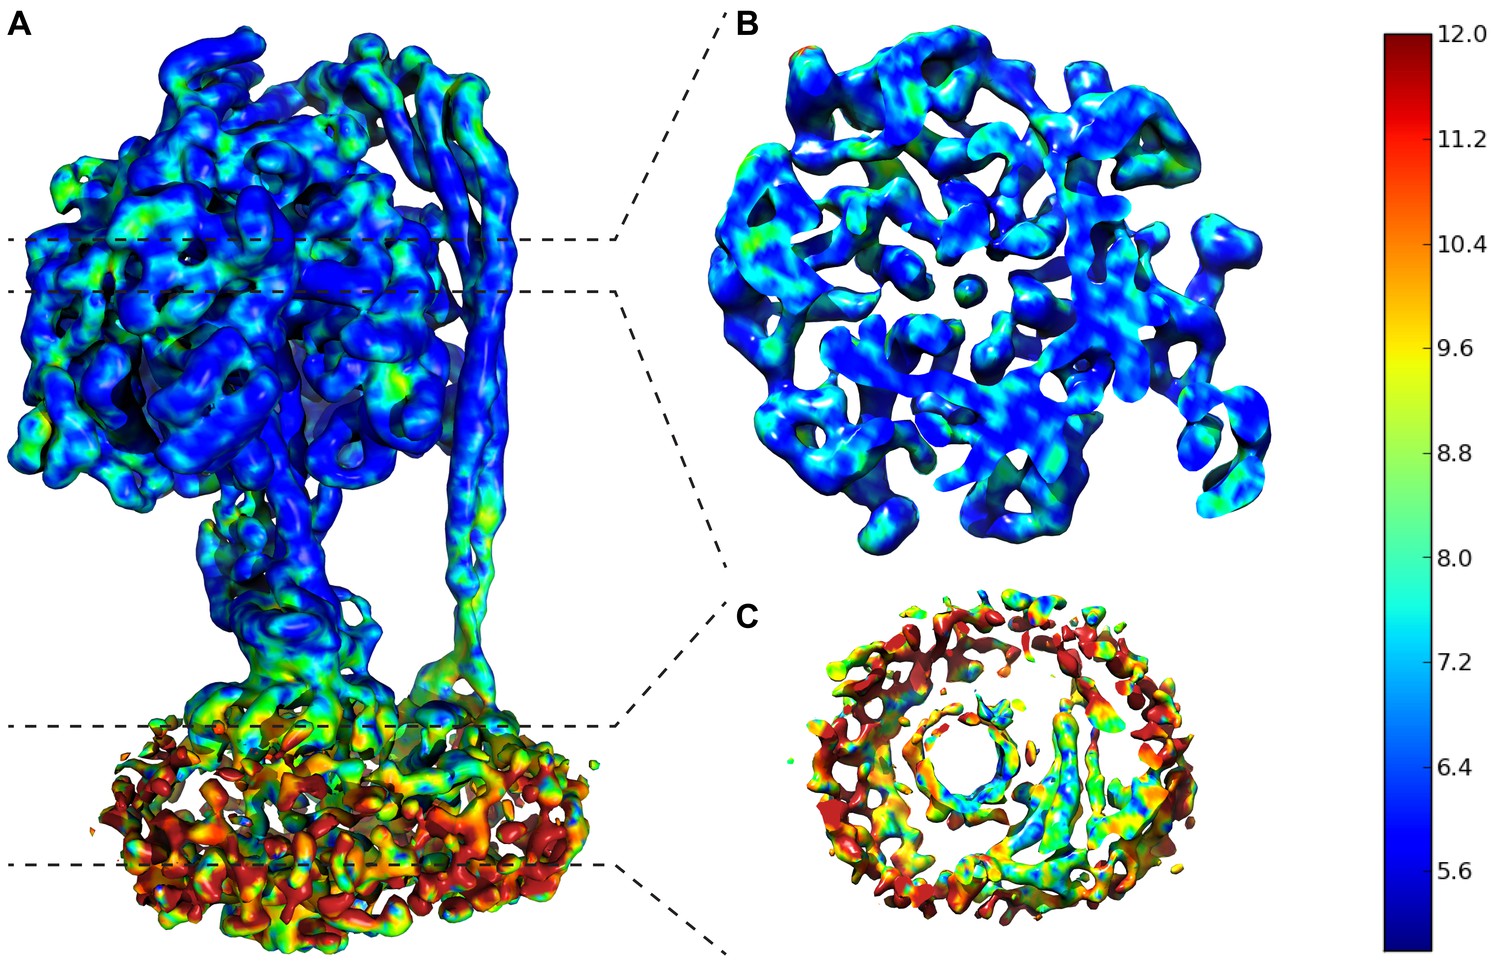
Local resolution map of State 1.
(A) Overall complex. (B) Slice through F1. (C) Slice through FO. Dashed lines show area of cross section and scale on right shows color/resolution relationship. Made with ResMap (Kucukelbir et al., 2014).
Figure 2—figure supplement 6
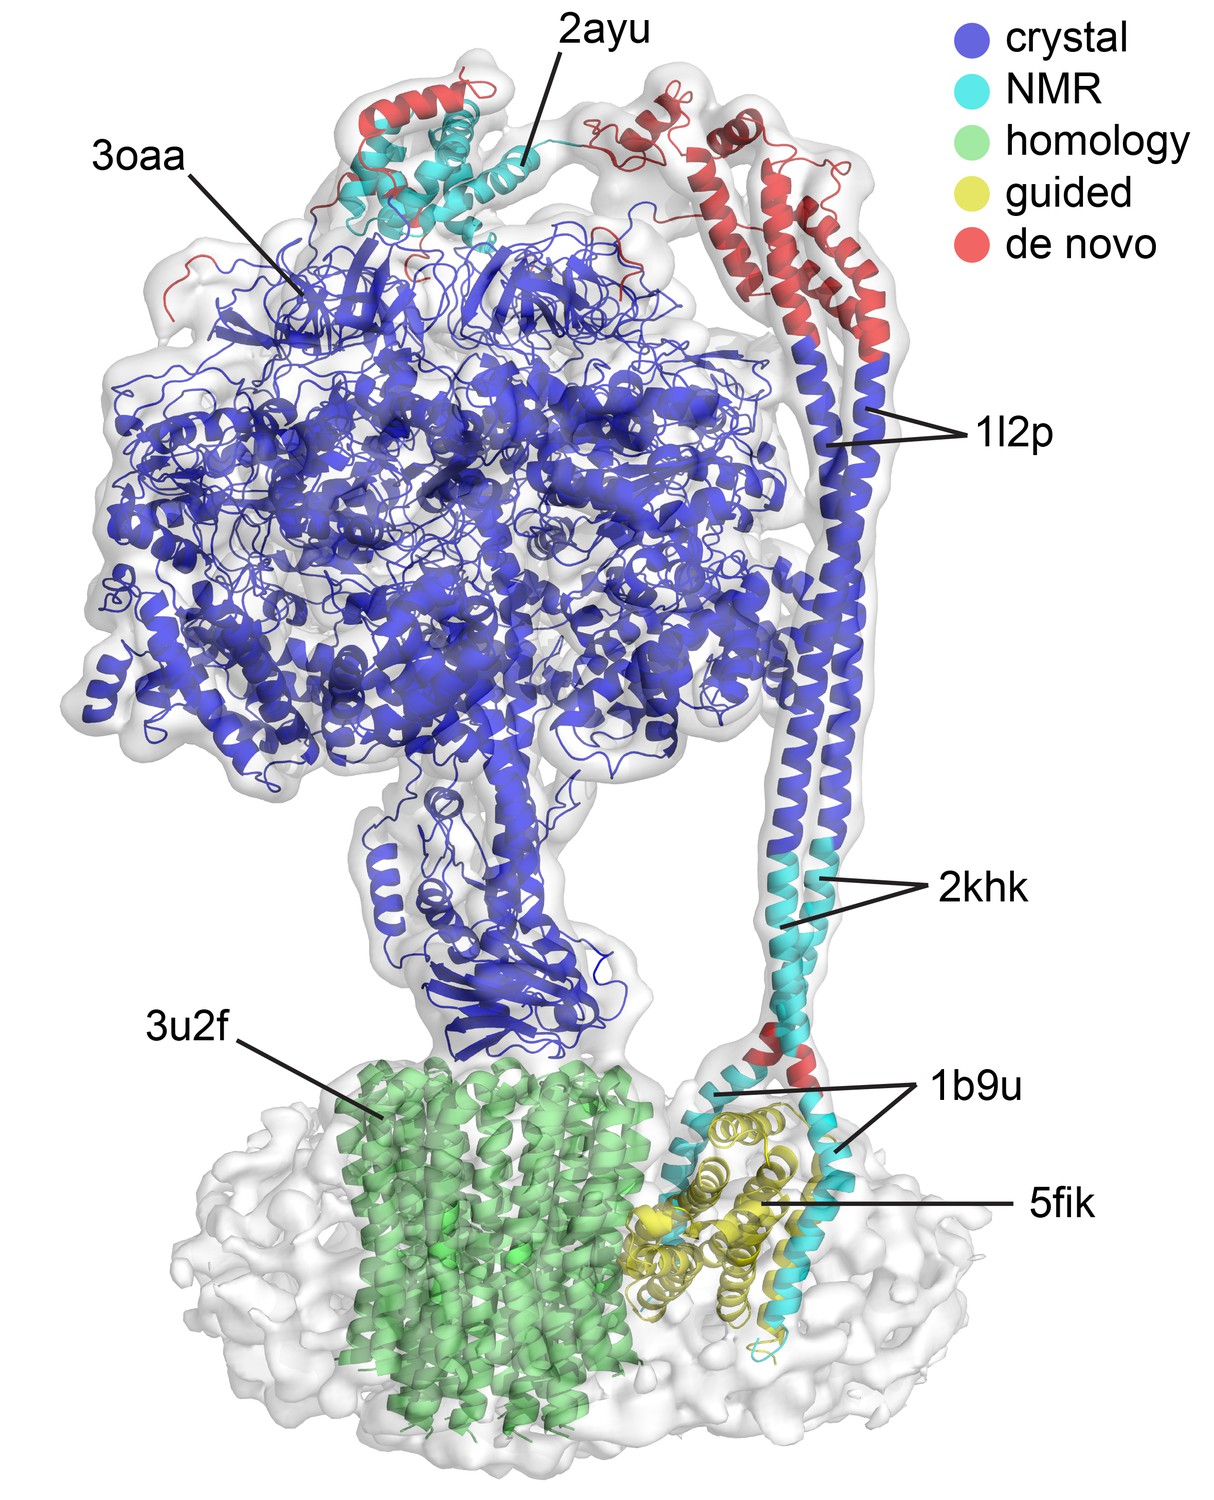
Quality of the models built into the state one cryoEM map.
The model presented is a mosaic refined model created by docking crystal, NMR, homology models and de novo built sections. The colors represent the origin of these models prior to refinement. Crystal structures in blue, NMR models in cyan, homology model using a crystal structure in green, modeled using other EM structure as guide in yellow and built into the map in red.
Figure 2—figure supplement 7
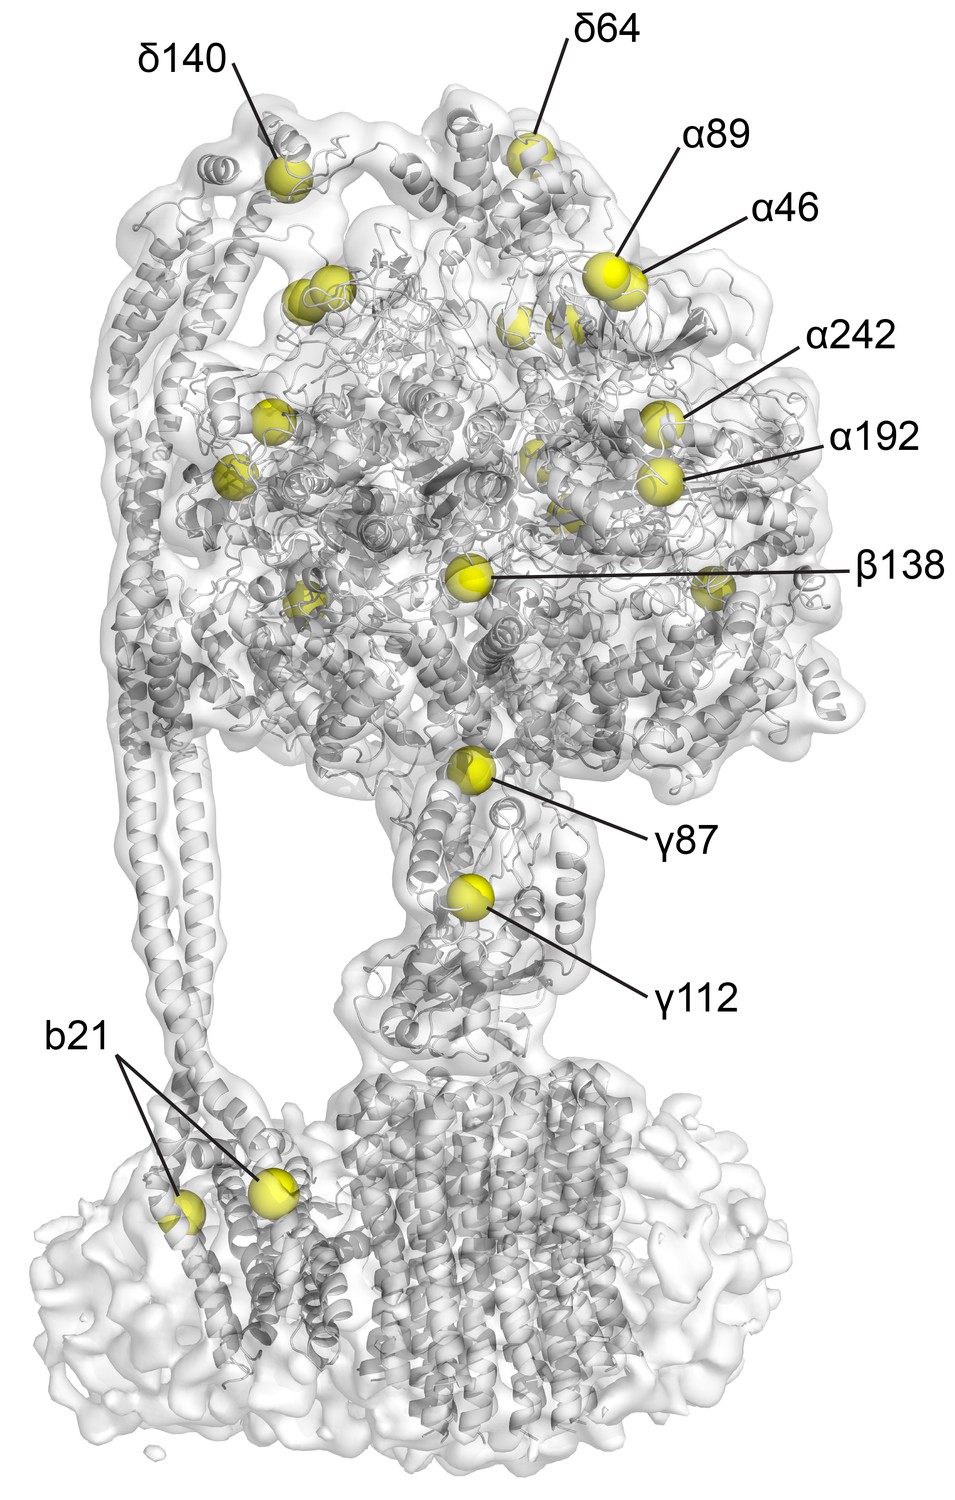
Position of the natural cysteines in E. coli F1Fo.
CryoEM map of state one containing built model. Yellow spheres depict the positions of Cys-Ala mutants in the cysteine-free sample used.
Figure 2—figure supplement 8
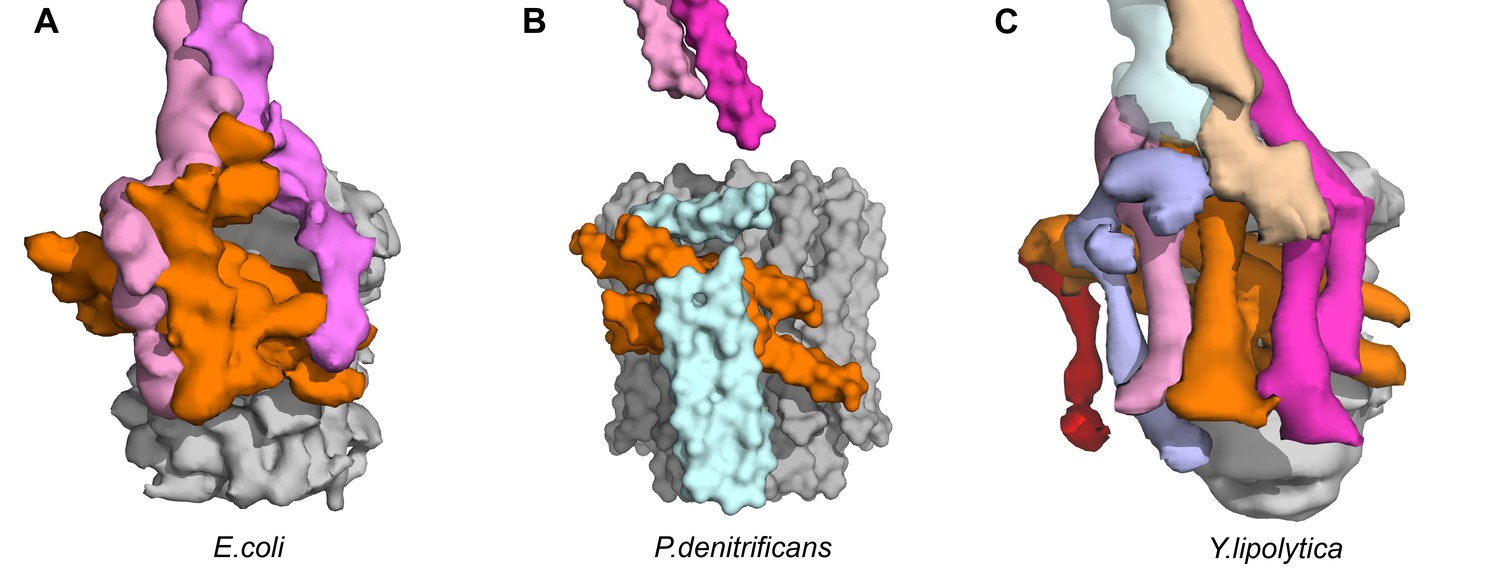
Transmembrane architecture of (A) E.coli, (B) P. denitrificans, (C) Y. lipolytica.
Unassigned subunits of P.denitrificans shown in cyan and subunit 8 of Y. lipolytica shown in pink.
Figure 2—figure supplement 9
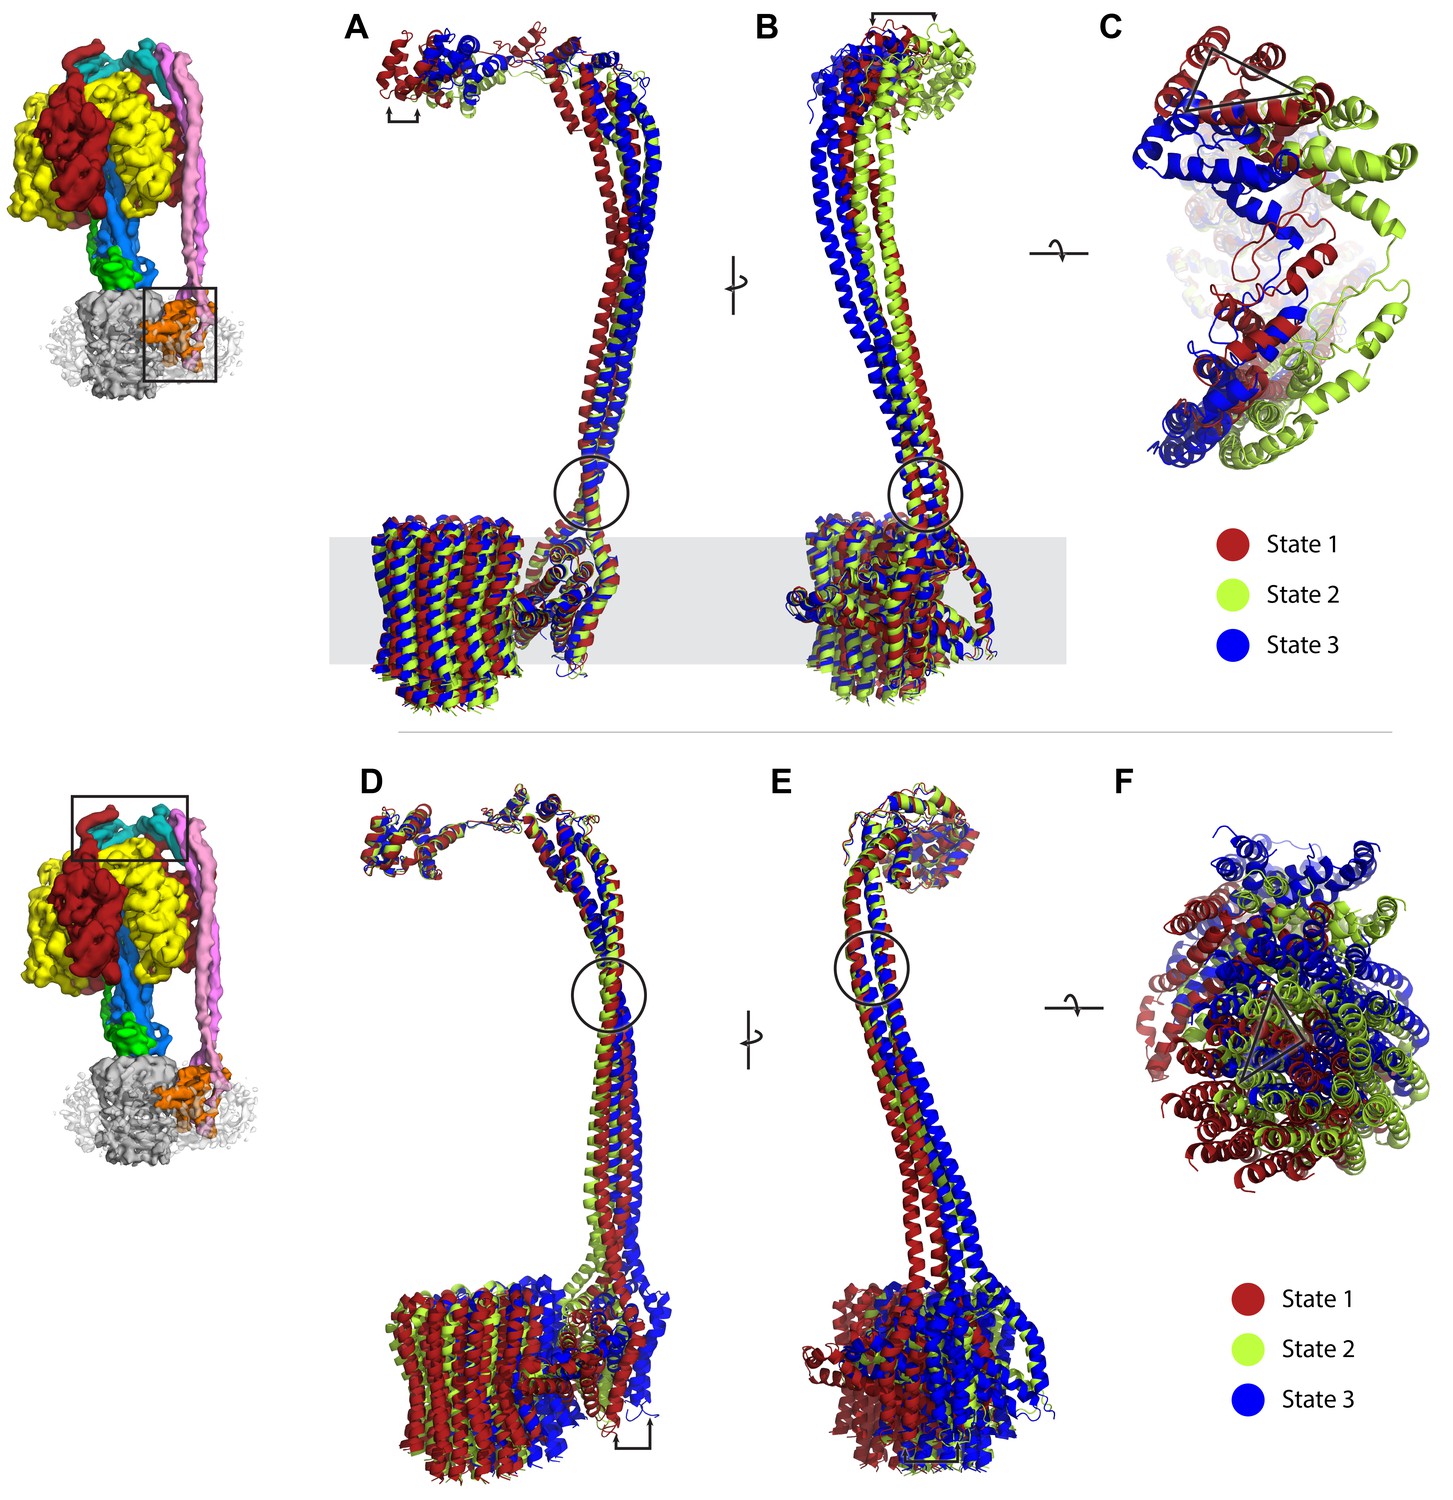
Comparison of peripheral stalk position between the three states; diagrams on left depict part of complex that each state is superposed to.
State 1, 2 and 3 in red, green and blue, respectively. The F1 has been removed for clarity. (A–C) Structures superposed to the a subunit. (D–F) Structures superposed to the delta subunit. Arrows and triangle show distance displaced between states. Circles highlight possible hinge/swivel regions.
Figure 2—figure supplement 10
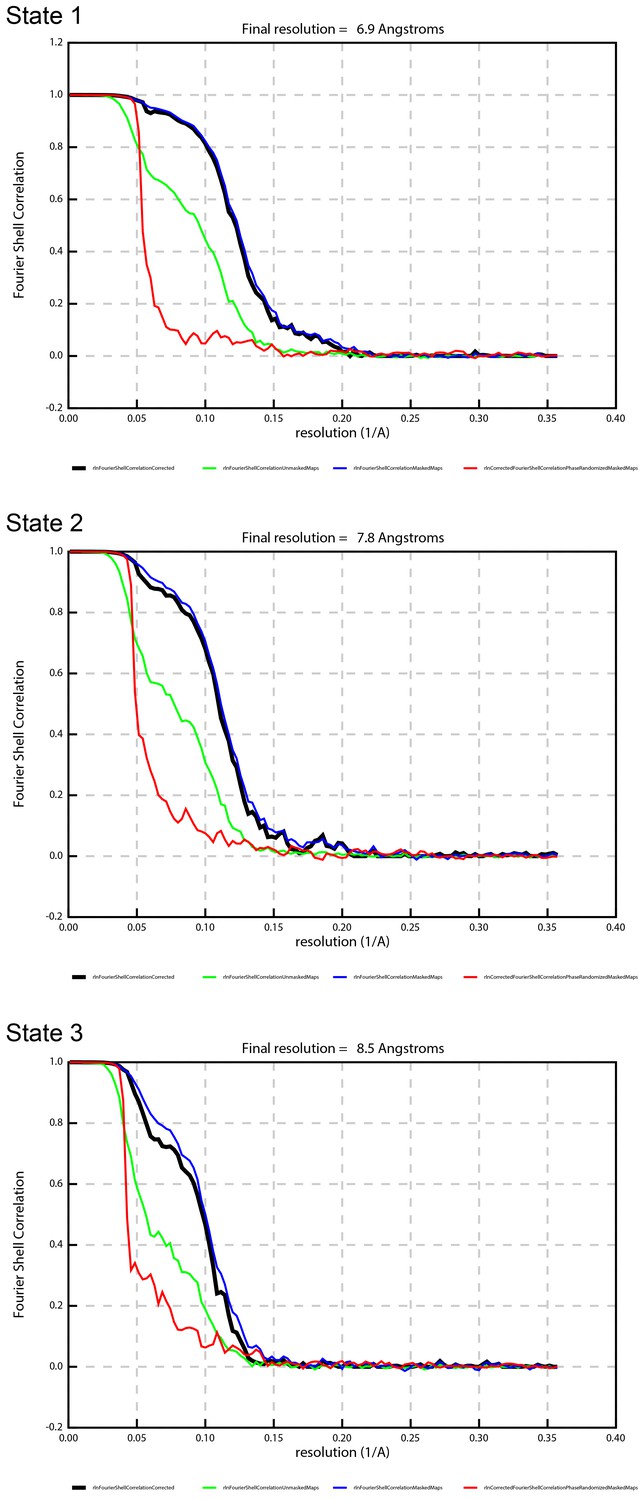
FSC curves showing the effects of masking on the refined map, with the gold-standard, corrected FSC curve (black), FSC of the unmasked map (green), FSC of the masked map (blue), and FSC of the phase-randomized masked map (red).
https://doi.org/10.7554/eLife.21598.015
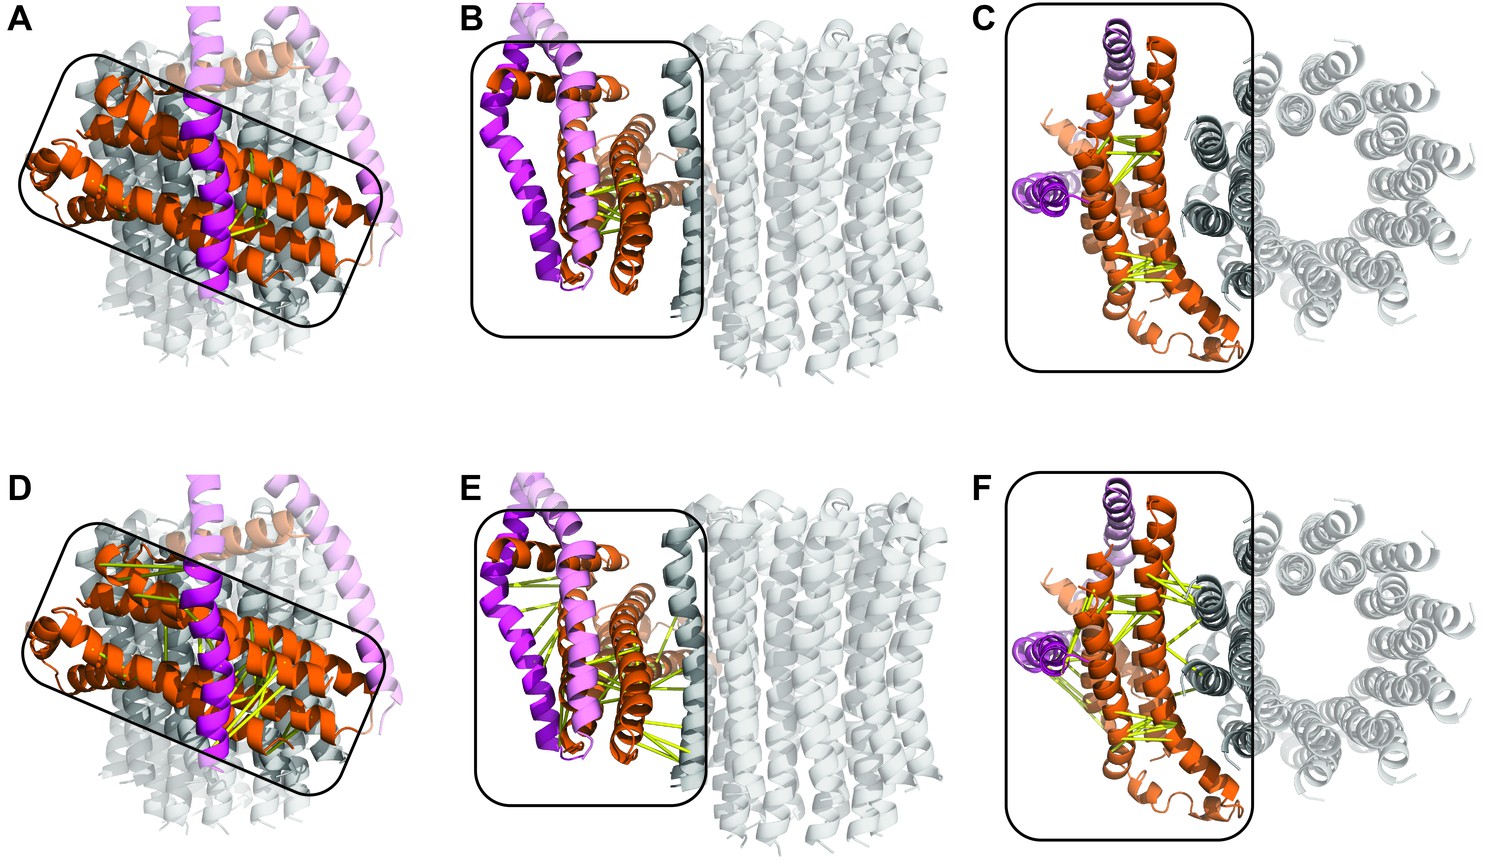
Figure 3 with 2 supplements

The peripheral and central stalks of E. coli F-ATPase.
(A) The peripheral stalk is comprised of a globular head (subunit δ in teal) and a homodimeric coiled-coil (subunits b in pink and magenta) that bifurcates at the membrane interface to brace subunit a (orange). (B) The εCTD is in an extended conformation, inhibiting the enzyme from rotating. The arrow depicts the extended vs closed conformation of subunit ε.
Figure 3—figure supplement 1
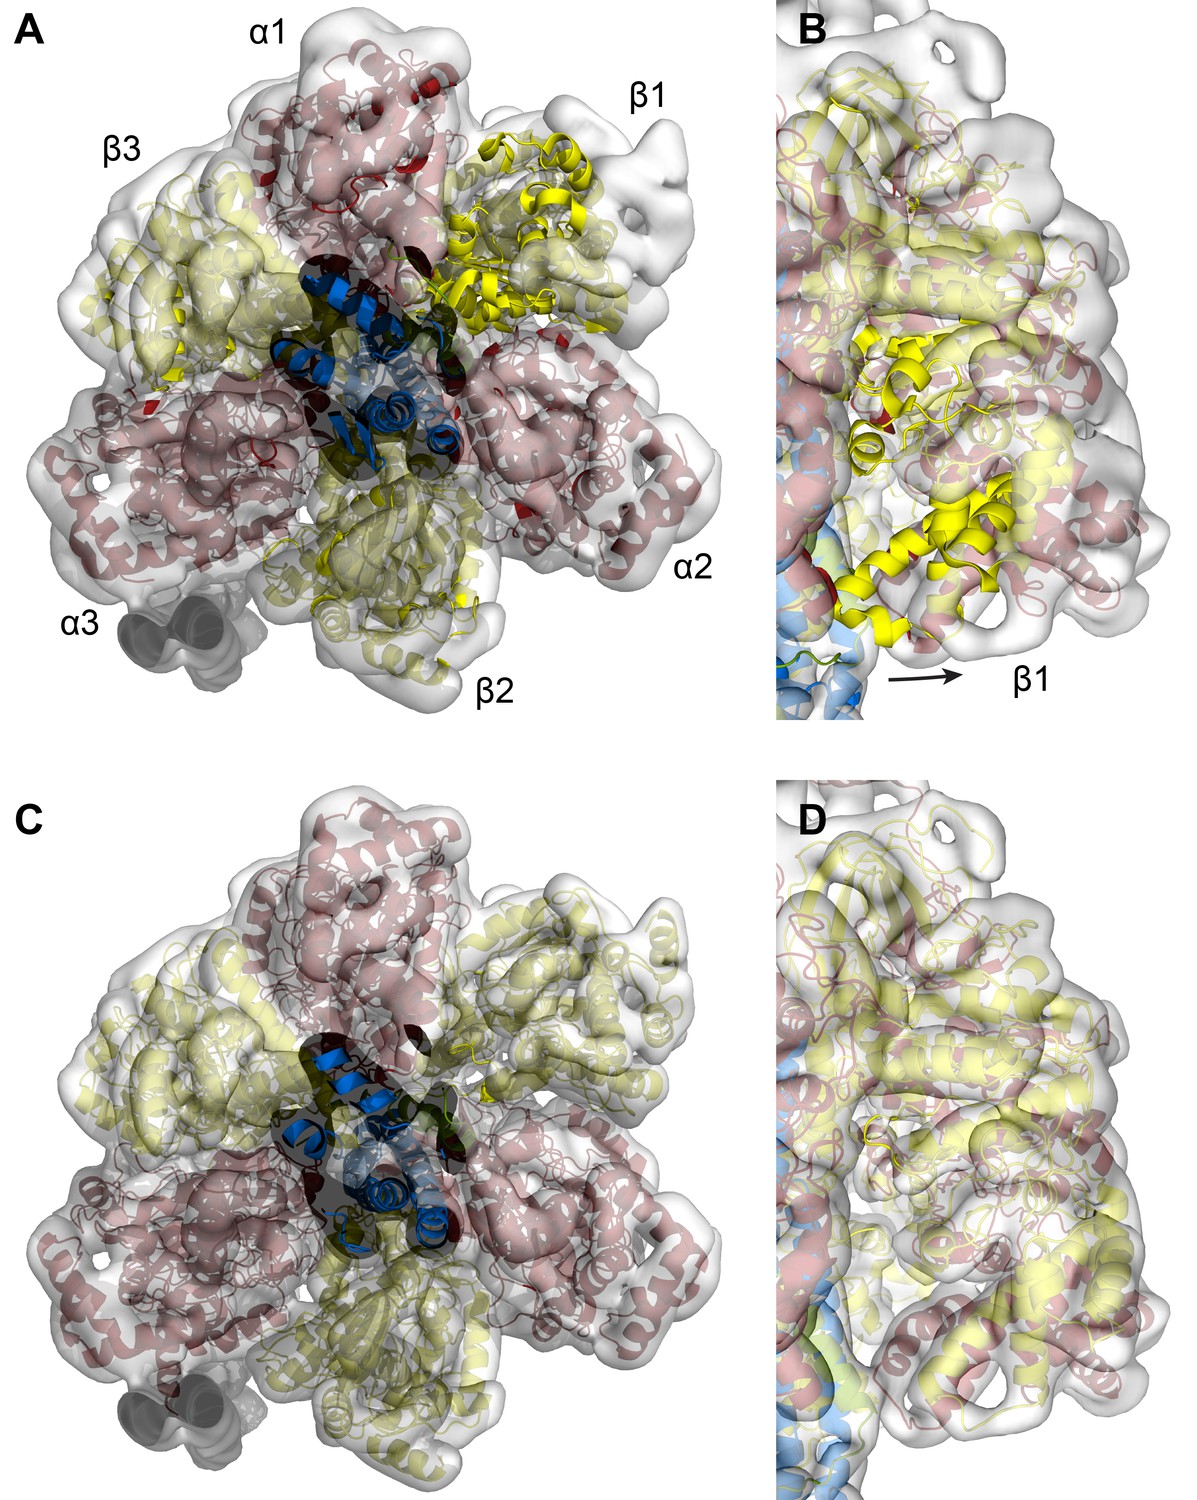
Fitting of the of the autoinhibited E.coli F1-ATPase crystal structure (pdb 3oaa) into the State one cryoEM map of E. coli F-ATPase.
(A and B) 3oaa rigid body fitted into the cryoEM map. β1 needs substantial movement to fit the density well. (C and D) Final refined model of the E. coli F1-ATPase shows all subunits fitting well.
Figure 3—figure supplement 2
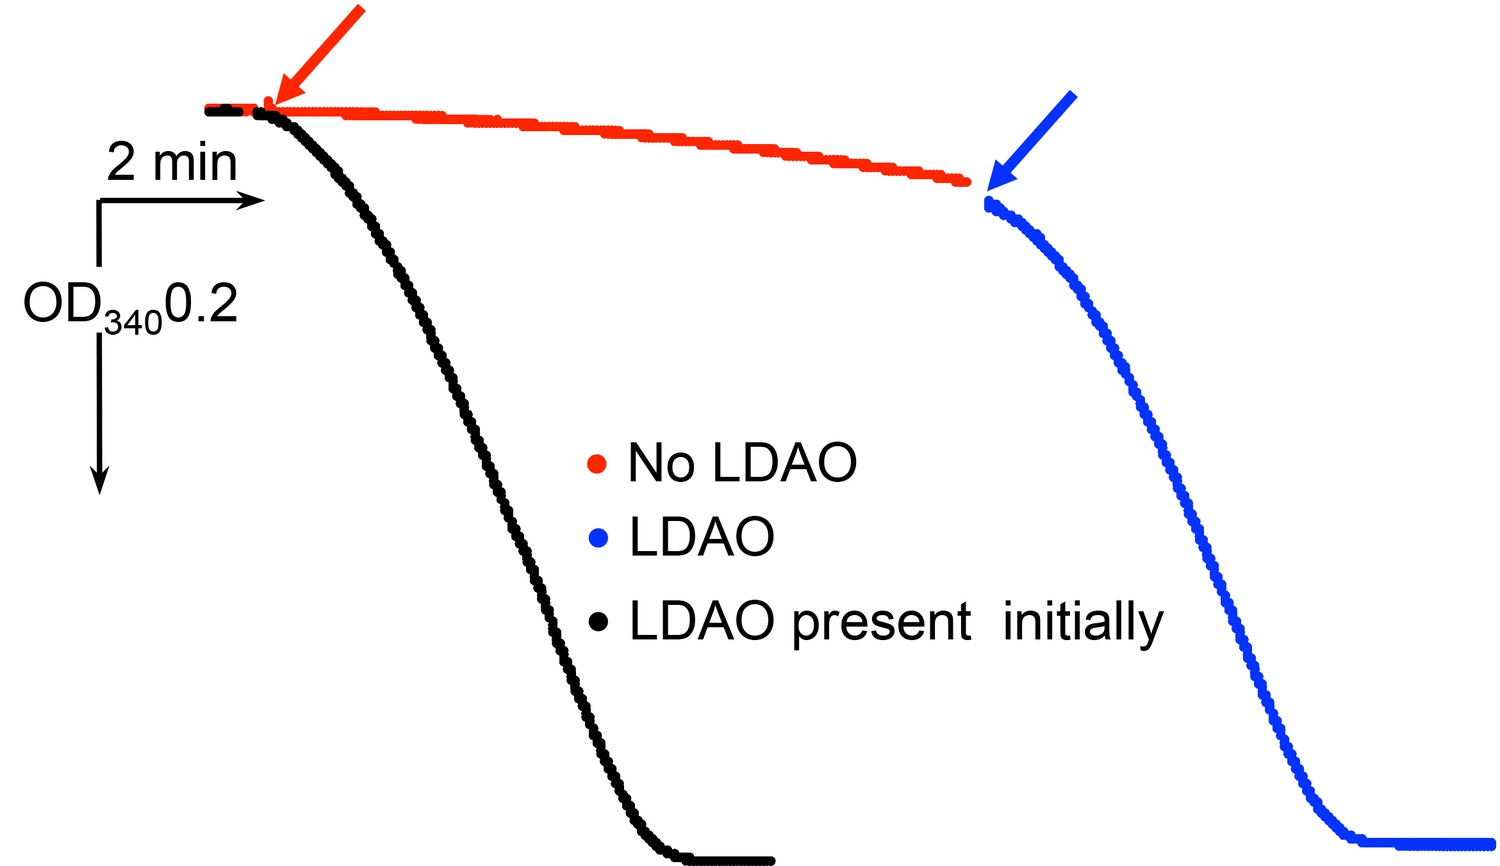
Stimulation of ATP hydrolase activity of isolated F1Fo by 0.4% LDAO.
ATPase activity of the protein was registered with the ATP regenerating system as described in Materials and methods. Red arrow marks addition of the protein. Blue arrow marks addition of LDAO.
Figure 4
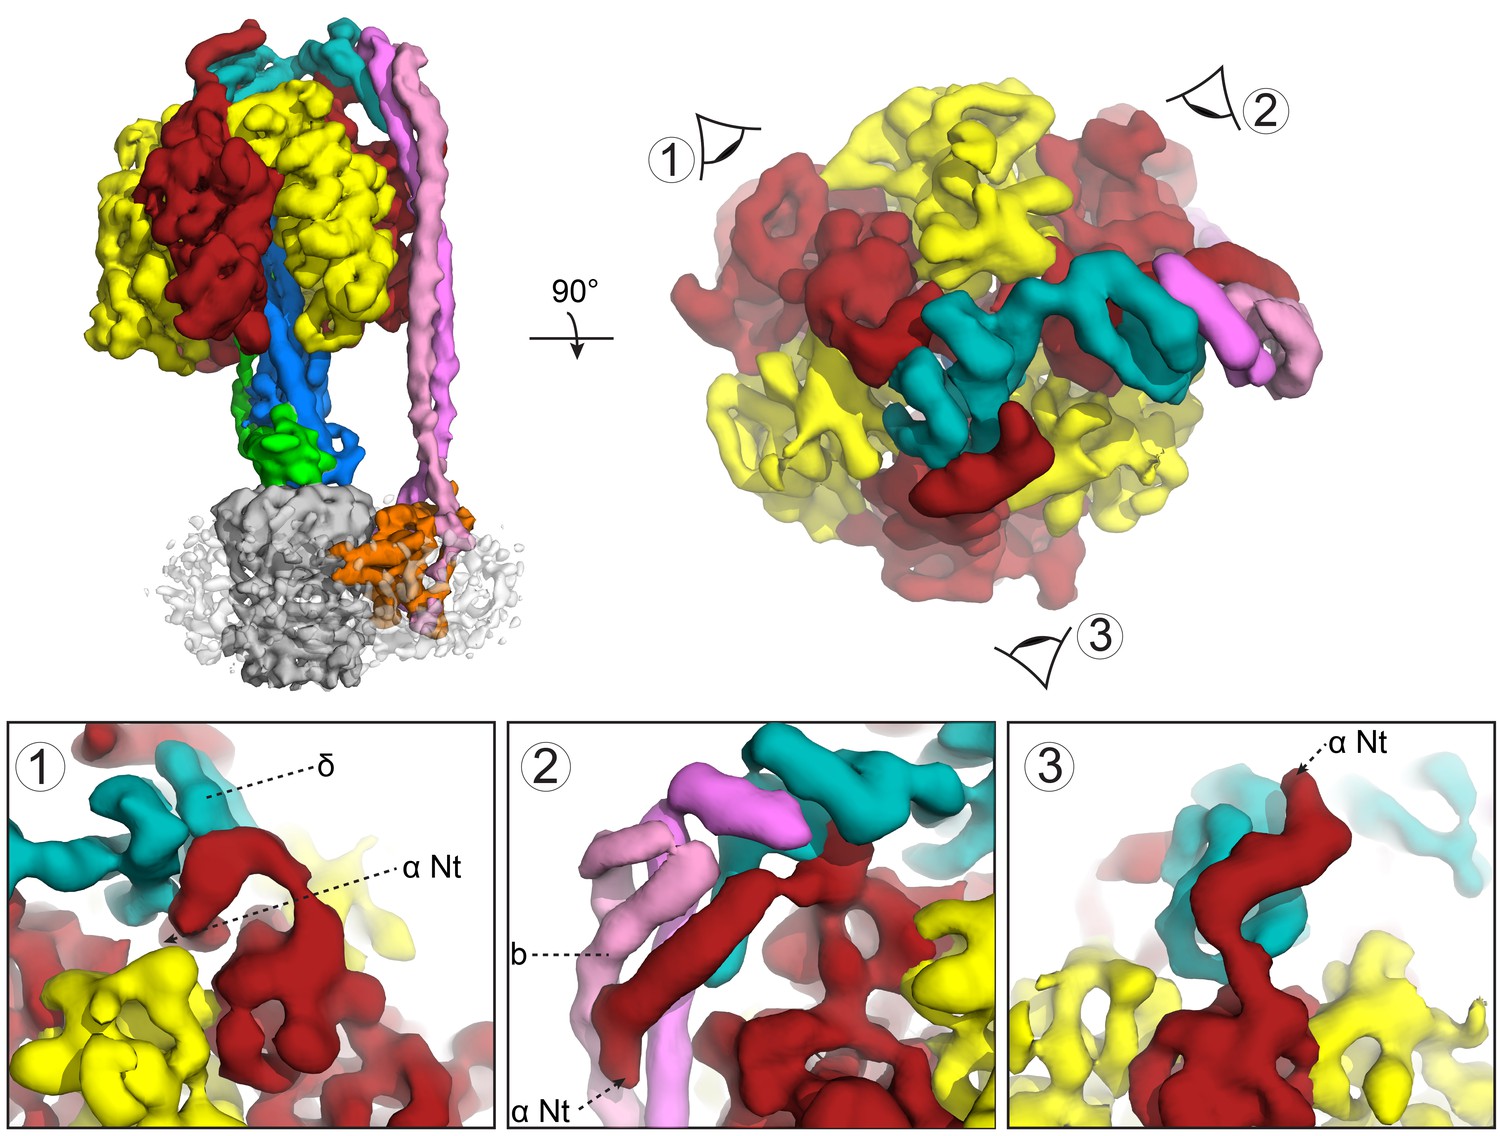
Subunit δ and peripheral stalk attachments to the α subunits.
Top panel; left, the segmented cryoEM map viewed from the side and right, viewed from above with the orientation of views 1, 2 and 3 depicted. Bottom panel; detailed views of the three attachment points labeled 1, 2 and 3, with δ in teal, b in pink and magenta and α in red.
Figure 5

Autoinhibted E. coli F1-ATPase conformation.
The αβ hetrodimers of state 1 as viewed from the membrane with the peripheral stalk to the left of the figure. The ‘open, closed, open’ conformation of the F1 motor is labeled and the positions of nucleotides are shown as blue surfaces.
Figure 6 with 5 supplements

The E. coli F-ATPase subunit a and the suggested path of proton translocation.
(A) Density map of subunit a, shown as orange surface viewed from the c-ring. Grey outline depicts invaginations of the detergent micelle, with arrows showing possible proton path. (B) Cartoon representation of subunit a with a horizontal stripe to depict the position of Asp61 on the c-ring (red where Asp61 would be bound to a proton and blue when bound to Arg210). Functional mutants labeled as follows; essential arginine in blue, substitution with Arg210 resulting in functional complex in yellow, mutation to arginine resulting in a dysfunctional complex in teal and residues that are aqueous accessible in red. Solid arrows show a possible proton path via two ‘half’ channels and dashed arrows show the path when bound to Asp61 of the c-ring and rotating.
Figure 6—figure supplement 1
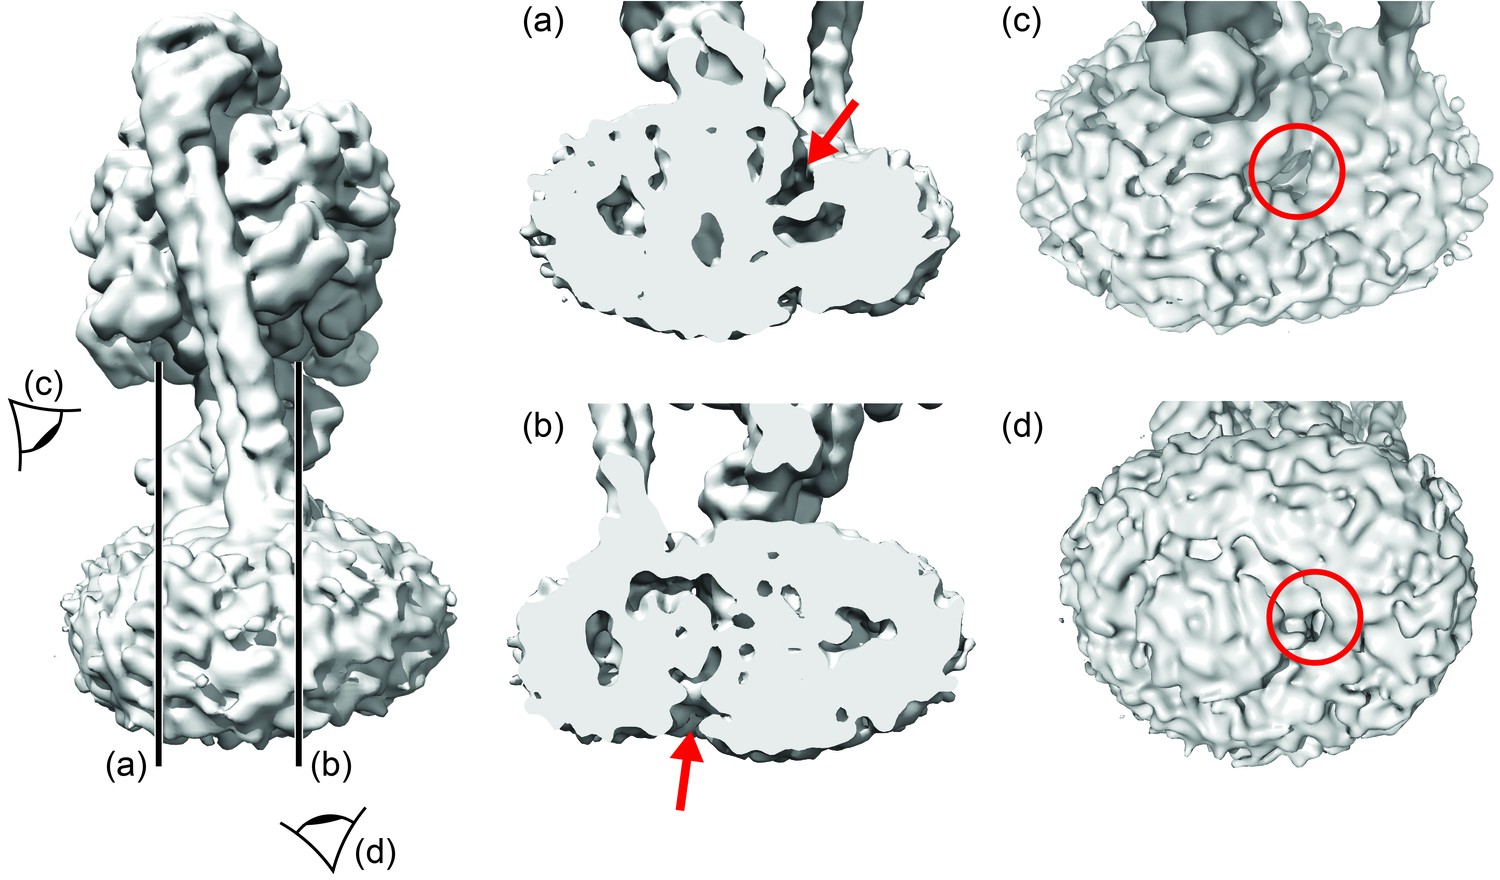
Aqueous cavities of the E.coli FO motor.
Left: overall map, with cross-section and viewpoints highlighted. (a) and (b): cross-sections to show invaginations (red arrows). (c) and (d): views from cytoplasm and periplasm to show invaginations (within red circles).
Figure 6—figure supplement 2
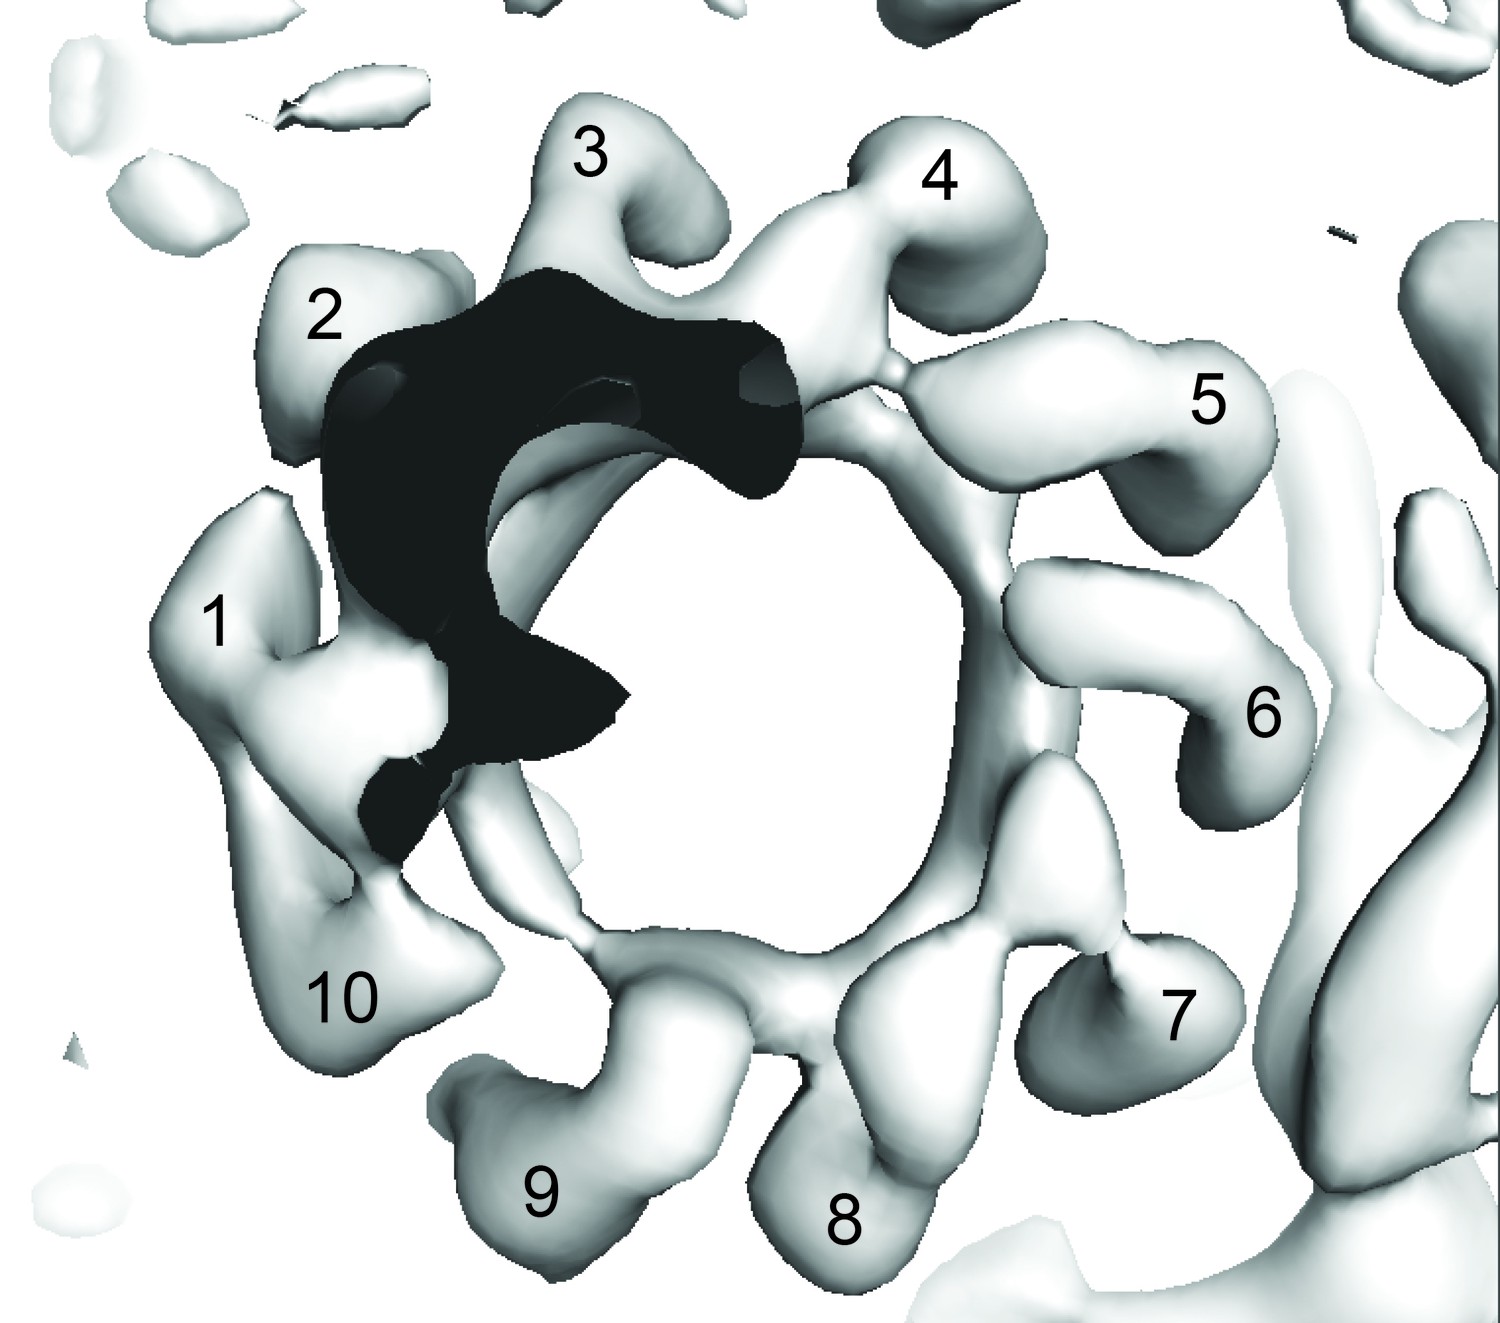
View of the State two map from F1 to show c-ring stoichiometry (numbered).
https://doi.org/10.7554/eLife.21598.024
Figure 6—figure supplement 3
Crosslinks of the E.coli FO motor.
Yellow lines depict distances between Cα atoms known to crosslink when double cysteine mutants are introduced. (A–C) intramolecular crosslinks identified in subunit a. The sequence was mapped to minimize the distance of these crosslinks, with them localizing to two groups. (D–F) intermolecular crosslinks added to model show that the docked sequence maps well to the c-ring, but not as well to the b subunit.
Figure 6—figure supplement 4
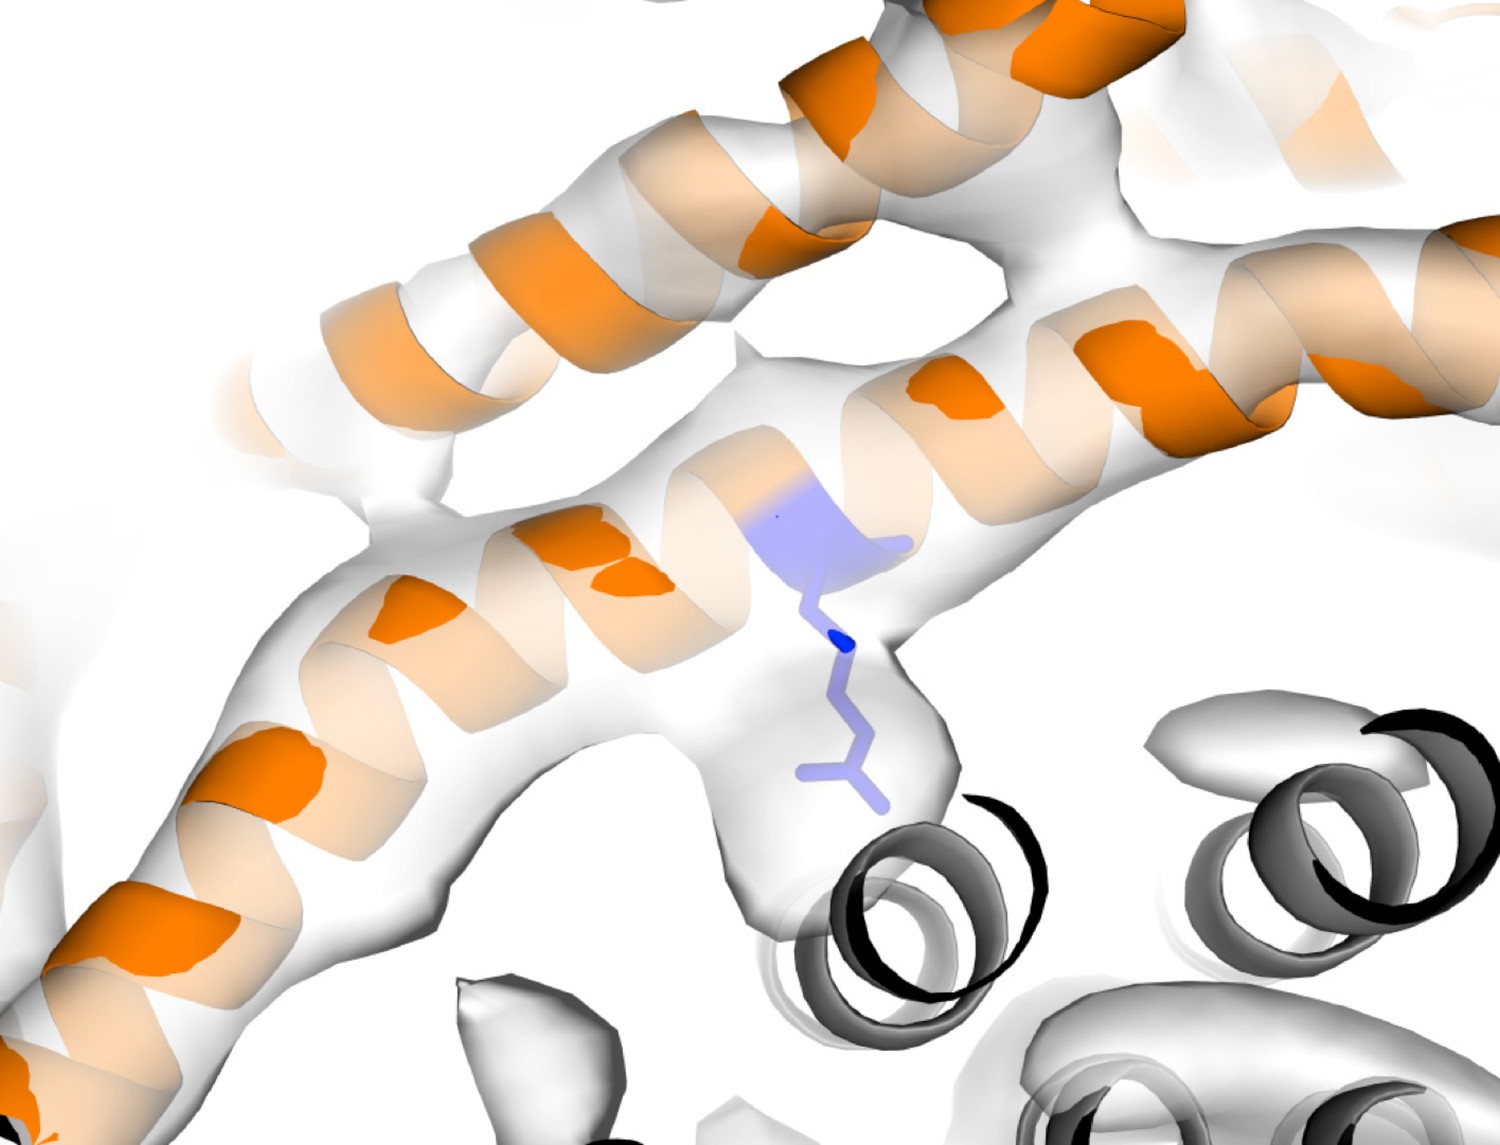
Strong density near Arg210.
Arg210 of subunit a shown as blue stick, subunit a shown as orange cartoon, c-ring shown as grey cartoon and State one density shown as white surface.
Figure 6—figure supplement 5
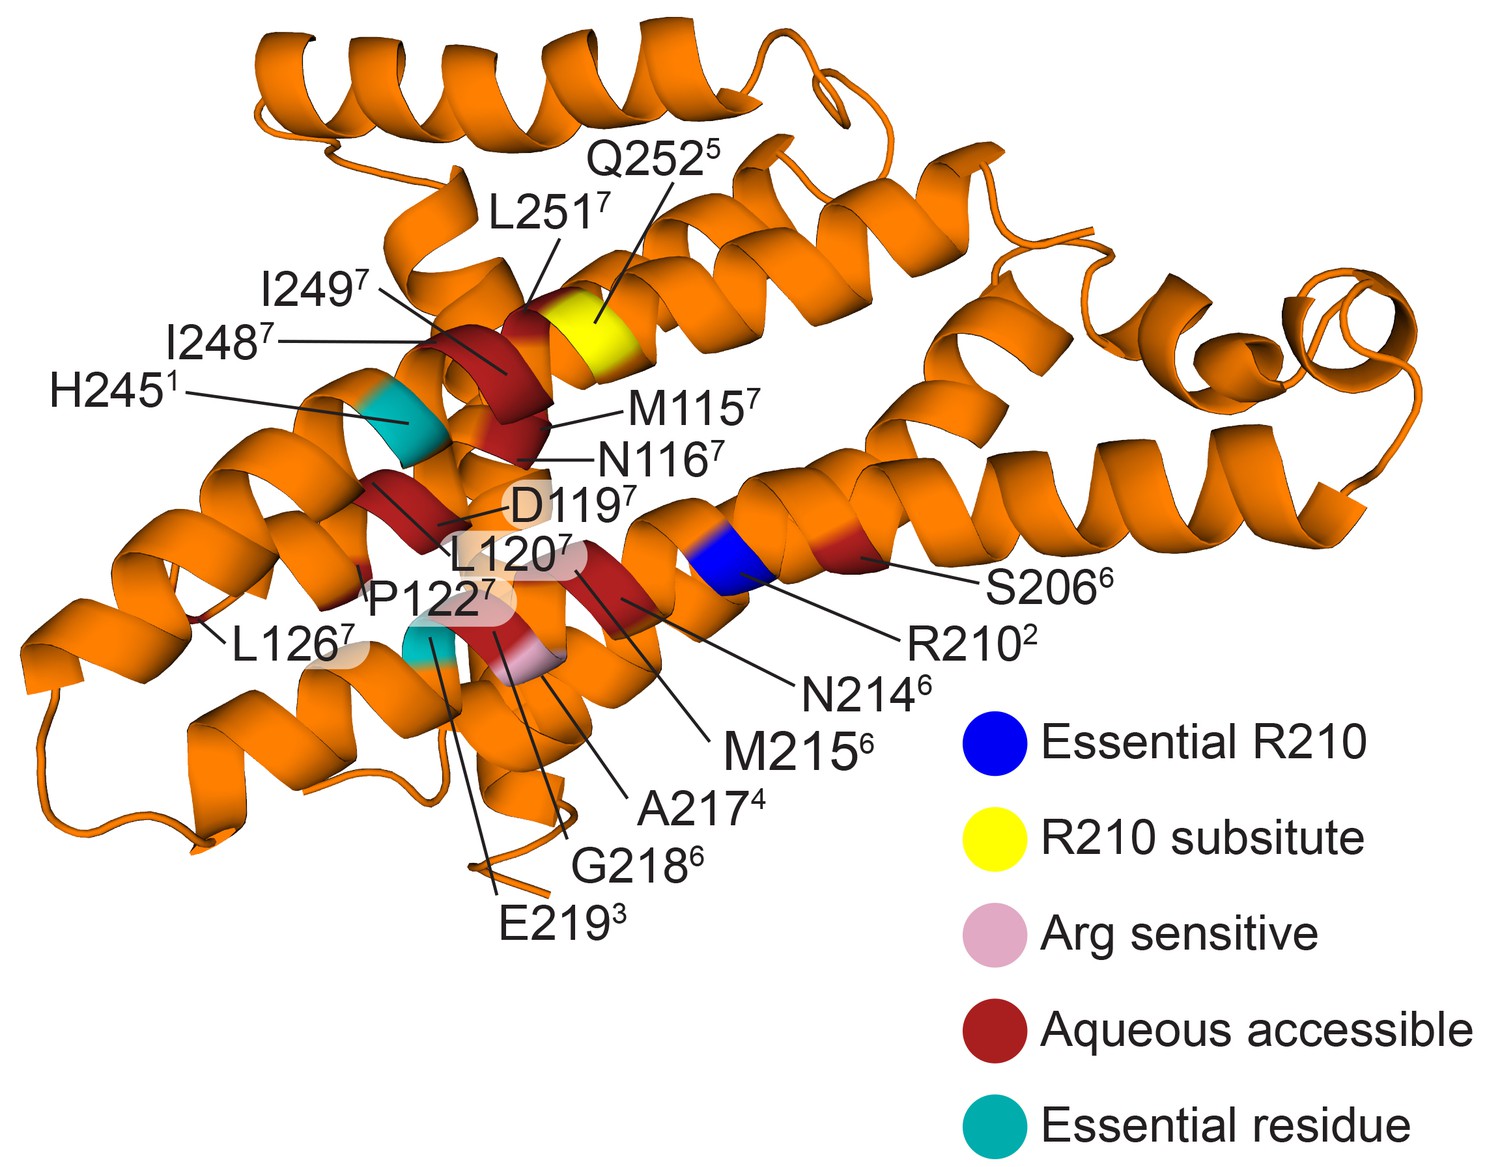
Functional mutants of E.coli F-ATPase subunit a.
As in main text Figure 6B, but with residues labeled and referenced (superscript number). (1. Cain and Simoni, 1986; 2. Lightowlers et al., 1987; 3. Lightowlers et al., 1988; 4. Cain and Simoni, 1989; 5. Hatch et al., 1995; 6. Angevine and Fillingame, 2003; 7. Angevine et al., 2003).
Author response image 1
Videos
Video 1
Interpolation between States 1, 3 and 2 to simulate ATP synthesis by E. coli F-ATPase.
A and B are rotated 90° about the y-axis.
Video 2
View of Fo motor during ATP synthesis.
Same as main text Figure 6b, but with rotating c-ring in the foreground.
Download links
A two-part list of links to download the article, or parts of the article, in various formats.
Downloads (link to download the article as PDF)
Open citations (links to open the citations from this article in various online reference manager services)
Cite this article (links to download the citations from this article in formats compatible with various reference manager tools)
Cryo-EM structures of the autoinhibited E. coli ATP synthase in three rotational states
eLife 5:e21598.
https://doi.org/10.7554/eLife.21598


