Spinal microcircuits comprising dI3 interneurons are necessary for motor functional recovery following spinal cord transection
- Brain and Mind Research Institute, University of Ottawa, Canada
- Dalhousie University, Canada
- University College London, United Kingdom
Figures
Figure 1 with 1 supplement
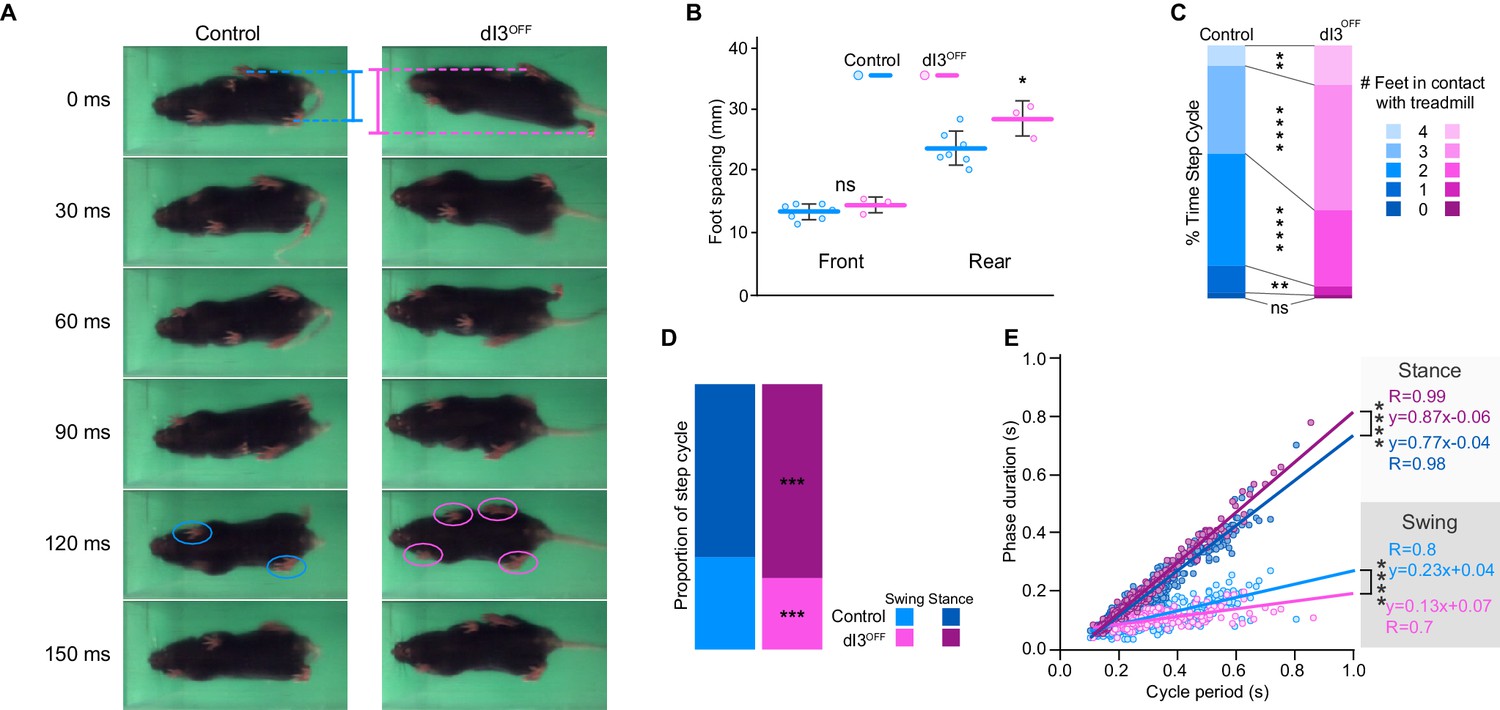
dI3 INs are subtly involved in locomotion.
(A) Footprint snapshots in control (cyan) and dI3OFF (magenta) littermates at 30 ms intervals starting from the onset of the stance of right hindlimb (top) running at 30 cm/s. Coloured lines represent hindlimb feet spacing, circles indicate foot contact. (B) Front and rear foot spacing for control (cyan, n = 6) and dI3OFF (magenta, n = 3) animals running between 10 and 50 cm/s. Mean +/− Standard Deviation. (C) Proportion of time with indicated number of feet contacting the treadmill belt in same animals running between 10 and 18 cm/s. (D) Percentage of swing (light shades) and stance (dark shades) in same animals running between 10 and 18 cm/s. (E) Correlation between swing or stance duration and cycle period in same animals running between 9.5 cm/s and 72 cm/s. Each data point represents a single step cycle. Analysis of Covariance (ANCOVA) on slopes. (B, C, D) Two-way ANOVA followed by Sidak post-hoc multiple comparison test. *p<0.05, **p<0.01, ***p<0.001, and ****p<0.0001, ns non-significant.
-
Figure 1—source data 1
Related to Figure 1B.
- https://doi.org/10.7554/eLife.21715.004
-
Figure 1—source data 2
Related to Figure 1C.
- https://doi.org/10.7554/eLife.21715.005
-
Figure 1—source data 3
Related to Figure 1D.
- https://doi.org/10.7554/eLife.21715.006
-
Figure 1—source data 4
Related to Figure 1E.
- https://doi.org/10.7554/eLife.21715.007
-
Figure 1—source data 5
Related to Figure 1I.
- https://doi.org/10.7554/eLife.21715.008
Figure 1—figure supplement 1

Interlimb coordination in dI3OFF mice is similar to controls.
(A) Comparison of phase relationships during treadmill recording at 30 cm/s between control (cyan shades, n = 7) and dI3OFF (magenta shades n = 3) animals. Mean +/− Standard Deviation **p<0.01, ns non-significant, two-way ANOVA followed by Sidak post-hoc multiple comparison test. (B) Illustration of foot coupling is provided on the right.
-
Figure 1—figure supplement 1—source data 1
Related to Figure 1—figure supplement 1A.
- https://doi.org/10.7554/eLife.21715.010
Figure 2 with 1 supplement
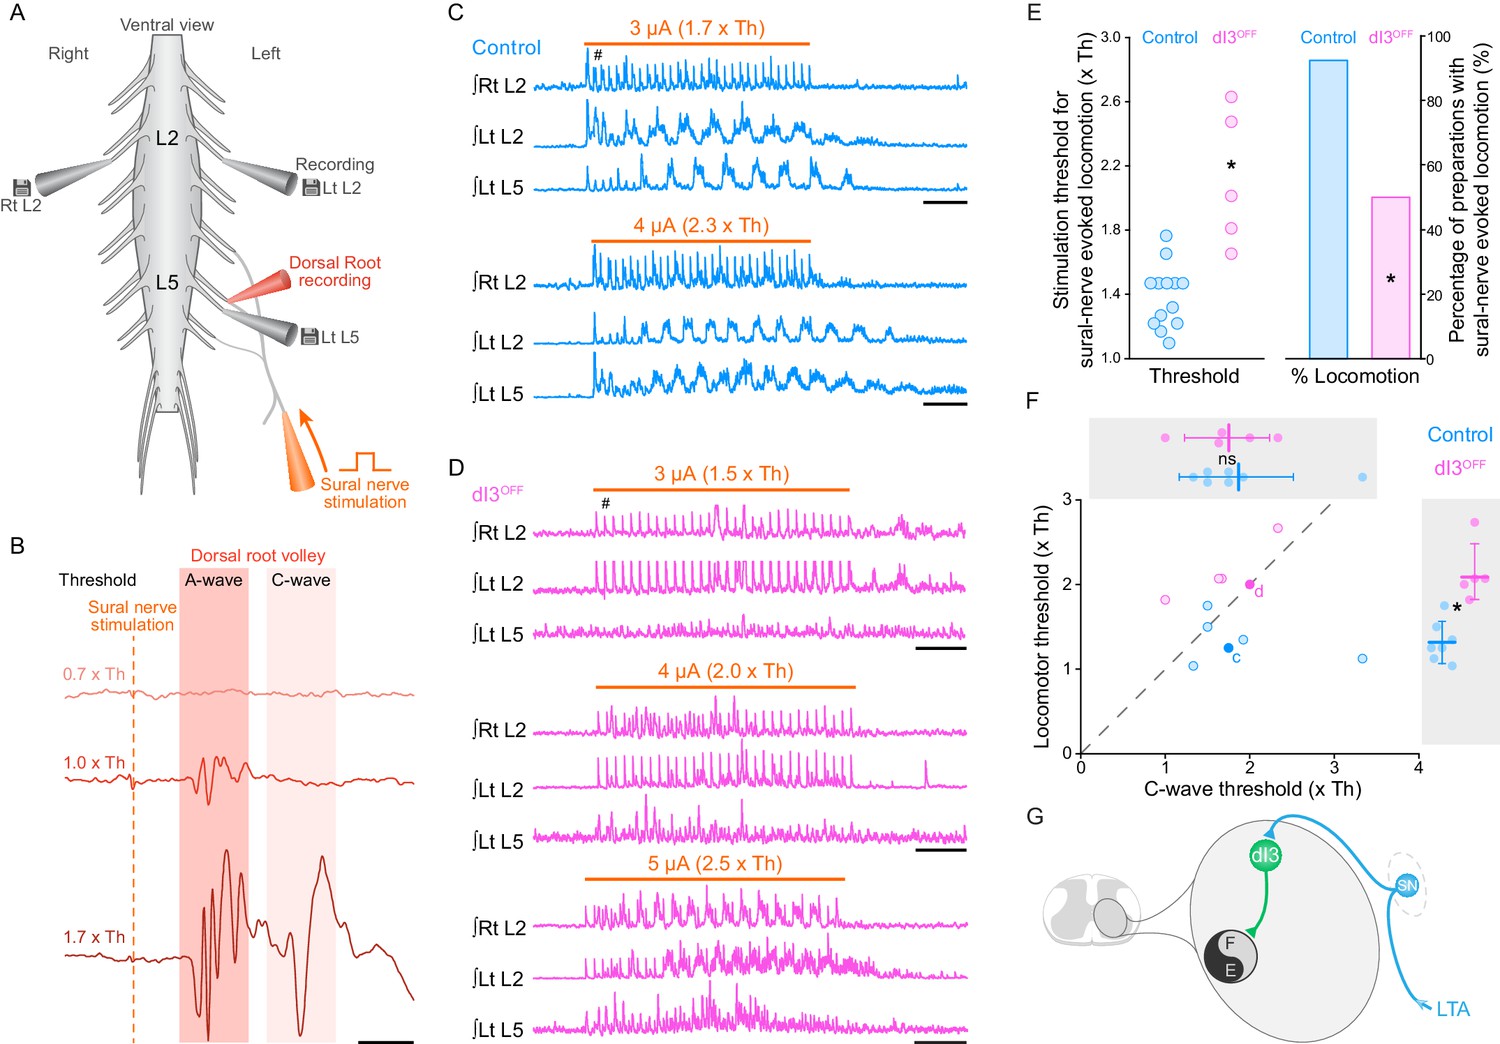
dI3 INs activate spinal locomotor circuits.
(A) Experimental preparation showing isolated spinal cord with sural nerve attached. Sural nerve stimulation (arrow) is used to evoke locomotion, while recording ipsilateral (Left) L5 and bilateral L2 ventral root activity (grey electrodes). Stimulus strength determined by volleys in dorsal root recordings (red electrode). (B) Dorsal root potentials in response to sural nerve stimulation (single pulse, 0.25 ms) recorded in ipsilateral L5 dorsal root of a dI3OFF spinal cord. Dotted line denotes stimulation artifact. Stimulation strength is in relation to the threshold (Th) to evoke a short-latency A-wave. A-wave threshold was 1.5 μA for this dI3OFF spinal cord. (C) Rectified and time-integrated ventral root recordings during sural-nerve stimulation (10 s train, 3 Hz, 0.25 ms long pulses, thick orange line) in control mice. Brief voltage deflections in the recordings are stimulation artifacts (#). (D) Rectified and time-integrated ventral root recordings during sural-nerve stimulation in dI3OFF mice. Note the lack of locomotor activity with stimulation strength ≤2 x Th. Brief voltage deflections in the recordings are stimulation artifacts (#). (E) Threshold of stimulation to evoke locomotor activity by sural nerve stimulation (left) and percentage of preparations with sural-nerve evoked locomotor activity (right) in control and dI3OFF mice. The threshold of stimulation was not determined for one of the six dI3OFF spinal cords in which sural-nerve evoked locomotion was observed. Two-tailed Student’s t-test for threshold of stimulation, Fisher’s exact test for percentage of successful preparations. (F) Relationship between the thresholds for evoking locomotion and the long latency C-wave. Dashed line represents line of unity. Spinal cords in which locomotor but not C-wave thresholds were measured are not shown. There is no difference in C-wave thresholds (inset above), but there is a significant increase in locomotor threshold (right inset) between control (cyan) and dI3OFF mice (magenta). dI3 INs corresponding to recordings in panels 2C and 2D are marked by full colored circles and their respective letters. Two-tailed Student’s t-test. (G) Diagram depicting access of dI3 INs to spinal locomotor circuits. Stimulation of low-threshold afferents (LTA, blue) recruits dI3 INs, which provide drive to spinal locomotor circuits (black and grey circle). *p<0.05, Scale bars, 5 ms (B), 2 s (C, D).
-
Figure 2—source data 1
Related to Figure 2E.
- https://doi.org/10.7554/eLife.21715.013
-
Figure 2—source data 2
Related to Figure 2F.
- https://doi.org/10.7554/eLife.21715.014
Figure 2—figure supplement 1
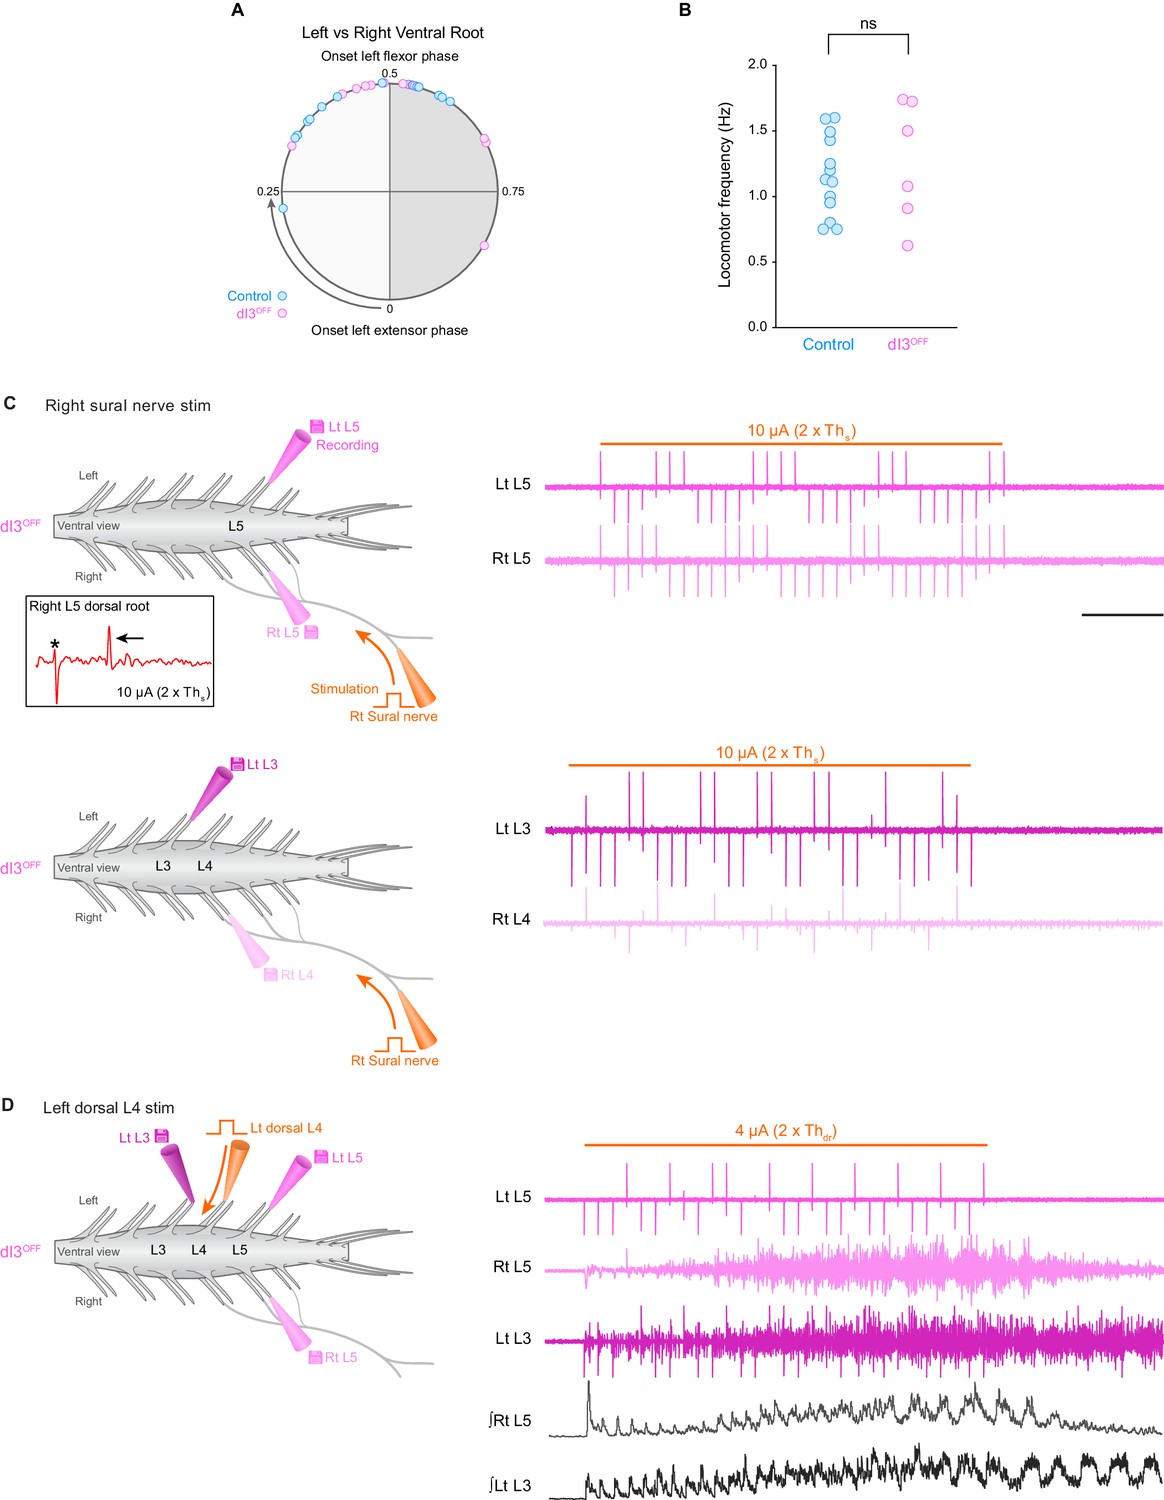
When evocable by sural nerve stimulation in dI3OFF mice, locomotion is similar to control mice, and when not evocable, locomotion can be initiated by dorsal root stimulation.
(A) Phase coordination between right and left ventral roots during sural nerve evoked locomotion in control (cyan, n = 16 step cycles from two spinal cords) and dI3OFF (magenta, n = 12 step cycles from two spinal cords). Comparisons were made between right and left flexor-related (L1–L3) ventral root activity or from right and left extensor-related (L4–L6) ventral root activity. Phase coordination was similar between control and dI3OFF spinal cords, p>0.15, two-tailed Student’s t-test assuming unequal variances. (B) Frequency of locomotor activity evoked by sural nerve stimulation (10 s train, 3 Hz, 0.25 ms pulses) was similar between control (cyan) and dI3OFF (magenta) spinal cords. Frequencies were measured for stimulation strengths where rhythmic bursts were most defined. (ns non-significant, p>0.63, two-tailed Student’s t-test assuming unequal variances.) (C) Left, experimental setup of sural-nerve attached isolated spinal cord preparation. Recording electrodes (grey electrodes) are attached to ventral roots. The sural nerve is in continuity with the spinal cord and is stimulated (orange electrode) to evoke locomotor activity. Inset, right L5 dorsal root potential evoked by sural nerve stimulation. Asterisk denotes stimulation artifact, arrow denotes the A-wave. Ths is defined as threshold for evoking short-latency L5 dorsal root potential in response to sural nerve stimulation. Right, ventral root recordings during right sural-nerve stimulation (10 s train, 3 Hz, 0.25 ms long pulses, thick orange line) in dI3OFF spinal cord. Brief voltage deflections in the recordings are stimulation artifacts. Top and bottom traces are from two separate applications of the stimulation with recording electrodes attached to different sets of ventral roots. (D) Same setup as in C except that stimulation was applied to the left L4 dorsal root (orange electrode). Ventral root recordings during dorsal root stimulation in the same dI3OFFmouse as in C showing rhythmic locomotor-like activity. Thdr is defined as threshold for evoking short-latency L5 dorsal root potential in response to dorsal root stimulation. ∫Rt L5, ∫Lt L3: rectified and integrated ventral root recordings. Scale bar, 2 s, applies to C and D.
Figure 3 with 1 supplement
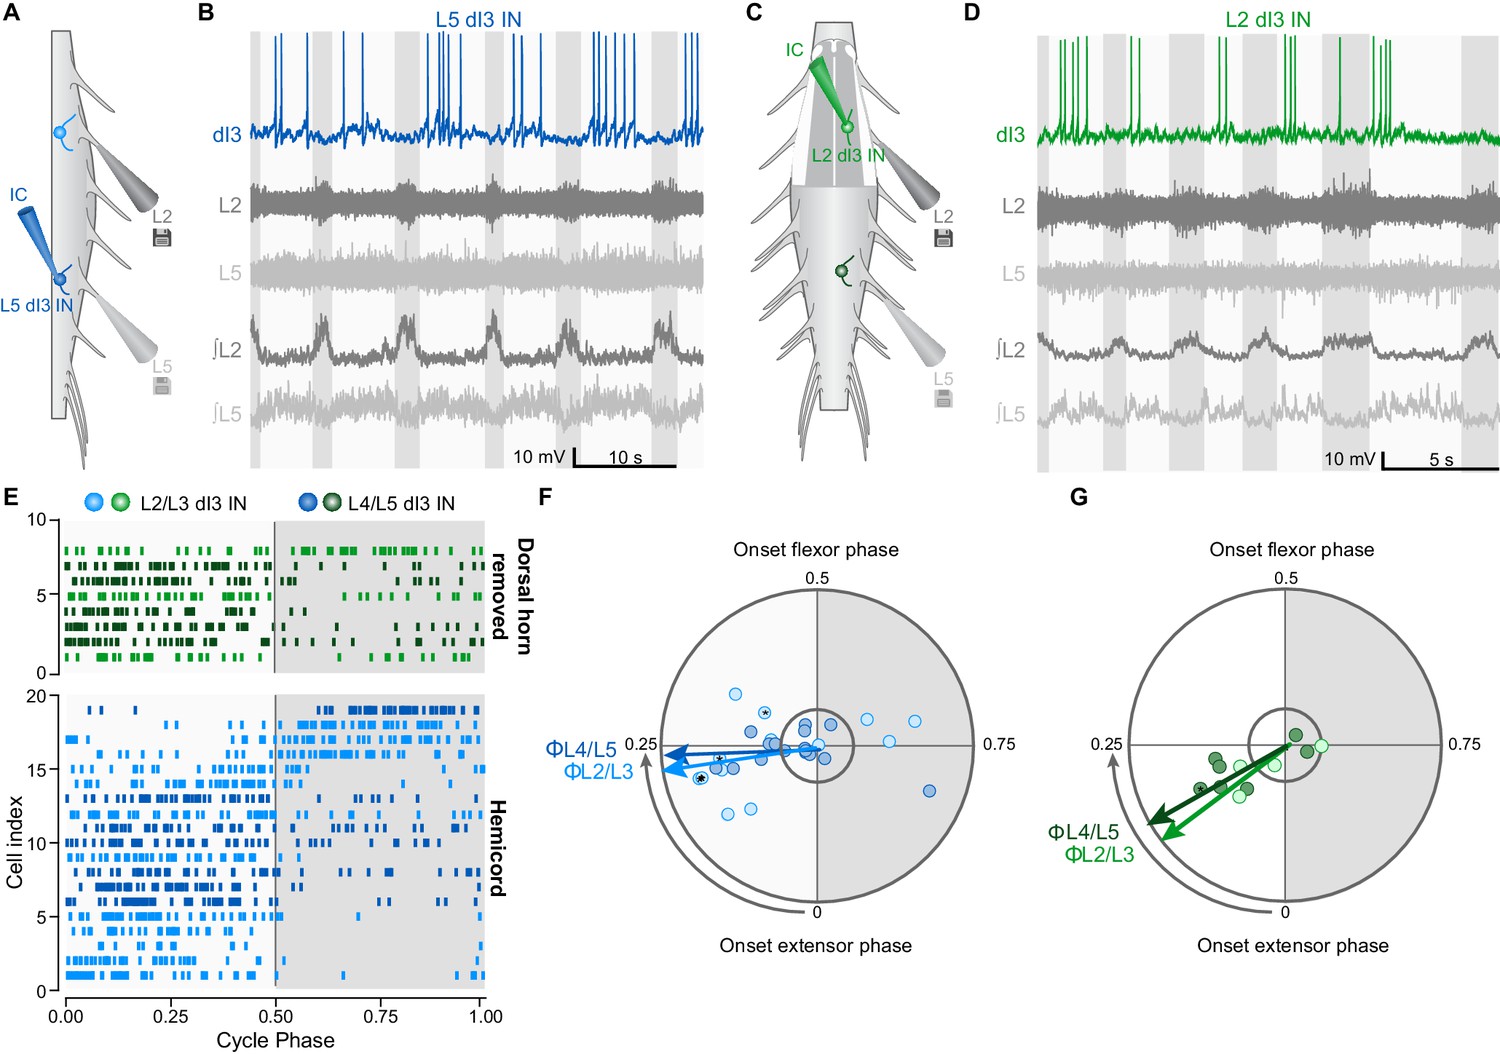
dI3 INs are rhythmically active during fictive locomotion.
(A) Schematic of hemicord preparation indicating the position of recording electrodes as well as L2/L3 (light blue) and L4/L5 (dark blue) dI3 INs. (B) Current-clamp recording of L5 dI3 IN rhythmically active during drug-evoked locomotion in hemicord preparation. dI3 IN: whole-cell patch clamp recording. L2, L5: raw ventral root recordings. ∫L2, L5: rectified and integrated ventral root recordings. (C) Schematic of L1-L3 dorsal horn removed preparation indicating the position of recording electrodes as well as L2/L3 (light green) and L4/L5 (dark green) dI3 INs. For recordings of L4/L5 dI3 INs, the dorsal horn overlying L4-L6 was removed. (D) Current-clamp recording of L3 dI3 IN rhythmically active during drug-evoked locomotion in dorsal horn removed preparation. dI3 IN: whole-cell patch clamp recording. L2, L5: raw ventral root recordings. ∫L2, L5: rectified and integrated ventral root recordings. (E) Raster plot of dI3 IN spiking during drug-evoked locomotion. 50 randomly selected spikes (a fewer number of spikes from cells 2, 3, 5, and 14 from hemicord preparations and cell 4 from dorsal horn removed preparation were recorded) are shown for each cell. Locomotor cycles were double-normalized such that a phase of 0 marks the beginning of extensor phase, 0.5 marks the beginning of the flexor phase/end of the extensor phase. Only dI3 INs determined to be rhythmically active are shown (see F, G). (F) Polar plot summarizing rhythmic activity of dI3 INs in hemicords (n = 13 L2/L3 dI3 INs light blue, and 16 L4/L5 dI3 INs dark blue). Mean phase and angular concentration r calculated from 50 or fewer randomly selected spikes. Each point depicts the average phase at which spikes occurred during the step cycle. The distance away from the centre represents r. The inner circle represents r = 0.24, which corresponds to significant rhythmicity (p<0.05) for 50 randomly selected spikes. Asterisks mark cells where rhythmicity was statistically demonstrated though fewer than 50 spikes were recorded. Arrows depict mean phase (Φ) of dI3 INs whose average phase was during the extensor phase. (G) Polar plot summarizing rhythmic activity of dI3 INs in dorsal horn removed spinal cords (n = 4 L2/L3 dI3 INs light green, and 7 L4/L5 dI3 INs dark green). Arrows depict mean phase (Φ) of dI3 INs whose average phase was during the extensor phase.
-
Figure 3—source data 1
Related to Figure 3E.
- https://doi.org/10.7554/eLife.21715.017
-
Figure 3—source data 2
Related to Figure 3F.
- https://doi.org/10.7554/eLife.21715.018
Figure 3—figure supplement 1
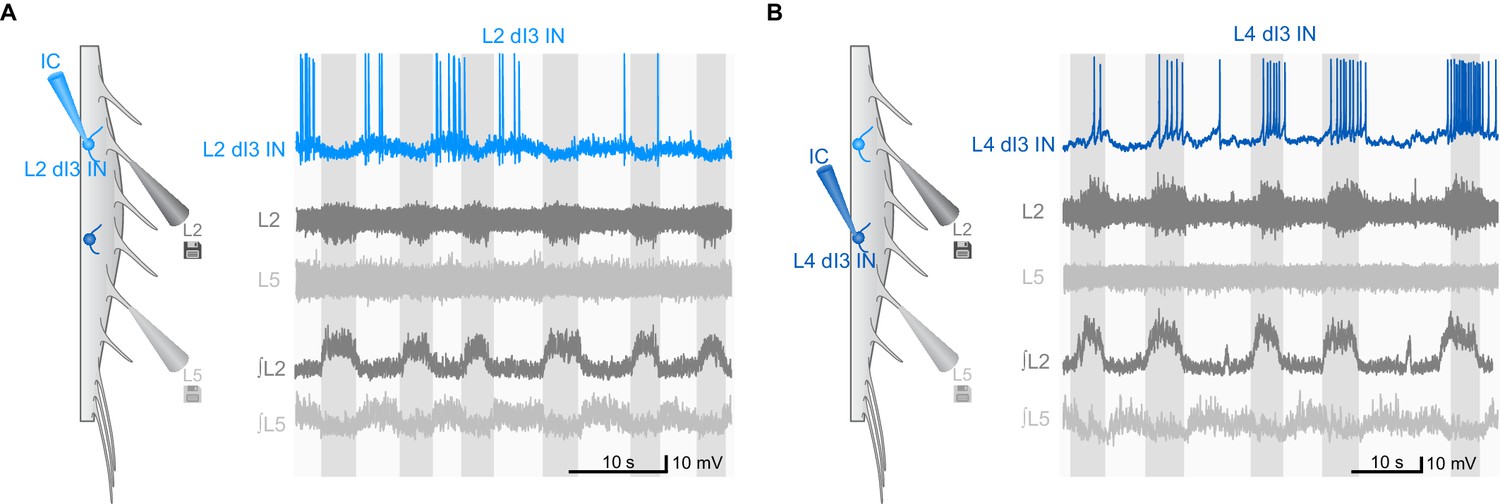
Examples of rhythmic activity of dI3 INs during fictive locomotion.
(A) Current-clamp recording of L2 dI3 IN (light blue) rhythmically active during extension. dI3 IN: whole-cell patch clamp recording (light blue). L2 (dark grey), L5 (light grey): raw ventral root recording from L2 and L5. ∫L2, L5: rectified and integrated ventral root recordings. (B) L4 dI3 IN (dark blue) rhythmically active during flexion. dI3 IN: whole-cell patch clamp recording (dark blue). L2 (dark grey), L5 (light grey): raw ventral root recording from L2 and L5. ∫L2, L5: rectified and integrated ventral root recordings.
Figure 4 with 1 supplement
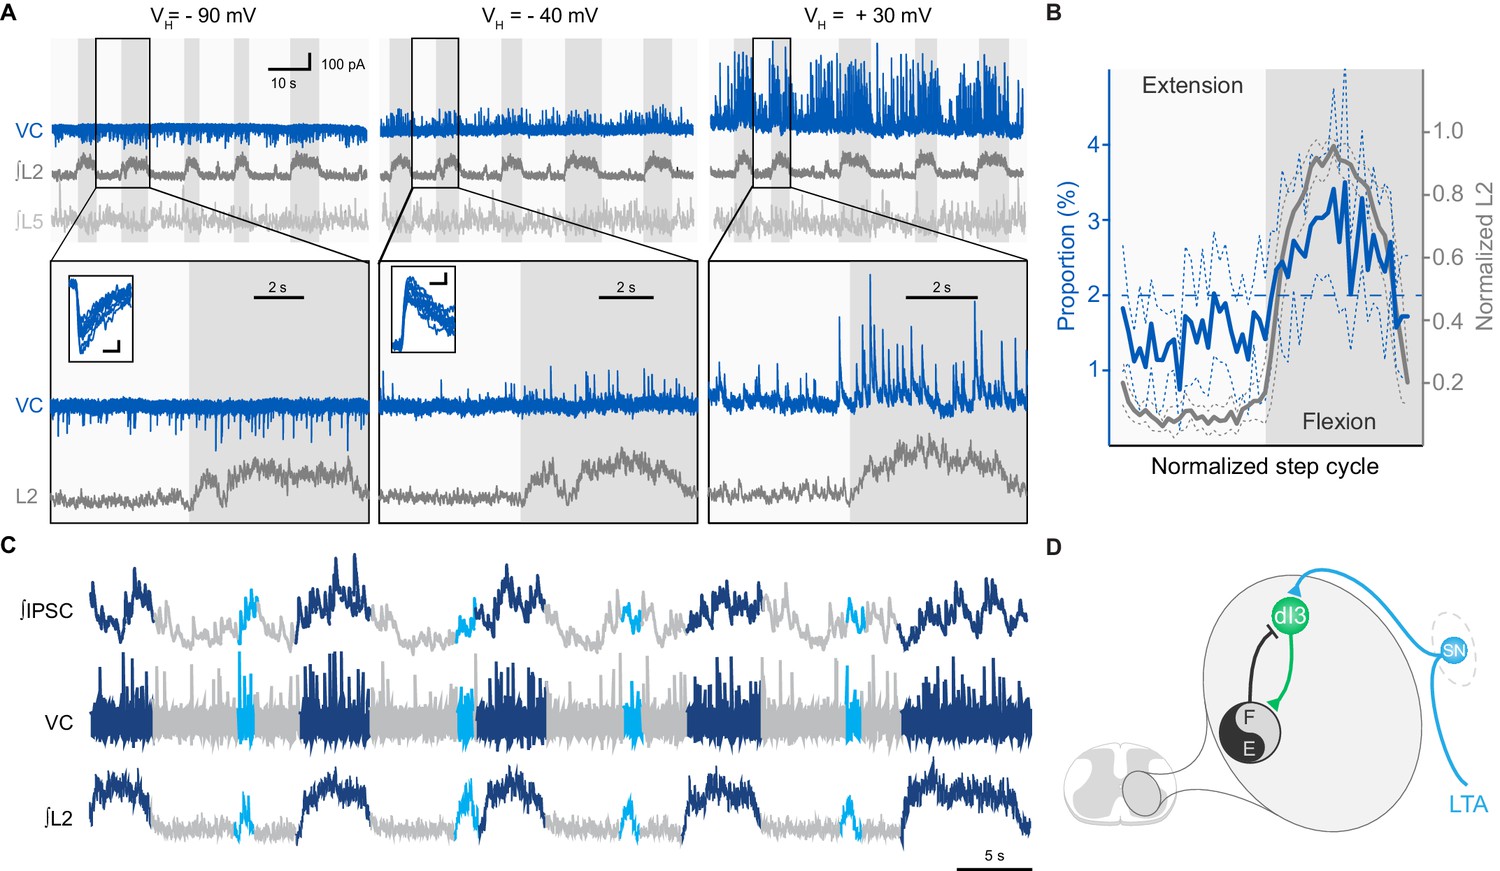
dI3 INs receive rhythmic synaptic inputs during drug-evoked locomotion.
(A) Voltage-clamp recording (VC) of L5 dI3 IN during drug-evoked locomotion at different holding potentials (VH). Bottom two rows are expanded time-scale representation of data in boxes seen in top two rows. Insets depict 10 postsynaptic currents of greatest magnitude within the flexor phase. Scale bars within insets, 5 ms, 25 pA. (B) Distribution of IPSCs through the step cycle (n = 6622 IPSCs occurring in 116 step cycles in seven preparations) overlaid with averaged normalised L2 ventral root recordings (means and standard deviations shown). Step cycle was divided into 50 bins. Dashed line at 2% indicates the proportion of IPSCs if they were evenly distributed throughout the step cycle. (C) Voltage-clamp recording (VC) at holding potential of −40 mV of L5 dI3 IN during drug-evoked locomotion with brief flexion bursts (cyan) during extension. Bursts of IPSCs were observed during regular (dark blue) and brief flexion bursts as evidenced in integrated IPSCs trace (top trace). (D) Diagram showing added inhibition of dI3 INs arising from flexor module of spinal locomotor circuits.
-
Figure 4—source data 1
Related to Figure 4B.
- https://doi.org/10.7554/eLife.21715.021
Figure 4—figure supplement 1
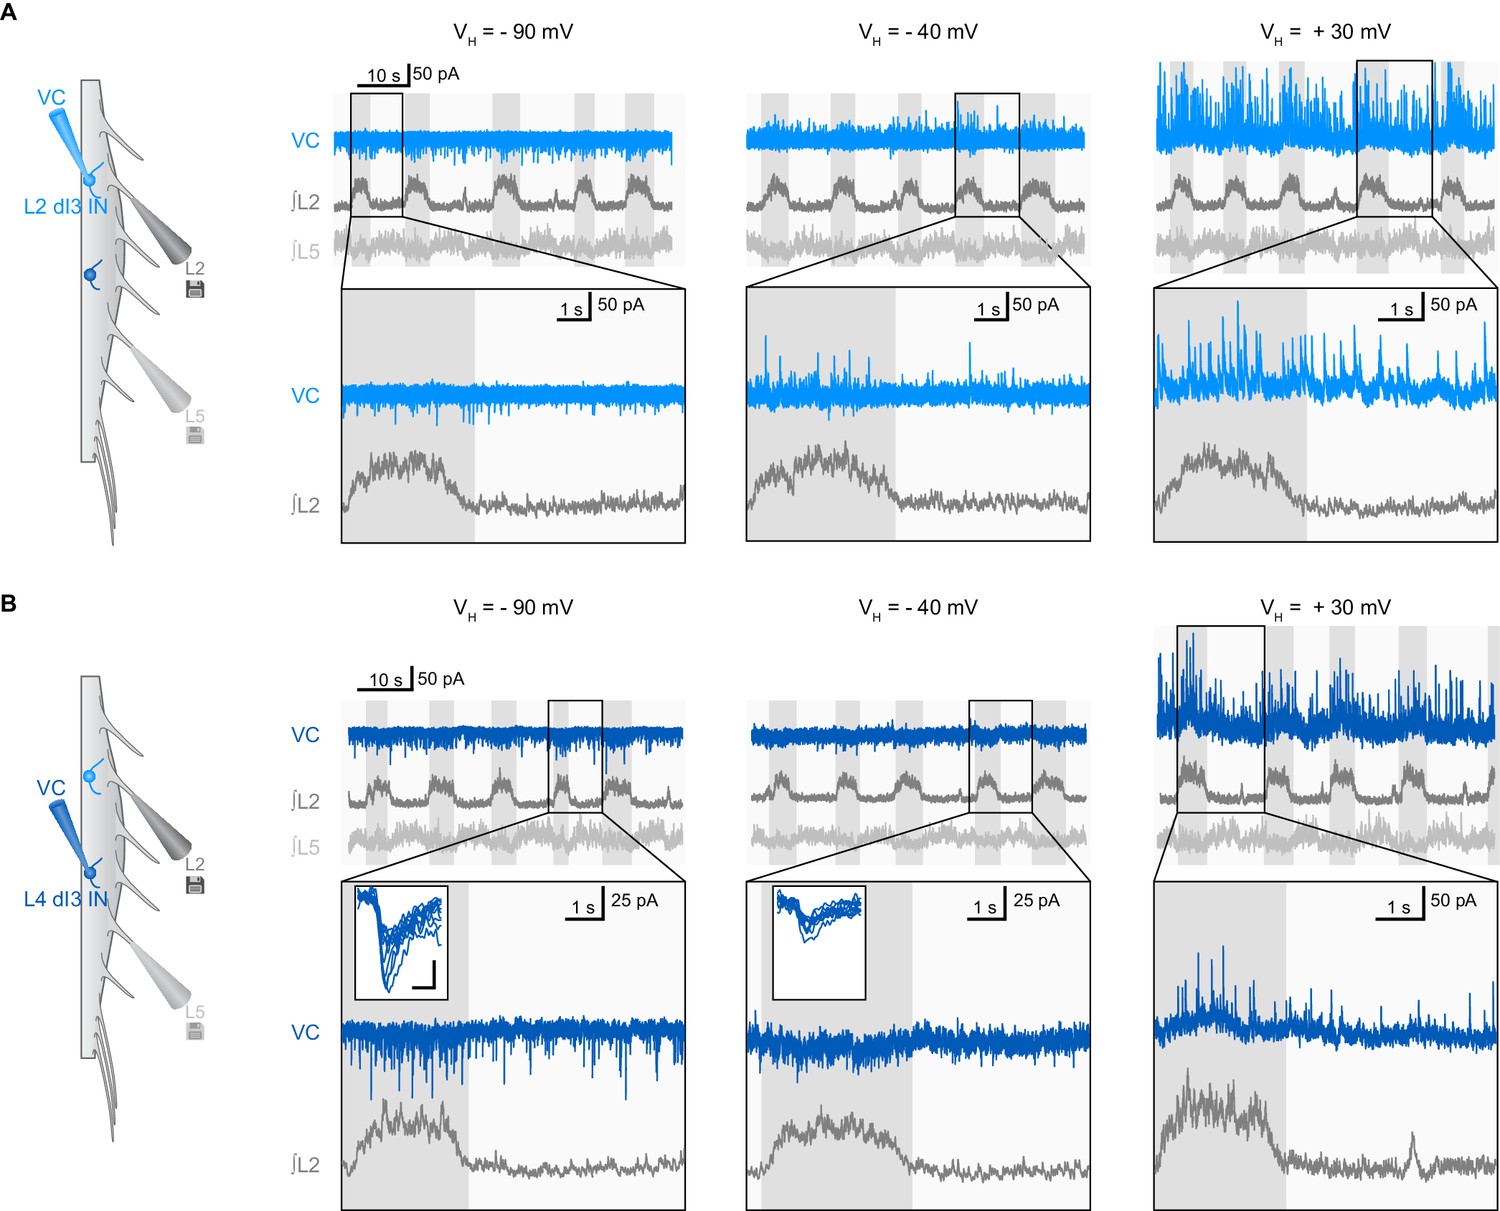
Examples of synaptic inputs to dI3 INs during fictive locomotion.
(A) Voltage-clamp (VC) recording of L2 dI3 IN rhythmically active during extension at different holding potentials (VH). Bottom two rows are expanded time-scale representation of data in boxes seen in top three rows. (B) Voltage-clamp (VC) recording of L4 dI4 IN (dark blue) rhythmically active during swing at different holding potentials (VH). Bottom two rows are expanded time-scale representation of data in boxes seen in top two rows. Insets depict 10 excitatory post-synaptic currents of greatest magnitude within the extensor phase. Scale bars within insets, 2 ms and 25 pA.
Figure 5 with 2 supplements
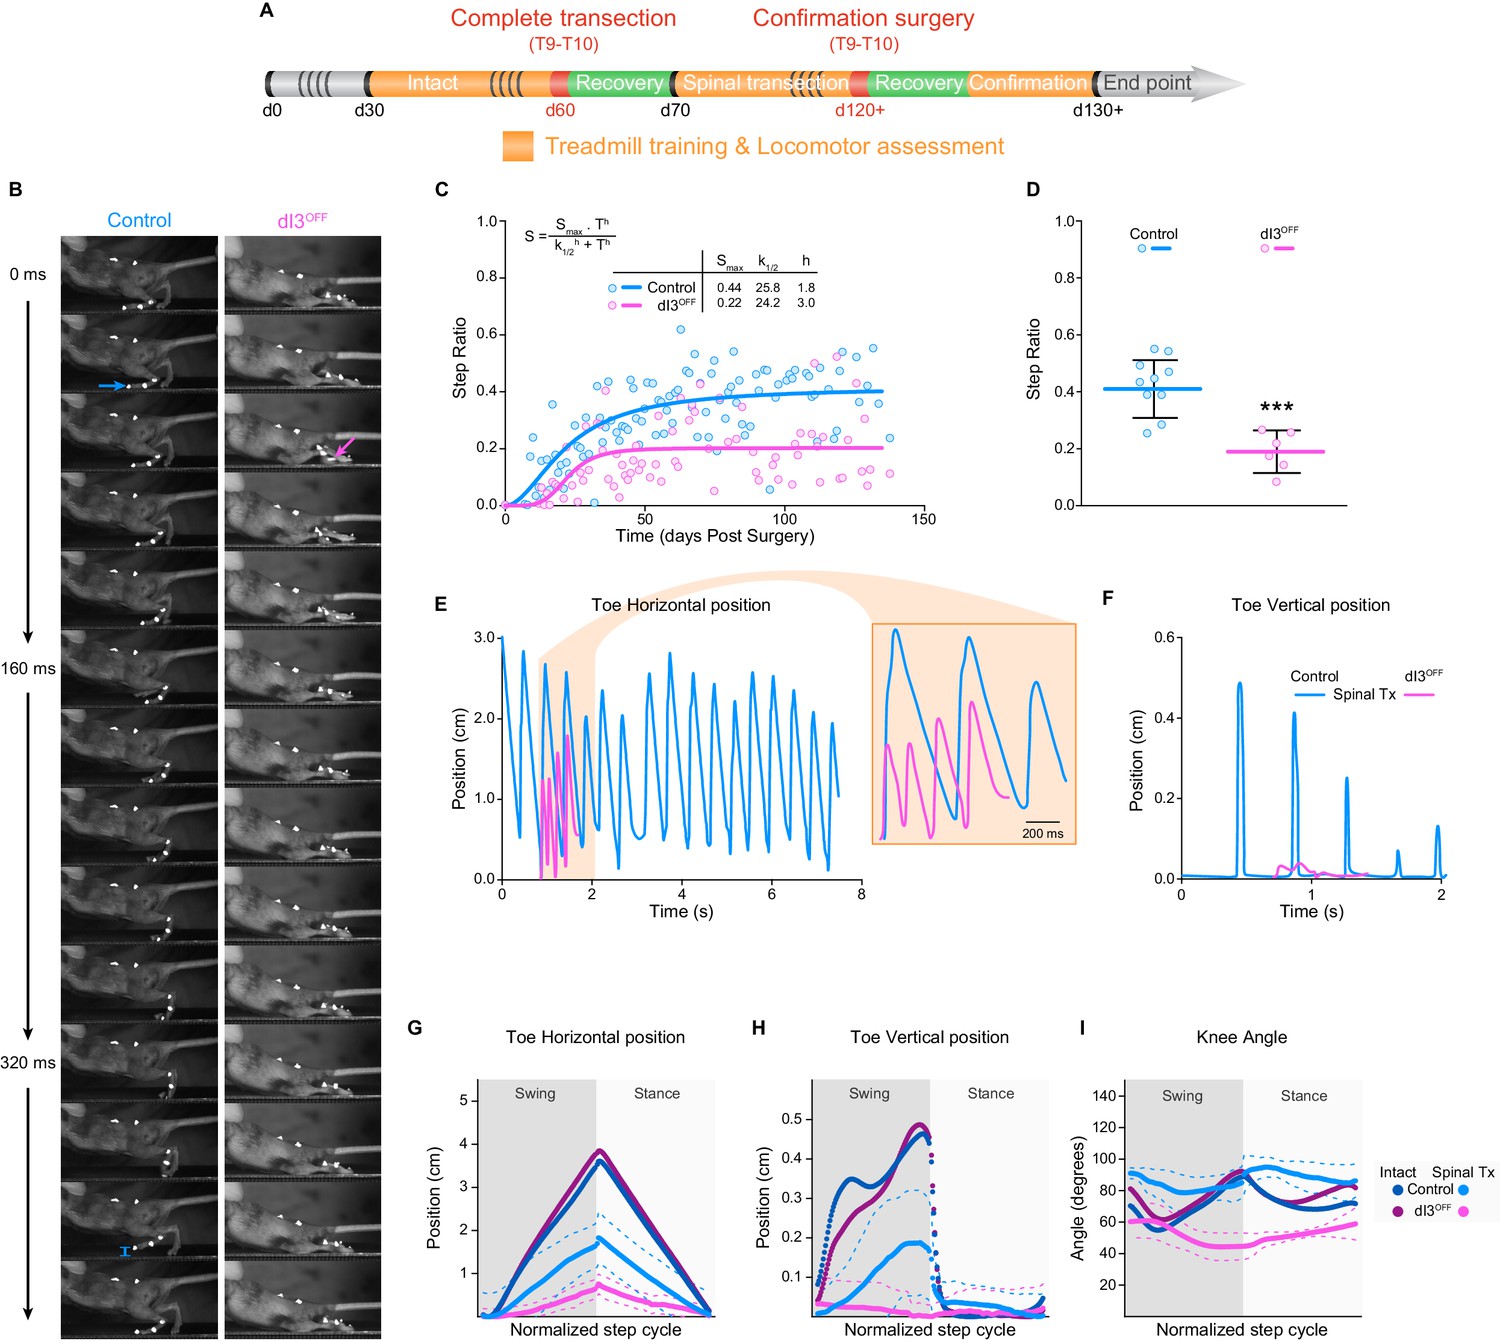
dI3 INs are involved in locomotor recovery following complete spinal transection.
(A) Experimental paradigm. Orange indicates period of treadmill training and locomotor performance assessments. Green indicates period of recovery following surgical procedures (red). Days (d) from birth are indicated. (B) Kinematic recording snapshots in control and dI3OFF mice 50 days following complete (and confirmed) lower thoracic spinal transection. Arrows depict proper paw dorsiflexion in control (cyan) and abnormal plantarflexion in dI3OFF (magenta) mice during stance. Cyan segment at t = 384 ms indicates toe elevation in control, which is absent in dI3OFF during the swing phase. Pictures at 32 ms intervals. (C) Hindlimb/Forelimb step ratio (S) as a function of time (T) following complete spinal transection in control (n = 6) and dI3OFF (n = 3) animals with non-linear sigmoidal fit, S = Smax * Th / (k1/2h + Th) where Smax is the maximum step ratio, h is the Hill slope (recovery rate), and k1/2 is the number of days to reach half the maximal step ratio. R2 = 0.53 and 0.23 respectively. (D) Hindlimb/Forelimb step ratio 30 days following complete spinal transection (Tx) in control (n = 10), and dI3OFF (n = 6) animals. Mean +/− Standard Deviation. Two-tailed Student’s t-test (***p<0.0001). (E to I) Toe coordinates along X (horizontal forward-backward axis E,G) and Y (vertical elevation F, H) axes, and knee angle (I) in control and dI3OFF spinal-transected animals 40 days post-surgery on a treadmill at 7 cm/s. Dashed lines represent standard deviation. Minimum weight-support was provided when necessary to complete the task. In G, H, and I, data from intact animals are shown in dark blue (control) and dark pink (dI3OFF) for comparison. Multiple t-tests corrected for multiple comparison Holm-Sidak. *p<0.05.
-
Figure 5—source data 1
Related to Figure 5C.
- https://doi.org/10.7554/eLife.21715.024
-
Figure 5—source data 2
Related to Figure 5D.
- https://doi.org/10.7554/eLife.21715.025
-
Figure 5—source data 3
Related to Figure 5G.
- https://doi.org/10.7554/eLife.21715.026
-
Figure 5—source data 4
Related to Figure 5H.
- https://doi.org/10.7554/eLife.21715.027
Figure 5—figure supplement 1

Confirmation of anatomical and functional spinal isolation.
(A–B) Post-mortem anatomy of control (A) and dI3OFF (B) spinal cords. Scar tissue removed. Animals included for analysis indicated by light borders, those excluded by dark borders. (C) Step Ratio quantification in control (cyan shades) and dI3OFF (magenta shades) before (Surgery 1) and immediately after the second surgery (Surgery 2). Subsequent analysis was performed only on animals showing equivalent locomotor performance (included, light shades) while animals showing a decreased step ratio were excluded (dark shades). (D) Experimental schema showing the group sizes of control (cyan) and dI3OFF (magenta) mice for spinal transection experiments. Most animals that did not survive the second surgery were assessed anatomically. Only animals that passed both functional (similar step ratio before and after second surgery) and anatomical (absence of tissue in the lesion site) assessments were included in the final kinematic analysis.
-
Figure 5—figure supplement 1—source data 1
Related to Figure 5—figure supplement 1C.
- https://doi.org/10.7554/eLife.21715.029
Figure 5—figure supplement 2
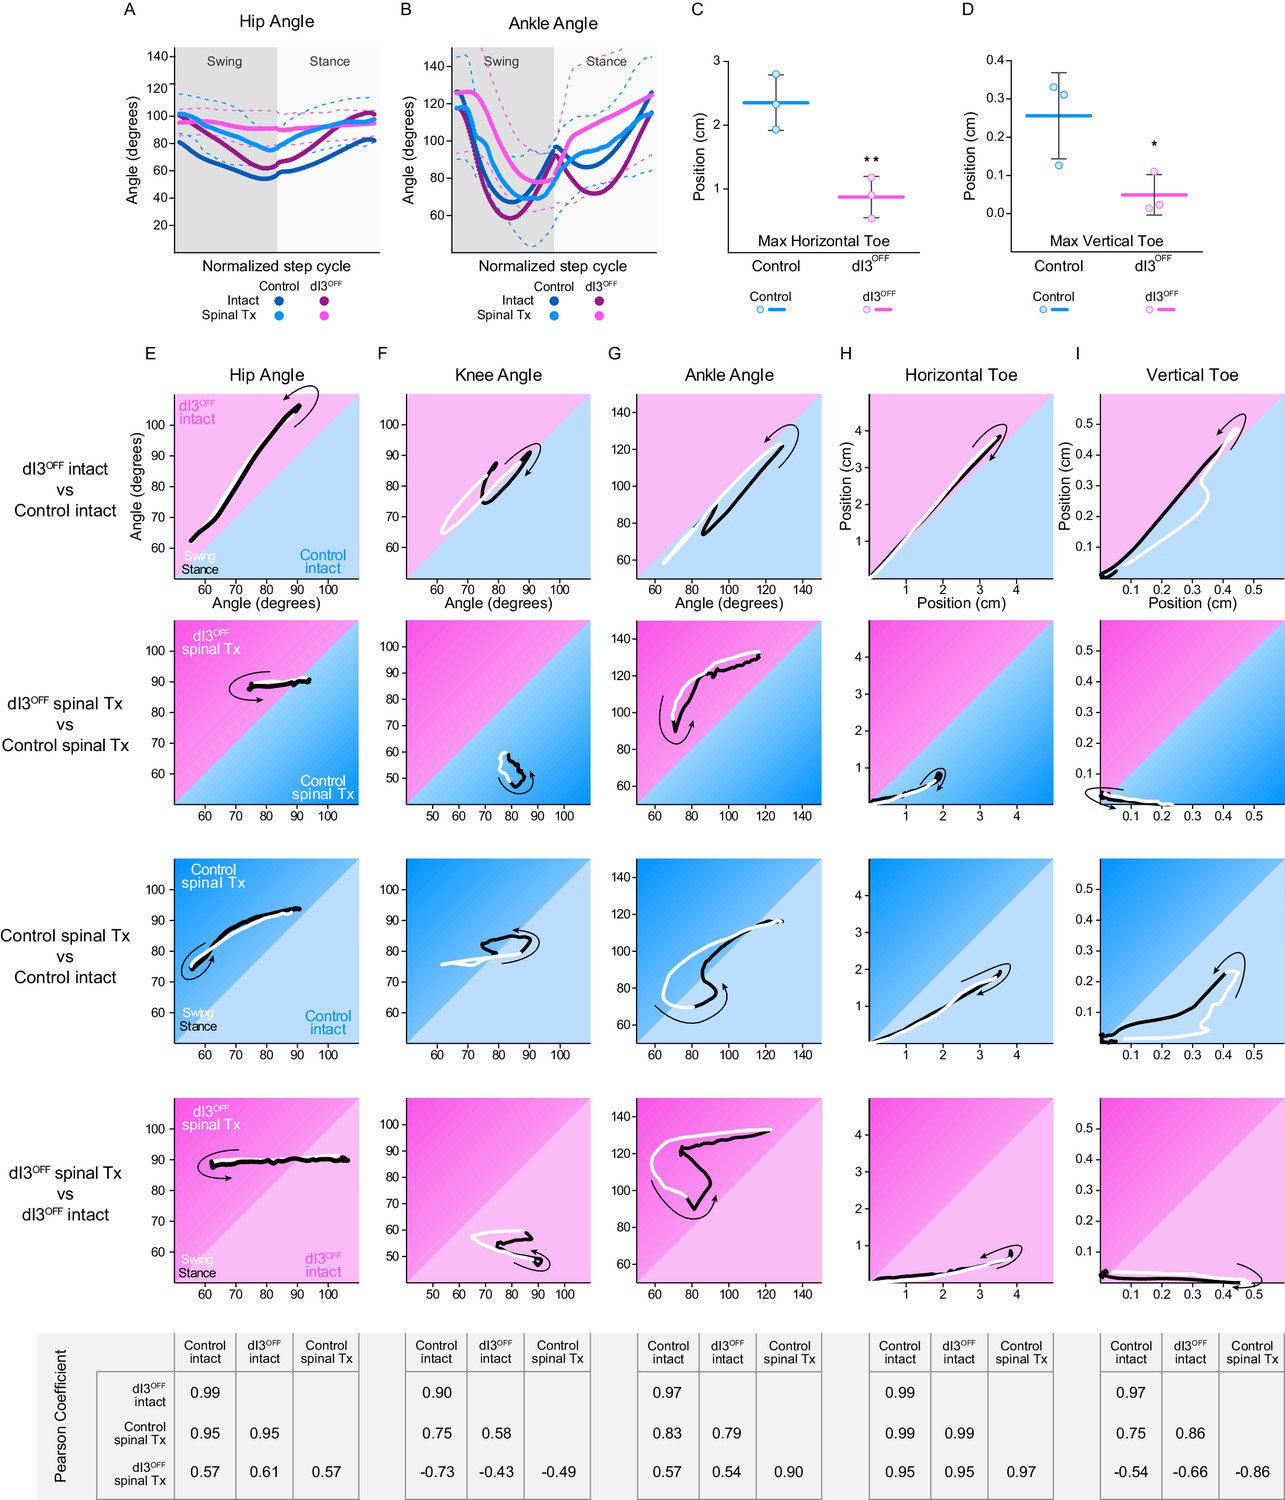
Locomotor function following isolation of spinal circuits.
(A–B) Hip (A) and Ankle (B) angles in control (cyan) and dI3OFF (magenta) intact (dark shades) and spinal-transected (light shades) animals 40 days post-surgery. Dashed lines represent standard deviation. (C,D) Maximum toe excursion along the horizontal (C) and vertical (D) axis in spinal transected control (cyan) and dI3OFF (magenta) animals 40 days post-surgery. Mean +/− Standard Deviation. Two-tailed Student’s t-test, *p<0.05; **p<0.01. (E–I) Correlation of normalized Hip (E), Knee (F), Ankle (G) angles, and Horizontal (H) and Vertical (I) Toe displacement between dI3OFF and Control intact (row) and transected (Tx, second row) mice and between intact and transected control mice (third row) or dI3OFF (Fourth row) mice. Arrow indicates direction at the stance onset. Swing: white; Stance: black. Bottom matrices indicate Pearson correlation coefficients for indicated pairs.
Figure 6
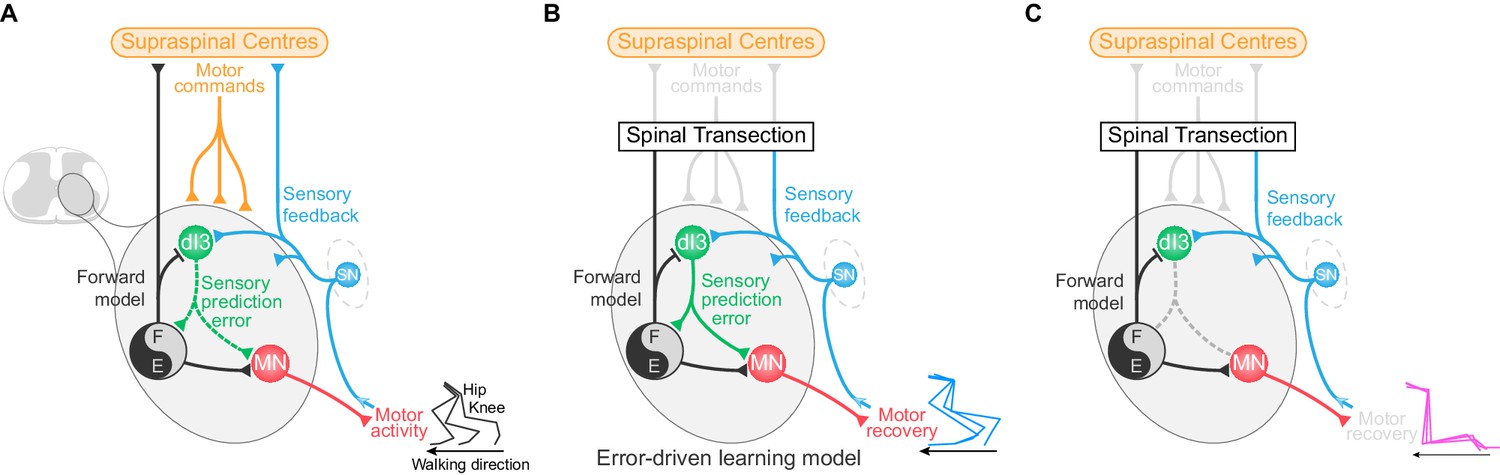
dI3 IN-mediated locomotor learning following spinal cord transection.
(A) Schematic showing the relationship of dI3 INs (green) to supraspinal centres (orange), sensory input (SN, blue), motoneurons (MN, red), and spinal locomotor circuits (black and grey circle). The types of signals conveyed by each projection are labelled. dI3 IN axons are depicted with dotted lines to demonstrate that they are not necessary for the generation of the normal rhythm and pattern of locomotion. (B) Schematic showing that following loss of connectivity with higher learning centres, locomotor learning is driven by sensory prediction error in a microcircuit centred around dI3 INs as comparators. dI3 INs act as comparators between a forward model from motor circuits and sensory feedback, and the solid projections from dI3 INs indicate that they are required for locomotor recovery following spinal cord transection. (C) Removing the output of dI3 INs from the circuit prevents the comparison of sensory feedback and forward models, and thus precludes functional locomotor recovery.
Videos
Video 1
Foot print recordings in intact animals.
Foot print recordings of control and dI3OFF animals running at 30 cm/s, recorded at 100 fps and displayed at 15 fps. Animals were recorded separately.
Video 2
Foot print recordings following spinal cord transection.
Foot print recordings of control and dI3OFF animals at 7 cm/s 50 days after spinal transection, recorded at 100 fps and displayed at 15 fps. Animals were recorded separately.
Video 3
Kinematic recordings in intact animals.
Kinematic recordings of control and dI3OFF animals running at 20 cm/s, recorded at 250 fps and displayed at 15 fps. Animals were recorded separately.
Video 4
Kinematic recordings following spinal cord transection.
Kinematic recordings of control and dI3OFF animals at 7 cm/s 50 days after spinal transection recorded at 250 fps and displayed at 15 fps. Weight support was provided. Animals were recorded separately.
Download links
A two-part list of links to download the article, or parts of the article, in various formats.
Downloads (link to download the article as PDF)
Open citations (links to open the citations from this article in various online reference manager services)
Cite this article (links to download the citations from this article in formats compatible with various reference manager tools)
Spinal microcircuits comprising dI3 interneurons are necessary for motor functional recovery following spinal cord transection
eLife 5:e21715.
https://doi.org/10.7554/eLife.21715


