T cell receptor repertoires of mice and humans are clustered in similarity networks around conserved public CDR3 sequences
- Weizmann Institute of Science, Israel
- Alfred University, United States
- National Cancer Institute, United States
- Laboratory of Immunogenetics, National Institute of Allergy and Infectious Diseases, United States
Figures
Figure 1 with 6 supplements
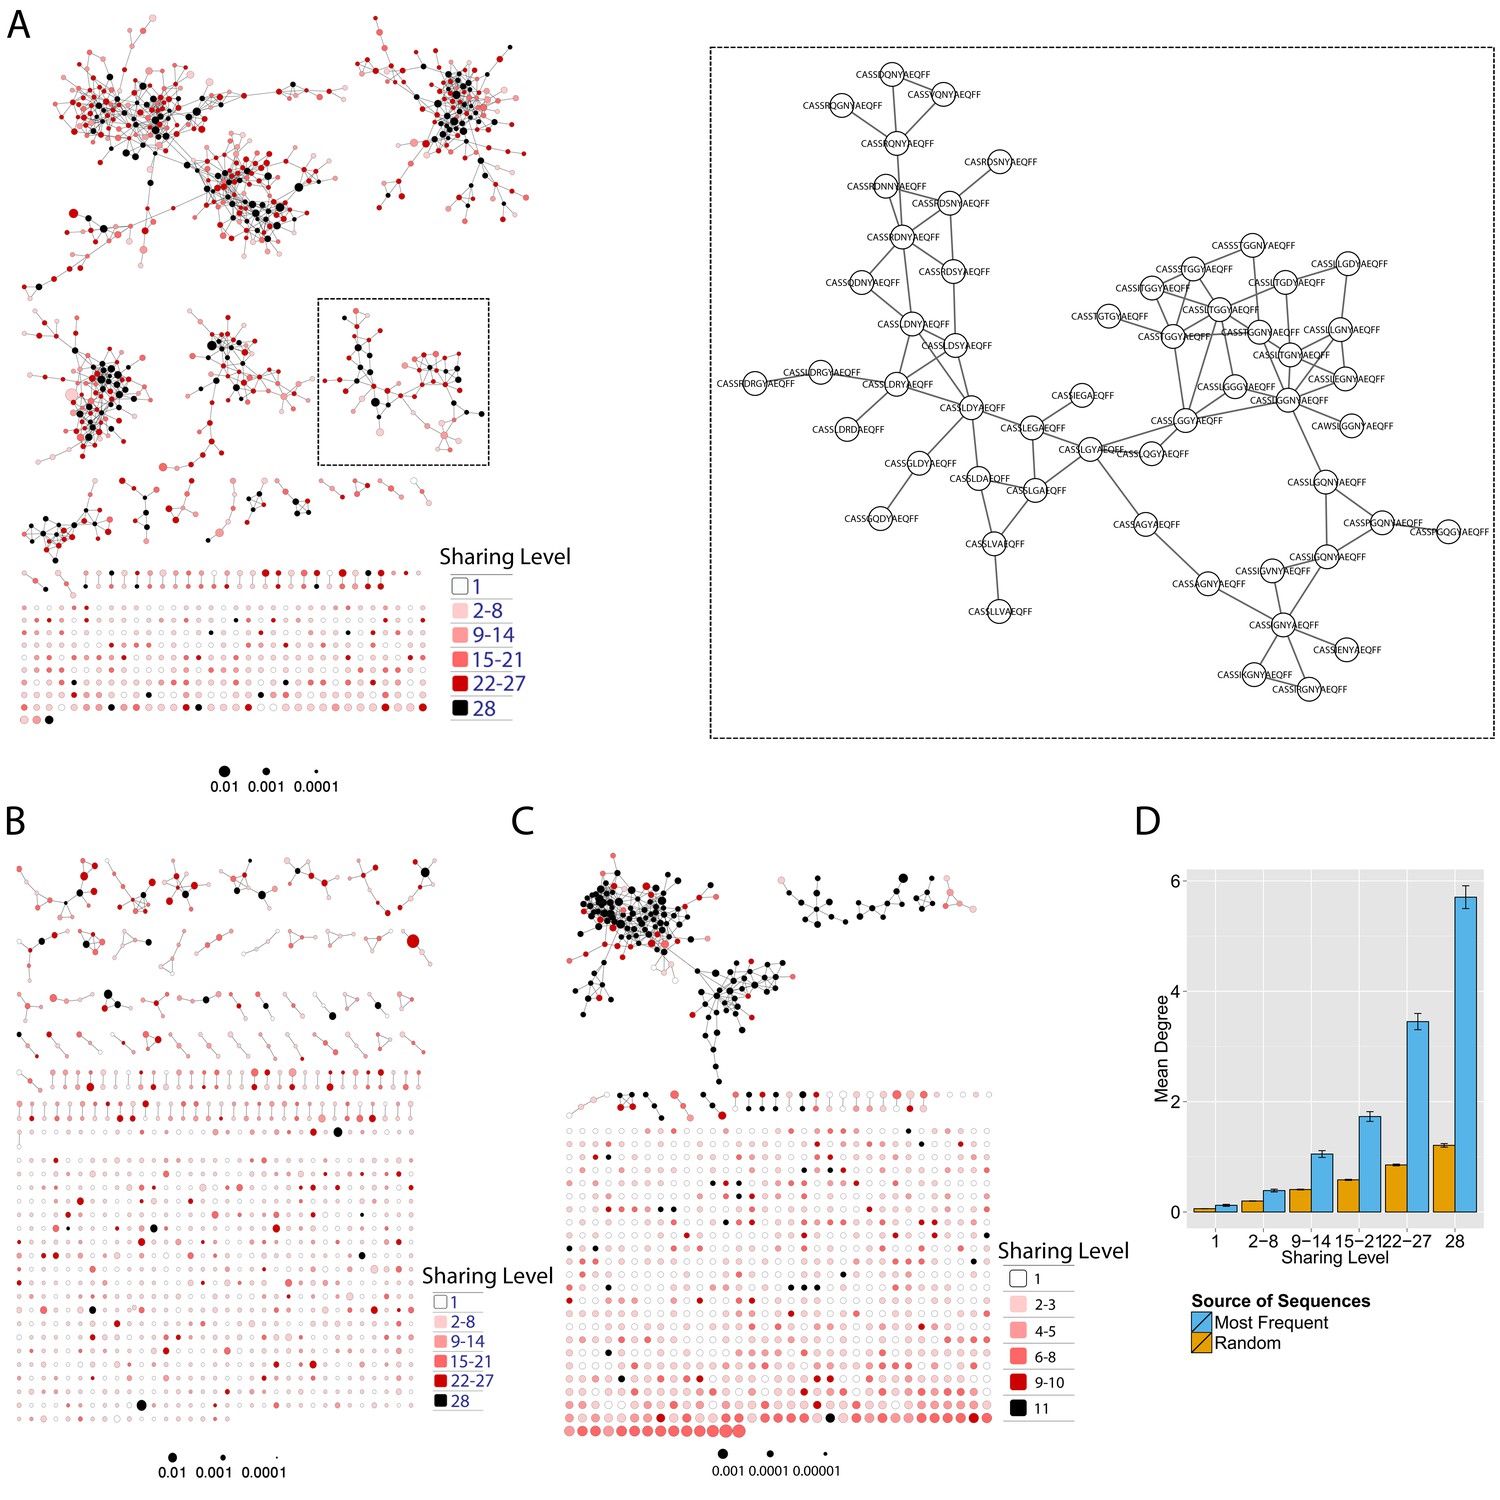
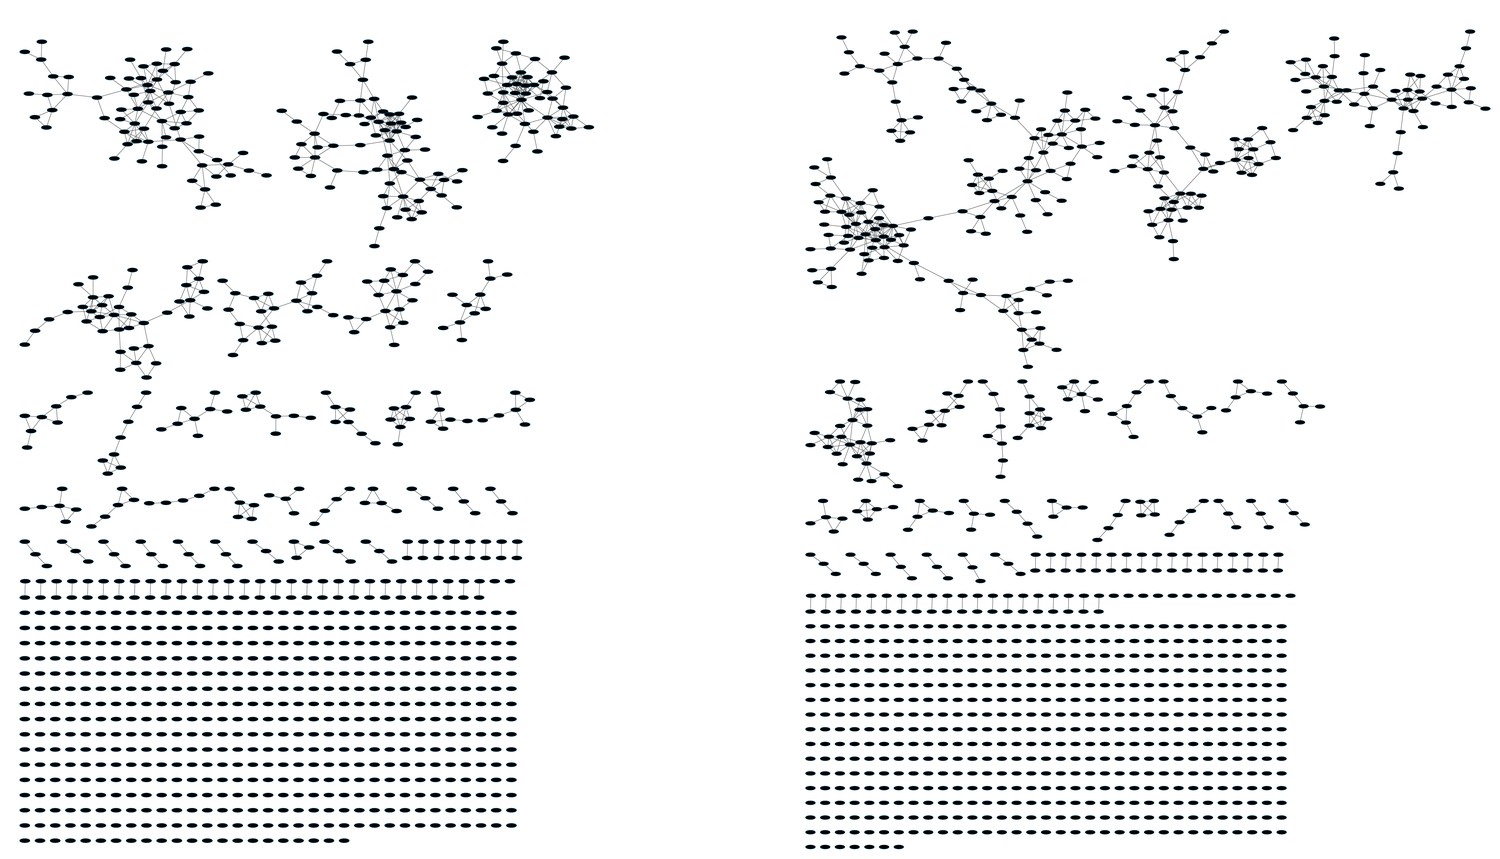
Mouse and human TCR repertoires manifest dense similarity networks surrounding public CDR3β sequences.
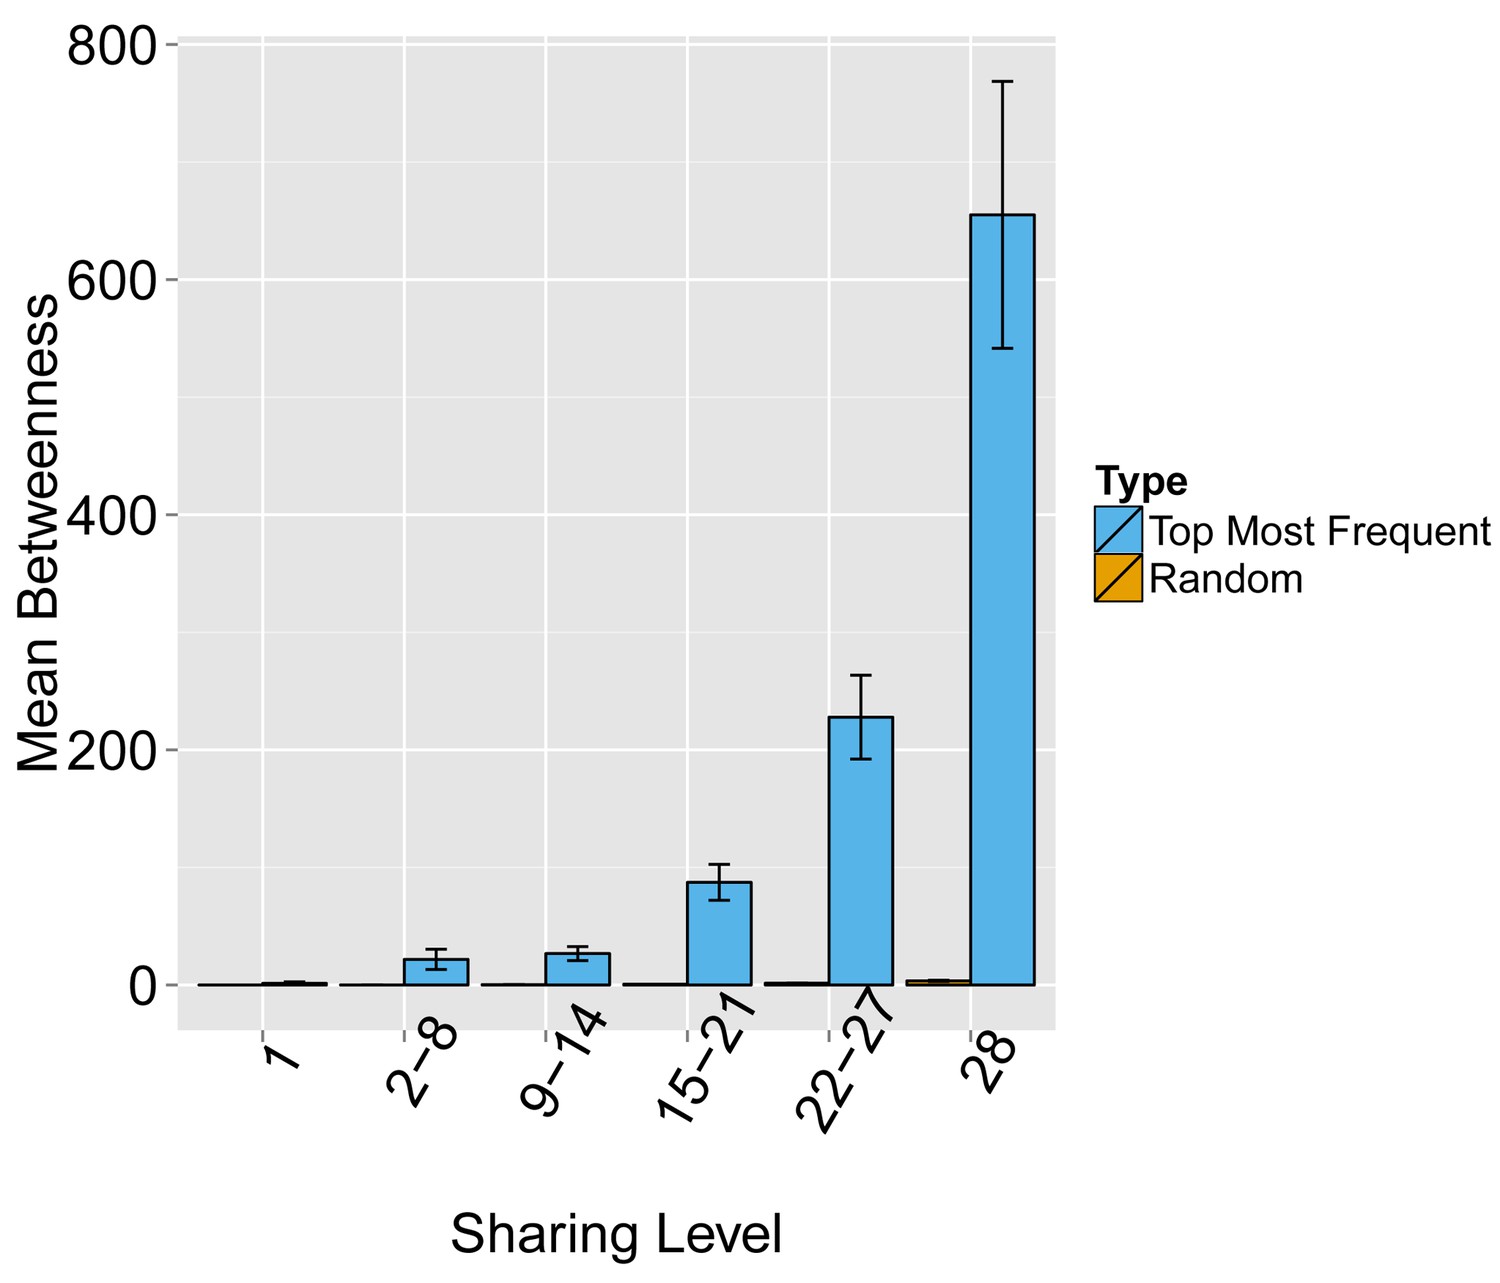
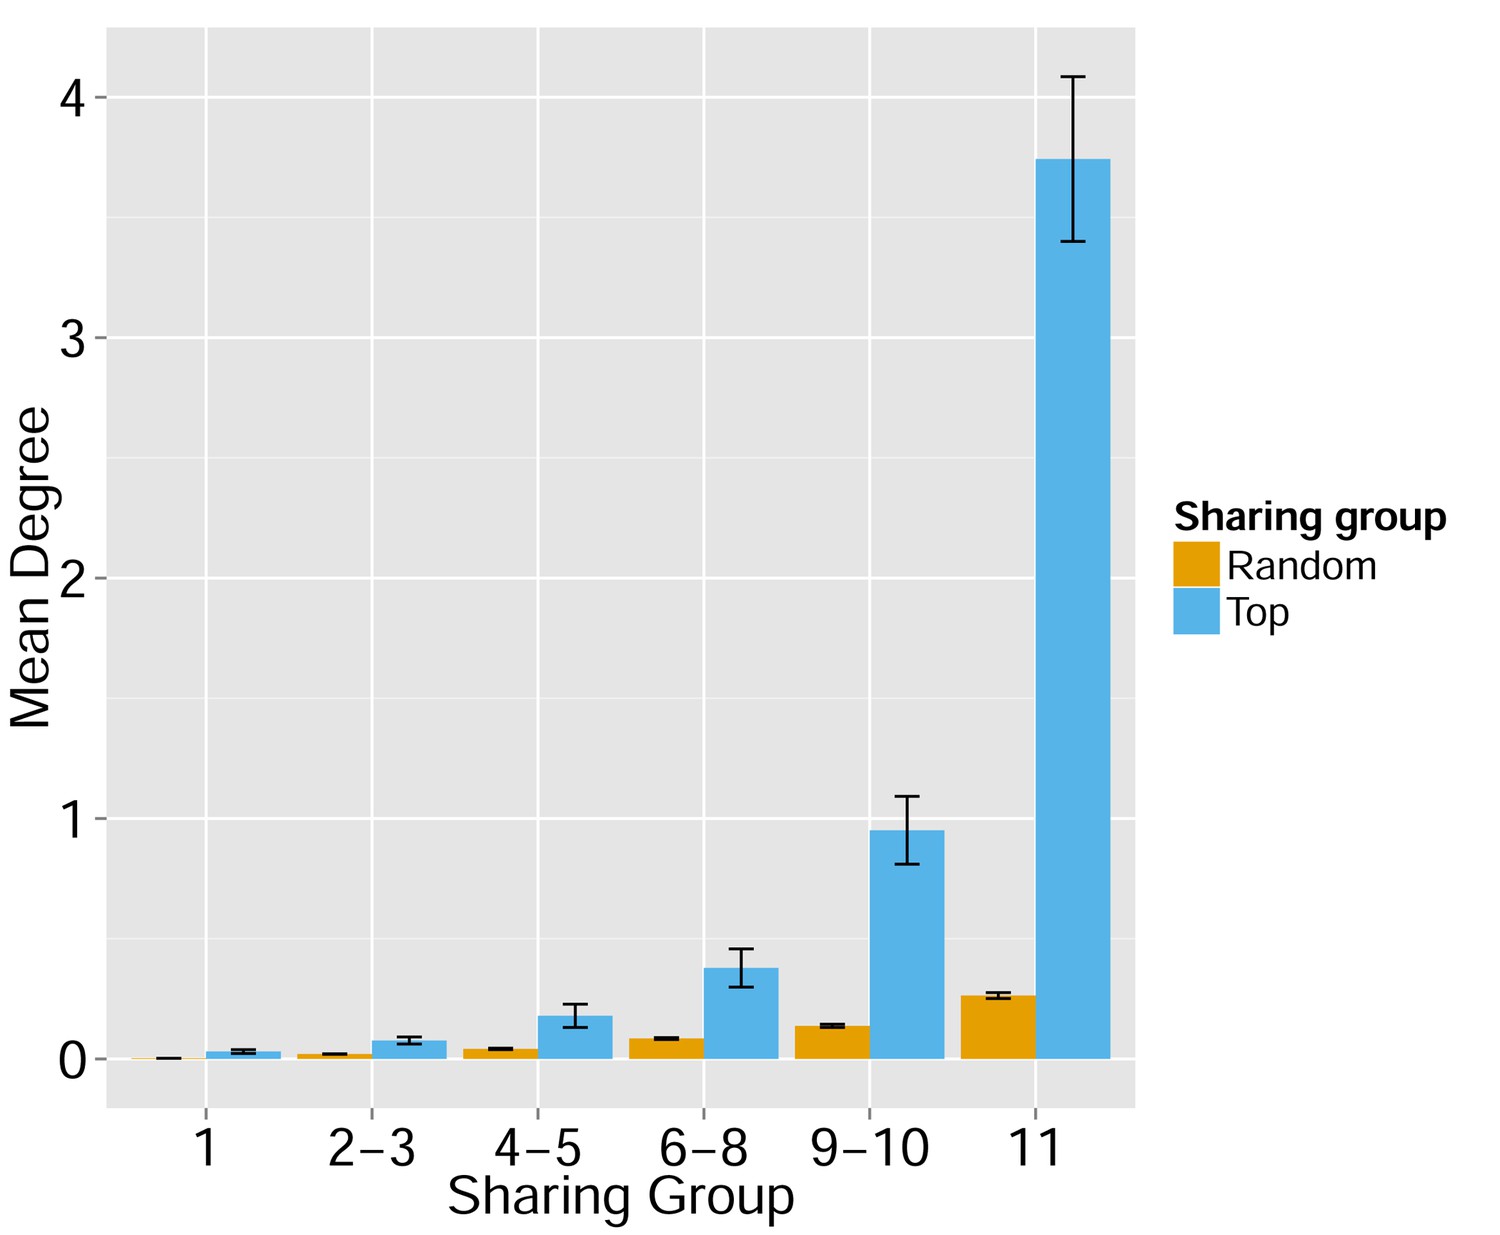
(A) Networks formed by the thousand most frequent CDR3 AA sequences expressed in the TCRβ repertoire of splenic CD4 T cells from a single mouse. Nodes (CDR3 AA sequences) were connected by edges defined by a Levenshtein distance of 1 (one AA substitution/insertion/ deletion). Node size reflects its log frequency (scale at the bottom). The nodes are colored according to their sharing levels in a reference dataset of 28 mice (Madi et al., 2014), from Private CDR3 sequences (white, found in only one mouse in the reference dataset) to public (black, shared by all 28 mice). Inset shows a blowup of the marked cluster with labeled CDR3β AA sequences (nodes) and edges which represent a Levenshtein distance of 1 between connected nodes. (B) Networks formed by a thousand CDR3β sequences randomly chosen from the repertoire of a single mouse. (C) A Network formed by the thousand most frequent CDR3 AA sequences in the TCRβ repertoire of a representative human subject (data from [Britanova et al., 2014]). Nodes are colored by their degree of sharing among the 11 young subjects in that study (ages 6–25 years). (D) Mean degree of node connectivity as a function of sharing level in a network formed by the top 1000 CDR3 sequences (blue) or by 1000 randomly chosen sequences (orange). Error bars indicate standard error (SE) across the 12 mice used in this study.
Figure 1—figure supplement 1
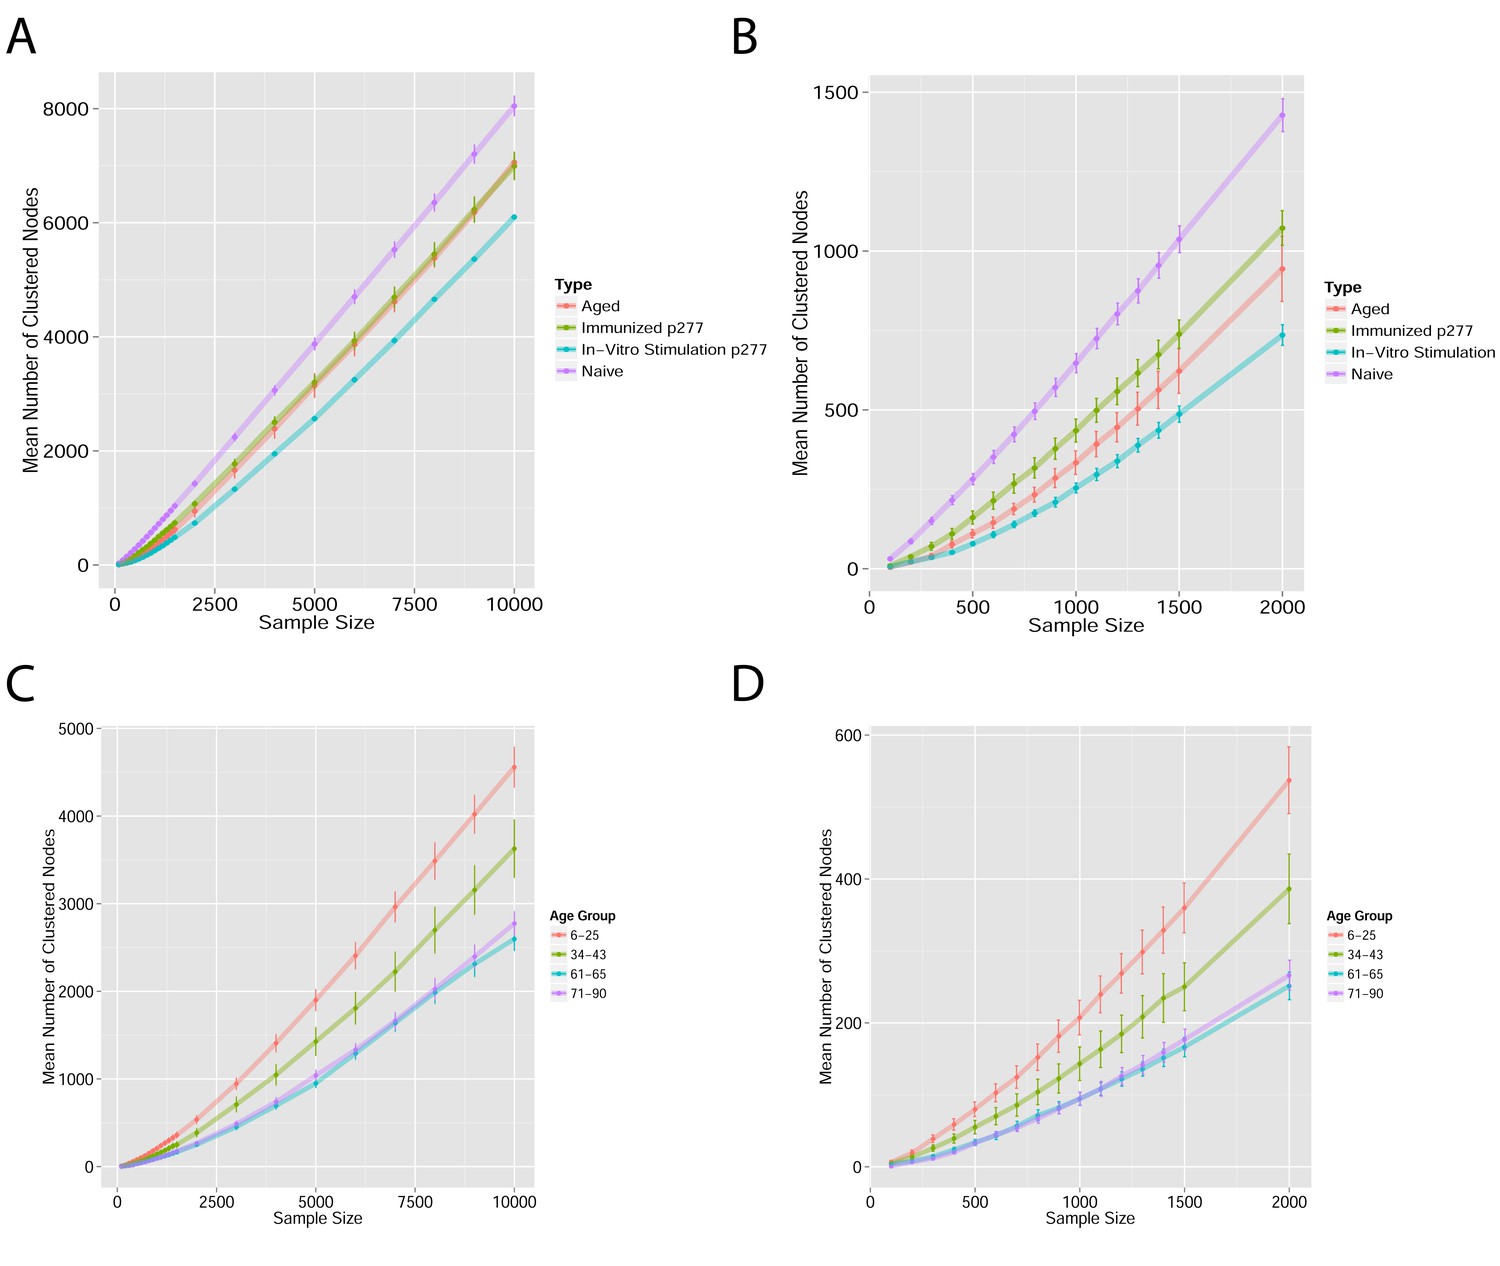
Mean number of clustered nodes as a function of the sample size selected for generating the network.
(Right panel is a zoomed-in version of the left panel). Results are shown for 4 representative conditions, with different levels of observed network connectivity, as expressed by the number of clustered nodes (degree >0). These graphs show that regardless of sample size, (A, B) networks from a naïve mouse are the most connected, followed by those of immunized (p277), aged mice, and lastly p277 in vitro stimulation, which is the least connected. (C, D) networks for 39 human samples (Britanova et al., 2014) divided into 4 age groups. Above ~1000 sequences, the trend is linear; hence the relative fraction of clustered nodes is not sensitive to sample size. Thus, our analysis of network connectivity is not sensitive to the number of sequences used.
Figure 1—figure supplement 2
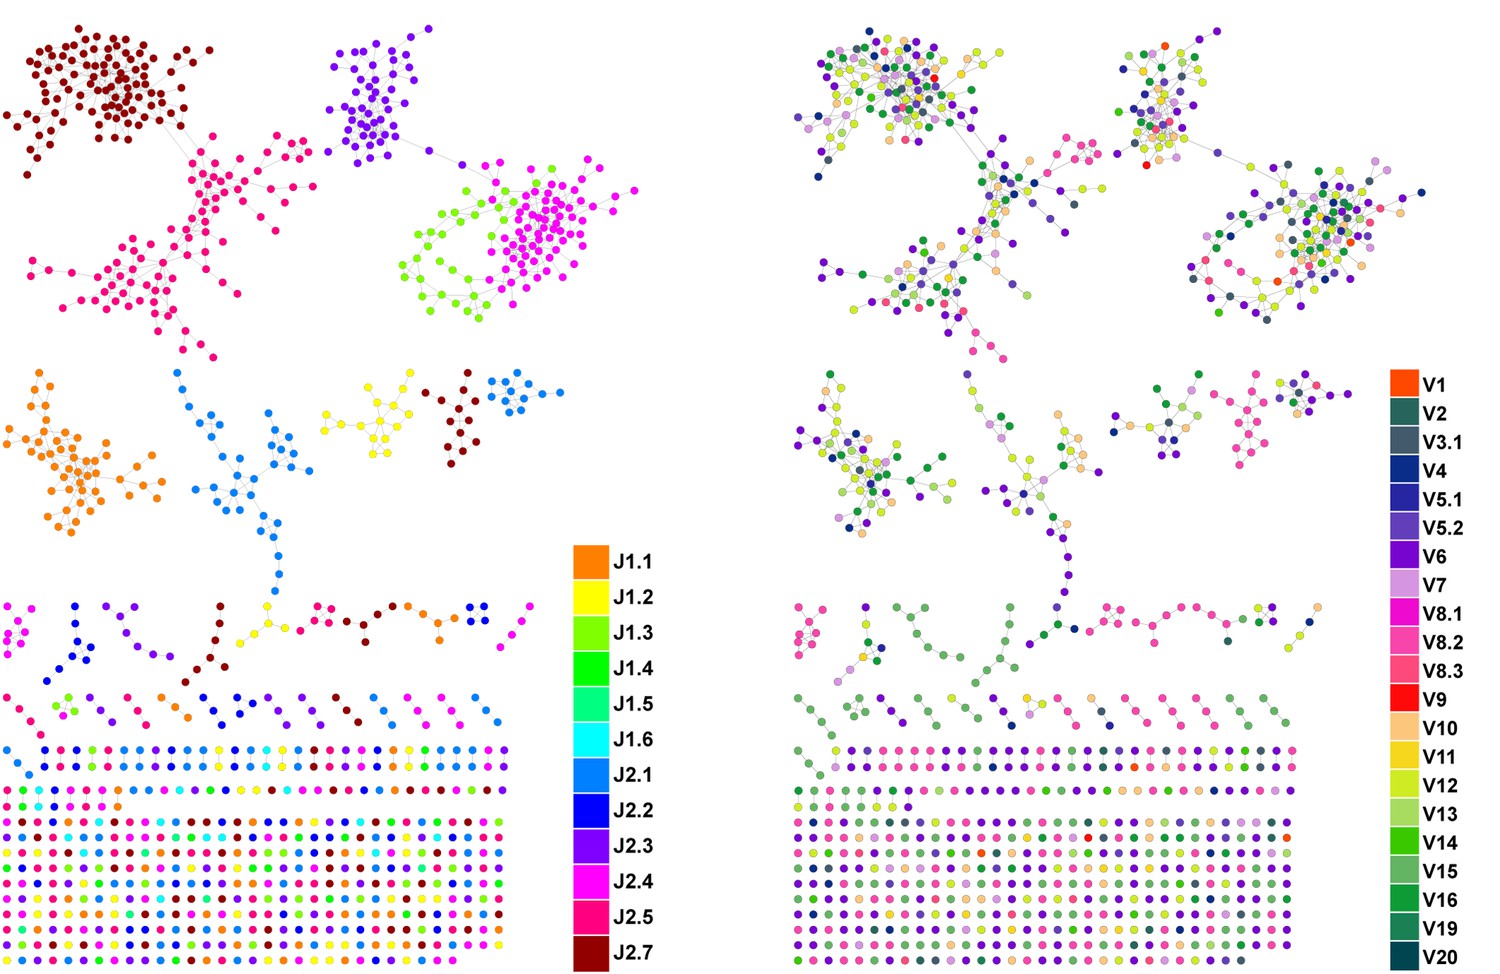
CDR3β sequences form networks with clusters dominated by J-genes and heterogeneous for V-genes.
An example of a network constructed from the 1000 most abundant CDR3β AA sequences from a single mouse. Both panels show the same network. In the left panel, nodes are colored by the dominating J-gene; in the right panel color indicates the dominating V-gene for each AA sequence. Network clusters mostly consist of a single J-gene, with only a few clusters featuring two or three primary J-genes (left). In contrast, V-gene usage in clusters is heterogeneous, with no obvious dominating gene segment (right). This pattern of clusters with homogenous J-gene and heterogeneous V-gene usage was consistent in all top 1000 CDR3β AA sequence networks we examined.
Figure 1—figure supplement 3
CD8+ T cell networks formed by the thousand most frequent CDR3 AA sequences expressed in two mice.
Nodes (CDR3 AA sequences) were connected by edges defined by a Levenshtein distance of 1.
Figure 1—figure supplement 4
Networks from C3H.HeSnJ mouse strain bearing the H2k MHC haplotype.
CD4+ T cell networks formed by the thousand most frequent CDR3 AA segments expressed in two mice. Nodes (CDR3 AA sequences) were connected by edges defined by a Levenshtein distance of 1.
Figure 1—figure supplement 5
Evaluating the level of node centrality vs. sharing level.
The mean betweenness centrality is presented as a function of the sharing level in the dataset of 28 mice, for networks composed of the 1000 most frequent CDR3 AA sequences and for networks composed of 1000 randomly selected CDR3 AA sequences from the dataset. Error bars indicate standard error (SE) across the 12 mice used in this study.
Figure 1—figure supplement 6
Node centrality vs. sharing level in human TCRβ repertoires.
TCRβ repertoires of 11 healthy young human subjects previously investigated by Britanova et al. (2014). Shown is the mean degree of nodes as a function of their sharing level in the dataset, for networks composed of the 1000 most frequent CDR3 aa sequences and for networks composed of 1000 randomly selected sequences. Note that public human TCRs manifest a higher degree of connectivity than do private TCRs.
Figure 2 with 4 supplements
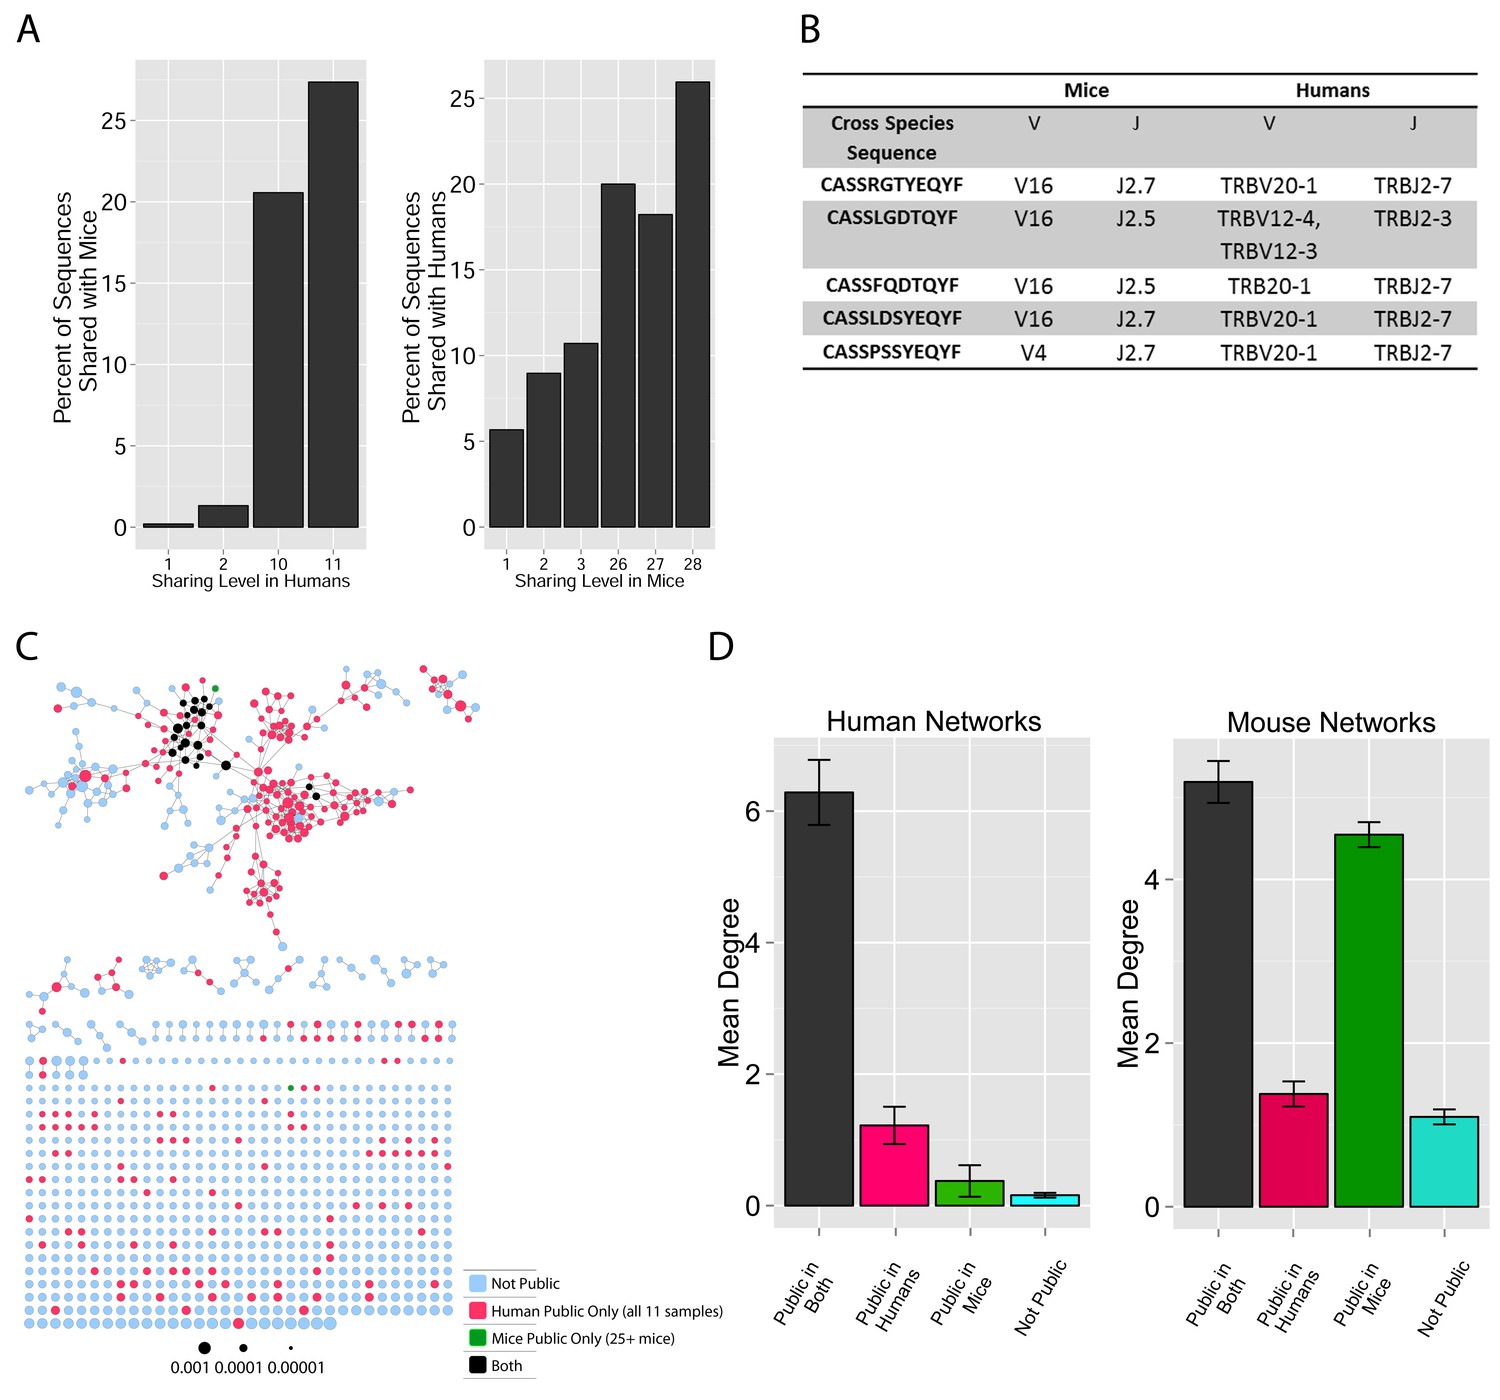
TCR repertoires are focused around public and cross species- (CS-) public CDR3 AA sequences shared by mice and humans.
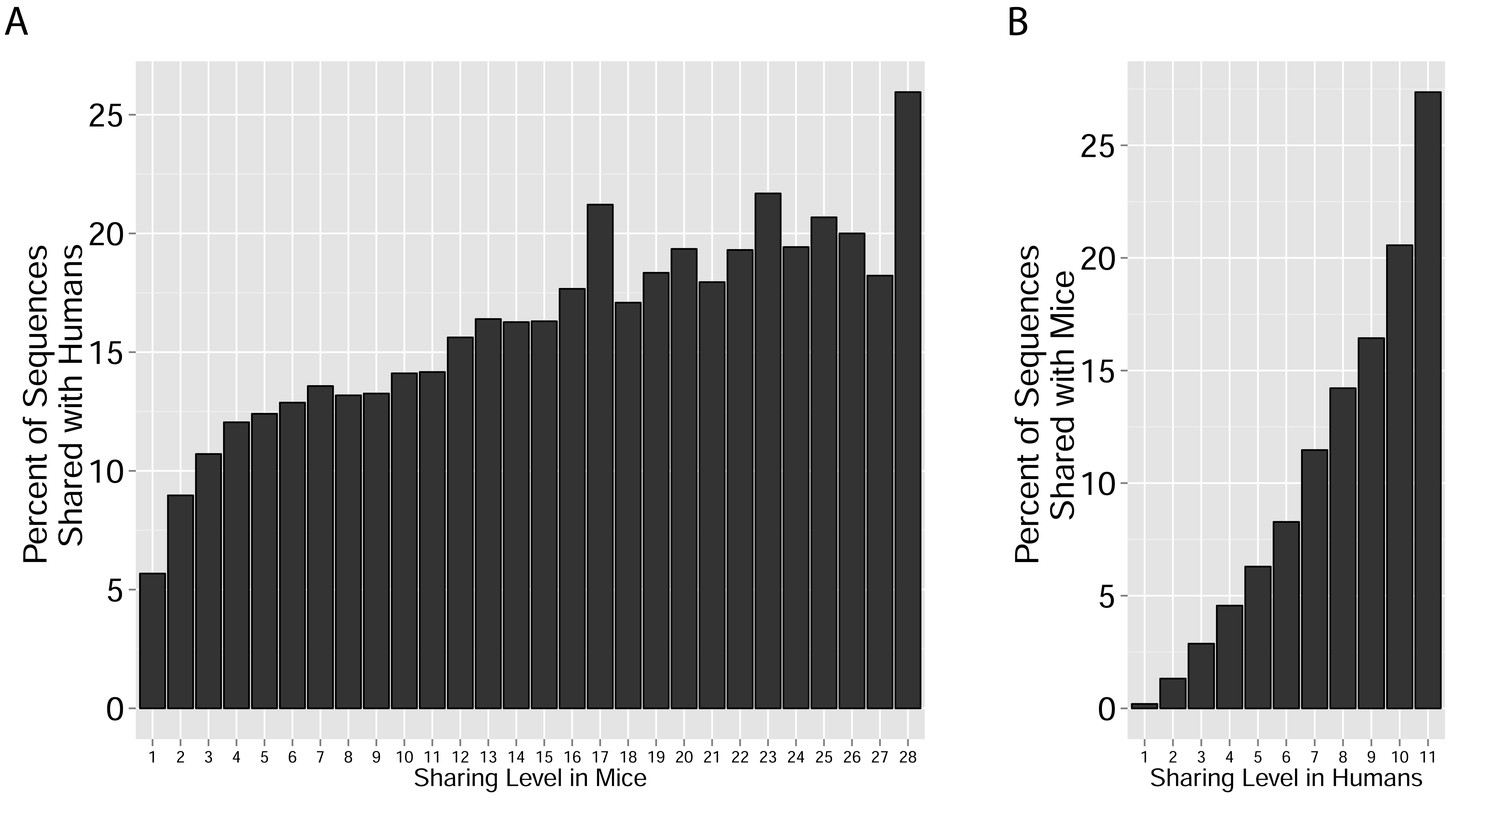
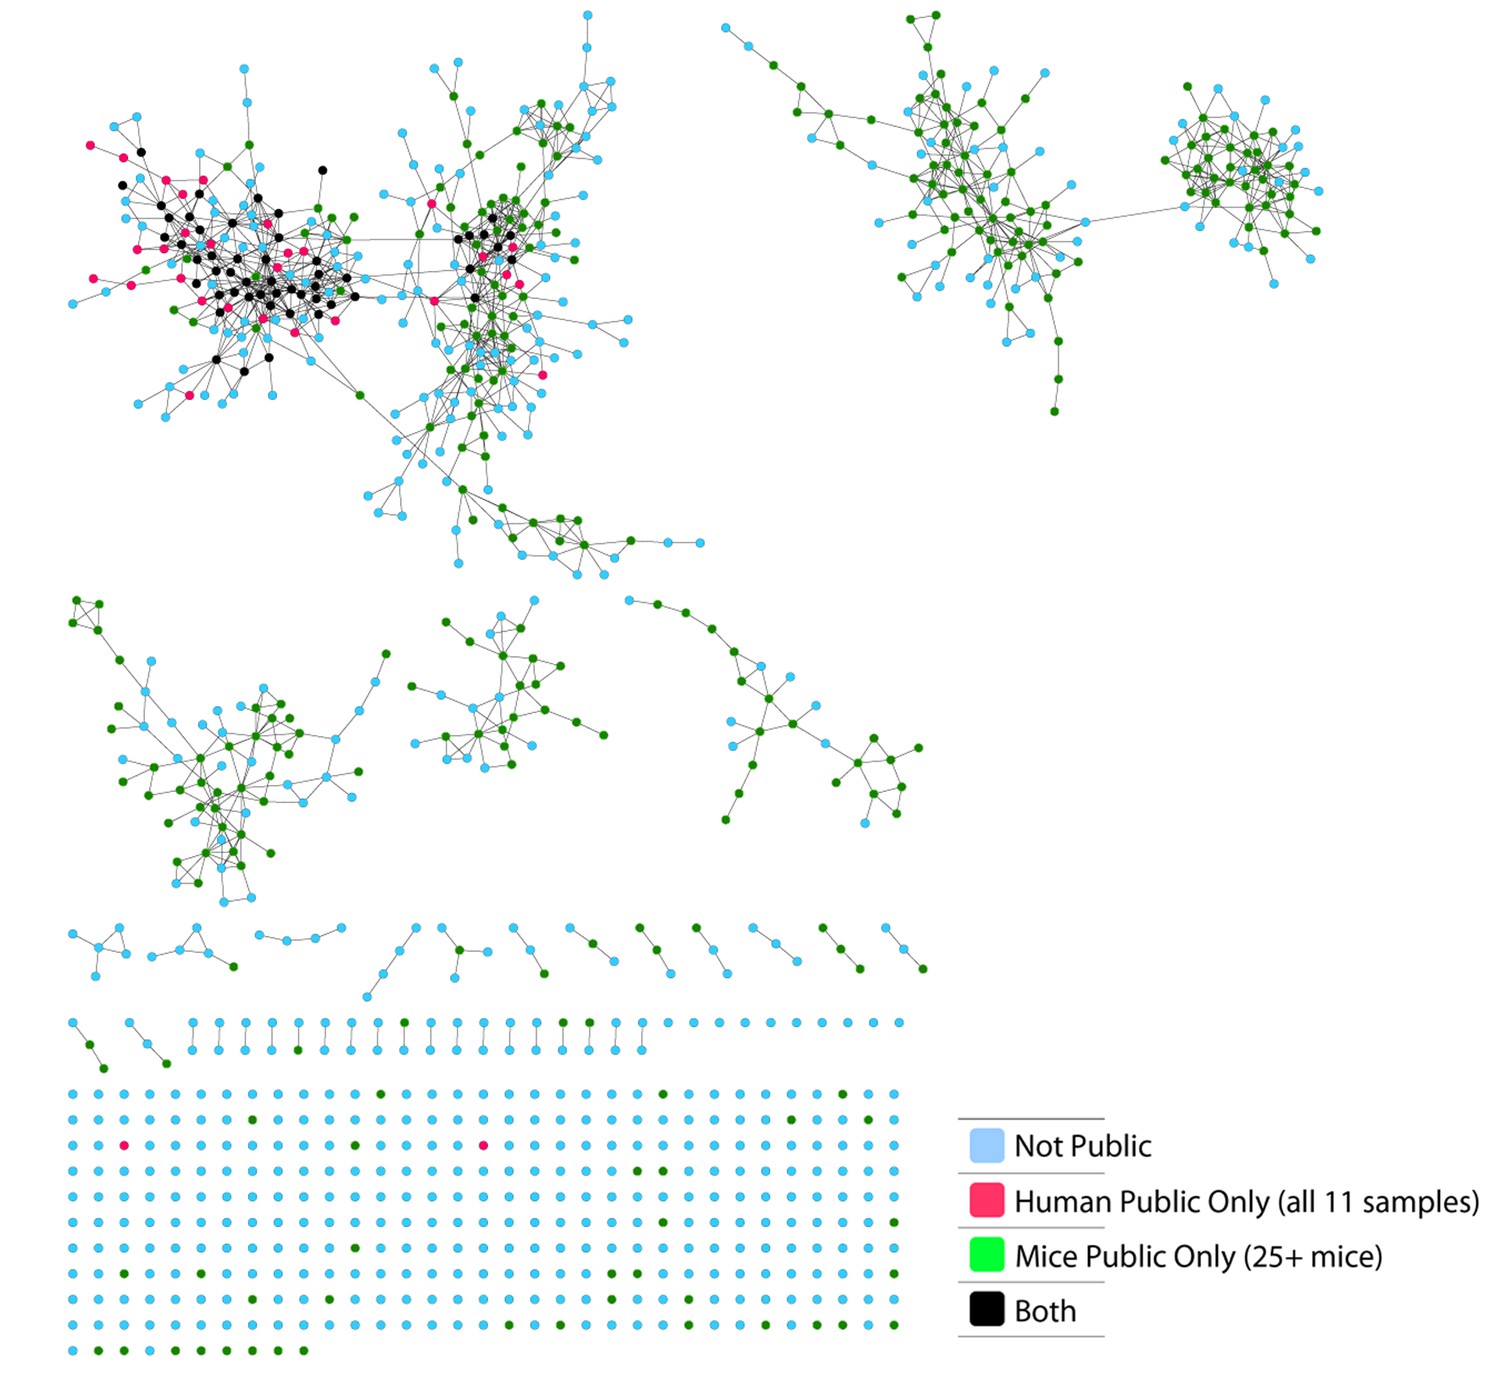
(A) Human (left) or mouse (right) CDR3 sequences are grouped according to their sharing level in the corresponding dataset. For each sharing group, we plotted the percentage of sequences that were shared by at least one subject of the other species. (B) Examples of CS-Public CDR3 sequences, and their V and J segments in mouse and human repertoires. (C) A network formed by the top 1000 CDR3 sequences of a single human subject. Node color represents its sharing within or between species: Pink - shared by all 11 human subjects; Green - shared by at least 25 of the 28 mice; Black – CS-public nodes shared by all 11 humans and at least 25 mice; Blue - not shared. (D) The mean number of edges per node (degree) in the 11 human and 28 mouse networks, subdivided into the four categories as in C. Error bars mark SE.
Figure 2—figure supplement 1
Cross-species TCR sharing.
(A) All CDR3β sequences in the 28 mouse dataset were categorized according to their sharing level, from private (found in only one mouse), to public (found in all 28 mice). The graph presents the percent of sequences within each category that were also found in the human dataset (in at least 1 of 11 young subjects). (B) All CDR3β sequences in the 11 young human subjects were categorized according to their sharing level, from private (found in only one subject), to public (found in all subjects). The graph presents the percent of sequences within each group that were also found in at least one of the 28 mice. In both cases, the fraction of cross-species sequences increases with the sharing level; sequences that are more public in one species are more frequently found in the other species.
Figure 2—figure supplement 2
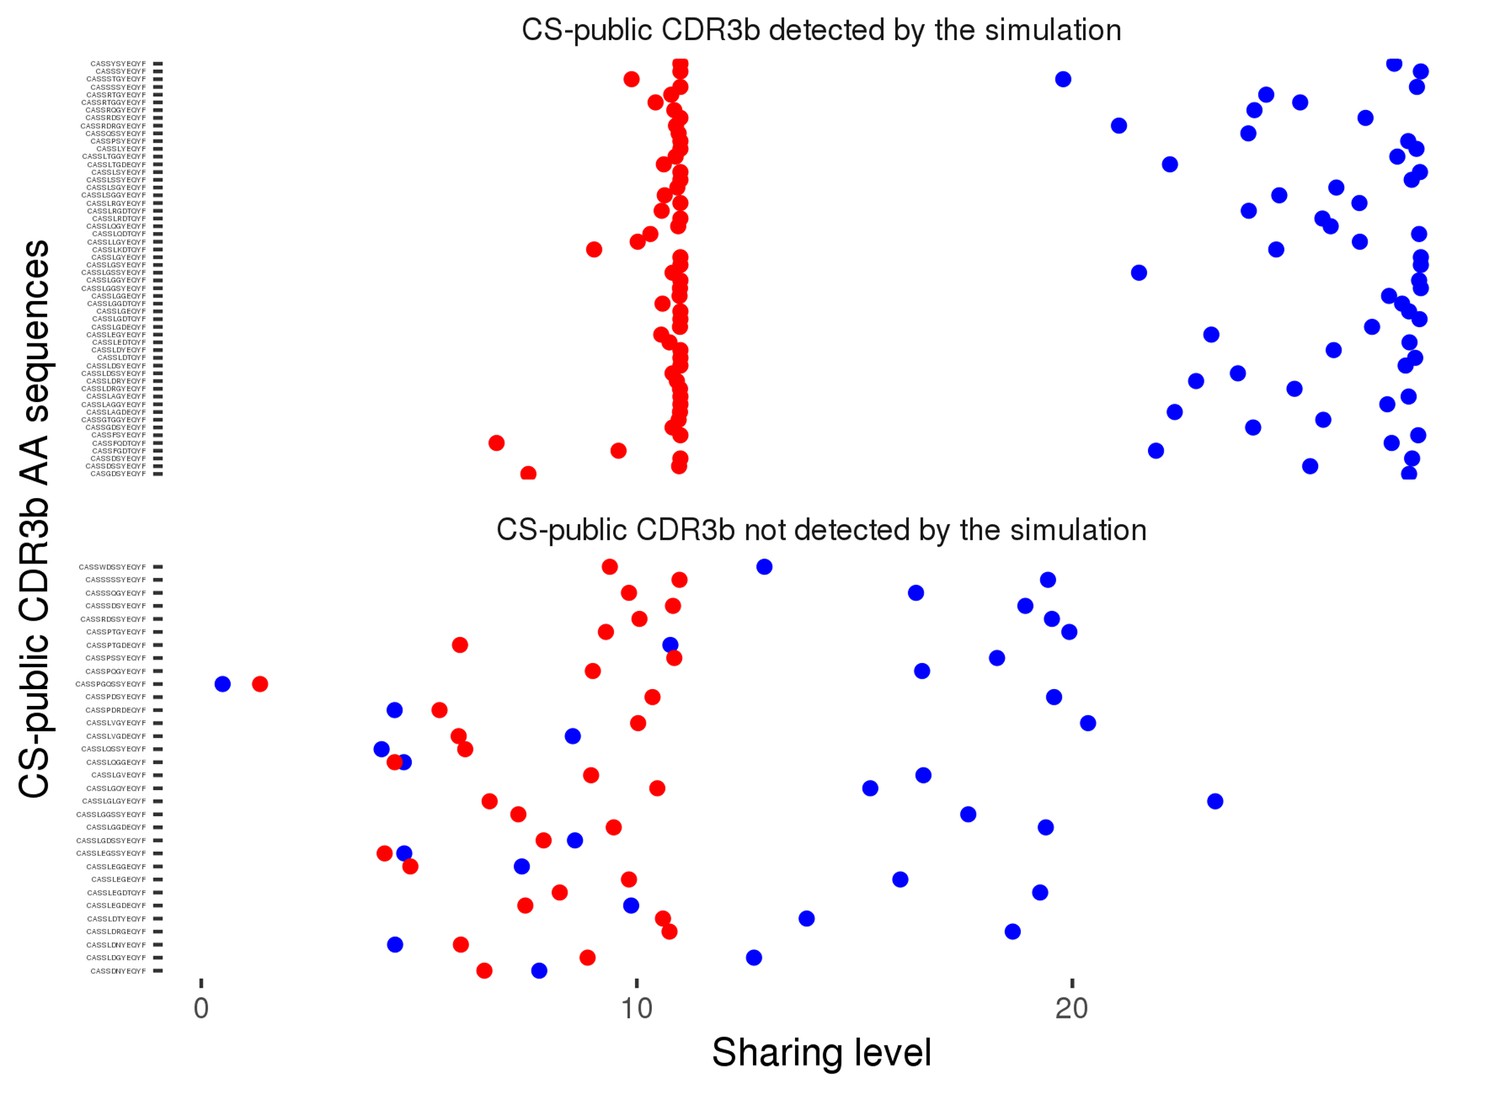
Sharing properties of the 86 observed CS-public CDR3 sequences in simulated data.
We generated 100 datasets of simulated human and mouse repertoires, with number of individuals (11 humans, 28 mice) and repertoire sizes as in the experimental data. For each of the 86 observed CS-public sequences, we plot its mean sharing level in the simulations, for human repertoires (red) and mouse (blue) repertoires . The top panel shows 54 sequences that are CS-public in both experiment and simulations. The lower panel shows 32 sequences that are CS-public in the experimental data but not in the simulations. Note that there were additionally about 200 CS-public sequences in the simulations which were not CS-public in the data.
Figure 2—figure supplement 3
CS-Public CDR3 sequences are central in mouse TCRβ networks.
Shown is a representative network of the 1000 most frequent sequences from a mouse. Nodes are labeled according to 4 categories: CDR3 sequences that are not public; CDR3 sequences shared by all 11 human samples; CDR3 sequences shared by at least 25 mice; CDR3 sequences shared by at least 25 mice and all 11 humans.
Figure 2—figure supplement 4
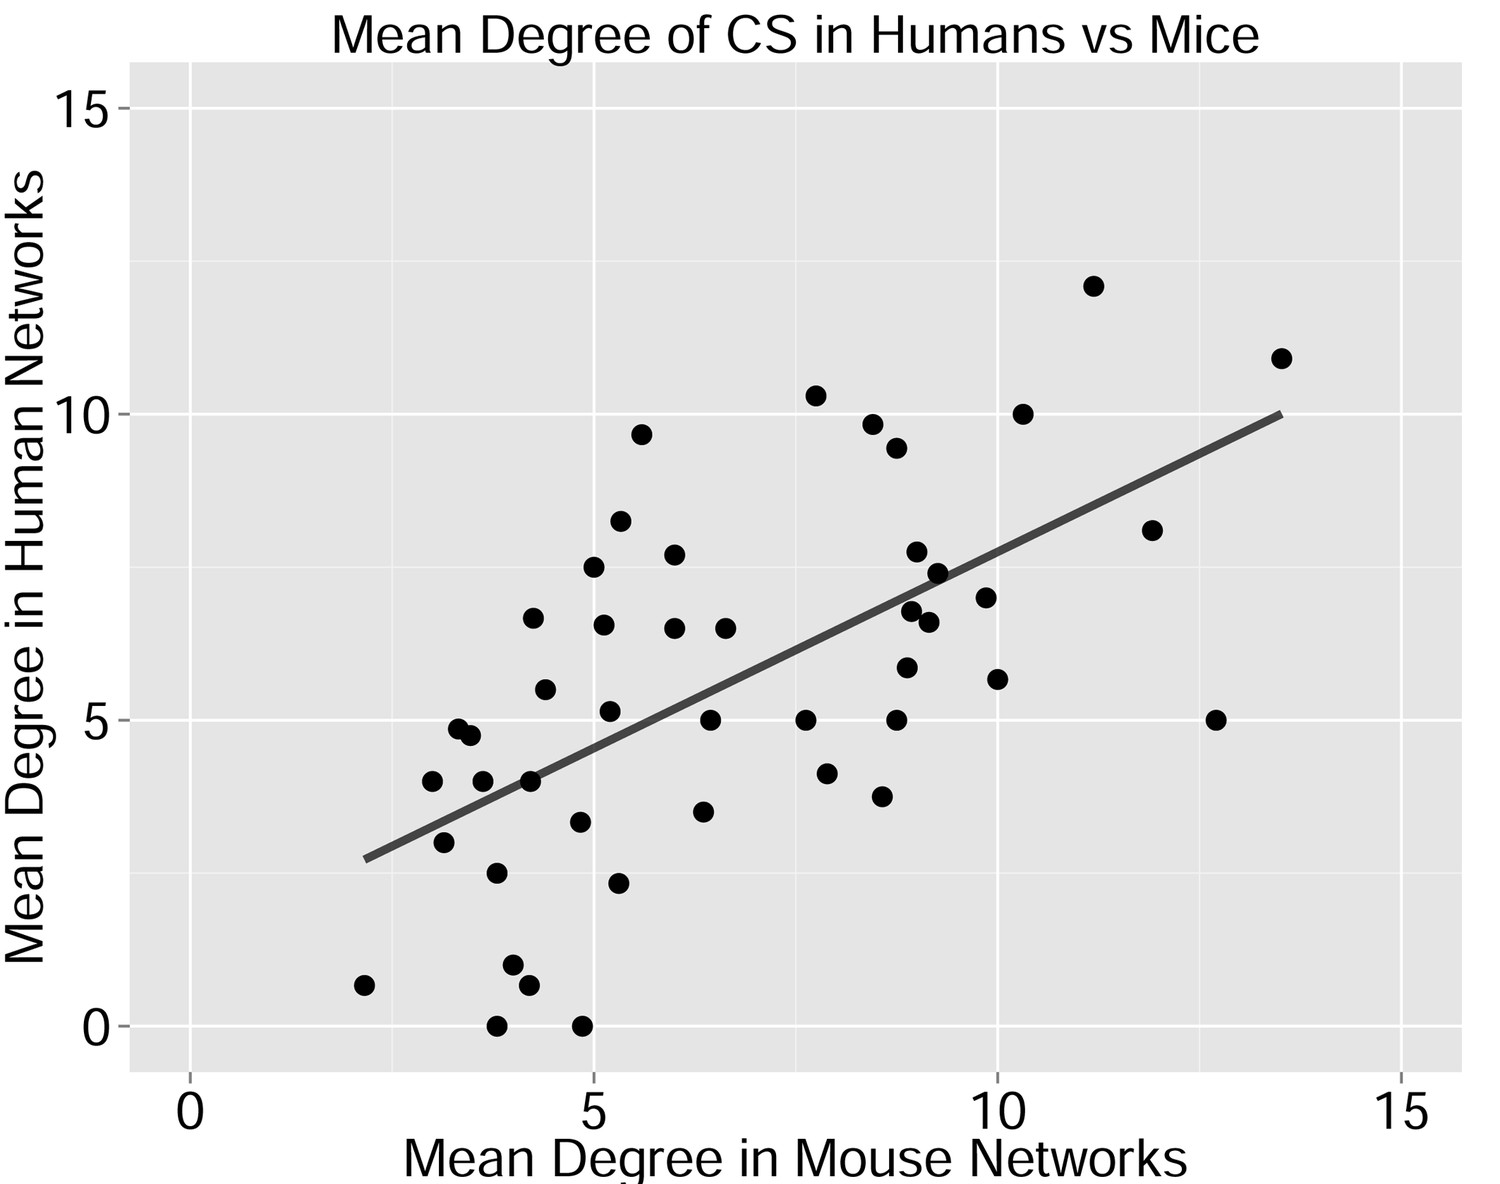
Degree of CS-public sequences is correlated in mouse and human TCR networks.
Each dot represents one CS-public sequence that is found among the most abundant 1000 sequences in at least one mouse and at least one human subject (n = 45 sequences). There is a significant correlation between the degree of CS-public sequences in the two species (R = 0.65, spearman); Sequences that are more connected in one species are typically more connected in the other as well.
Figure 3 with 1 supplement
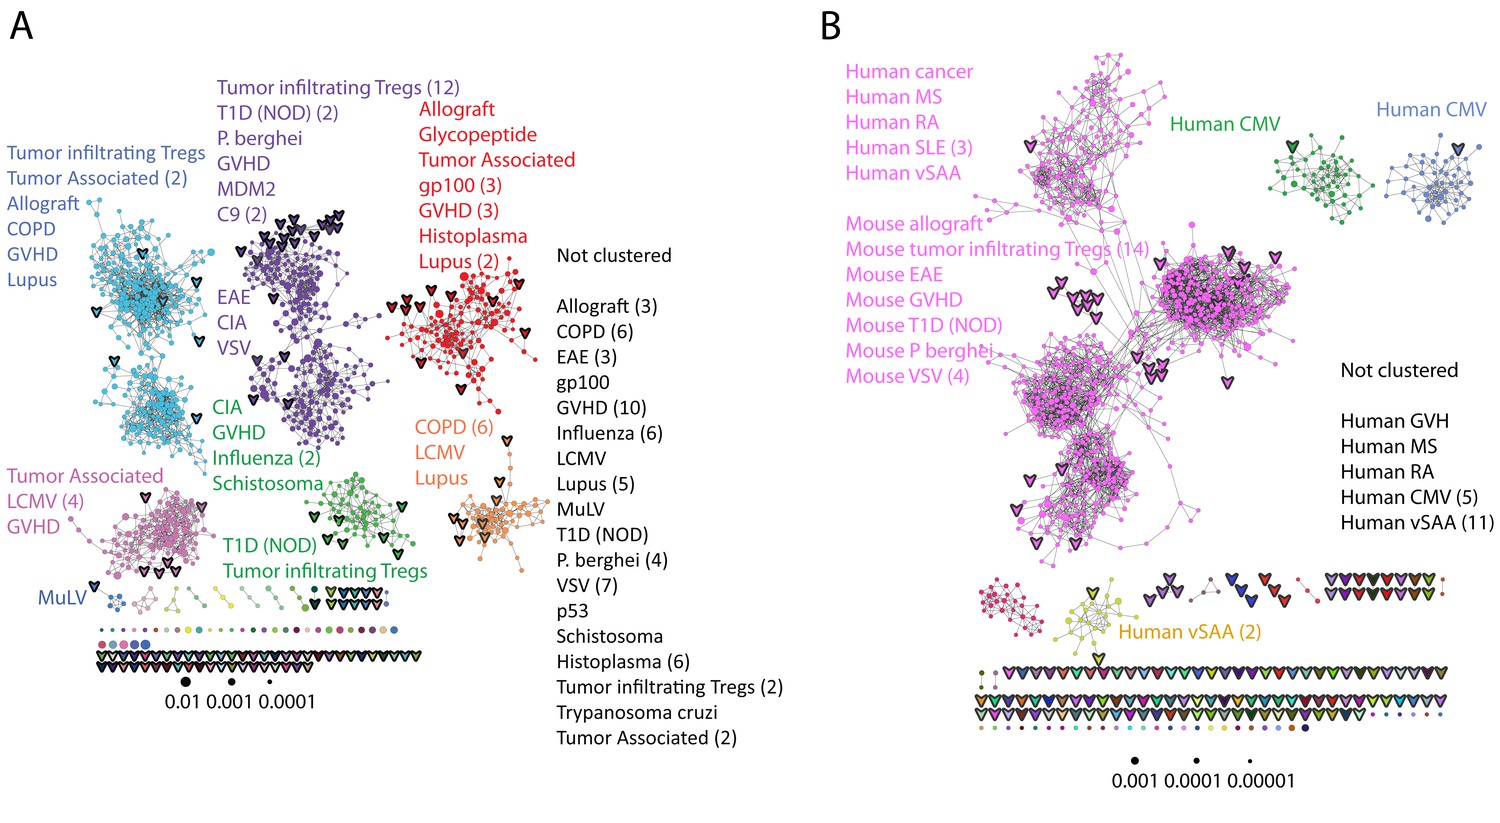
Public CDR3 sequences form highly connected similarity networks in mice and humans and are enriched for self-associated immune reactivities.
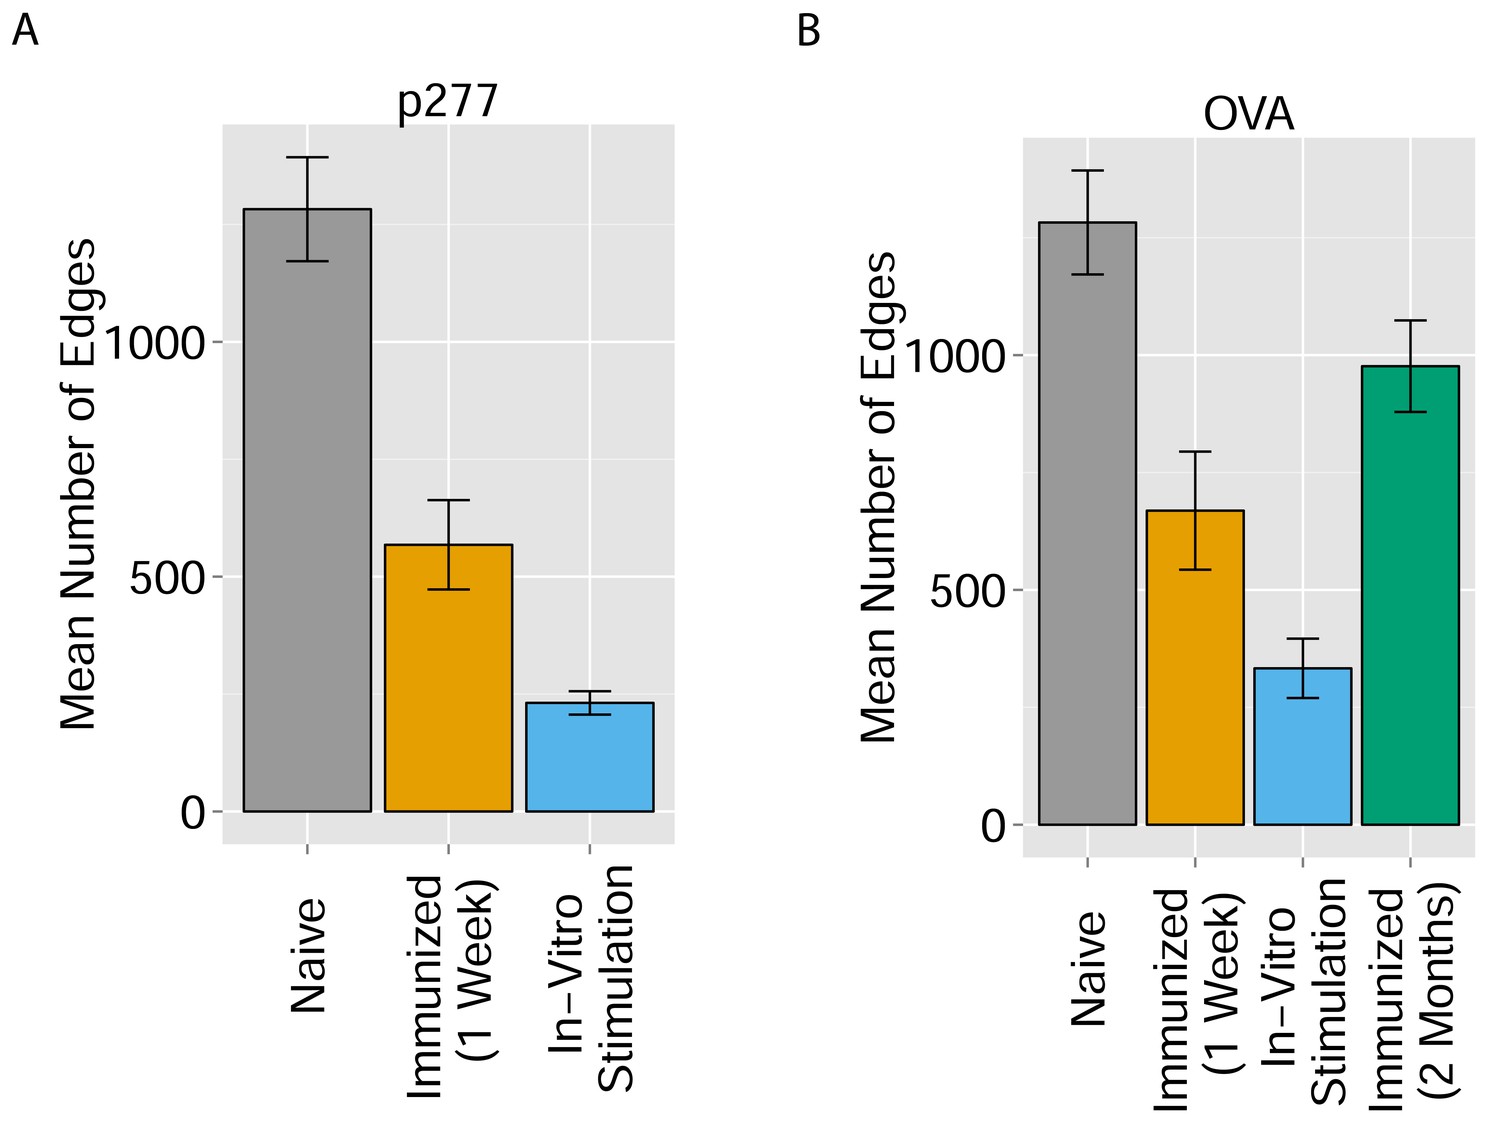
(A) A network formed by the 1000 most shared mouse CDR3 sequences (found in >25 of 28 mice). Node size corresponds to the mean abundance of the sequence. Nodes are colored according to their cluster association. 124 CDR3 sequences that were previously annotated (see [Madi et al., 2014]) were added to the network and are presented as arrowheads. 63 annotated sequences were either identical to, or at a Levenshtein distance of 1 from one of the nodes, and are listed next to each cluster (with the corresponding color). Annotations of 61 un-clustered sequences are also listed. (B) A network formed by the 1000 most frequent public CDR3 sequences in humans (found in all 11 subjects). Previously annotated mouse (n = 124) and human (n = 30) CDR3 sequences were added to the network as in A (arrowheads). The clusters were distinctly colored in order to visually match between clusters and their annotated sequences, not to define antigen specificity of a cluster. A list of linked annotated CDR3 sequences is shown next to each cluster (11 of 30 human and 23 of 124 mouse annotated CDR3 sequences), together with a list of unclustered annotated human sequences.
Figure 3—figure supplement 1
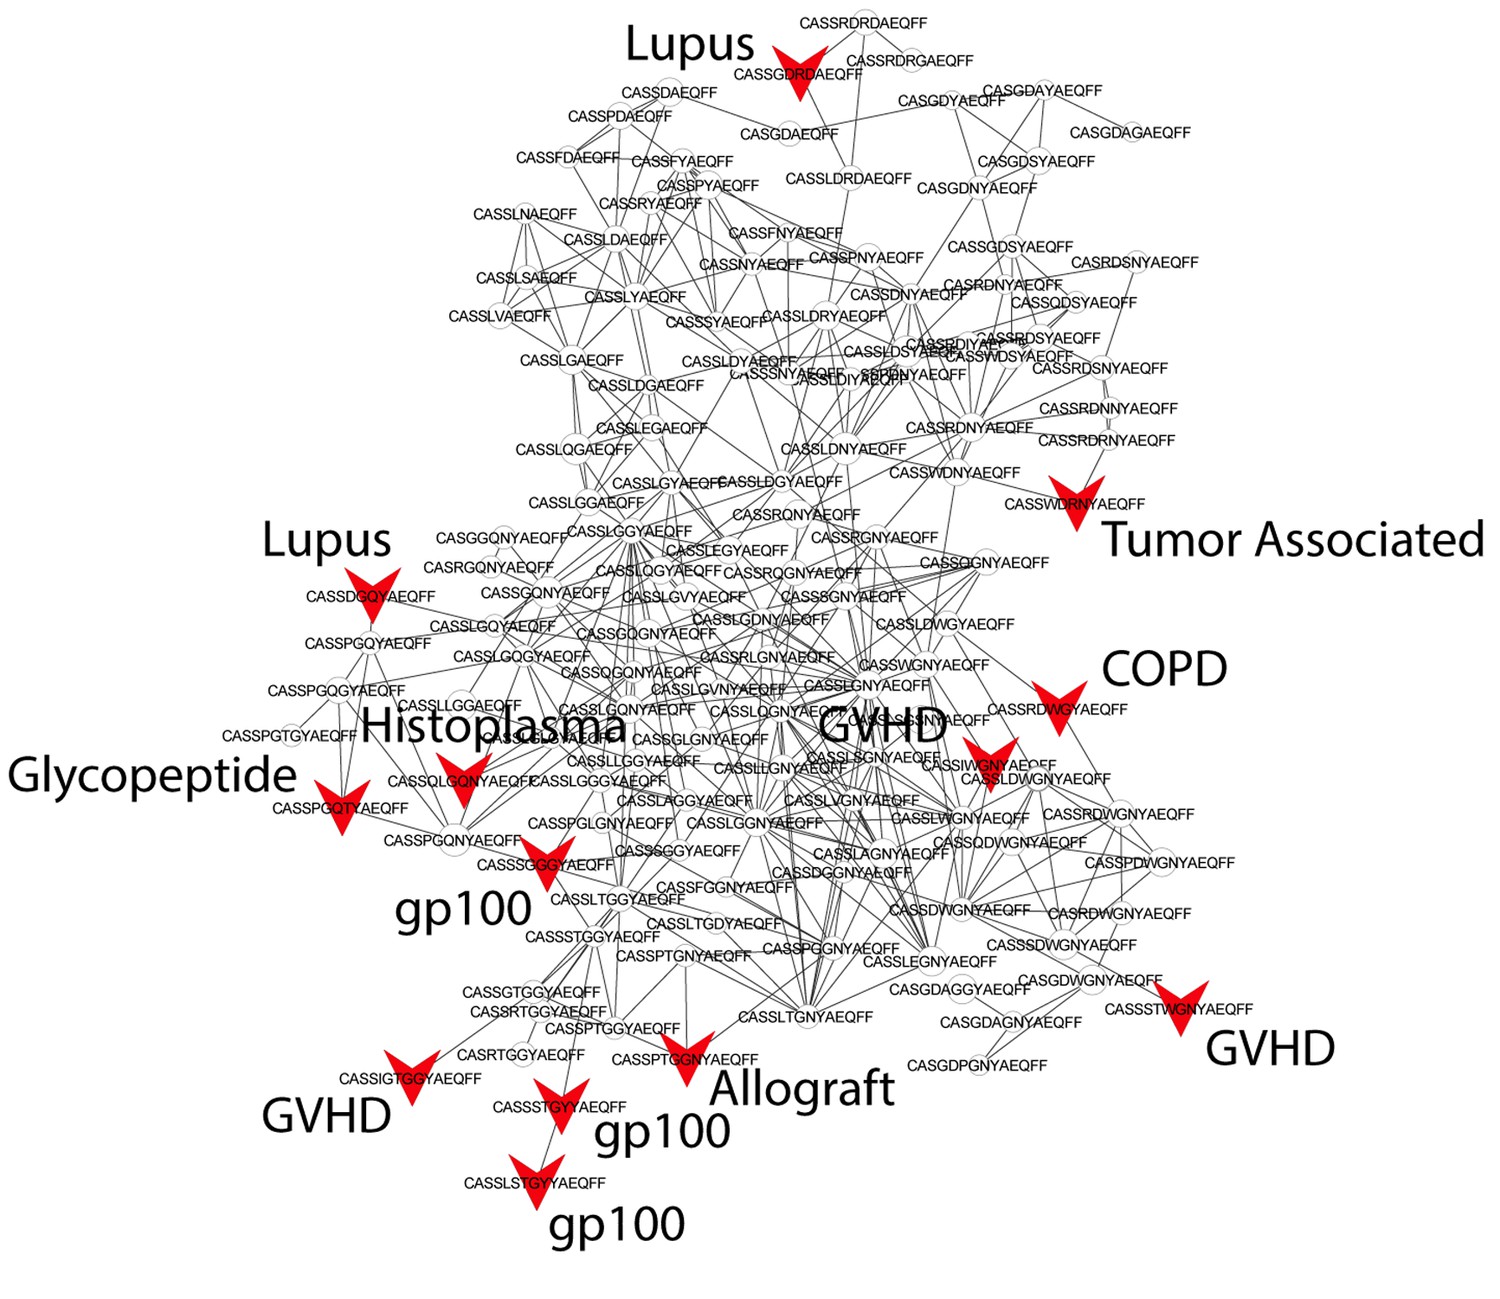
Public CDR3 sequences form highly connected similarity networks in mice and are enriched for self-associated immune reactivities.
Sequence visualization of the red (top right) cluster in the mouse CDR3 sequences network shown in Figure 3A. The original full network is formed by the 1000 most shared mouse CDR3 sequences (found in >25 of 28 mice). 124 CDR3 sequences that were previously annotated (see [Madi et al., 2014]) were added to the network and are presented as red arrowheads. 13 annotated sequences were either identical to, or at a Levenshtein distance of 1 from one of the nodes in this cluster, and their associated pathology/antigen is listed next to the corresponding node.
Figure 4 with 1 supplement
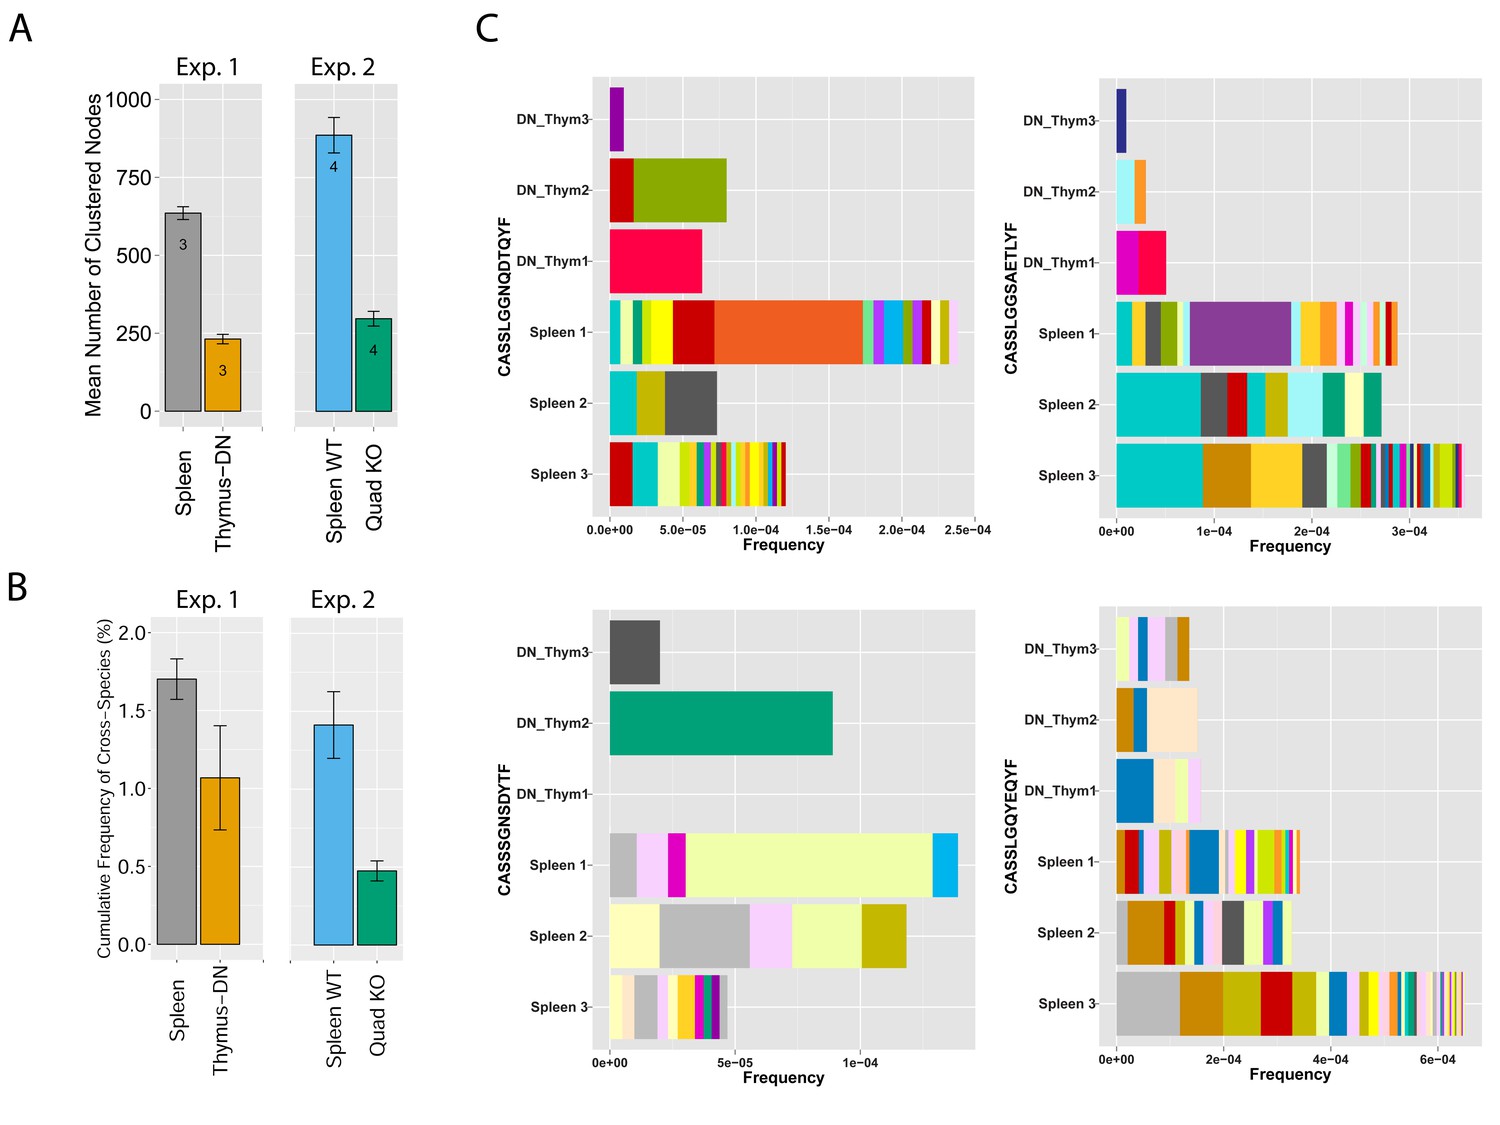
MHC-dependent public CDR3 sequences form highly connected similarity networks.
(A) Mean number of clustered nodes in networks formed by the top 1000 CDR3 sequences from the following repertoires: DN thymocytes (CD4−CD8−) (n = 3), CD4+ spleen T cells (n = 3), Quad-KO mice(Van Laethem et al., 2007) (lack MHC-I, MHC–II, CD4 and CD8) (n = 4), and their WT controls (C57BL/6) (n = 4). Error bars signify standard error. (B) Cumulative frequency of the 86 CS-public CDR3 sequences (observed in the reference datasets of 28 WT mice and 11 healthy humans) is shown for: DN thymocytes (CD4-CD8-) (n = 3), CD4+ spleen T cells (n = 3) (left), Quad-KO mice (n = 4), and their WT controls (C57BL/6) (n = 4). Error bars signify standard error. (C) Cumulative frequency of nucleotide sequences coding for two annotated (C9 and COPD, top) and two unknown (bottom) public AA CDR3 sequences from repertoires of DN thymocytes and CD4+ spleen T cells (sequences from 3 mice are shown). Each color represents a different nucleotide sequence.
Figure 4—figure supplement 1
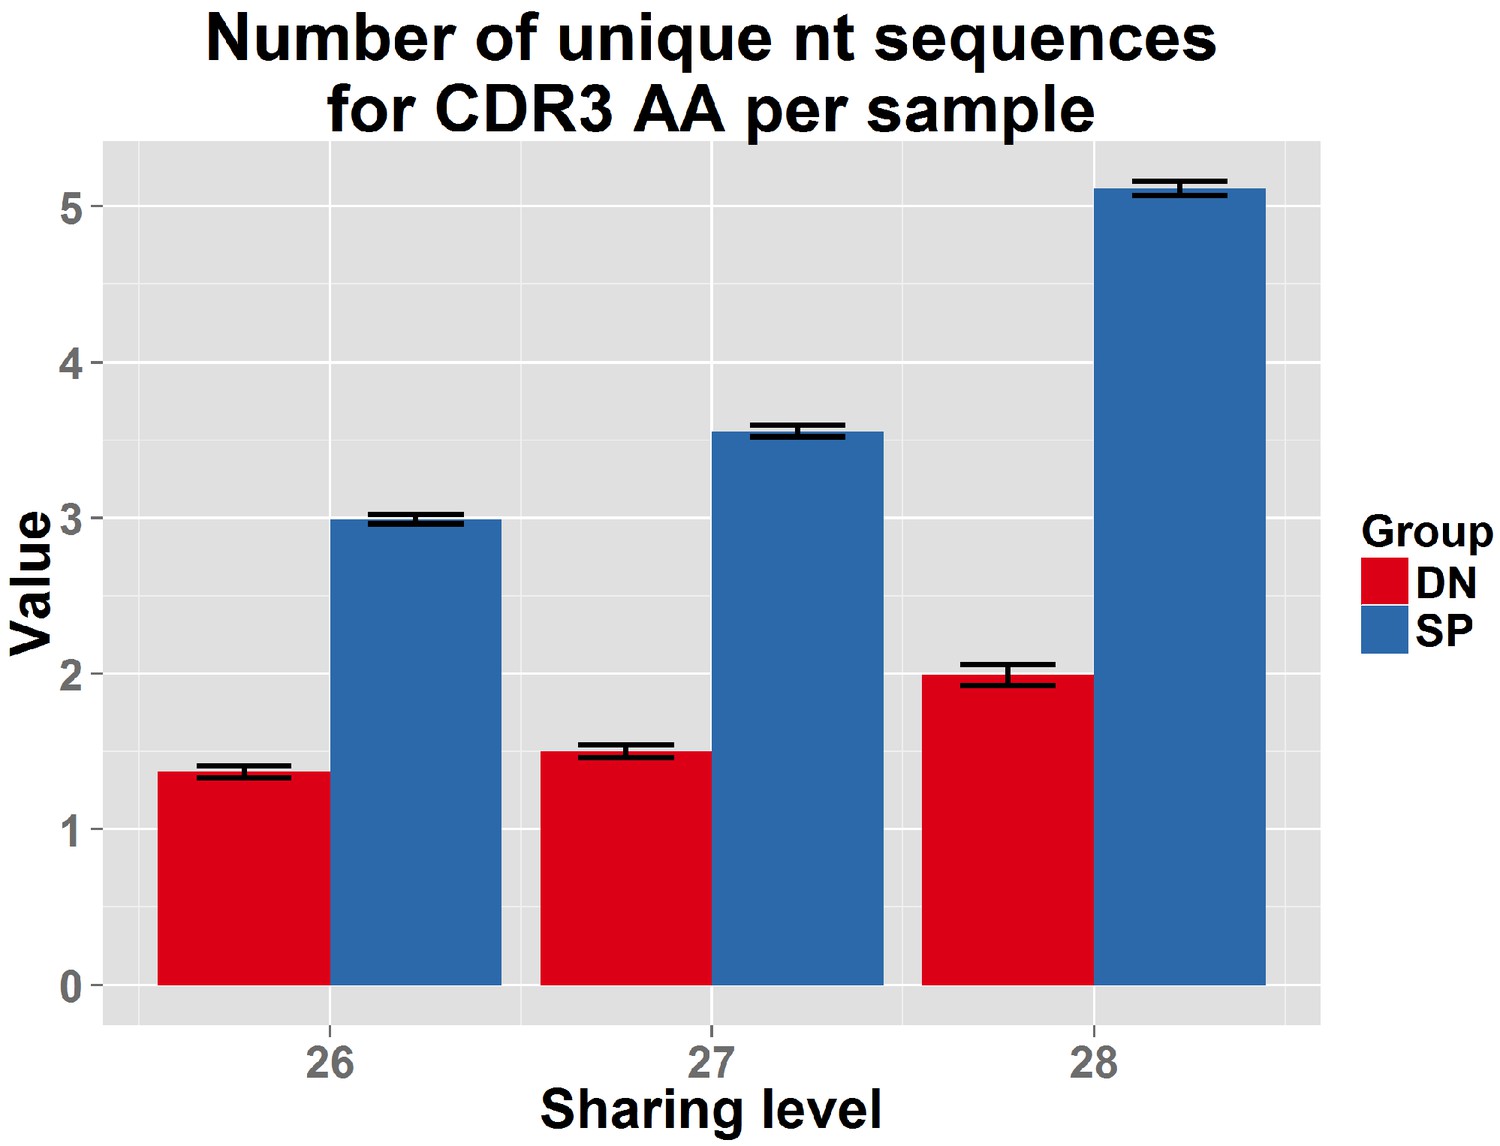
DN thymocytes manifest lower convergent recombination.
Comparison of the number of nt sequences encoding, on average, an AA CDR3 sequence, for public CDR3 AA sequences, found to be shared by more than 25 out of 28 mice in the reference dataset. Public CDR3 sequences coming from DN thymocytes were encoded on average by a lower number of nucleotide (nt) sequences compared to those from CD4+ splenic T cells (p<2.2e-16 for each of these top sharing levels).
Figure 5 with 5 supplements
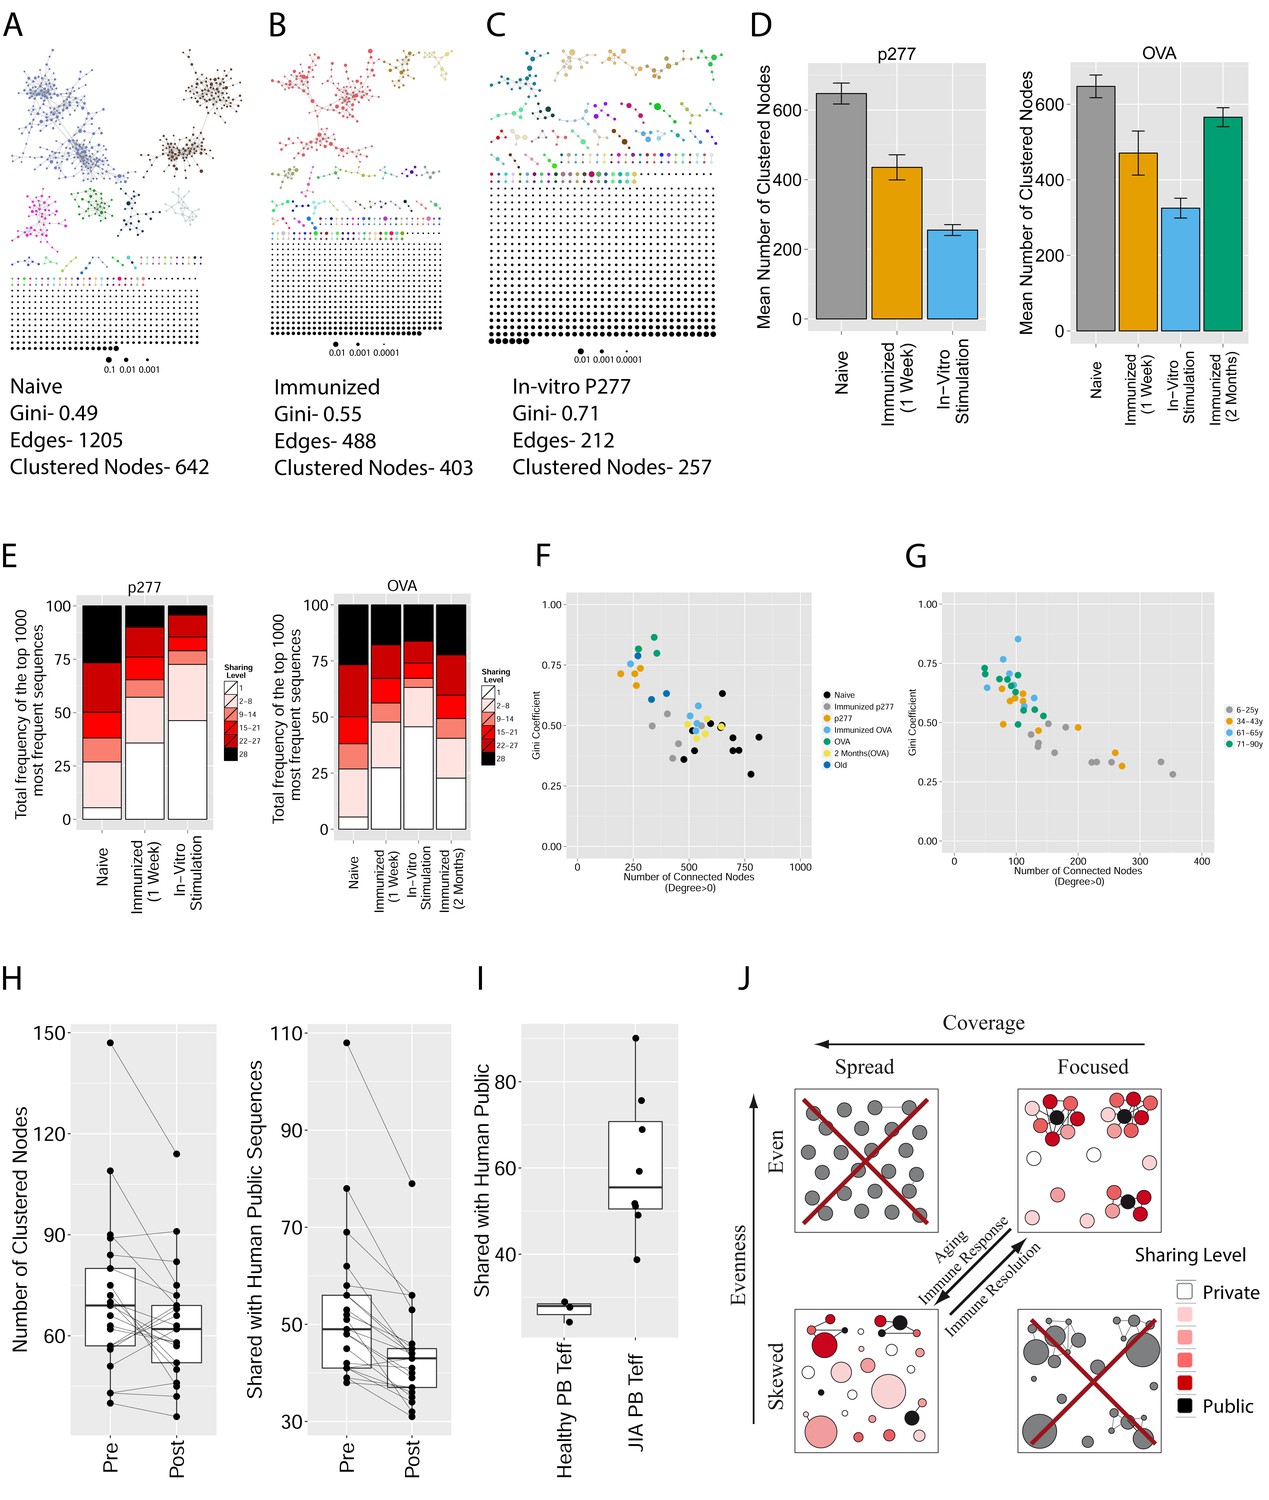
Immunization, in vitro antigen re-stimulation, anti-CTLA4 antibody treatment and aging perturb TCR networks coupled with an increase in repertoire skewness.
(A–C) Networks of the thousand most frequent CDR3 sequences are shown for (A) a naïve mouse, (B) a mouse Immunized with a self-peptide (p277), and (C) T cells from the spleen of an immunized mouse, which were re-stimulated in vitro with the p277 peptide. (D) Mean number of clustered nodes in networks formed by the top 1000 CDR3 sequences from the following repertoires: Left: naïve mice (n = 12); p277 immunized mice, 7d post immunization (n = 5); and in-vitro re-stimulated with p277 (n = 5). Right: naïve mice (n = 12); OVA immunized mice, 7d post immunization (n = 5); in-vitro re-stimulated with OVA peptide (n = 3); and immunized mice, 2 months post-immunization (n = 5). Error bars indicate standard error. (E) Frequency of the top 1000 most frequent CDR3 sequences by sharing level, for the same repertoires as in (D). Sharing levels were calculated based on sharing in the reference dataset of 28 mice. (F) The Gini Coefficient (a measure for repertoire evenness) plotted vs. the number of clustered nodes, for the top 1000 CDR3 sequences from the repertoires from (D, E) and from aged mice (n = 3). (G) The Gini Coefficient plotted vs. the number of clustered nodes for 39 human samples (Britanova et al., 2014) divided into 4 age groups. (H) The number of clustered nodes (left) and the number of public clonotypes (right, shared by all 11 young human samples in a reference cohort [Britanova et al., 2014]) for the top 1000 most abundant CDR3 sequences in 21 paired samples of patients at baseline and 30 to 60 days after receiving CTLA4 blockade treatment with tremelimumab (data from [Robert et al., 2014]). (I) Number of public clonotypes (defined as in H) out of the top 1000 most abundant CDR3 sequences in either healthy donors (left) or Juvenile Idiopathic Arthritis patients (right). (J) A conceptual figure of the evolution of repertoire structure. In young and healthy individuals the repertoire is focused and even (top-right), with public and CS-public CDR3 sequences at the center of network clusters. Following an immune response, or with aging, the repertoire becomes more skewed and spread in sequence space (bottom-left), due to preferential expansion of private clones at the expense of more public clones.
Figure 5—figure supplement 1
Immunization and in vitro antigen stimulation affect network architecture.
(A) The number of edges in networks formed by the 1000 most abundant CDR3 sequences in three TCR datasets: 12 naïve mice; 5 mice immunized with peptide p277 (HSP60 437–460 VLGGGCALLRCIPALDSLTPANED) emulsified in Complete Freund’s Adjuvant (CFA); and 5 mice immunized with p277+CFA whose splenic T cells were stimulated in-vitro with peptide p277. (B) The number of edges in networks formed by the 1000 most abundant CDR3 sequences in four TCR datasets: 12 naïve mice; 5 mice immunized with OVA 323–339 peptide (ISQAVHAAHAEINEAGR) in CFA; 3 mice immunized with OVA+CFA whose splenic T cells were stimulated in-vitro with the same OVA peptide; and 5 mice immunized with OVA+CFA whose splenic T cells were analyzed 2 months post-immunization.
Figure 5—figure supplement 2
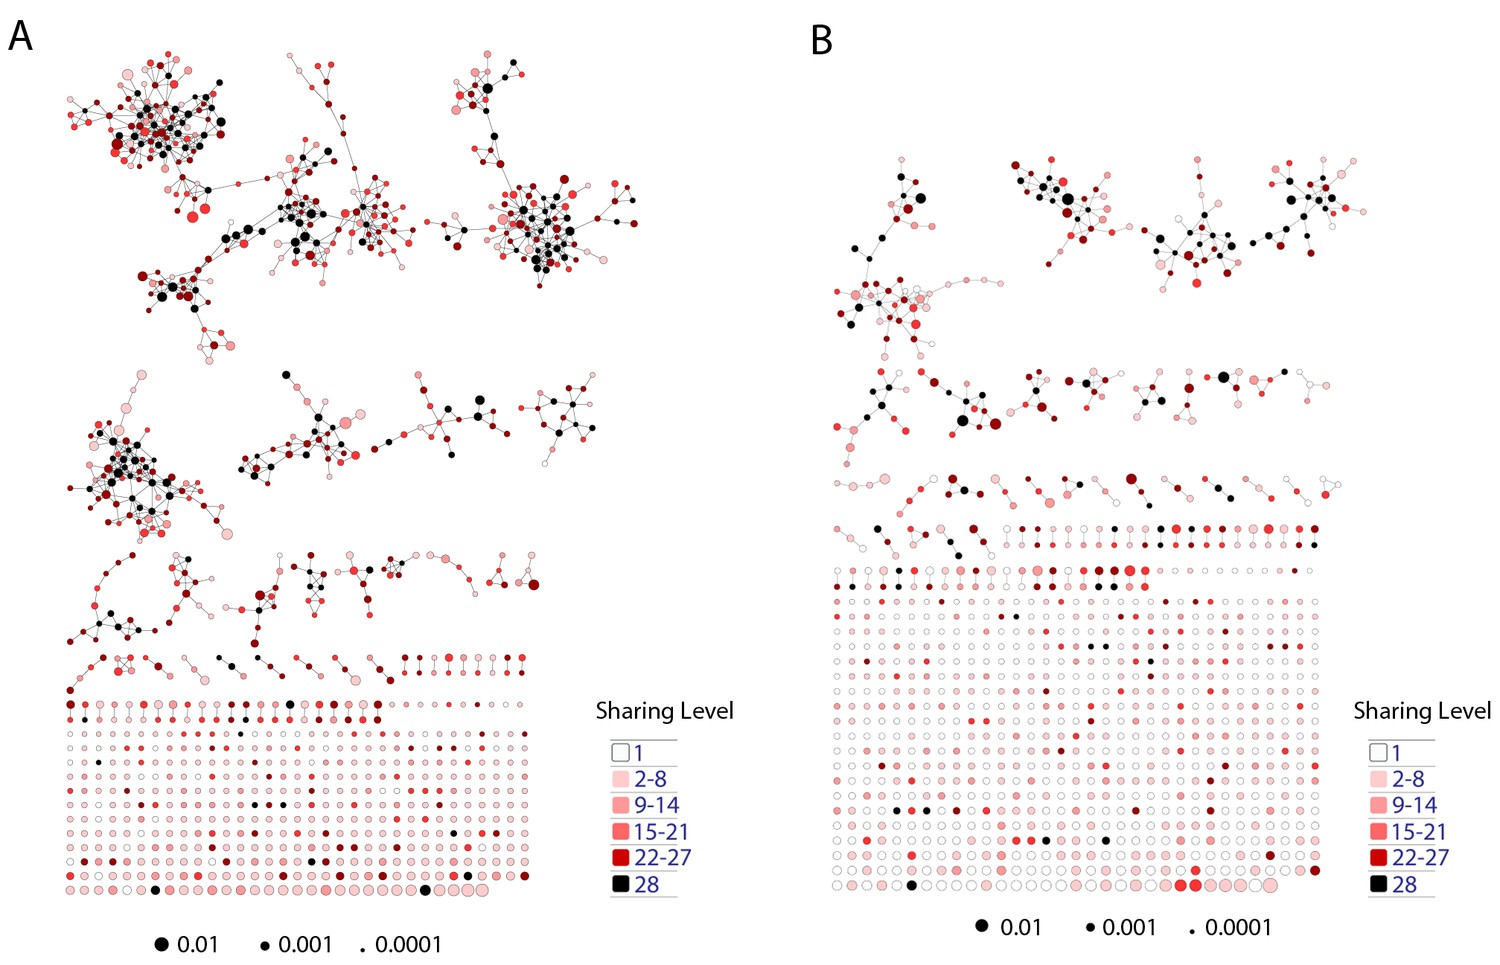
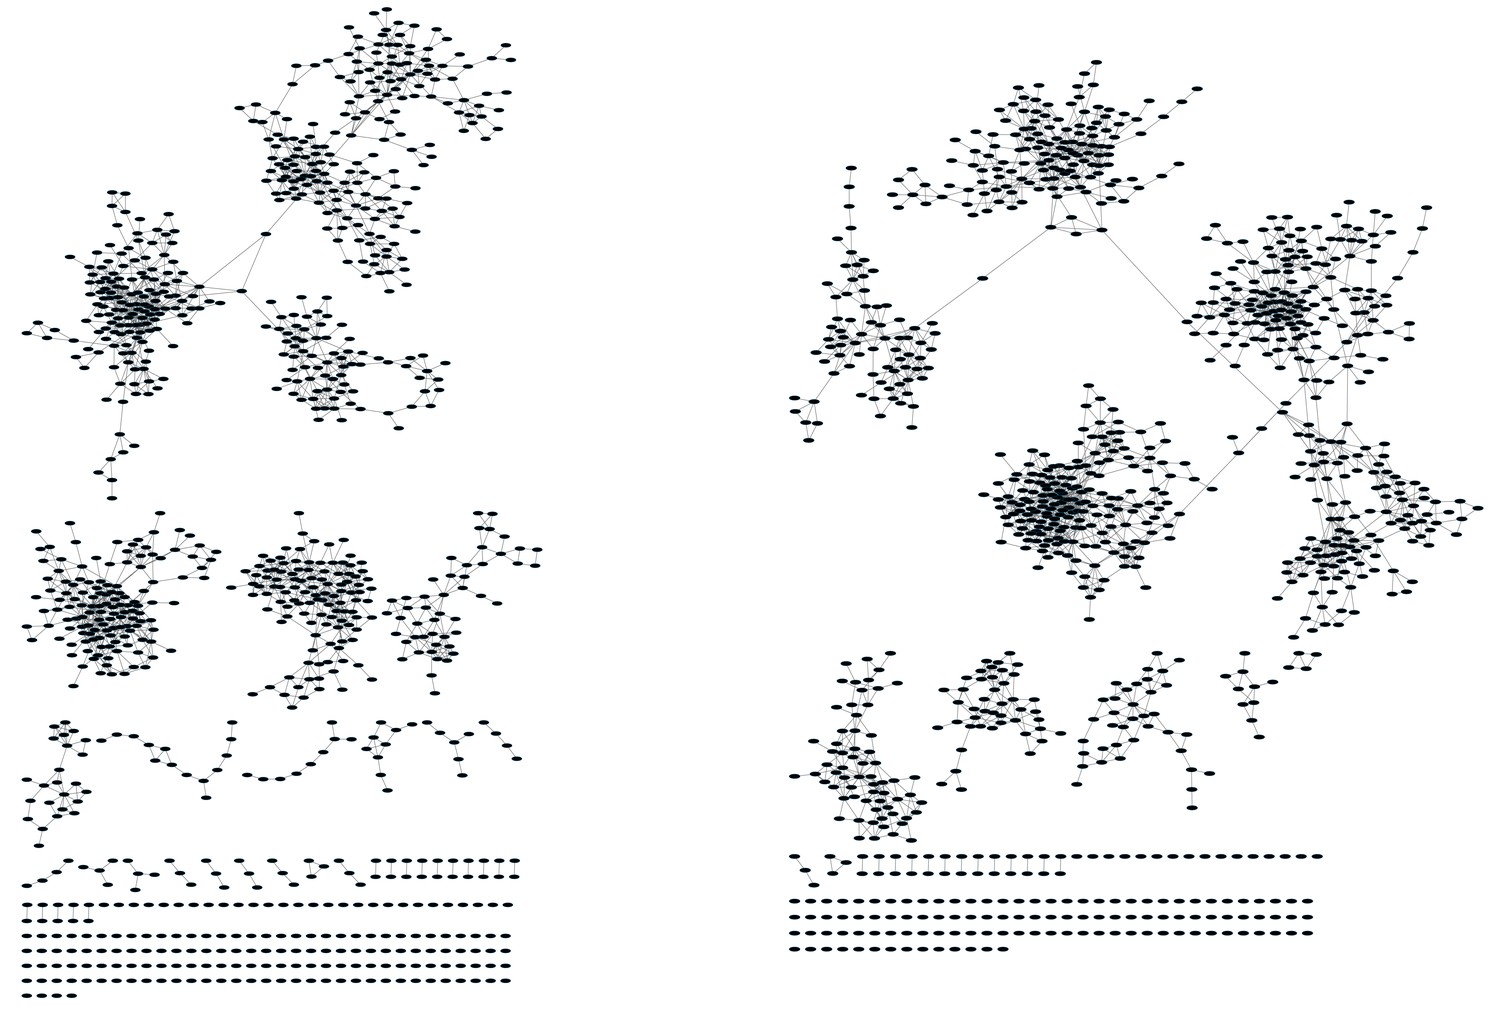
Mouse TCR Networks become less connected with aging.
A comparison of network clusters in young and aged mice. Network representations of the 1000 most frequent clones in (A) young and (B) aged mice. The networks composed of the 1000 most frequent clones in the young mice (n = 3) manifested 590.3 ± 61.9 clustered nodes with 992.7 ± 147.4 edges. In contrast, networks composed of the 1000 most frequent clones in the aged mice (n = 3) had 334.7 ± 63.5 clustered nodes with 362.3 ± 153.8 edges. Nodes are colored according to the sharing level of their corresponding CDR3 sequence in the 28 mice reference dataset.
Figure 5—figure supplement 3
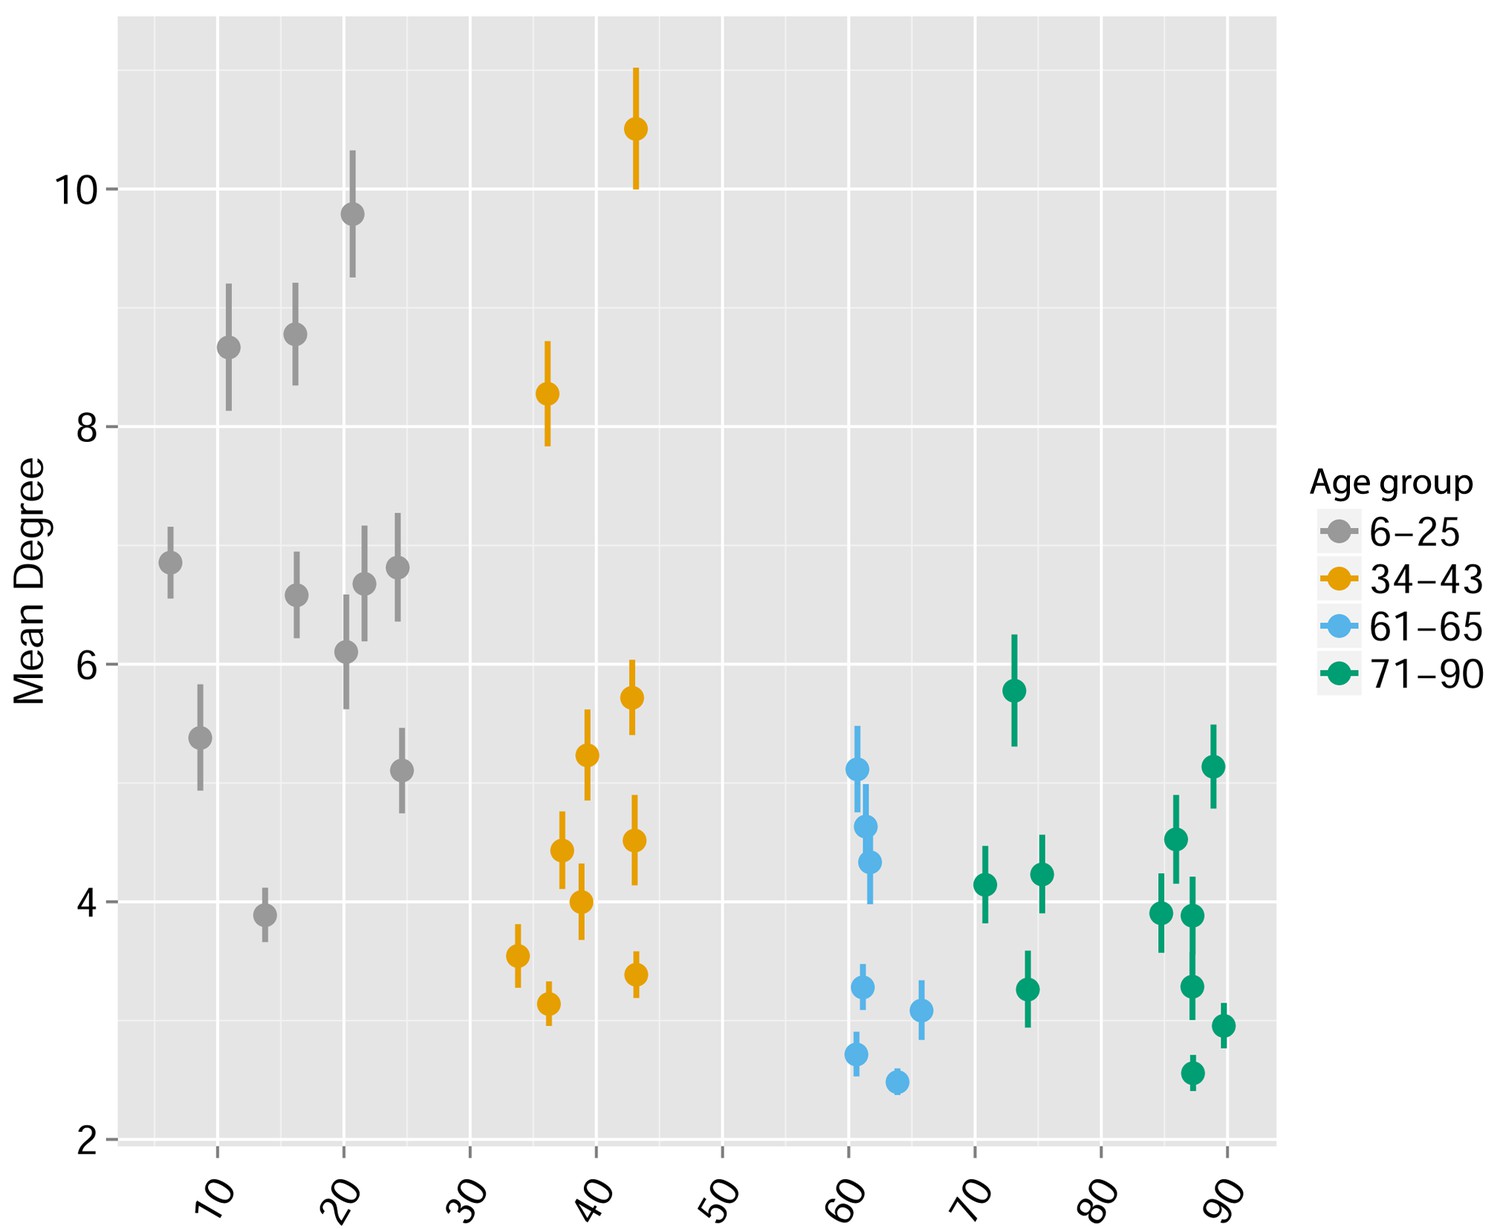
Human TCR Networks become less connected with aging.
A comparison of network connectivity formed by the thousand most frequent CDR3 AA segments expressed in 39 humans at different ages (data from Britanova et al. (2014). The Mean degree was calculated for each human sample and colored according to 4 age groups: 6–25, 34–43, 61–66, and 71–90 years.
Figure 5—figure supplement 4
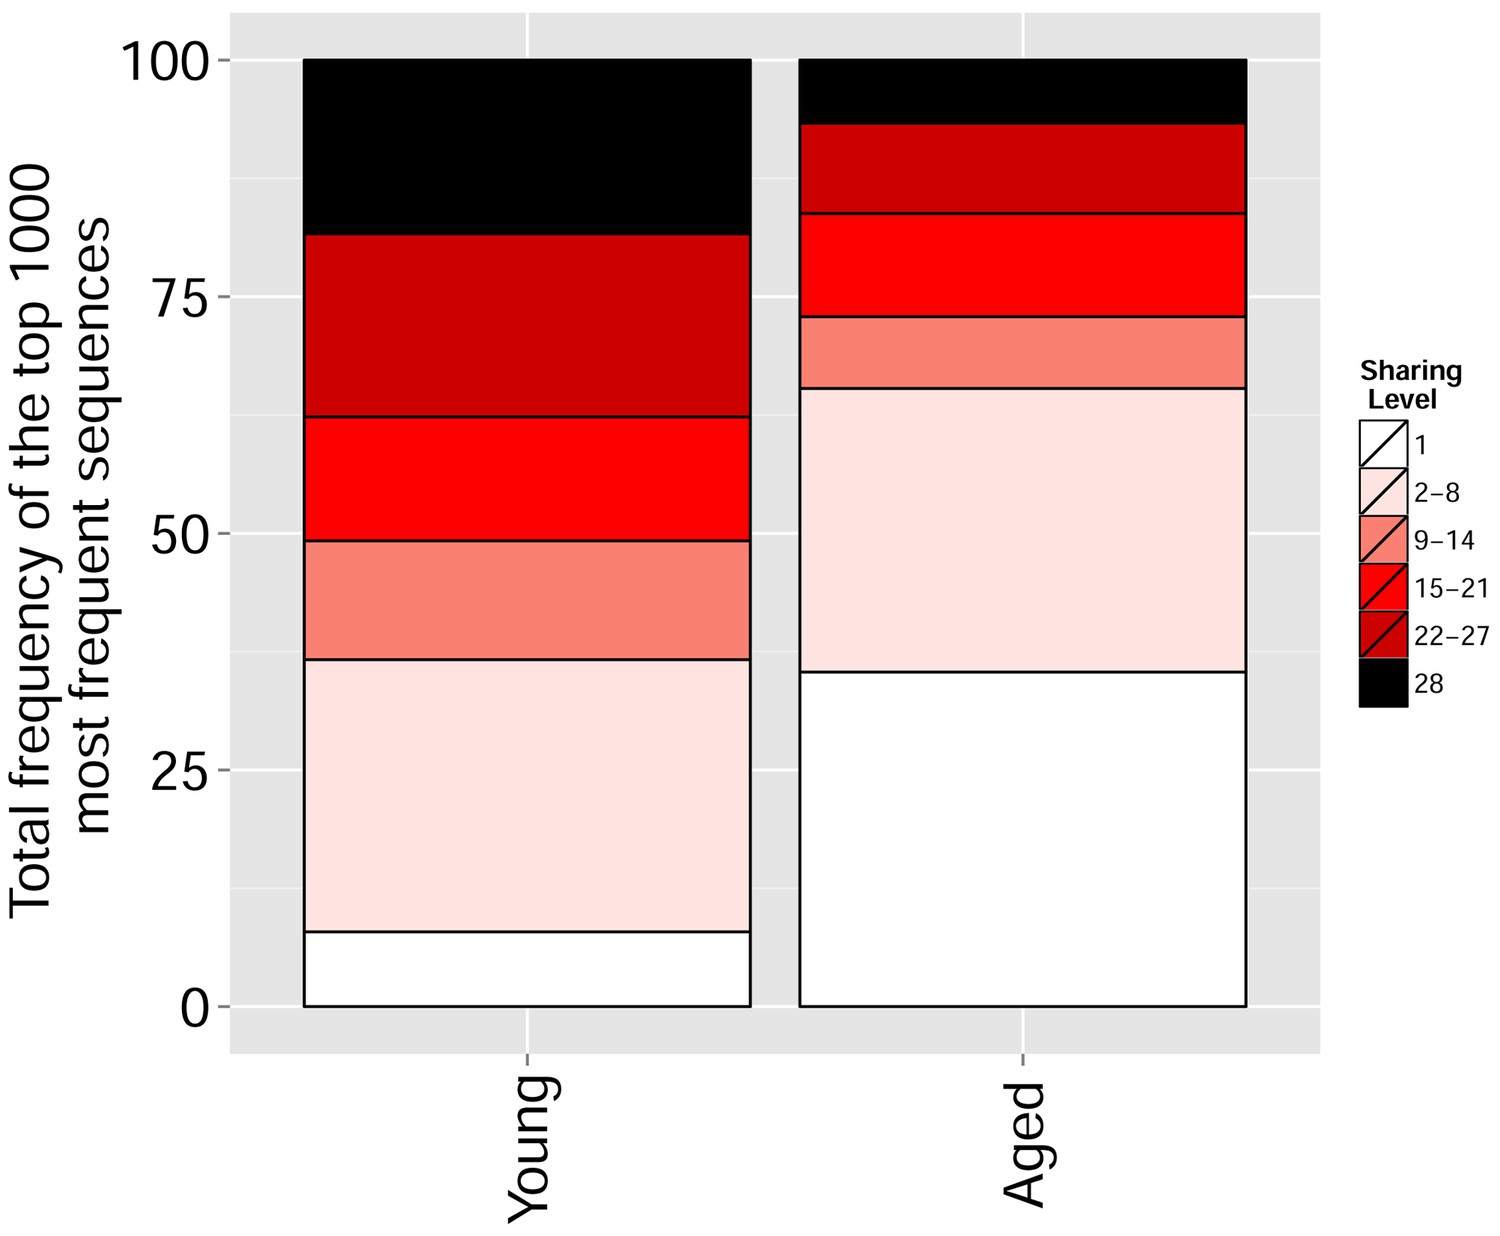
With aging, the repertoire becomes more skewed and spread in sequence space due to preferential expansion of private clones at the expense of more public clones.
Frequency of the top 1000 most frequent CDR3 sequences by sharing level for young (6–8 weeks, n = 3) and aged (17–20 months, n = 3) mice.
Figure 5—figure supplement 5
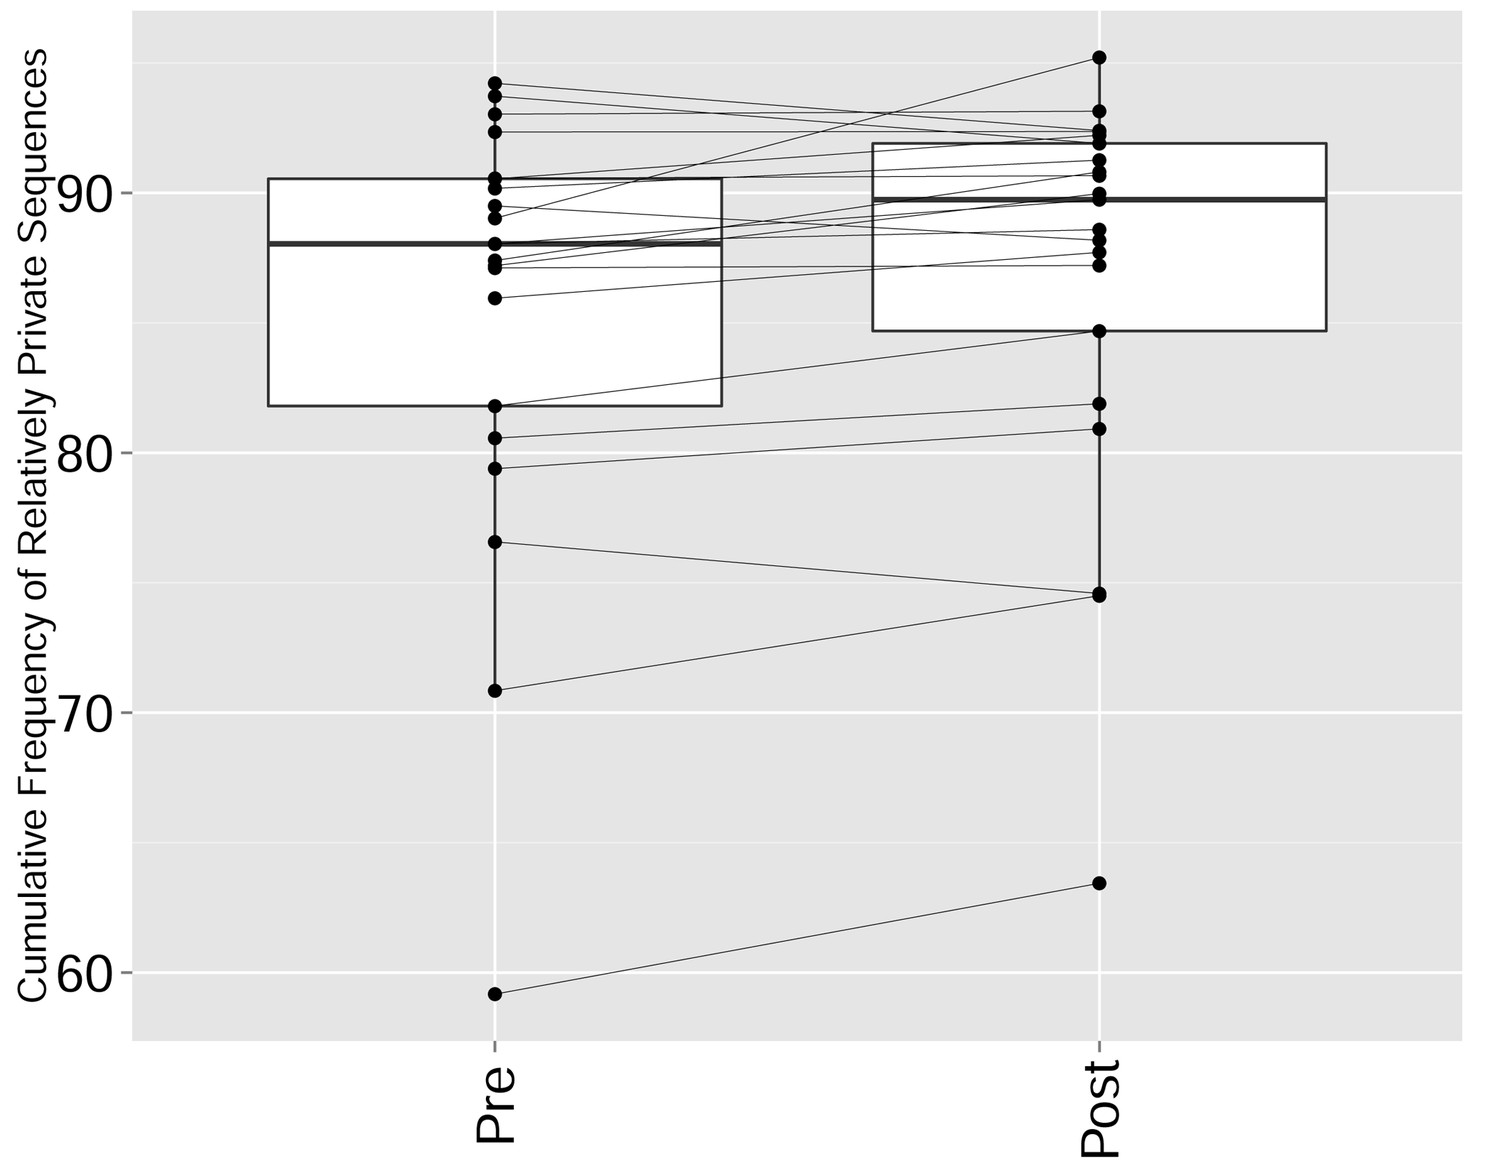
CTLA4 blockade results in a repertoire that is more skewed and spread in sequence space, due to preferential expansion of private clones at the expense of more public clones.
The cumulative frequency (in %) of relatively private CDR3 sequences from the top 1000 most frequent sequences in the repertoires of patients pre and post CTLA4 blockade treatment with tremelimumab (Robert et al., 2014). Sharing was defined by comparison with a reference dataset of CDR3 sequences from 11 young healthy individuals (Britanova et al., 2014): Relatively private sequences were defined as CDR3 sequences shared by 0–5 individuals out of 11 in the reference dataset, where 0 indicates a sequence not found in any of the 11 individuals in the reference cohort. There is a significant increase in the frequency of relatively private sequences (p-value=0.01947, ranked Wilcox paired test).
Additional files
-
Supplementary file 1
Statistics of TCR networks for mouse and human repertoires.
Mouse data: 12 mice from (Madi et al., 2014). Human data: 11 young subjects from (Britanova et al., 2014).
- https://doi.org/10.7554/eLife.22057.024
-
Supplementary file 2
Summary of the data for the quad-KO mice, which are lacking four elements needed for physiological MHC-dependent antigen selection: MHC-I and -II molecules together with CD4 and CD8 co-receptor molecules (Van Laethem et al., 2007, 2013), and matched control WT mice.
Connected.nodes and edges refers to network statistics generated from the 1000 most frequent CDR3 sequences in each mouse.
- https://doi.org/10.7554/eLife.22057.025
-
Supplementary file 3
Summary of TCR-seq data used in this study, from 5 experimental conditions: (1) mice that were immunized with either Chicken Ovalbumin (OVA) or (2) peptide 277 (p277), of HSP60.
Spleens were harvested on day 7 post immunization and T cells were extracted for TCR analysis. (3) in vitro stimulation: T cells from spleens of immunized mice were harvested on day 7 and were re-stimulated with irradiated splenocytes and the relevant peptide antigen. (4) Five of the OVA-immunized mice received a boost IP injection of 100 μg OVA + CFA on day 14, and spleens were harvested on day 60 for TCR analysis. (5) DN thymocytes.
- https://doi.org/10.7554/eLife.22057.026
Download links
A two-part list of links to download the article, or parts of the article, in various formats.
Downloads (link to download the article as PDF)
Open citations (links to open the citations from this article in various online reference manager services)
Cite this article (links to download the citations from this article in formats compatible with various reference manager tools)
T cell receptor repertoires of mice and humans are clustered in similarity networks around conserved public CDR3 sequences
eLife 6:e22057.
https://doi.org/10.7554/eLife.22057


