FlpStop, a tool for conditional gene control in Drosophila
- Stanford University, United States
Figures
Figure 1 with 2 supplements
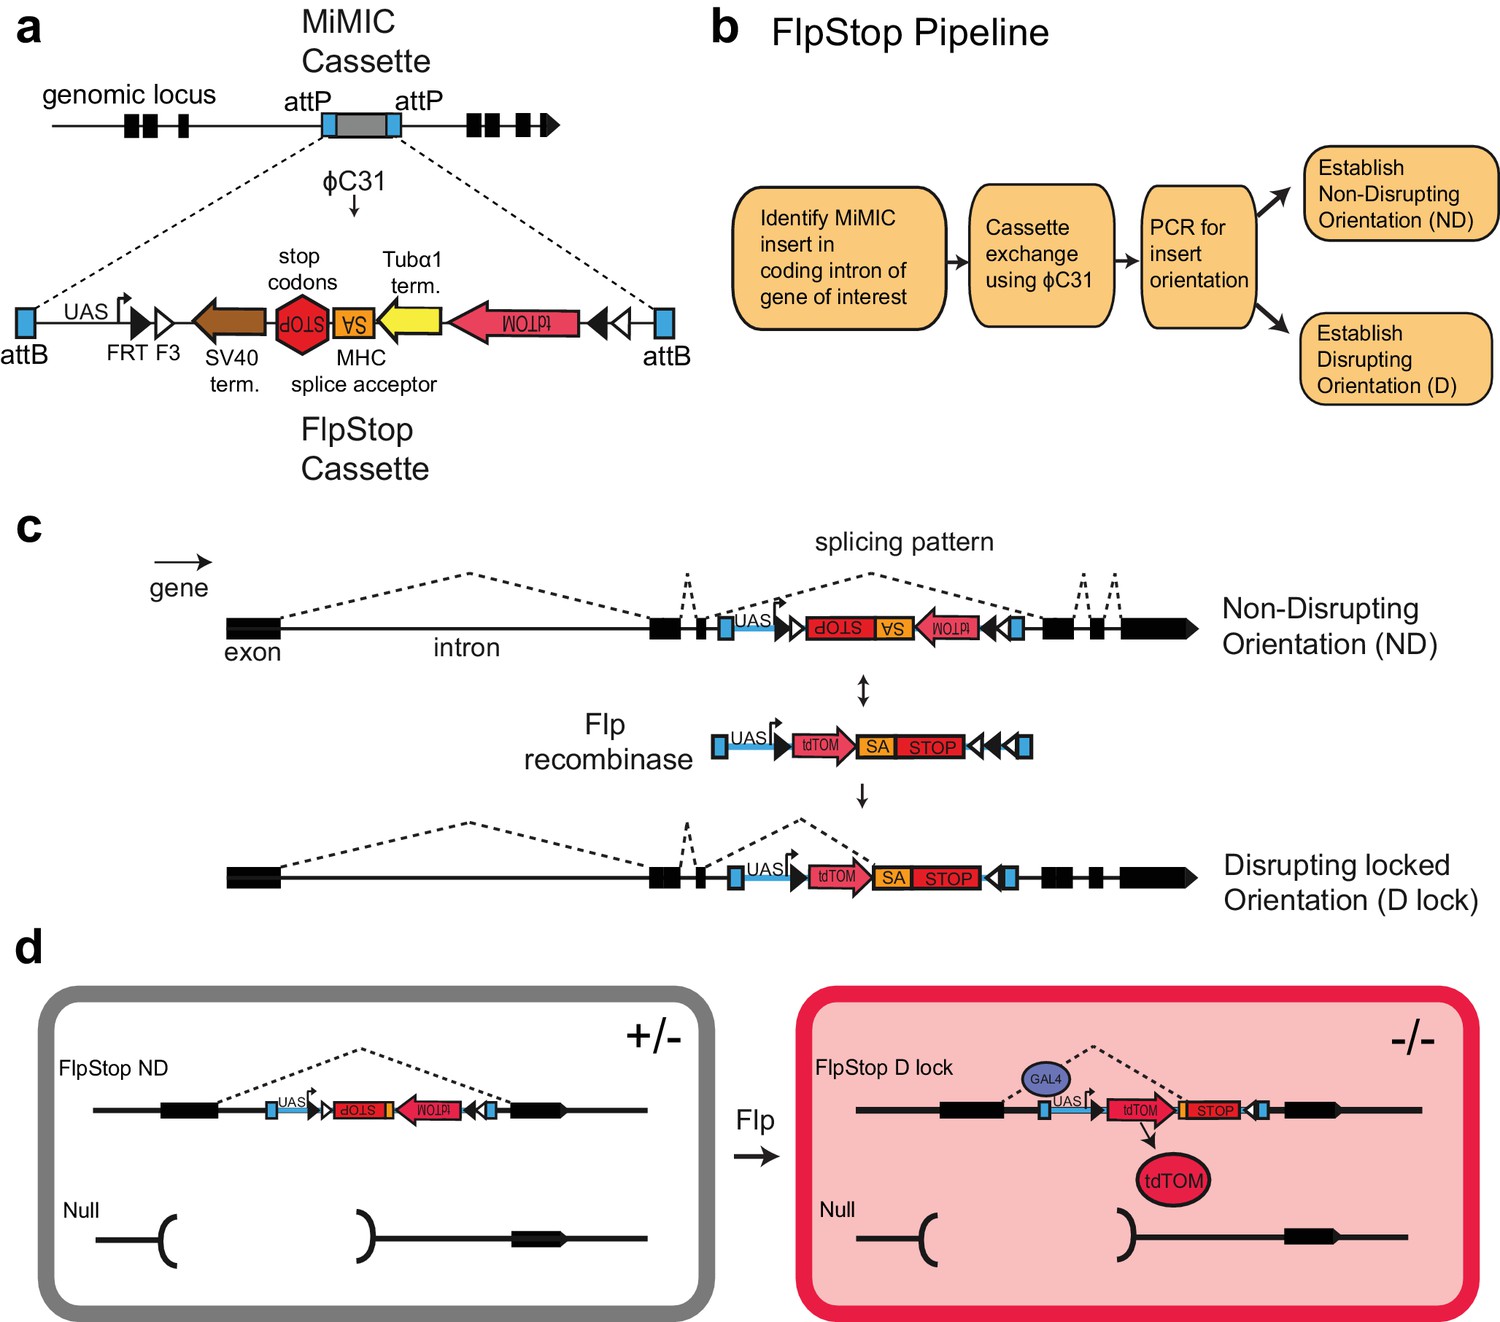
FlpStop is a generalizable tool for cell type-specific disruption of endogenous gene function.
(a) Schematic of the internal elements of the FlpStop cassette and of how FlpStop transgenic alleles are created. An intronic MiMIC cassette (Venken et al., 2011a) is replaced with the FlpStop cassette using ϕC31. The FlpStop cassette contains the following disruptive elements: two transcriptional terminators, a MHC splice acceptor, and stop codons in all three reading frames. These disruptive elements are flanked by a series of Flp recombinase sites (FRT and F3). An upstream activation sequence (UAS) is located outside of the FRT sites and a tdTomato is encoded internal to the FRT sites. (b) Pipeline to create FlpStop alleles. First, a MiMIC line is identified that contains an insertion within a coding intron of a gene of interest. The MiMIC cassette is replaced with the FlpStop cassette by ϕC31-mediated cassette exchange. Insertion events are identified by the loss of the MiMIC cassette’s yellow rescue marker from the progeny of the injected embryos (see Venken et al., 2011a for details). PCR is used to obtain the orientation of the insertion, and stable stocks with the FlpStop insertion in the Disrupting (D) and Non-Disrupting (ND) orientations are established. (c) Schematic of the FlpStop logic for conditional disruption of an endogenous gene. The cassette sits dormant within an intron of the gene of interest. While it is in the non-disrupting orientation, the splice acceptor and stop signals (stop codons and transcriptional terminators) are inverted and thus ignored (and removed during RNA splicing). In the presence of Flp recombinase, the disruptive elements are inverted and then locked in place by the FLEx switch (Schnütgen et al., 2003). In this disrupting locked (D lock) orientation, the splice acceptor and stop signals are revealed and disrupt expression of the gene by targeting both transcription and translation. (d) Schematic of how tdTomato labels mutant cells. Flies bearing one copy of a null allele and one copy of the FlpStop non-disrupting allele will be heterozygous (+/−) throughout the whole animal (left). However, in cells that express Flp recombinase, the cassette will be inverted, making it disrupting (D lock), and the tdTomato will be brought into proximity to the UAS sequence that resides outside of the FLEx switch, enabling Gal4 to drive the production of tdTomato. TdTomato therefore labels the homozygous mutant cells (−/−) (right).
Figure 1—figure supplement 1
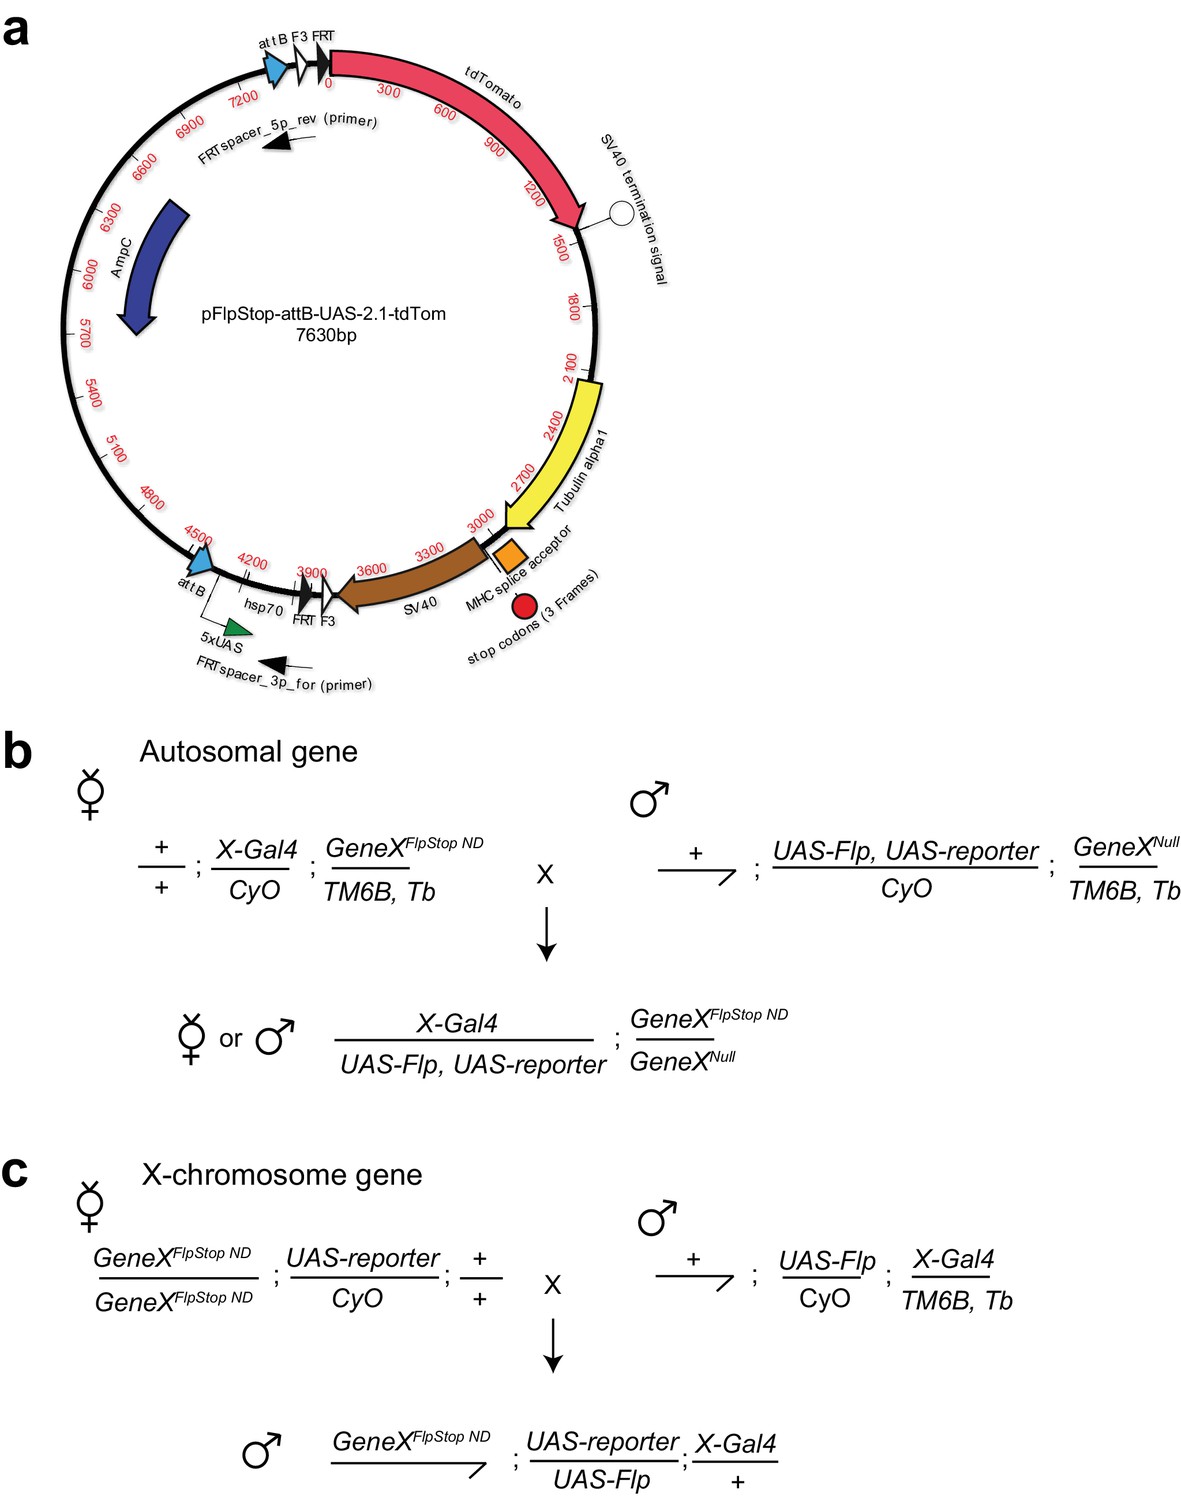
FlpStop construct and example experimental crossing schemes.
(a) Map of the FlpStop plasmid pFlpStop-attB-UAS-2.1-tdTom. attB denotes the ϕC31 target sites. F3 and FRT denote the mutant (F3) and wild-type (FRT) Flp recombinase target sites (Schlake and Bode, 1994). SV40 and Tublin alpha1 are transcriptional terminators. TdTomato encodes a red fluorescent protein (Shaner et al., 2004). The cassette also includes a series of Upstream Activation Sequences (5xUAS), a minimal hsp70 promotor (hsp70), stop codons in three different reading frames, and the MHC intron 18 splice acceptor (SA) site (Venken et al., 2011a; Hodges and Bernstein, 1992). (b) An example experimental cross for cell type-specific disruption of an autosomal gene using the FlpStop approach. GeneX is the gene of interest. X-Gal4 is the Gal4 driver line targeting the cell type of interest. UAS-Flp allows for expression of Flp recombinase within cells that express Gal4. UAS-reporter allows the full Gal4 pattern to be visualized (e.g. for measuring neuronal activity with GCaMP6f). Experimental flies carry five transgenes: FlpStop and null alleles of GeneX, X-Gal4, UAS-reporter, and UAS-Flp. (c) An example experimental cross for cell type-specific removal of a gene on the X-chromosome using the FlpStop approach. Male experimental flies carry four transgenes and are hemizygous for the FlpStop allele.
Figure 1—figure supplement 2
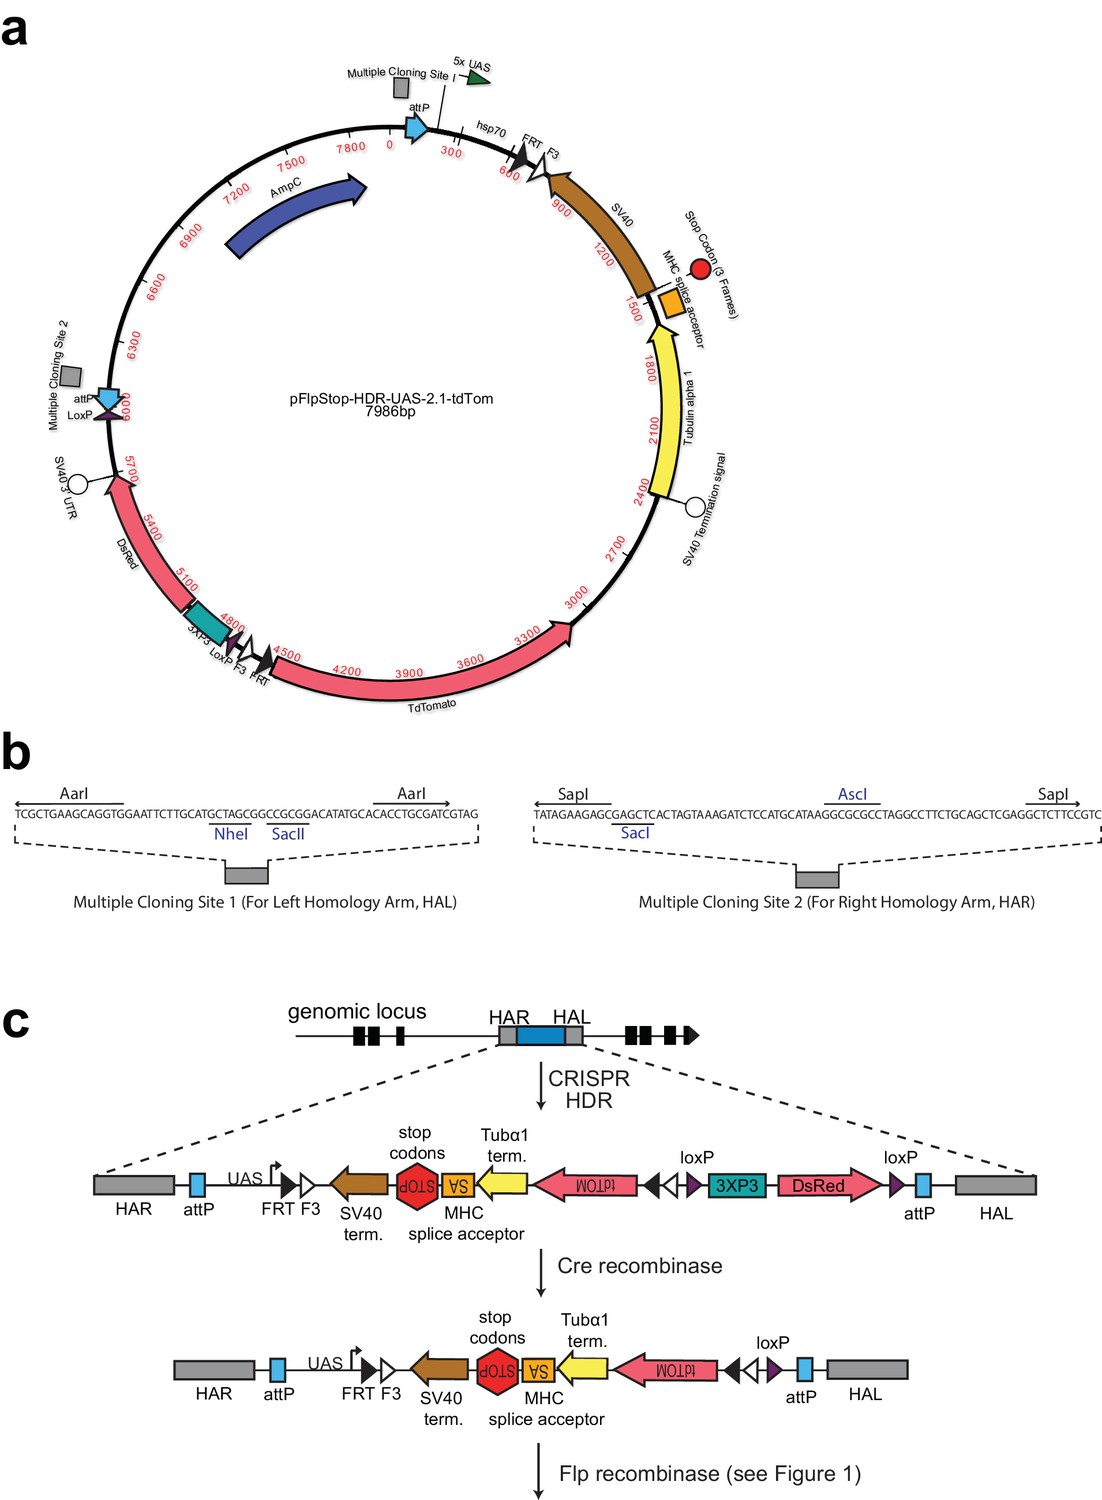
FlpStop CRISPR-HDR construct.
(a) Map of the FlpStop CRISPR-HDR construct pFlpStop-HDR-UAS-2.1-tdTom. FlpStop cassette components (F3, FRT, SV40, MHC splice acceptor, Tubulin alpha 1, TdTomato, 5xUAS, hsp70) are identical to those in pFlpStop-attB-UAS-2.1-tdTom (Figure 1—figure supplement 1). DsRed encodes a red fluorescent protein and is downstream of the 3XP3 promoter to allow for positive selection of CRISPR transformants through DsRed expression in the eyes. The 3XP3::DsRed reporter is flanked by loxP sites (Gratz et al., 2014). Additionally, the entire insert is flanked by ϕC31 attP sites (Groth et al., 2000). (b) Multiple Cloning Site (MCS) sequences for insertion of left and right homology arms that enable CRISPR-HDR. MCS sequences were previously used in the CRISPR-HDR plasmid pHD-DsRed-attP (Gratz et al., 2014). These sequences contain standard restriction enzyme sites. Unique sites in blue and Type IIS restriction sites (AarI and SapI) allow for seamless insertion of homology arms. (c) CRISPR-HDR targets pFlpStop-HDR-UAS-2.1-tdTom to an intronic locus using homology arms that can be designed to insert the cassette into either the disrupting (D) or non-disrupting (ND) orientation; successful transformants express DsRed under the control of 3XP3. 3XP3::DsRed is efficiently excised in the presence of Cre recombinase, leaving the FlpStop cassette in the intronic locus ready to undergo Flp recombinase-mediated cassette inversion. In addition, the attP sites that flank the cassette can be used to replace the FlpStop cassette with a donor construct containing attB sites through ϕC31-mediated cassette exchange. This allows the genomic location to be repurposed if desired (Groth et al., 2000).
Figure 2 with 2 supplements
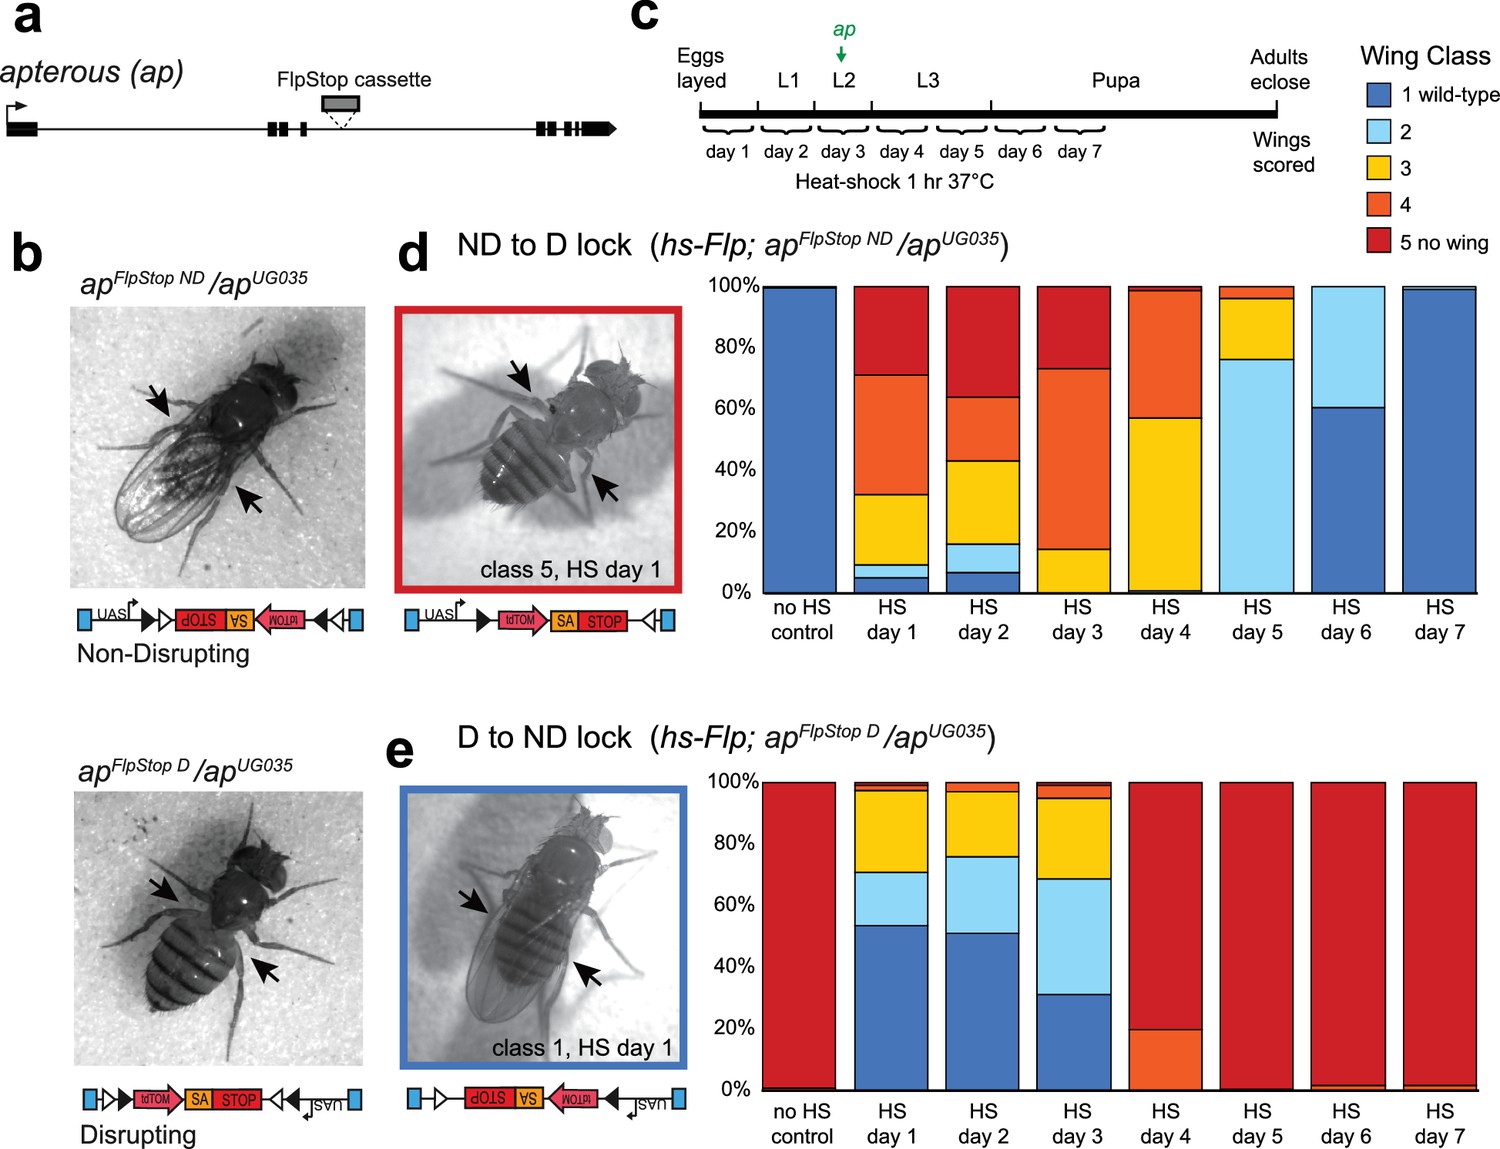
The FlpStop cassette enables both disruption and rescue of apterous at different developmental time points.
(a) Schematic of the apterous locus. Black boxes denote exons, and the arrow denotes the transcriptional start site. The FlpStop cassette (gray rectangle) is inserted between exons 4 and 5. (b) Representative images of female flies that are apFlpStop ND/apUG035 (top) or apFlpStop D/apUG035 (bottom). The arrows highlight the presence or absence of wings on each fly. (c) Schematic of the experimental design. Different groups of flies bearing apFlpStop alleles were heat-shocked for 1 hr at 37°C during one of the 7 days indicated in the timeline to induce Flp recombinase expression and invert the FlpStop allele. The green arrow labeled ap indicates that apterous begins to be expressed in the wing discs in mid-second instar. After eclosion, individual wings were scored on a scale ranging from class 1: wild-type wings to class 5: little or no wing tissue (Gohl et al., 2008). (d) Wing phenotypes of flies bearing the apterous non-disrupting allele (apFlpStop ND) heat-shocked at seven different time points during development (day 1-day 7) or not heat-shocked (no HS control). Full genotype: y, w, hsFlp122/+ or Y; apFlpStop ND/ apUG035. n wings = 268 (no HS control), 118, 86, 112, 230, 234, 258, and 292 (day 1-day 7). An example image of an experimental fly heat-shocked on day 1 is displayed on the left. (e) Wing phenotypes of flies bearing the apterous disrupting allele (apFlpStop D) heat-shocked at day 1-day 7 or not heat-shocked. Full genotype: y, w, hsFlp122/w or Y; apFlpStop D/ apUG035. n wings = 154 (no HS control), 114, 108, 122, 120, 210, 176, and 204 (day 1-day 7). An example image of an experimental fly heat shocked on day 1 is displayed on the left.
Figure 2—figure supplement 1
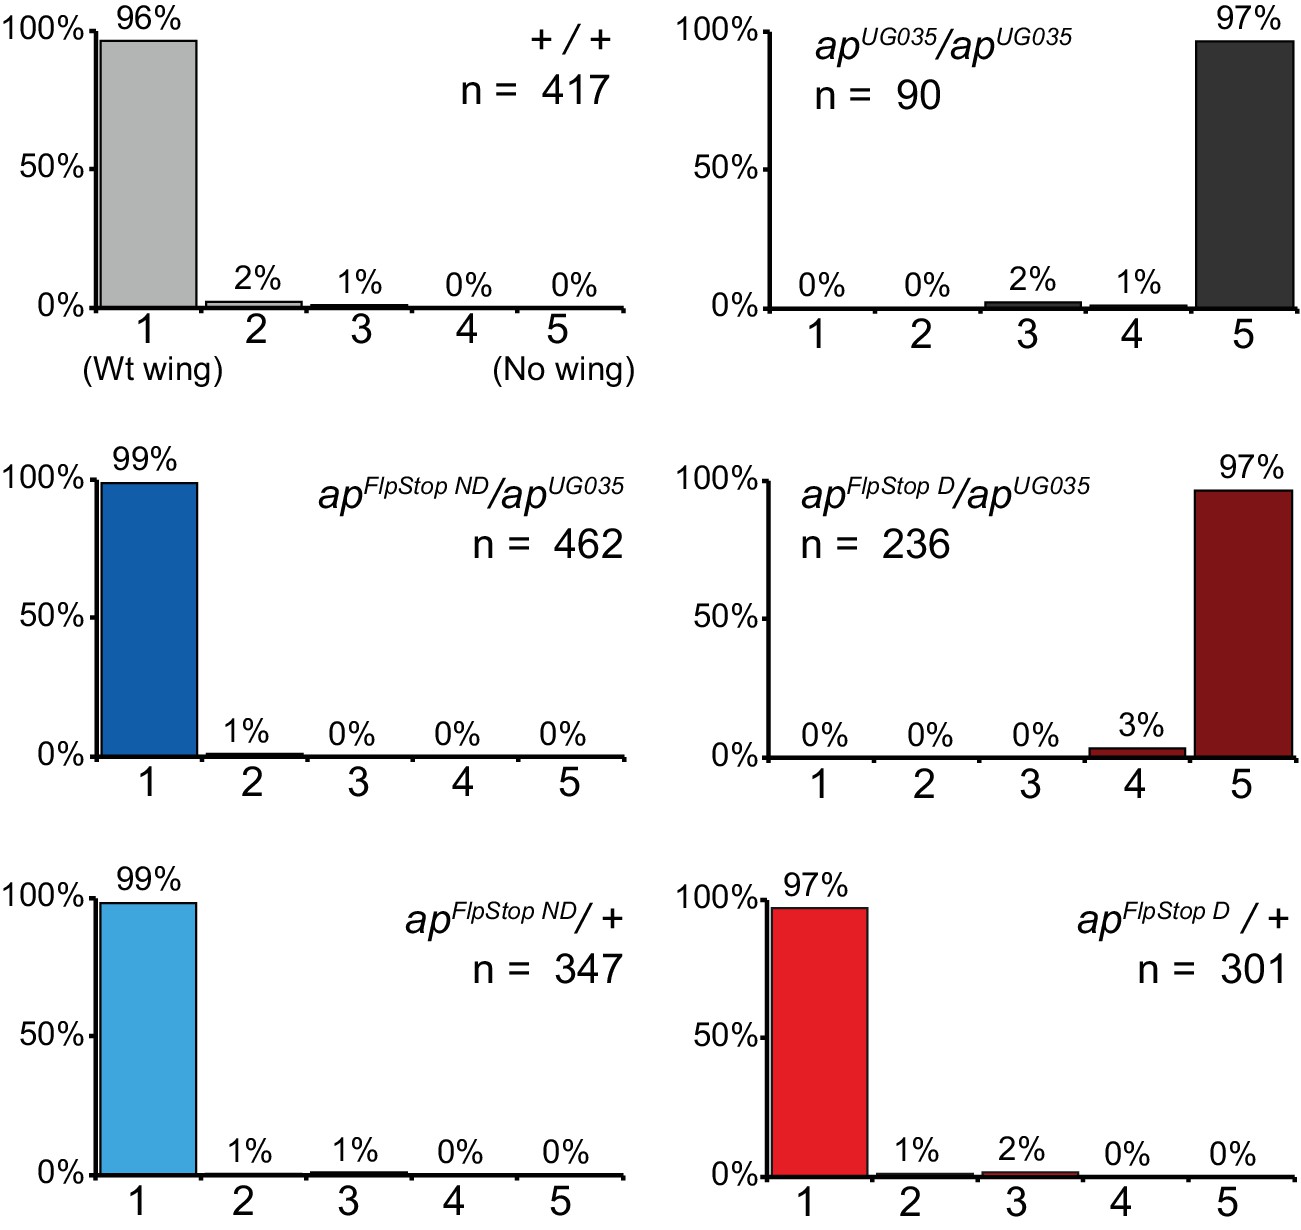
apterous complementation tests.
Complementation tests for the severity of the apterous wing phenotype in control flies (+/+), apterous null flies (apUG035/ apUG035), and flies carrying combinations of apFlpStop ND or apFlpStop D with these same wild-type or null alleles. Individual wings were scored on a scale ranging from class 1: wild-type wings to class 5: very little or no wing tissue (Gohl et al., 2008).
Figure 2—figure supplement 2

The FlpStop cassette disrupts apterous cell type-specifically.
(a) Schematic of the experimental logic for FlpStop-mediated removal of apterous from regions of the wing disc. TdTomato (red) labels tissue that has undergone cassette inversion and should be mutant for apterous (−/−). Apterous protein is labeled in green. (b) Wing disc from a wild-type (Wt) wandering third instar larva. (c) Wing disc from an experimental animal (y, w, hsFlp122/w or Y; apUG035/apFlpStop ND; tubP-Gal4/+) that was not heat-shocked. In (b and c), the arrows denote the region of strong Apterous expression within the dorsal compartment (Cohen et al., 1992). (d) Example of a wing disc from a heat-shocked experimental animal containing FlpStop clones (HS). The clones (tdTomato+) are denoted by a white dotted line for visualization. All images are maximum intensity projections. Scale bars are 20 μm in (b and c) and 30 μm in (d).
Figure 3 with 2 supplements
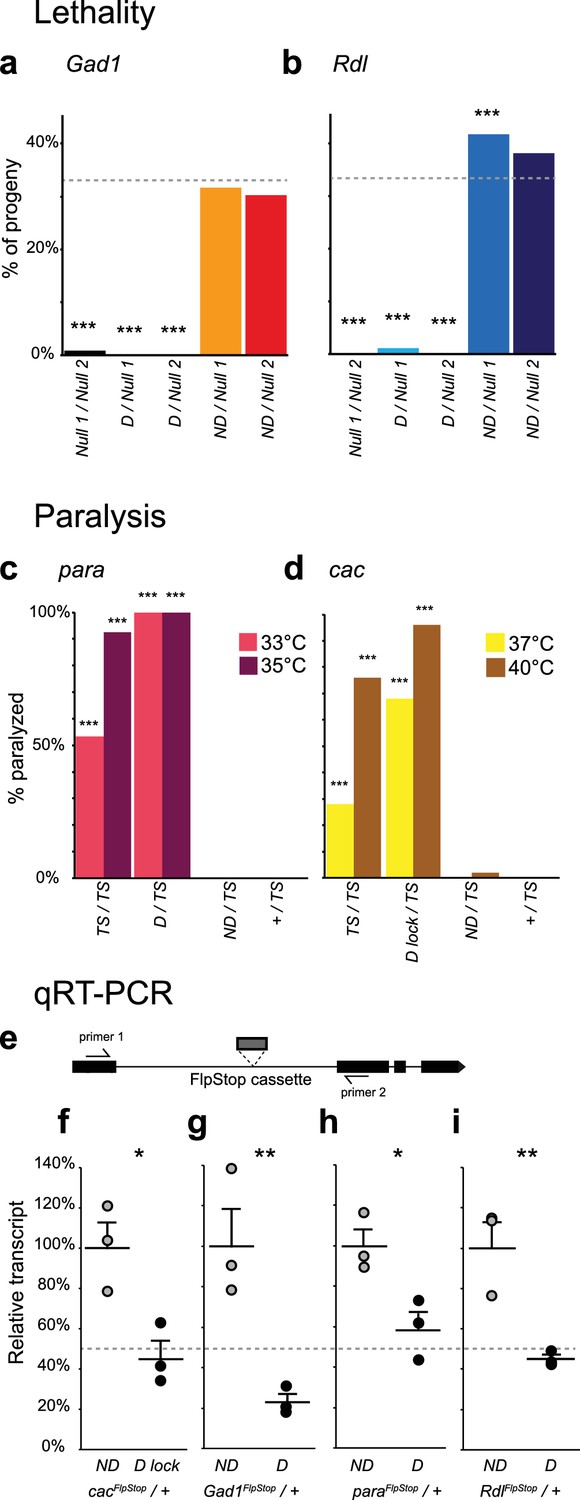
Complementation tests and qRT-PCR validate FlpStop conditional gene disruption.
(a and b) Genetic interactions of FlpStop alleles with null alleles for Gad1 (a) and Rdl (b) were assessed by lethality. In (a), Null 1 is Gad1L352F, and Null 2 is Df(3L)ED4341. n flies = 251, 281, 445, 345, and 416. In (b), Null 1 is Rdl1, and Null 2 is Df(3L)Rdl-2. n flies = 400, 267, 124, 398, and 280. FlpStop alleles are abbreviated as D and ND. Dotted line indicates the predicted survival of 33%. Both female and male flies were scored. Significance was assessed using a one-proportion z-test against the predicted survival. (c and d) para (c) and cac (d) FlpStop alleles were combined with temperature-sensitive mutations in these genes, and female flies were tested for paralysis upon heating. In (c), the TS allele is parats1. n flies = 40, 14, 35, and 40 tested at 35°C, and n = 30, 14, 30, and 30 tested at 33°C. In (d), the TS allele is cacTS2. D lock is the germline-inverted cac FlpStop allele in the disrupting orientation. n flies = 50 per genotype and temperature. Significance was assessed using a two-tailed Fisher’s exact test to compare each genotype to the TS/+ control. (e) Schematic of the primer design used to assess transcript knock down using qRT-PCR. Primers were designed to amplify a ~100 bp fragment of the cDNA that flanked the insertion location of the FlpStop cassette for each gene of interest. (f–i) Relative transcript levels of each gene of interest from heterozygous flies bearing the non-disrupting or disrupting orientation cassette. (f) cac, (g) Gad1, (h) para, and (i) Rdl. Transcript levels were normalized to the mean of the ND sample. Means + 1 SEM as well as the individual sample measurements are plotted. 50% is denoted by the gray dotted line. An unpaired two-tailed Student’s t-test was applied to the raw delta Ct values to assess significance. Heterozygous animals containing the balancer chromosome, either FM7c (f and h) or TM3 (g and i), were used for both non-disrupting and disrupting conditions. *p<0.05, **p<0.01, ***p<0.001, no mark indicates p>0.05. See Figure 3—figure supplement 1 for additional complementation tests and qRT-PCR, Figure 3—figure supplement 2 for information about the creation of the cacFlpStop D lock allele, and Figure 3—source data 1 for exact p-values.
-
Figure 3—source data 1
Table of statistical tests and exact p-values.
- https://doi.org/10.7554/eLife.22279.010
Figure 3—figure supplement 1
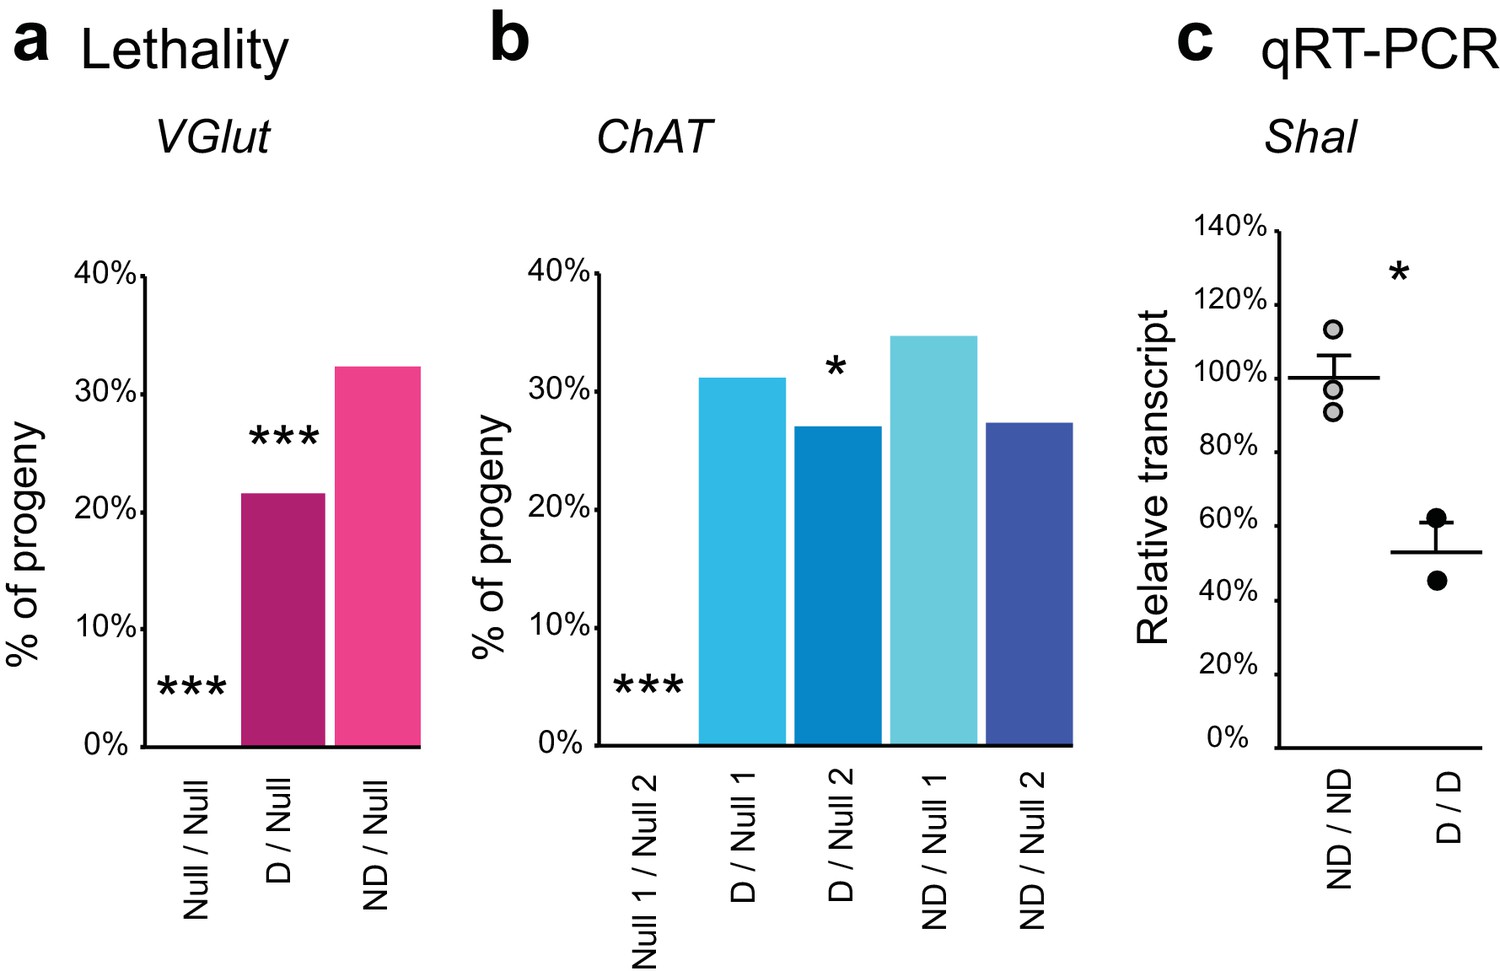
Complementation tests and qRT-PCR to test FlpStop conditional gene disruption.
(a and b) Genetic interactions between FlpStop alleles and null alleles for VGlut (a) and ChAT (b) were assessed by lethality. In (a), Null is Df(2L)VGlut2. n flies = 314, 653, and 474. In (b), Null 1 is ChATl9, and Null 2 is Df(3R)ED2. n flies = 305, 395, 289, 328, and 212. FlpStop alleles are abbreviated as ND = non-disrupting and D = disrupting. Both female and male flies were scored. Significance was assessed using a one-proportion z-test against the predicted survival of 33%. (c) Relative transcript levels obtained using qRT-PCR from flies homozygous for either the non-disrupting or disrupting FlpStop alleles of Shal. Transcript levels were normalized to the mean of the ND sample. Means + 1 SEM as well as the individual sample measurements are plotted. An unpaired two-tailed Student’s t-test was applied to the raw delta Ct values to assess significance. ND: n = 3, D: n = 2 (biological replicates). *p<0.05, ***p<0.001, no mark indicates p>0.05.
Figure 3—figure supplement 2
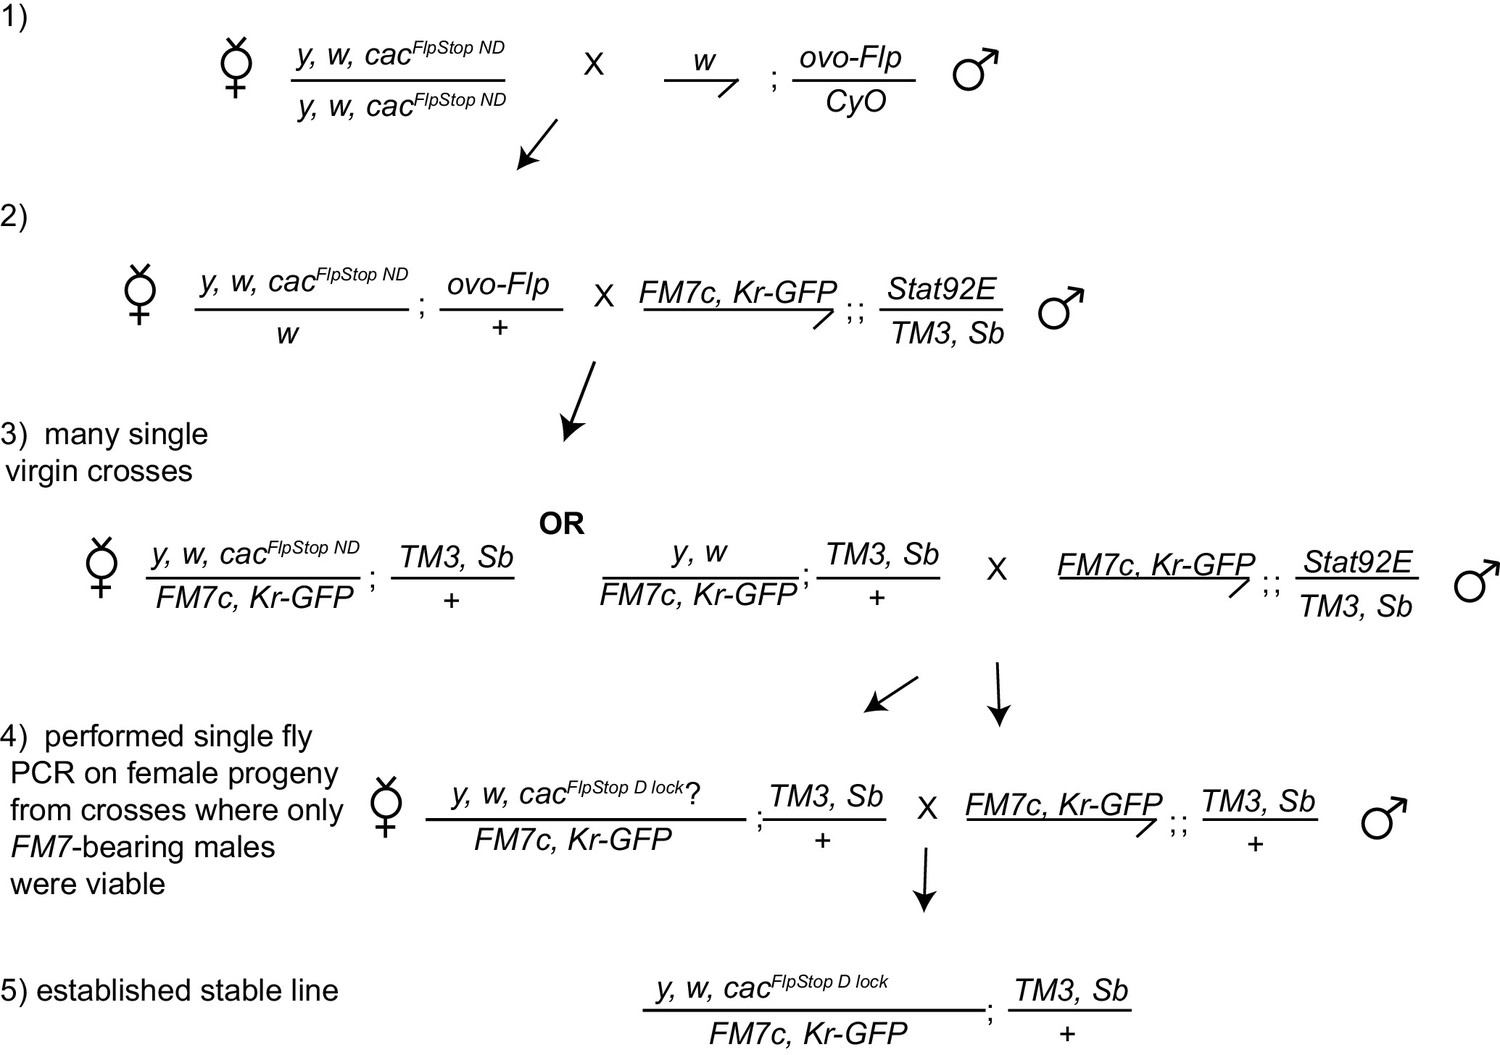
Stable germline inversion of the cacFlpStop ND allele using ovo-Flp.
The crossing scheme used to isolate stable lines containing the cac FlpStop allele inverted into the disrupting orientation from the non-disrupting orientation through expression of Flp recombinase in the germline using ovo-Flp (Flp expressed under the ovo promoter). Candidate progeny that could have undergone cassette inversion were screened, full inversion events were confirmed by PCR, and those stable lines were established.
Figure 4
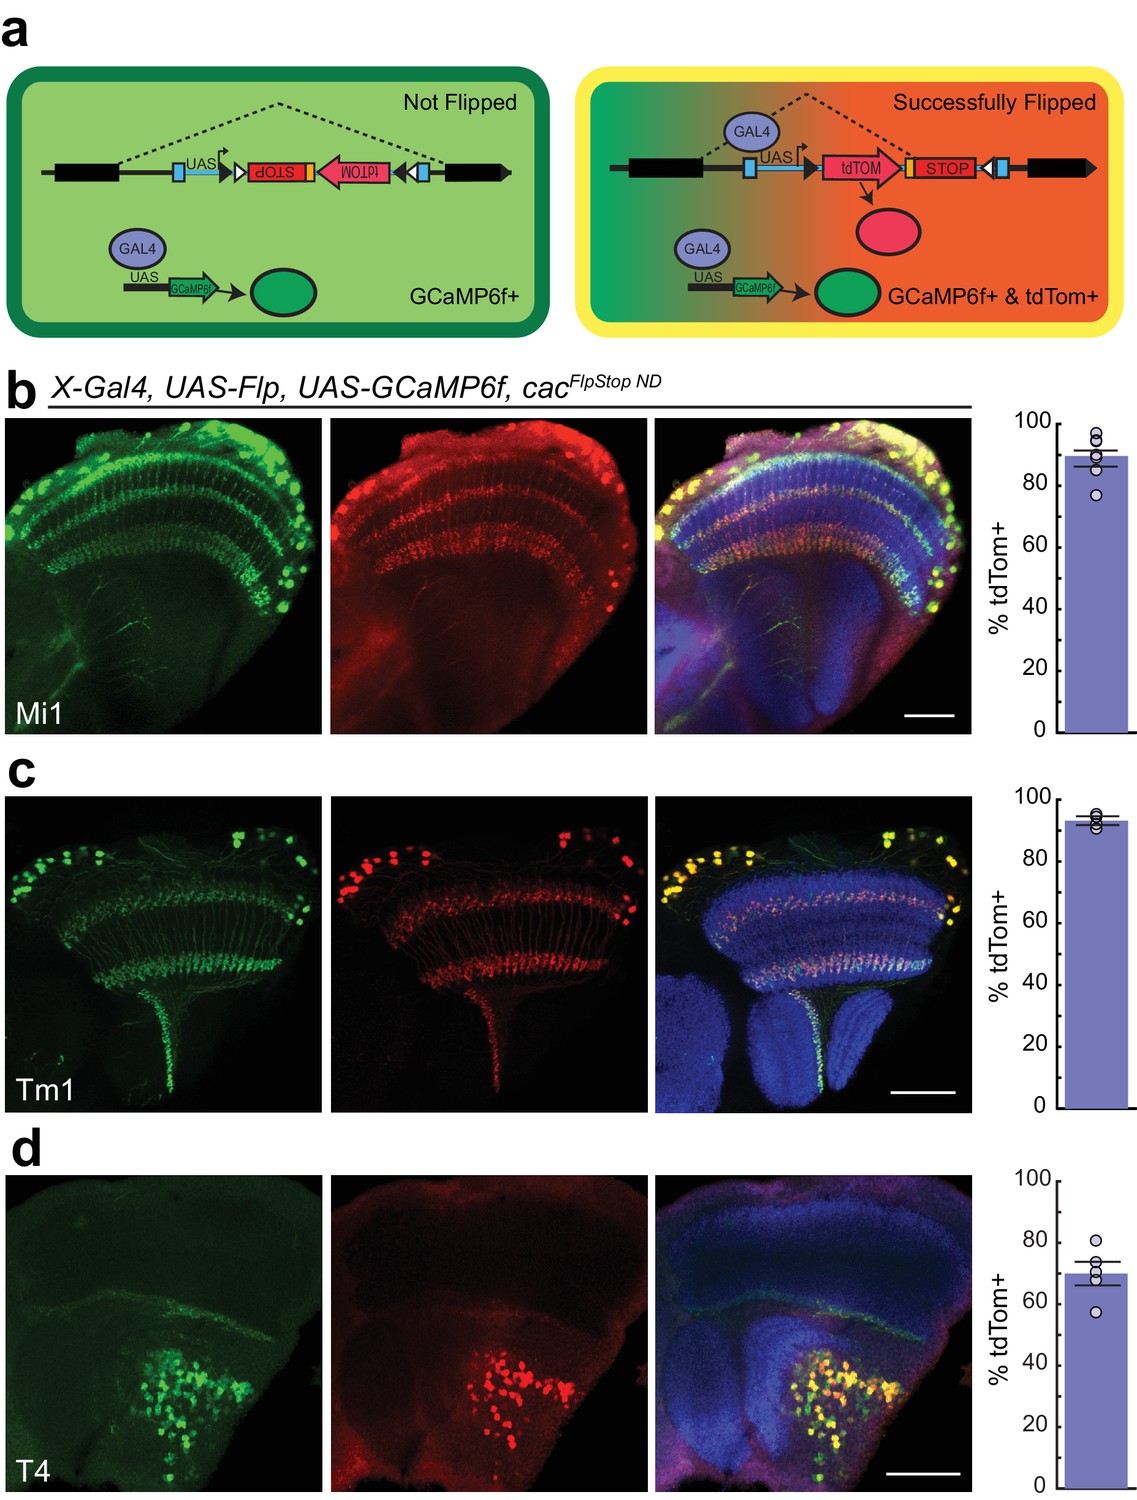
Cassette inversion is efficient across Gal4 driver lines.
(a) Schematic of the experimental logic used to test the inversion of the FlpStop cassette. The full expression pattern of the Gal4 driver line is labeled by GCaMP6f (green) while tdTomato and GCaMP6f together (yellow) label the subset of the Gal4 pattern in which Flp recombinase has inverted the cassette and has ‘Successfully Flipped’. (b–d) Confocal images of adult brains with GCaMP6f (anti-GFP, green, left), and tdTomato (anti-dsRed, red, middle), or a merge including Bruchpilot (nc82, blue, right). A bar plot displaying the percentage of GCaMP6f-positive neurons that are also labeled by tdTomato is shown on the far right. The bar is the mean, the error bars are ±1 SEM, and the dots are the values for each individually scored visual system. (b) Visual system Mi1 neurons labeled with Mi1R19F01-Gal4. Full genotype: cacFlpStopND/+; UAS-Flp/UAS-GCaMP6f; Mi1R19F01-Gal4/+. N visual systems = 7, N cells scored = 775. (c) Visual system Tm1 neurons labeled with Tm1R74G01-Gal4. Full genotype: cacFlpStopND/w; UAS-Flp/UAS-GCaMP6f; Tm1R74G01-Gal4/+. N visual systems = 4, N cells scored = 576. (d) Visual system T4 neurons labeled with T4R54A03-Gal4. Full genotype: cacFlpStopND/+; UAS-Flp/UAS-GCaMP6f; T4R54A03-Gal4/+. N visual systems = 5, N cells scored = 494. All images are maximum intensity projections of ~5–10 μm z-stacks. Scale bars are 30 μm.
Figure 5 with 1 supplement
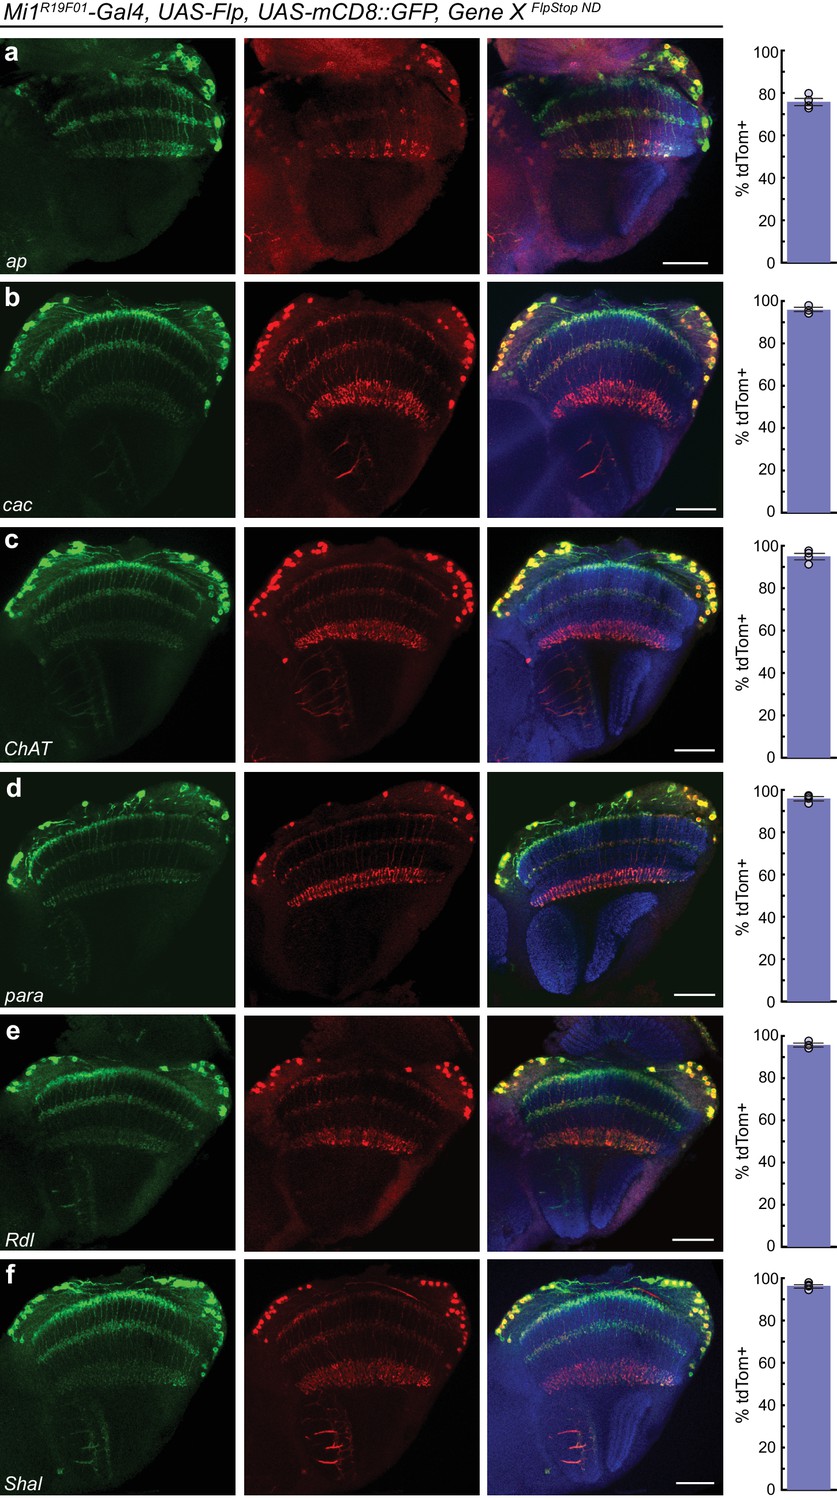
FlpStop alleles of each gene invert and express tdTomato.
(a–f) Confocal images of adult brains stained for mCD8::GFP (anti-GFP, green, left), tdTomato (anti-dsRed, red, middle), and a merge including Bruchpilot (nc82, blue, right). Mi1R19F01-Gal4 was used to drive UAS-Flp and UAS-mCD8::GFP and was combined with the non-disrupting FlpStop alleles of (a) ap, (b) cac, (c) ChAT, (d) para, (e) Rdl, and (f) Shal. All images are maximum intensity projections of ~5–10 μm z-stacks. Scale bars are 30 μm. To the right of each example confocal image, bar plots display the percentage of mCD8::GFP positive neurons that are also labeled by tdTomato. The bar is the mean, the error bars are ±1 SEM, and the dots are the values for each individually scored visual system. Sample numbers denoted as N visual systems (N cells scored) are (a) ap: 4 (906), (b) cac: 4 (714), (c) ChAT: 4 (992), (d) para: 4 (676), (e) Rdl: 4 (676), (f) Shal: 4 (1025).
Figure 5—figure supplement 1
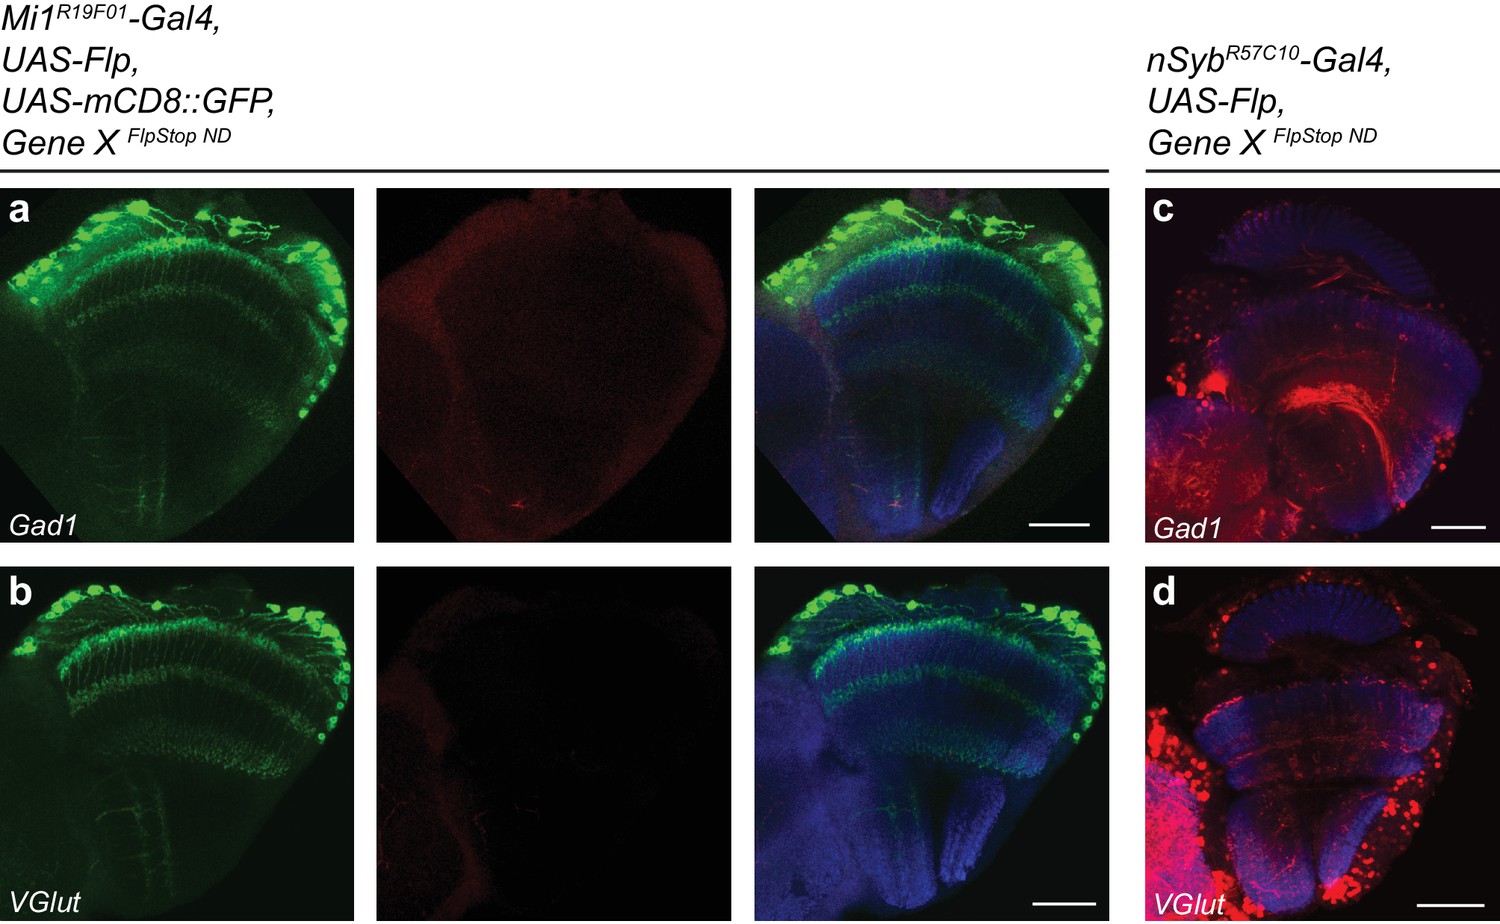
FlpStop alleles of Gad1 and VGlut invert and express tdTomato.
(a–b) Confocal images of adult brains stained for mCD8::GFP (anti-GFP, green), tdTomato (anti-dsRed, red), and Bruchpilot (nc82, blue). Mi1R19F01-Gal4 was used to drive UAS-Flp and UAS-mCD8::GFP and was combined with the non-disrupting FlpStop alleles of (a) Gad1 and (b) VGlut. (c–d) Confocal images of adult brains stained for tdTomato (red) and Bruchpilot (blue). nSybR5710-Gal4 was used to drive UAS-Flp and was combined with the non-disrupting FlpStop alleles of (c) Gad1 and (d) VGlut. All images are maximum intensity projections of ~5–10 μm z-stacks. Scale bars are 30 μm.
Figure 6
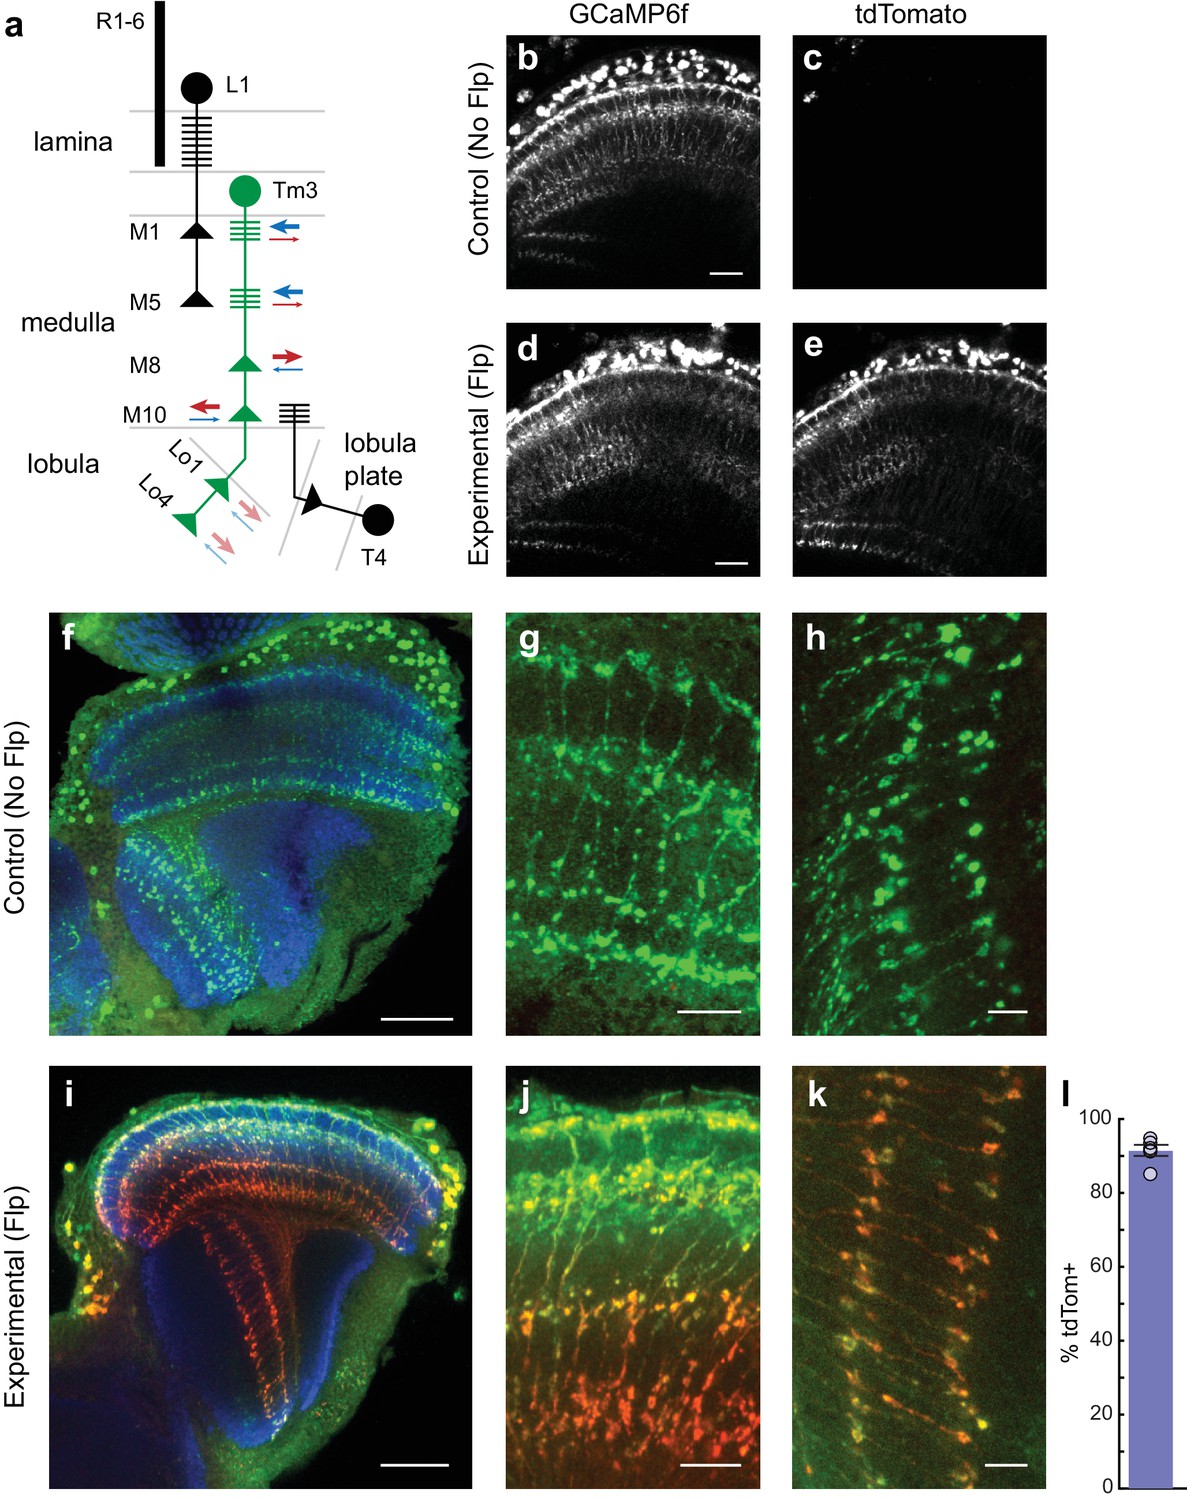
cacFlpStop ND inverts efficiently in Tm3 neurons, and cell type-specific loss of Cac does not disrupt cell morphology.
(a) Schematic of the transmedulla visual neuron Tm3 (green) and selected local circuitry. In the lamina neuropil, R1-6 photoreceptors synapse onto L1, which in turn provides input onto Tm3 in medulla layers M1 and M5. Tm3 synapses onto the direction-selective neuron T4 in layer M10. The arrows depict the relative fraction of input (blue) and output (red) synapses at each Tm3 arbor, with heavier weights indicating a larger contribution. Darker arrows represent connections identified by EM reconstruction (Takemura et al., 2013). Lighter arrows are hypothesized synaptic contributions based on Syt-HA labeling (Hasegawa et al., 2011). (b–e) In vivo expression of GCaMP6f (b and d) and tdTomato (c and e). In (b and c) a control lacking Flp (no-Flp control) is shown (full genotype: cacFlpStop ND/Y; +/UAS-GCaMP6f; Tm3 R13E12-Gal4/tubP-Gal80ts), and in (d and e) an experimental animal is shown (full genotype: cacFlpStop ND/Y; UAS-Flp/UAS-GCaMP6f; Tm3 R13E12-Gal4/tubP-Gal80ts). One-photon excitation was used. Images are maximum intensity projections of 6 μm z-stacks. Scale bars are 20 μm. (f–k) Confocal images of the visual system from no-Flp control (f–h) and experimental (i–k) flies. GCaMP6f is labeled in green (anti-GFP), tdTomato is labeled in red (anti-dsRed), and the neuropil is labeled in blue (anti-Bruchpilot). (f and i) Full optic lobes. (g and j) Tm3 arbors in medulla layers M1, M5, M8, and M10. (h and k) Arbors in lobula layers Lo1 and Lo4. Images are maximum intensity projections of ~5–10 μm z-stacks. Scale bars are 30 μm in (f and i), 10 μm in (g and j), and 5 μm in (h and k). (l) Bar plot displays the percentage of GCaMP6fpositive Tm3 neurons that are also labeled by tdTomato. The bar is the mean, the error bars are ±1 SEM, and the dots are the values for each individually scored visual system. N visual systems = 6, N cells scored = 467.
Figure 7
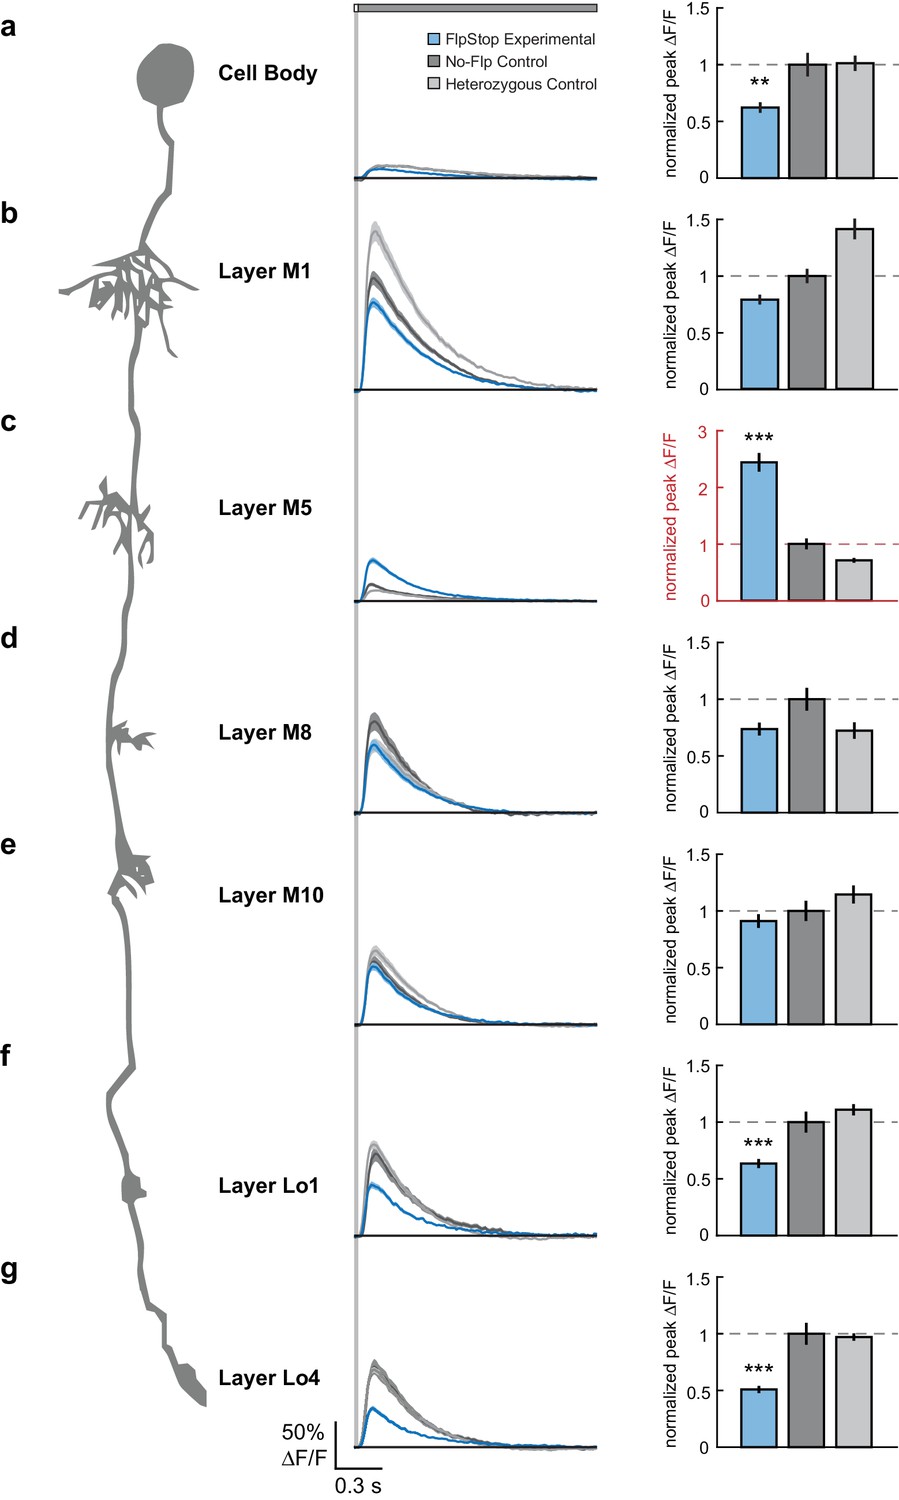
Loss of Cac from Tm3 alters visually evoked calcium signals in a compartment-specific manner.
(a–g) Left: Schematic of Tm3. Middle: calcium responses in Tm3 from experimental (blue), no-Flp control (dark gray), and heterozygous control (light gray) flies to a 25 ms light flash with a 1500 ms gray interleave, contrast = 0.5. The solid line is the mean response; the shaded region is 1 SEM. Right: Peak F/F normalized to the mean of the no-Flp control. The mean 1 SEM is plotted. Note in red the different y-axis scale in (c). **p<0.01, ***p<0.001 (Student’s two-sample t-test, Bonferroni correction for multiple comparisons). Asterisks are displayed only if the experimental condition is significantly different from both controls. If the two comparisons had different p-values, the less significant one is shown. The imaged regions were: (a) cell body (experimental: n = 26 cells, 6 flies; no-Flp control: n = 22 cells, 5 flies; heterozygous control: n = 38 cells, 6 flies); (b) layer M1 arbor (experimental: n = 58 cells, 6 flies; no-Flp control: n = 56 cells, 6 flies; heterozygous control: n = 67 cells, 6 flies); (c) layer M5 arbor (experimental: n = 75 cells, 3 flies; no-Flp control: n = 62 cells, 3 flies; heterozygous control: n = 59 cells, 3 flies), (d) layer M8 arbor (experimental: n = 63 cells, 7 flies; no-Flp control: n = 42 cells, 6 flies; heterozygous control: n = 45 cells, 7 flies), (e) layer M10 arbor (experimental: n = 71 cells, 9 flies; no-Flp control: n = 81 cells, 9 flies; heterozygous control: n = 78 cells, 9 flies), (f) layer Lo1 arbor (experimental: n = 49 cells, 7 flies; no-Flp control: n = 41 cells, 6 flies; heterozygous control: n = 67 cells, 7 flies), and (g) layer Lo4 arbor (experimental: n = 44 cells, 5 flies; no-Flp control: n = 39 cells, 6 flies; heterozygous control: n = 67 cells, 7 flies). 9 flies were imaged for each genotype; multiple regions were imaged in each fly. The full genotypes are: experimental: cacFlpStop ND/Y; UAS-Flp/UAS-GCaMP6f; Tm3 R13E12-Gal4/tubP-Gal80ts; no-Flp control: cacFlpStop ND/Y; +/UAS-GCaMP6f; Tm3 R13E12-Gal4/tubP-Gal80ts; and heterozygous control: cacFlpStop ND/ w; UAS-Flp/UAS-GCaMP6f; Tm3 R13E12-Gal4/tubP-Gal80ts.
-
Figure 7—source data 1
Table of exact p-values.
All statistical tests were two-sample Student’s t-tests, Bonferroni correction for multiple comparisons.
- https://doi.org/10.7554/eLife.22279.018
Tables
Table 1
Collection of genes targeted by the FlpStop approach.
| Symbol | Gene | Function | MiMIC insertion | Location of intronic insert | Phenotype | Non-disrupting allele has phenotype? | Disrupting orientation recapitulates null phenotype*? | Substantial loss of mRNA or protein? | Tested FlpStop alleles |
|---|---|---|---|---|---|---|---|---|---|
| ap | apterous | Transcription factor, wing development | MI01996 | Between exons 4 and 5 | Wingless | No | Yes – wing loss | Yes – staining | apFlpStop ND, apFlpStop D |
| cac | cacophony | Voltage-gated Ca2+ channel α-subunit | MI02836 | Between exons 20 and 21 | Lethal, heat paralysis with cacTS2 | No | Yes – lethality and heat paralysis | Yes – qRT-PCR | cacFlpStop ND, cacFlpStop D lock |
| ChAT | Choline acetyltransferase | Acetylcholine synthesis | MI04508 | Between exons 3 and 4 | Lethal | No | No | N/A | ChATFlpStop ND, ChATFlpStop D |
| Gad1 | Glutamic acid decarboxylase 1 | GABA synthesis | MI09277 | Between exons 4 and 5 | Lethal | No | Yes – lethality | Yes – qRT-PCR | Gad1FlpStop ND, Gad1FlpStop D |
| para | paralytic | Voltage-gated Na+ channel α-subunit | MI08578 | Between exons 3 and 4 | Lethal, heat paralysis with parats1 | No | Yes – lethality and heat paralysis | Yes – qRT-PCR | paraFlpStop ND, paraFlpStop D |
| Rdl | Resistant to dieldrin | GABAA receptor α-subunit | MI02620 | Between exons 6 and 7 | Lethal | No | Yes – lethality | Yes – qRT-PCR | RdlFlpStop ND, RdlFlpStop D |
| Shal | Shaker cognate l | Voltage-gated K+ channel | MI00446 | Between exons 2 and 3 | None | No | N/A | Yes, 50% mRNA reduction – qRT-PCR | ShalFlpStop ND, ShalFlpStop D |
| VGlut | Vesicular glutamate transporter | Glutamate packaging | MI04979 | Between exons 3 and 4 | Lethal | No | No, subviable (Hypomorph) | N/A | VGlutFlpStop ND, VGlutFlpStop D |
-
* Measured using complementation testing.
-
See Figure 3—figure supplement 2 for a description of the creation of the cacFlpStop D lock allele.
Additional files
-
Supplementary file 1
GenBank file of the full sequence of pFlpStop-attB-UAS-2.1-tdTom.
- https://doi.org/10.7554/eLife.22279.019
-
Supplementary file 2
GenBank file of the full sequence of pFlpStop-HDR-UAS-2.1-tdTom.
- https://doi.org/10.7554/eLife.22279.020
Download links
A two-part list of links to download the article, or parts of the article, in various formats.
Downloads (link to download the article as PDF)
Open citations (links to open the citations from this article in various online reference manager services)
Cite this article (links to download the citations from this article in formats compatible with various reference manager tools)
FlpStop, a tool for conditional gene control in Drosophila
eLife 6:e22279.
https://doi.org/10.7554/eLife.22279


