Ezrin activation by LOK phosphorylation involves a PIP2-dependent wedge mechanism
- Cornell University, United States
- Harvard Medical School, United States
Figures
Figure 1 with 1 supplement
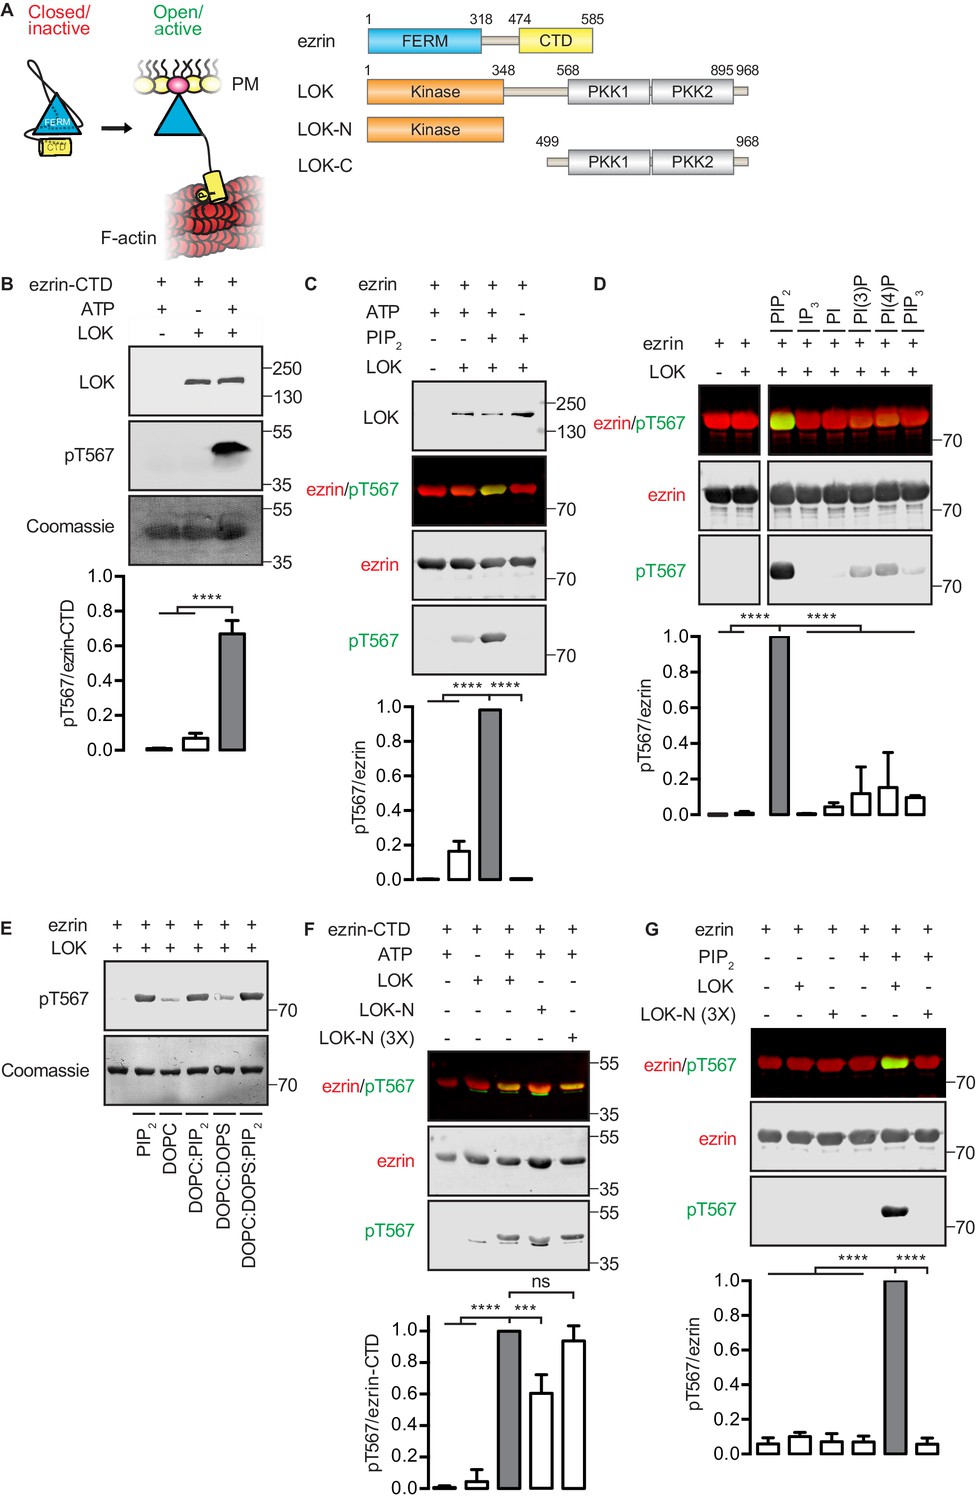
In vitro phosphorylation of full-length ezrin requires PIP2 and LOK C-terminal domain.
(A) Left panel: A cartoon illustration of cytoplasmic closed/inactive ezrin versus membrane-tethered open/active ezrin acting as crosslinker between the plasma membrane (PM) and the cytoskeletal F-actin. Right panel: The domain structure of ezrin and LOK constructs used in this study. The numbers indicate amino acids residues at protein domain boundaries. (B) In vitro kinase assay showing that 10 nM LOK phosphorylates 18 µM ezrin-CTD. Data are presented as mean ± SE, n = 3, two-way ANOVA (See also Figure 1—source data 1), ****p<0.0001. (C) In vitro kinase assay showing LOK-mediated phosphorylation of full-length ezrin in presence of 90 µM of PIP2 micelles. Data are presented as mean ± SE, n = 3, two-way ANOVA (See also Figure 1—figure supplement 1 and Figure 1—source data 1), ****p<0.0001. (D) In vitro kinase assay showing that 18 µM ezrin is specifically primed by 90 µM of PIP2 micelles and not by IP3 or other phospholipids at 90 µM concentrations. Blots are derived from same membrane. Data are presented as mean ± SE, n = 3, two-way ANOVA (See also Figure 1—source data 1), ****p<0.0001. (E) In vitro kinase assay showing that unilamellar liposomes DOPC:PIP2 (90 mol% DOPC, 10% PIP2) or DOPC:DOPS:PIP2 (80 mol% DOPC, 10 mol% DOPS, 10 mol% PIP2) promote phosphorylation of 18 µM ezrin by 10 nM LOK, whereas DOPC (100 mol% DOPC) or DOPC:DOPS (70 mol% DOPC, 30 mol% DOPS) fail to promote LOK-mediated ezrin phosphorylation. (F–G) 10 nM LOK-N phosphorylates 18 µM ezrin-CTD but not full-length ezrin in presence of 90 µM PIP2. Data are presented as mean ± SE, n = 3, two-way ANOVA (See also Figure 1—source data 1), ***p<0.0002, ****p<0.0001. Total ezrin is shown in red and phosphorylation of T567 in green in dual color Western blots.
-
Figure 1—source data 1
Experimental replicates for Figure 1B,C, D, F and G.
- https://doi.org/10.7554/eLife.22759.003
Figure 1—figure supplement 1
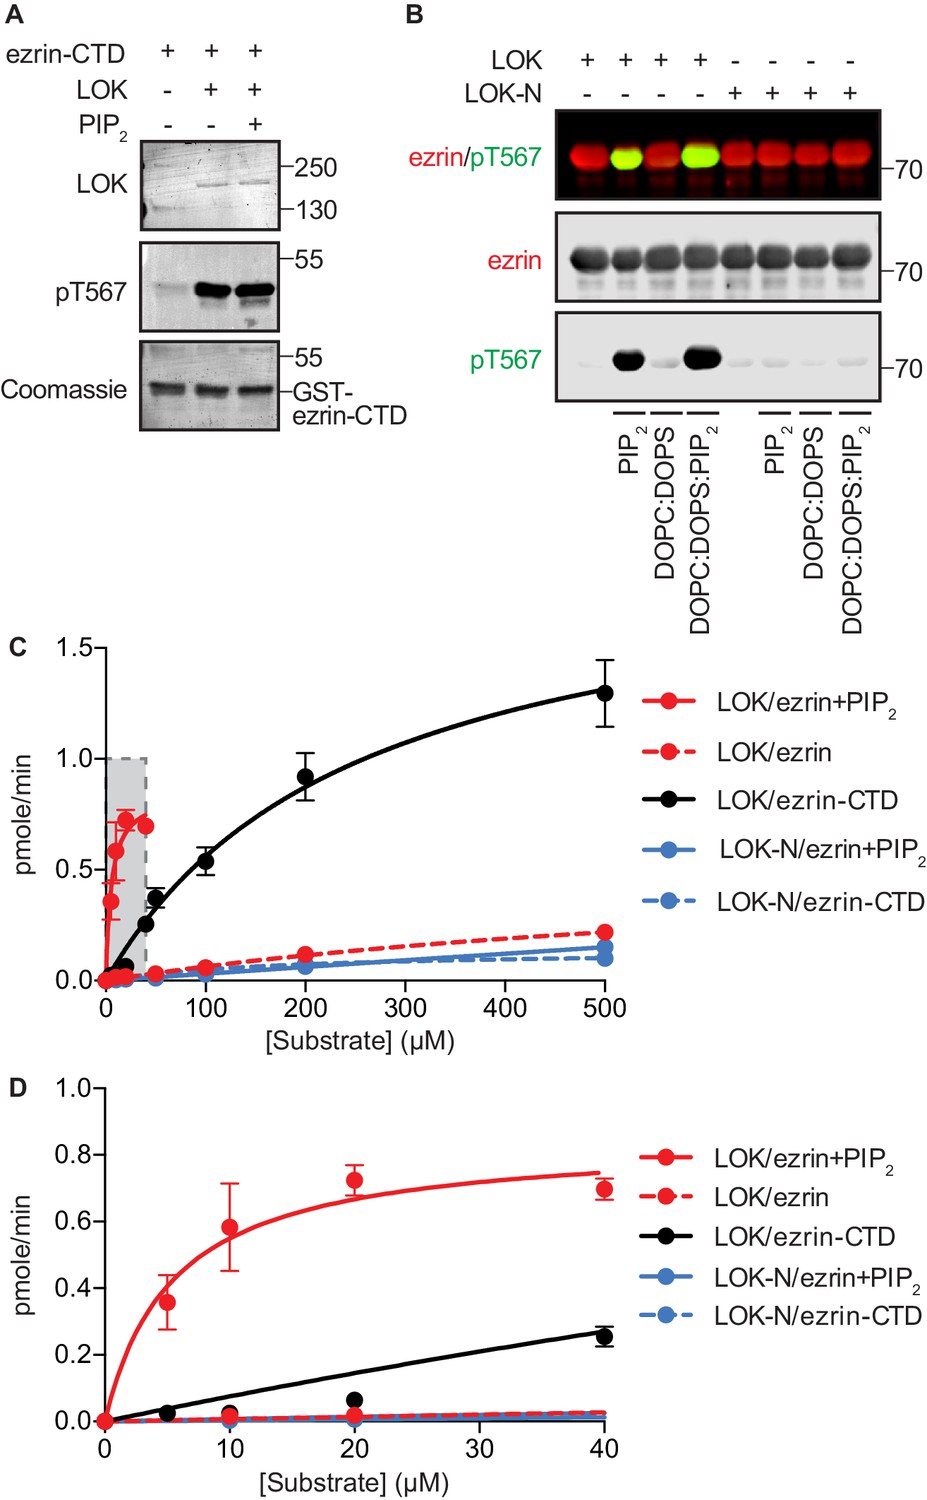
Phosphorylation of full-length ezrin by full-length LOK requires PIP2 micelles or PIP2-containing liposomes.
(A) 10 nM LOK phosphorylates 18 µM ezrin-CTD regardless of the presence of 90 µM PIP2. (B) 10 nM LOK requires 90 µM PIP2 micelles or 1 mM DOPC:DOPS:PIP2 unilamellar liposomes containing 10 mol% PIP2 (DOPC:DOPS:PIP2) for phosphorylation of 18 µM ezrin. 10 nM LOK-N cannot phosphorylate 18 µM ezrin in presence of PIP2 micelles or DOPC:DOPS:PIP2. Total ezrin is shown in red and phosphorylation of T567 in green in dual color western blots. (C) Michaelis-Menten curves of kinase-substrate pairs showing that PIP2 and LOK-C render full-length ezrin an optimal substrate for LOK kinetics. The shaded region (0–40 µM substrate) is enlarged in (D). Data are represented as mean ± SE, n = 3 (See also Table 1 and Table 1—source data 1).
Figure 2 with 1 supplement

The central α-helical coiled coil hairpin region of ezrin is required for PIP2-dependent phosphorylation.
(A) Crystal structure of the ERM protein Sfmoesin (PDB: 2I1K) in a closed/inactive state. Lobes F1-3 represent the lobes in FERM domain (blue). The α-helical coiled coil hairpin is shown in gray. An acidic linker region (gray) of the hairpin occupies a PIP2-binding site (pink), embedded between F1 and F3 lobes. T567 represents the position of ezrin T567 superimposed on Sfmoesin-CTD (yellow). This residue is masked in this closed state. (B) 10 nM LOK and 10 nM LOK-N phosphorylate 18 µM GST-ezrin-CTD, but both LOK and LOK-N fail to phosphorylate 18 µM of a GST-ezrin-CTD+FERM complex in absence or presence of 90 µM PIP2. Phosphorylation of GST-ezrin-CTD was detected with pT567 antibody. Total protein was visualized using Coomassie.
Figure 2—figure supplement 1

GST-ezrin-CTD+FERM complex, lacking the central α-helix region, is not phosphorylated in presence of PIP2 micelles or PIP2-containing liposomes.
10 nM LOK phosphorylates 18 µM GST-ezrin-CTD independent of PIP2 micelles, DOPC:DOPS or DOPC:DOPS:PIP2 unilamellar liposomes, but 10 nM LOK fails to phosphorylate GST-ezrin-CTD+FERM primed with PIP2 micelles or DOPC:DOPS:PIP2 unilamellar liposomes. Phosphorylation of GST-ezrin-CTD was detected with pT567 antibody. Total protein was visualized using Coomassie.
Figure 3
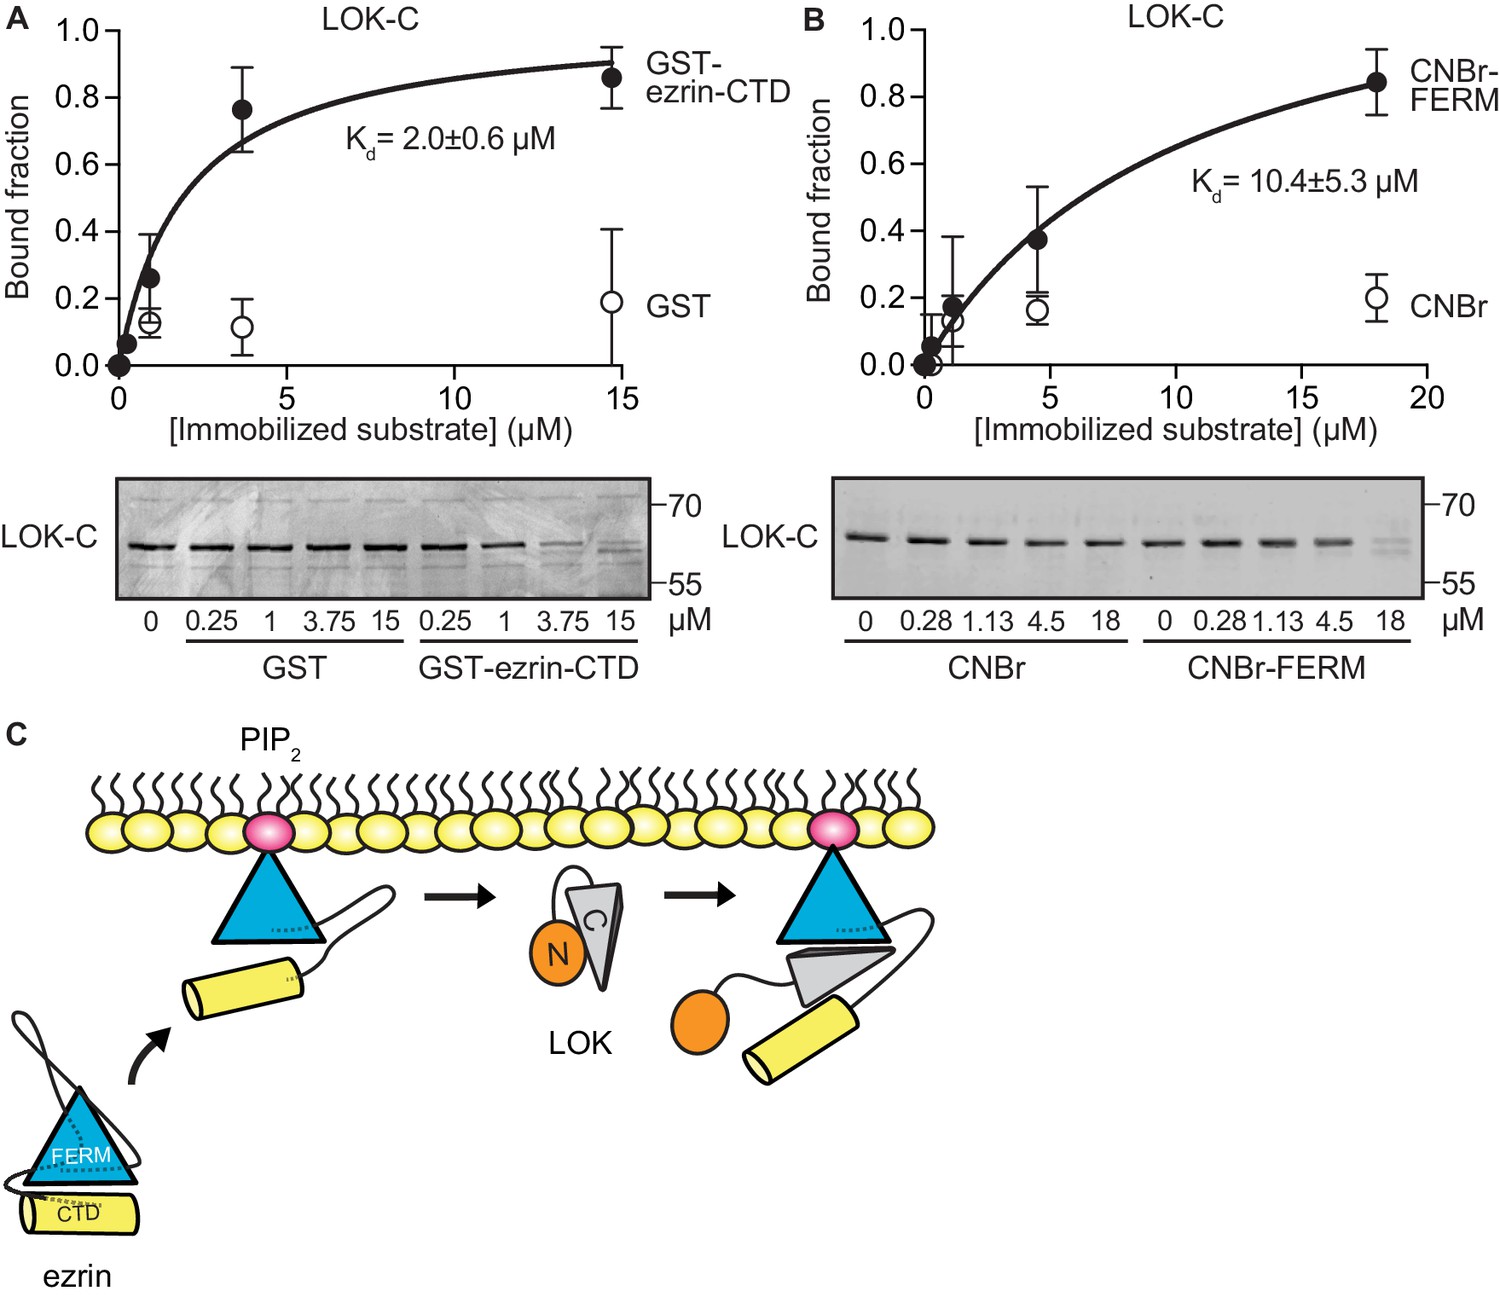
LOK C-terminal domain binds both ezrin FERM and C-terminal domains.
(A) A binding curve for binding of 0–15 µM immobilized GST-ezrin-CTD to 200 nM LOK-C at Kd = 2.0 ± 0.6 µM. Bottom panel depicts representative experiment and Coomassie staining of unbound fraction of LOK-C. Data are represented as mean ± SE, n = 3 (See also Figure 3—source data 1). (B) Binding curve for binding of 0–18 µM immobilized CNBr-FERM to 200 nM LOK-C at Kd = 10.4 ± 5.3 µM. Bottom panel depicts representative experiment and Coomassie staining of unbound fraction of LOK-C. Data are represented as mean ± SE, n = 3 (See also Figure 3—source data 1). (C) A model of LOK-C acting as a wedge that pries open FERM and ezrin-CTD in a PIP2-primed ezrin molecule.
-
Figure 3—source data 1
Analysis for binding curves in Figure 3A–B.
- https://doi.org/10.7554/eLife.22759.010
Figure 4 with 1 supplement
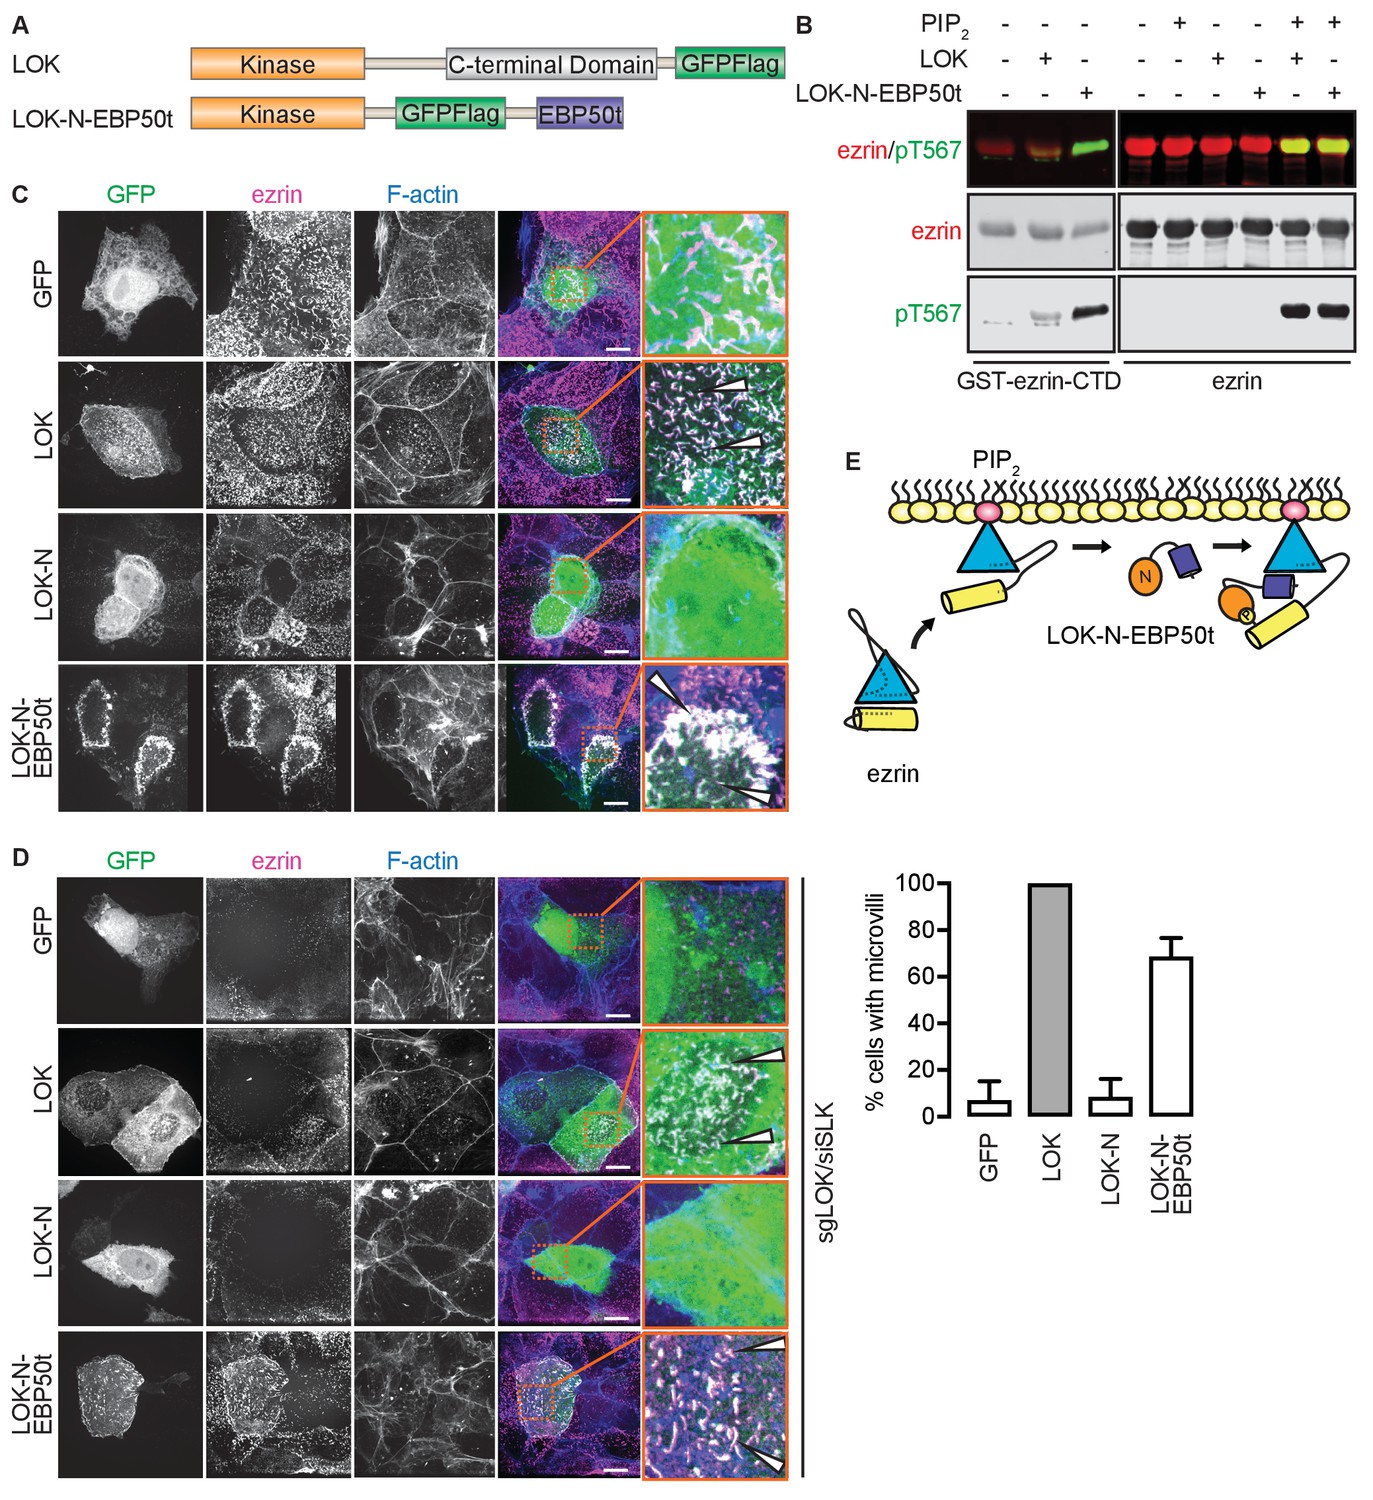
The tail of EBP50 compensates for lack of LOK C-terminus in PIP2-dependent ezrin phosphorylation.
(A) A schematic protein domain comparison of full-length LOK fused to GFP-Flag tag (green) and LOK-N fused to EBP50 tail (purple) via an internal GFP-Flag tag. (B) In vitro kinase assay showing that 10 nM LOK and 10 nM LOK-N-EBP50t both phosphorylate 18 µM ezrin-CTD, but only phosphorylate 18 µM ezrin in presence of 90 µM PIP2. Total ezrin is shown in red and phosphorylation of T567 in green in dual color western blots. (C) Maximum projections of wild type JEG-3 cells overexpressing GFP, and GFP fusions of LOK, LOK-N or LOK-N-EBP50t (green) show that LOK and LOK-N-EBP50t are targeted to microvilli, while GFP and LOK-N are cytoplasmic. Ezrin in magenta. F-actin in blue. Insets represent area within dotted boxes. Arrows indicate microvilli. Scale bars, 10 µm. (D) Representative maximum projections of ERM kinase-suppressed sgLOK/siSLK JEG-3 cells overexpressing GFP, and GFP fusions of LOK, LOK-N or LOK-N-EBP50t (green) show that LOK and LOK-N-EBP50t rescue microvilli, while GFP and LOK-N failed to rescue microvilli. Ezrin in magenta. F-actin in blue. Insets represent area within dotted boxes. Arrows indicate microvilli. Scale bars, 10 µm. Bar graph shows quantification of confocal images. Data are represented as mean ± SE, n = 3. (See also Figure 4—source data 1) (E) A model depicting how LOK-N-EBP50t binding to FERM in PIP2-primed ezrin resembles the wedging of ezrin by LOK-C prior to phosphorylation of T567.
-
Figure 4—source data 1
Source data for quantification of microvilli in Figure 4D and Figure 4—figure supplement 1B.
- https://doi.org/10.7554/eLife.22759.012
Figure 4—figure supplement 1

LOK-N-EBP50t rescues ezrin phosphorylation in kinase-suppressed JEG-3 cells.
(A) A western blot showing that ezrin phosphorylation is suppressed in sgLOK/siSLK JEG-3 cells. Data are represented as mean ± SE, n = 3. (B) Representative maximum projections showing that microvilli formation is suppressed in sgLOK/siSLK JEG-3 cells. Ezrin in green. F-actin in gray. Insets represent area within dotted boxes. Scale bars, 10 µm. Bar graph shows quantification of confocal images. Data are represented as mean ± SE, n = 3. (See also Figure 4—source data 1). (C) Western blot showing that LOK-N-EBP50t restores ezrin phosphorylation in sgLOK/siSLK JEG-3 cells. Total ezrin is shown in red and phosphorylation of T567 in green in dual color western blots. Data are represented as mean ± SE, n = 3, two-way ANOVA, *p=0.0332, **=0.0021, ***p=0.0002.
Figure 5
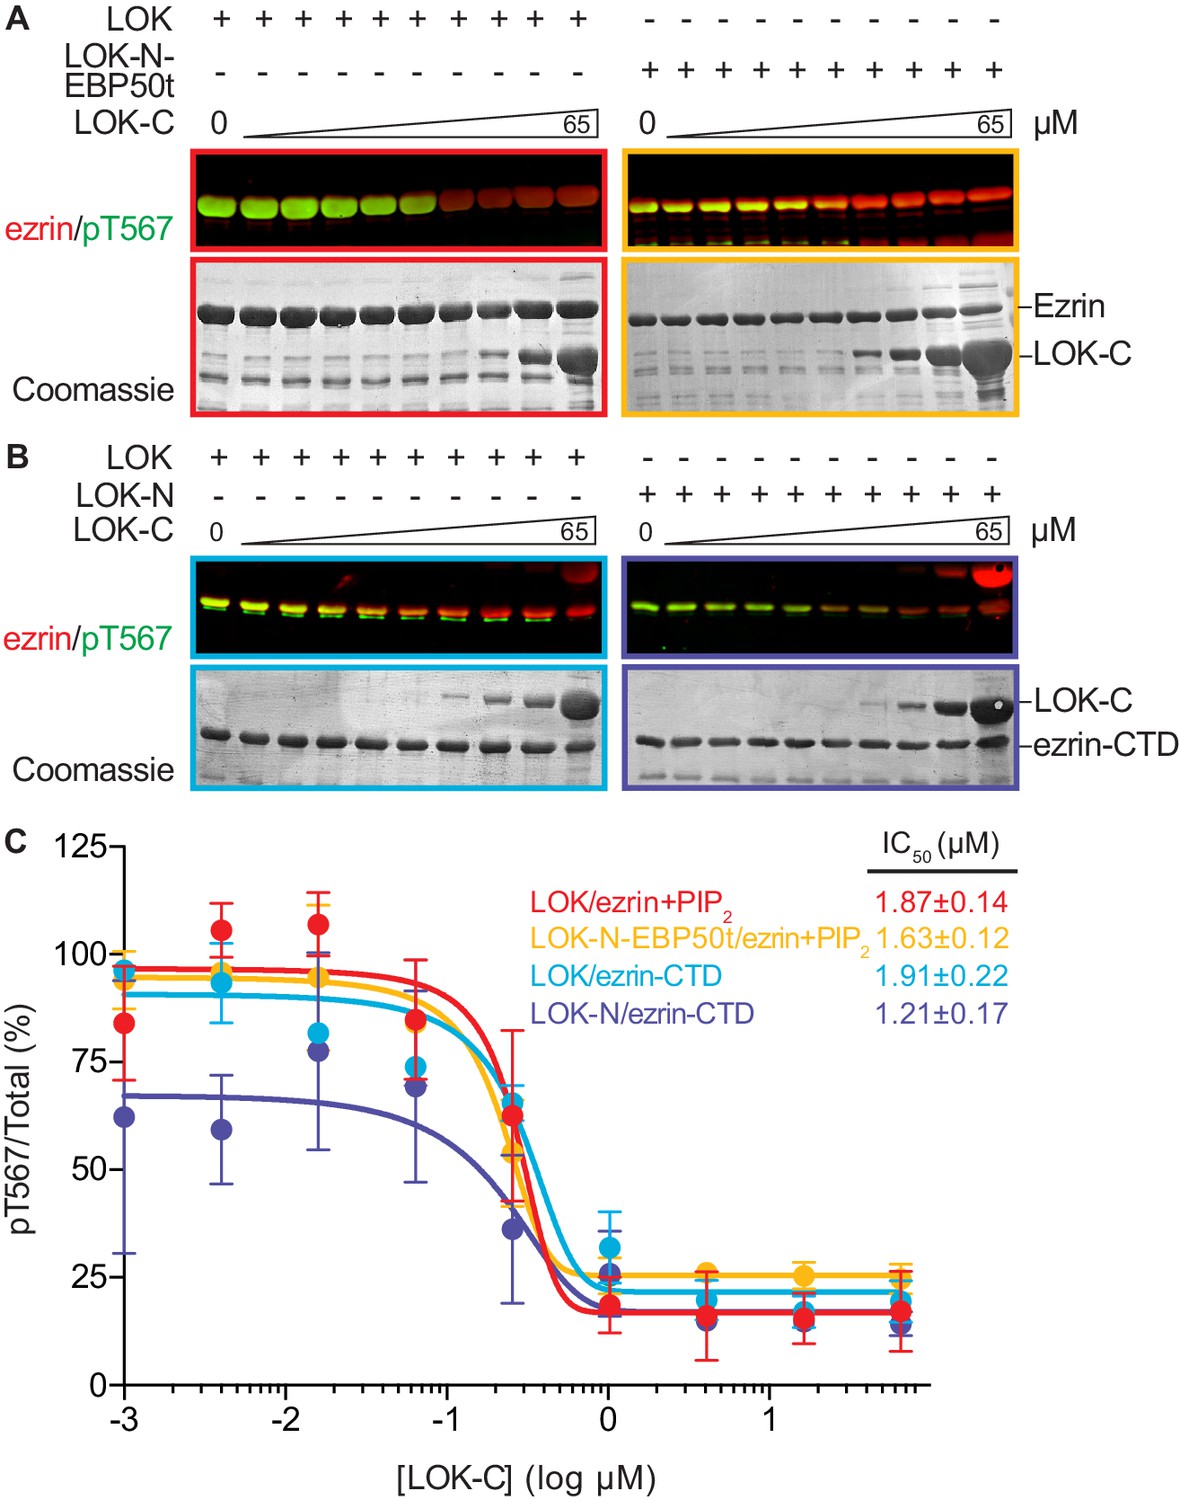
LOK C-terminus is a regulatory domain that inhibits the LOK kinase domain.
(A) In vitro kinase assay showing that LOK-C (0–65 µM) inhibits phosphorylation of 18 µM ezrin phosphorylation by 10 nM LOK (red panel) and 10 nM LOK-N-EBP50t (yellow panel) in presence of 90 µM PIP2. (B) In vitro kinase assay showing that LOK-C (0–65 µM) inhibits LOK-mediated phosphorylation of 18 µM ezrin-CTD (blue panel), and LOK-N-mediated phosphorylation of 18 µM ezrin-CTD (purple panel). Total ezrin is shown in red and phosphorylation of T567 in green in dual color western blots. (C) Inhibition curves of LOK/ezrin+PIP2 (red), LOK-N-EBP50t/ezrin+PIP2 (yellow), LOK/ezrin-CTD (blue), and LOK-N/ezrin-CTD (purple), with their corresponding IC50-values. Data are represented as mean ± SE, n = 2 (see also Figure 5—source data 1).
-
Figure 5—source data 1
Data summary and analysis for Figure 5C, based on experimental replicates represented in Figure 5A–B.
- https://doi.org/10.7554/eLife.22759.015
Figure 6
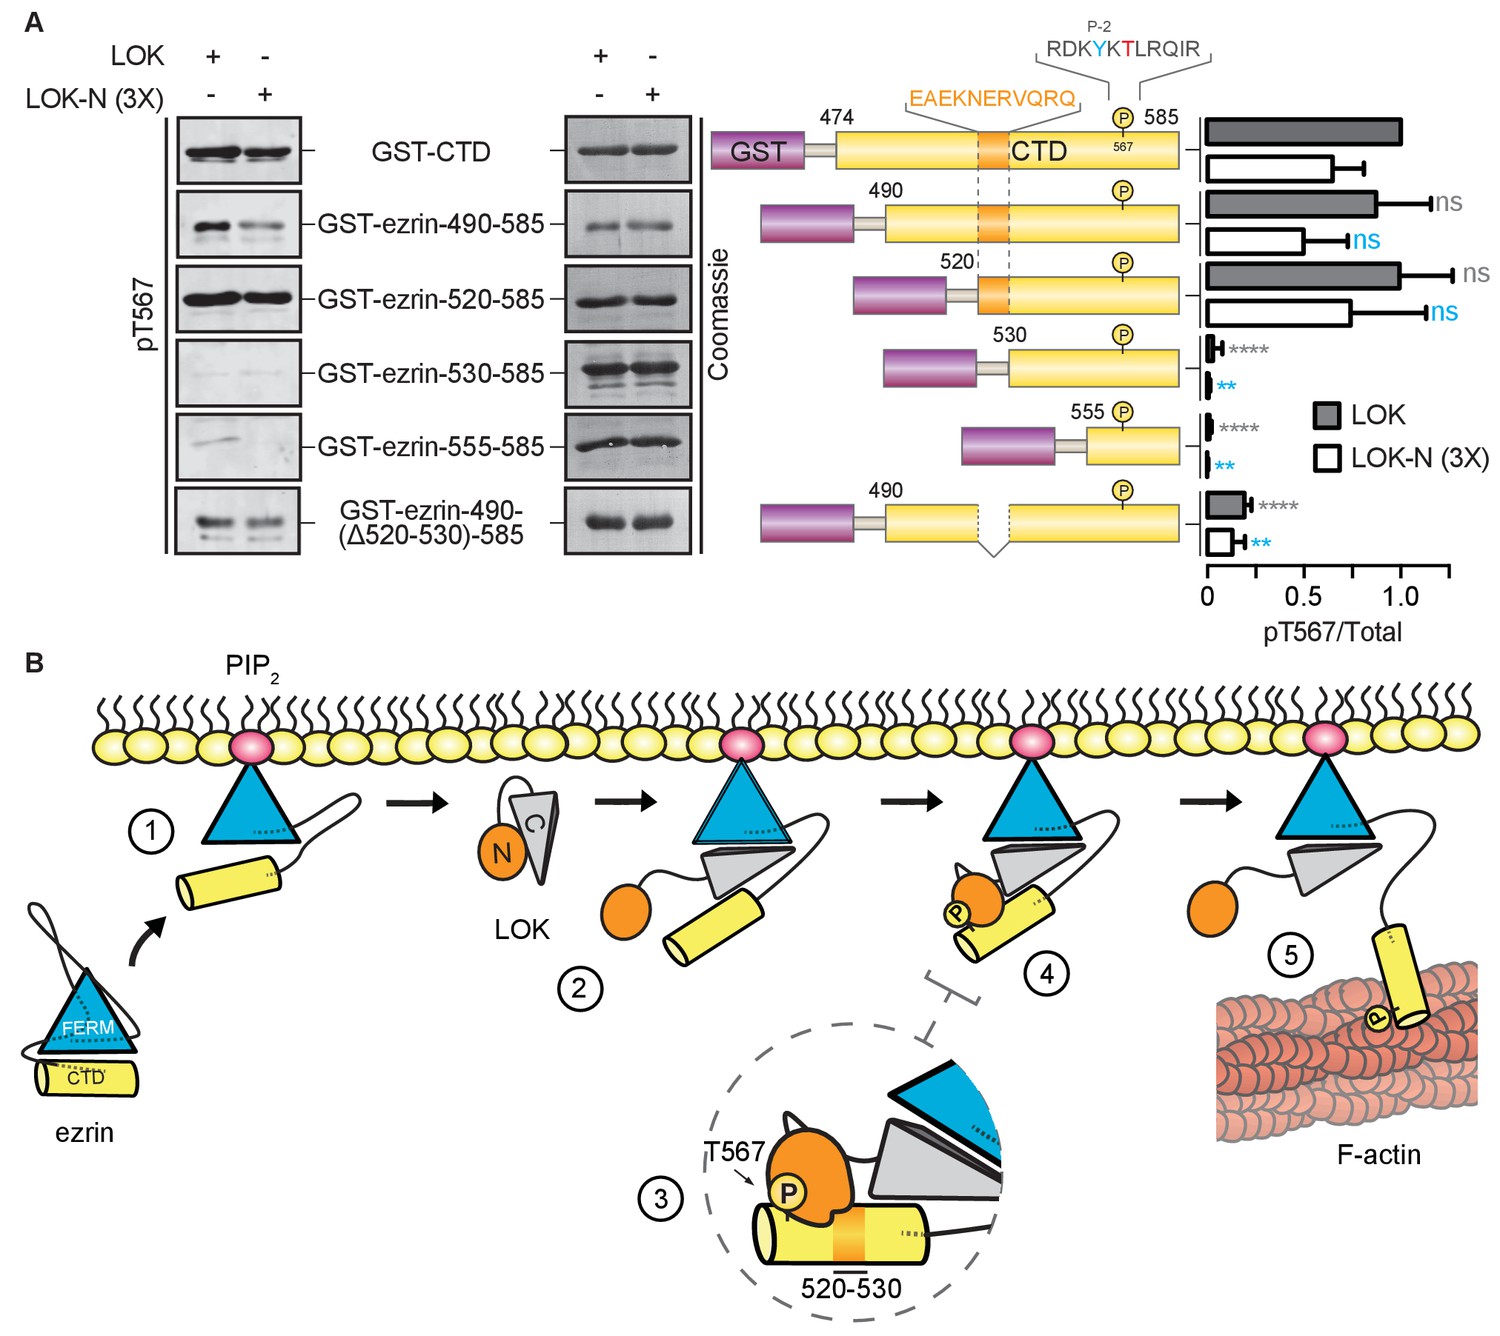
LOK kinase domain recognizes a docking site distal to T567 phosphorylation site.
(A) In vitro kinase assay showing that 10 nM LOK and 30 nM LOK-N phosphorylate GST-ezrin-CTD, and the truncations GST-ezrin-490–585 and GST-ezrin-520–585. Phosphorylation decreases in the truncations GST-ezrin-530–585, GST-ezrin-555–585 and GST-ezrin-490(Δ520–530)−585. All substrate concentrations were 18 µM. Schematic illustration of GST-ezrin-CTD and truncations shows the distal docking site in orange letters and box. LOK kinase consensus sequence is shown in black, in which the T567 phosphorylation site is in red letters and the conserved Y565 is in blue letters. Data are represented as mean ± SE, n = 3, two-way ANOVA (See also Figure 6—source data 1), **p<0.0021, ****p<0.0001. (B) A working model depicting the proposed coincidence detection mechanism for ezrin phosphorylation. (1) Ezrin is recruited to PIP2 and primed for phosphorylation. (2) Autoinhibition of LOK is relieved as LOK-C wedges in between FERM and ezrin-CTD. (3) LOK-N binds to distal docking site on ezrin-CTD and, (4) phosphorylates T567. (5) LOK remains tethered to activated ezrin, allowing phosphorylation of microvillar ezrin in a positive feedback loop.
-
Figure 6—source data 1
Experimental replicates for Figure 6A.
- https://doi.org/10.7554/eLife.22759.017
Author response image 1
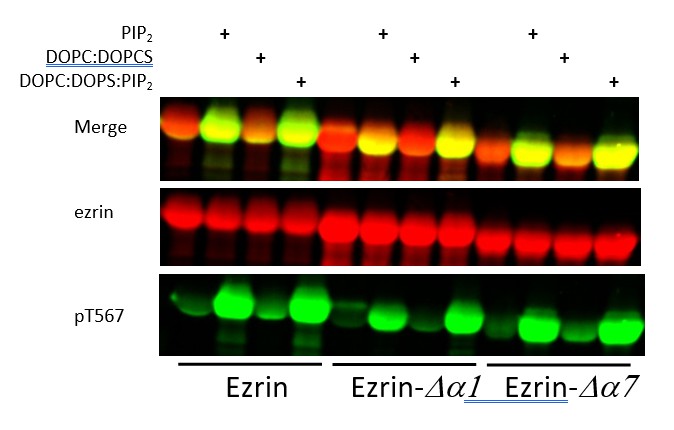
Full length LOK can phosphorylate ezrin, ezrin ∆α1 and ezrin ∆α7 in a PIP2-dependent manner.
Full length LOK (10nM) was incubated with 18µM ezrin or ezrin variant and ATP for 10 min at 37°. Samples were resolved by SDS-PAGE and blotted for ezrin (red) and pT567 (green).
Author response image 2
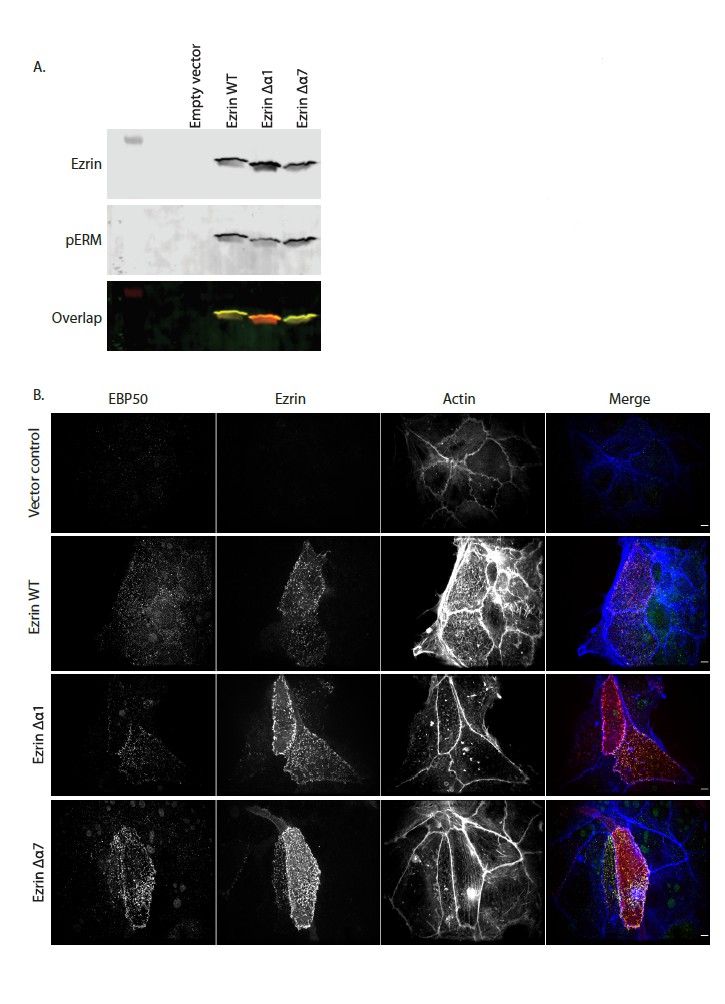
(A) In vivo kinase assay showing that Ezrin WT, Ezrin Δα1 and Ezrin Δα7 are phosphorylated in Ezrin/Radixin deleted cells. Cells were transfected with pQCXIP empty (Empty vector), pQCXIP-Ezrin WT, pQCXIP-Ezrin Δα1 or pQCXIP- Ezrin Δα7. After 24 hr, cells were lysed in 2X sample buffer. Samples are then resolved by SDS-PAGE and analyzed by immunoblotting. Total ezrin is showed in red and phosphorylation of T567 in green in dual color western blots. (B) Maximum projections of Ezrin/Radixin deleted cells showing that Ezrin WT, Ezrin Δα1 and Ezrin Δα7 can rescue microvilli. Cells were transfected with pQCXIP empty (vector control), pQCXIP-Ezrin WT, pQCXIP-Ezrin Δα1 or pQCXIP- Ezrin Δα7. After 24hrs, cells are fixed then stained using phalloidin 660 and antibodies against EBP50 and Ezrin.
Tables
Table 1
A comparison of the kinetic constants for kinase-substrate pairs based on 32P incorporation. Concentration of kinase in each experiment was 10 nM. Data are represented as mean ± SE, n = 3 (See also Figure 1—figure supplement 1C–D and Table 1—source data 1).
| Kinase/Substrate | Kma (µM) | Vmax (pmole×min−1) | kcata (min−1) | kcat/Km (µM−1×min−1) |
|---|---|---|---|---|
| LOK/ezrin + PIP2 | 5.5 ± 1.6 | 0.85 ± 0.07 | 8.5 ± 0.7 | 1.56 |
| LOK/ezrin | 782 ± 197 | 0.56 ± 0.10 | 5.6 ± 1.0 | 0.01 |
| LOK/ezrin-CTD | 252 ± 27 | 1.98 ± 0.16 | 19.8 ± 1.4 | 0.08 |
| LOK-N/ezrin-CTD | 176 ± 30 | 0.14 ± 0.01 | 1.4 ± 0.1 | 0.01 |
-
aKm and kcat were calculated using equations 1 and 2.
-
Table 1—source data 1
Data summary and analysis for Table 1, based on Figure 1—figure supplement 1C–D.
- https://doi.org/10.7554/eLife.22759.008
Download links
A two-part list of links to download the article, or parts of the article, in various formats.
Downloads (link to download the article as PDF)
Open citations (links to open the citations from this article in various online reference manager services)
Cite this article (links to download the citations from this article in formats compatible with various reference manager tools)
Ezrin activation by LOK phosphorylation involves a PIP2-dependent wedge mechanism
eLife 6:e22759.
https://doi.org/10.7554/eLife.22759


