Tsc2 disruption in mesenchymal progenitors results in tumors with vascular anomalies overexpressing Lgals3
- Uniformed Services University of the Health Sciences, United States
- National Heart, Lung, and Blood Institute, National Institutes of Health, United States
- National Institutes of Health, United States
Figures
Figure 1 with 1 supplement
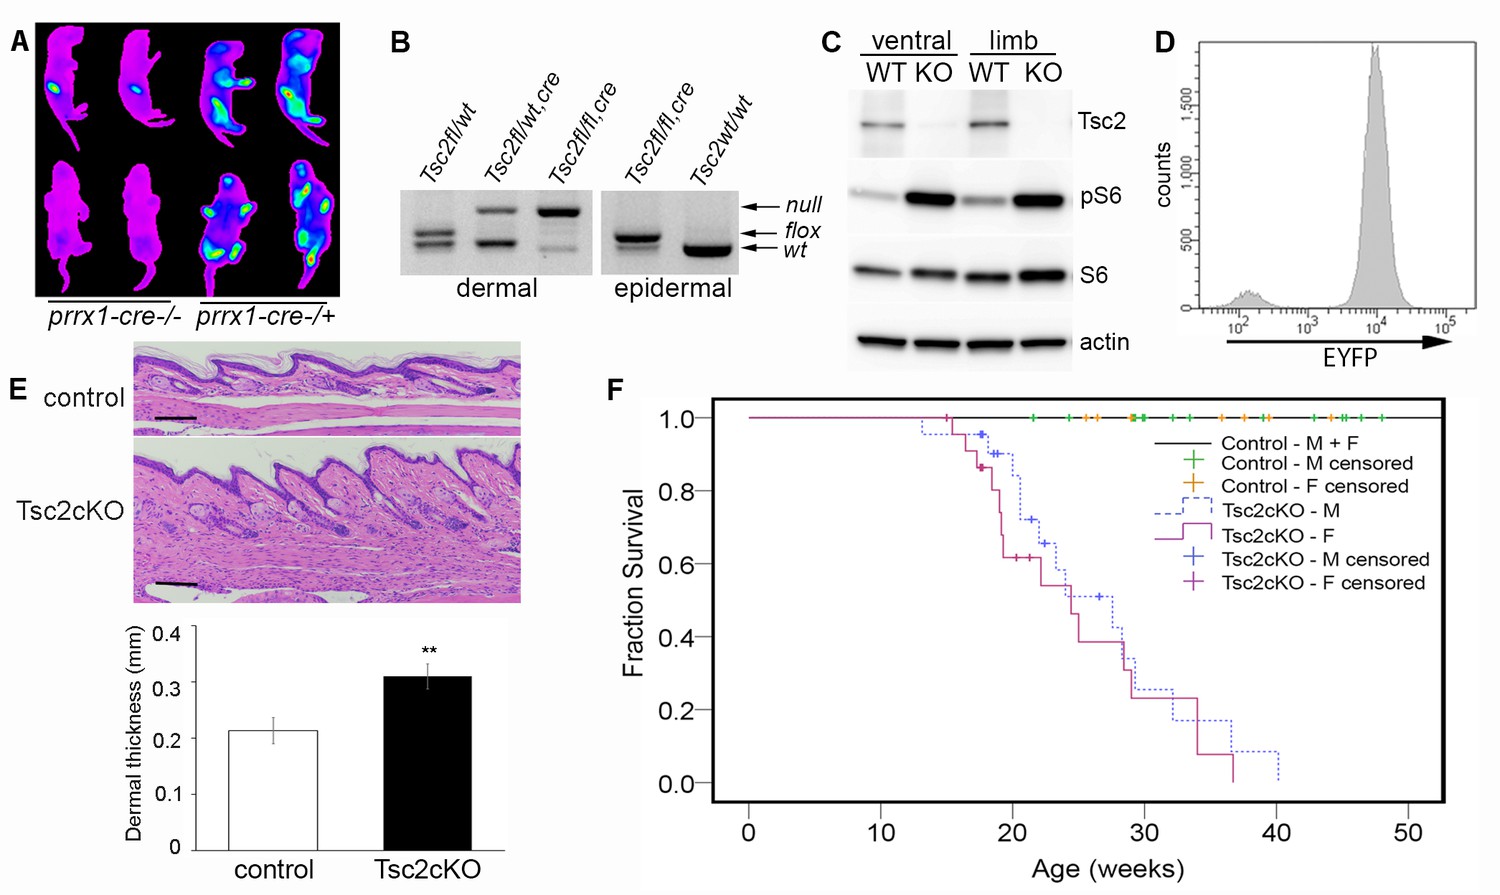
Characterization of Tsc2cKOPrrx1-cre mice.
(A) In vivo imaging of EYFP fluorescence from neonates without (left 2 pups) or expressing Prrx1-cre (right 2 pups). Fluorescence was observed in stomach from milk. (B) Genotype of neonatal dermal fibroblasts from Prrx1-cre expressing mice (left panel) and neonatal epidermis (right panel). Labels represent genotype that was observed from tail DNA, which does not express Prrx1-cre or contain recombined (Tsc2-) alleles. (C) Western blot of protein from neonatal dermal fibroblasts isolated from ventral skin or limbs of Tsc2cKOPrrx1-cre (KO) or Tsc2fl/fl controls (WT) probed with indicated antibodies. Similar results seen with greater than 10 cell lines. (D) Flow cytometry of cultured EYFP-expressing neonatal limb dermal fibroblasts. Approximately 95% of cells expressed EYFP. (E) Histology of skin of Tsc2cKO mice demonstrating greater dermal thickness and cellularity than controls. Scale bar, 0.1 mm. Dermal thickness of dorsal forepaw skin in control and Tsc2cKO mice ages 2–5 months (control n = 9, Tsc2cKO n = 7). Data presented as mean ± SD, **p<0.001. (F) Kaplan-Meier survival analysis was used to determine the median survival of Tsc2cKO mice. The Tsc2cKO differed from control (p<0.001, log-rank test). Among Tsc2cKO mice, median survival for males was 28 weeks of age and for females 24 weeks, however this difference was not significant (p=0.392, log-rank test). Controls n = 28 (all 28 were censored), M Tsc2cKO n = 22 (8 censored), F Tsc2cKO n = 24 (9 censored). The source data for this figure are in Figure 1—source data 1, 2 and 3.
-
Figure 1—source data 1
Source data for Figure 1E.
Dermal thickness in control vs. Tsc2cKOPrrx1-cre mice.
- https://doi.org/10.7554/eLife.23202.004
-
Figure 1—source data 2
Source data for Figure 1F.
Survival data for Tsc2cKOPrrx1-cre mice.
- https://doi.org/10.7554/eLife.23202.005
-
Figure 1—source data 3
Source data for Figure 1F.
Serum chemistry and CBC analysis of Tsc2cKOPrrx1-cre mice.
- https://doi.org/10.7554/eLife.23202.006
Figure 1—figure supplement 1
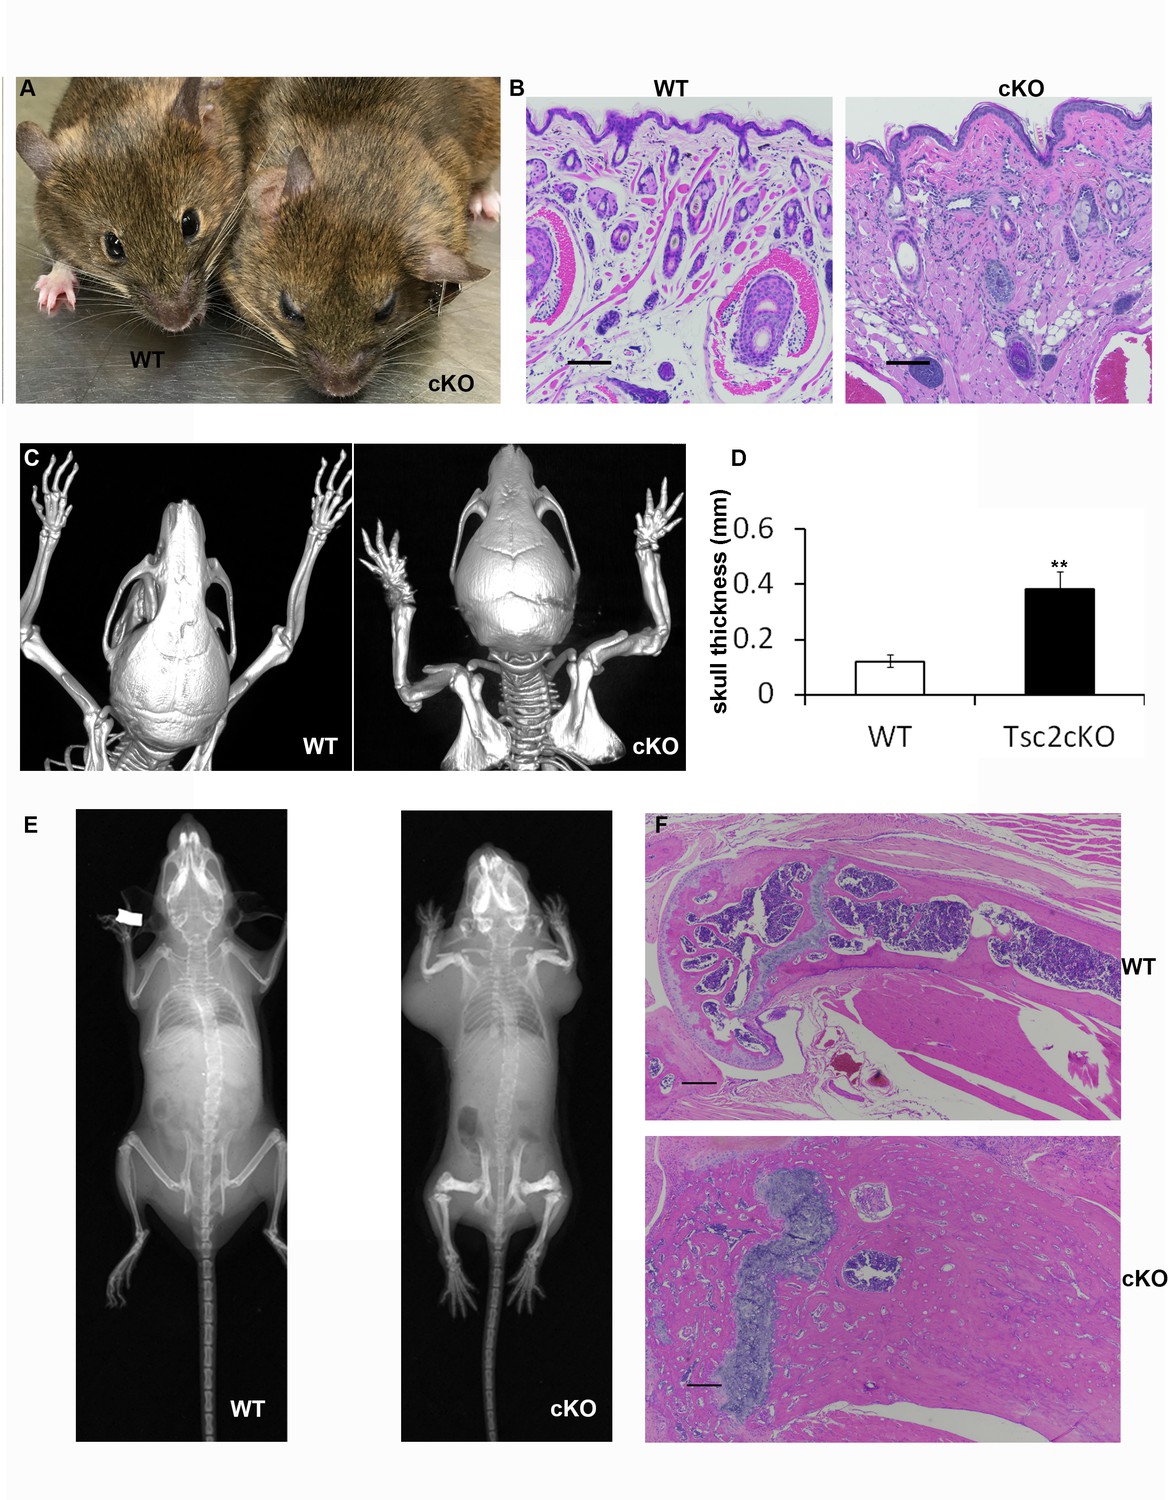
Facial and skeletal phenotype of Tsc2cKOPrrx1-cre (cKO) mice.
(A) Facial abnormalities of cKO mice included bulbous snout and thickened eyelids. (B) Histology of whisker pad skin showing increased cellularity, vessels, and collagen. Scale bars, 0.1 mm. (C) CT image of WT and cKO mice showing skeletal abnormalities of the limbs and cranium. (D) Cranial bone thickness is increased more than 3-fold in Tsc2cKOPrrx1-cre mice. Measurement of skull thickness was done by extrapolating from cranial space from similar cross section MRI images near the center of cranial bone in 4–6 month-old adult WT (n = 4) and cKO mice (n = 8), **p<0.001. (E) X-ray of WT and Tsc2cKOPrrx1-cre mice showing shorter and thicker bones with greater bone mass. (F) H&E of WT and Tsc2cKOPrrx1-cre showing that increased bone acquisition has drastically increased the bone diameter and reduced the marrow space. Scale bars, 0.1 mm.
Figure 2 with 6 supplements
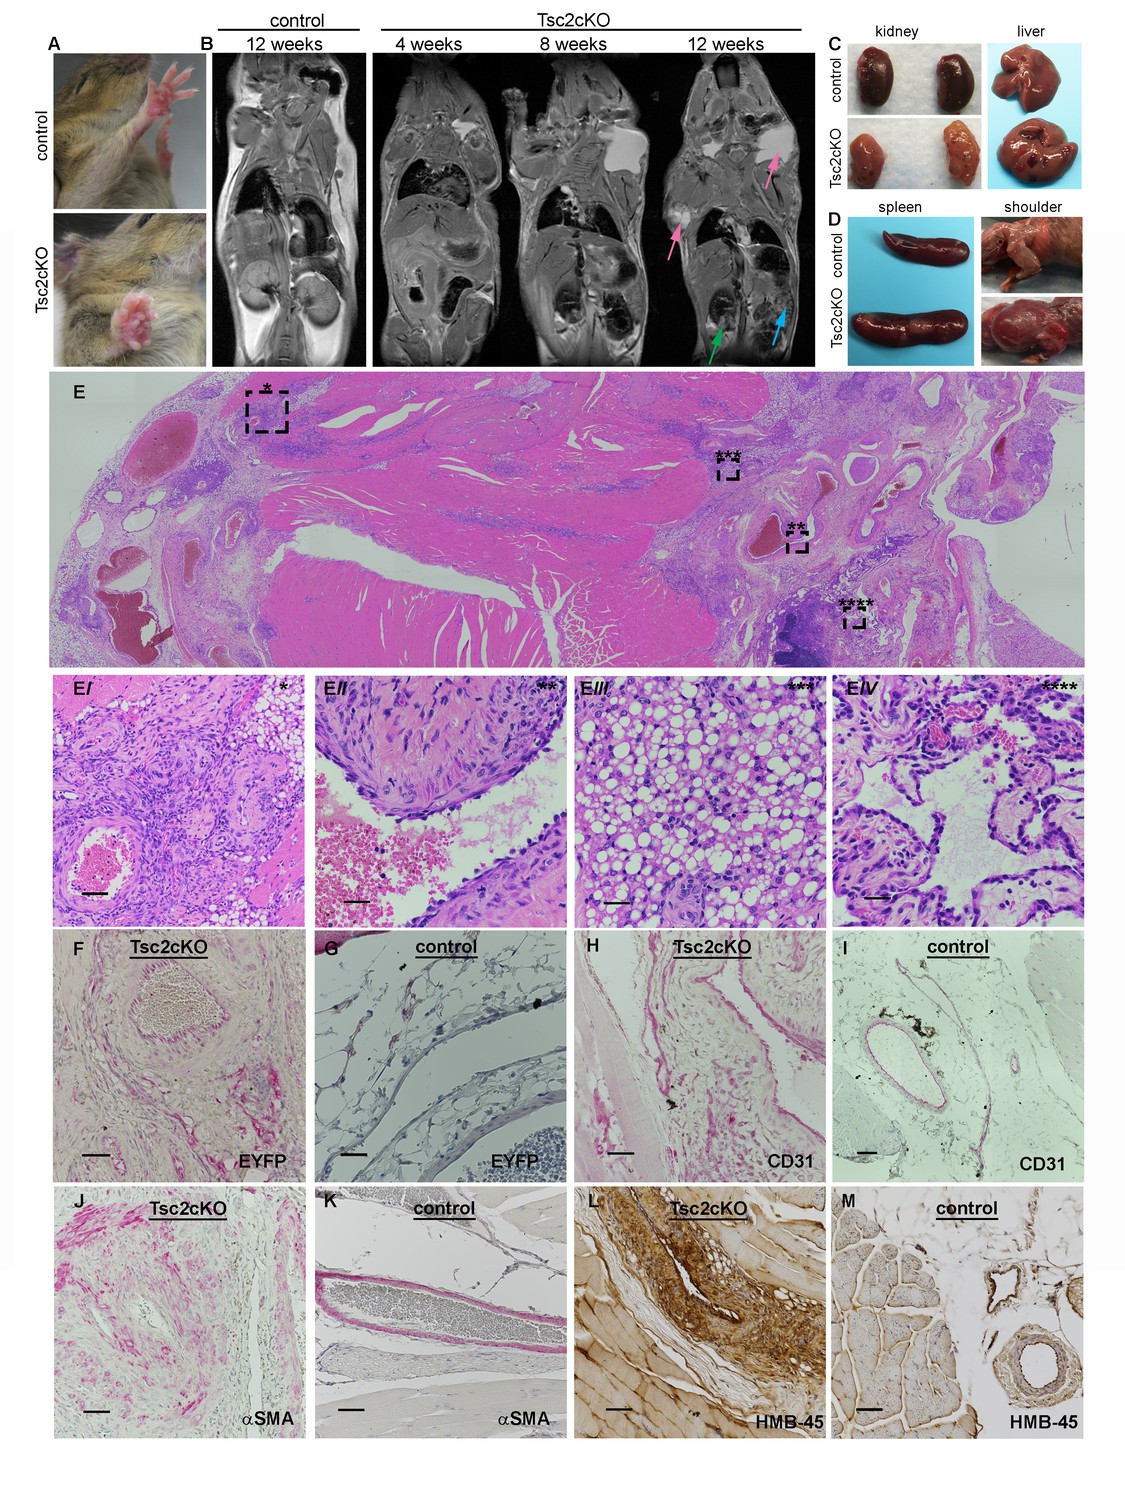
Gross and histopathology of Tsc2cKOPrrx1-cre mice (Tsc2cKO).
(A) Forepaw growth in adult Tsc2cKO. (B) Full-body MRI 2D images of 12 week control and serial-imaged Tsc2cKO mice. High signal intensity was detected in upper chest/shoulder (pink arrows). Other abnormalities are seen in kidney (small cysts, green arrow) and spleen (enlargement and irregular patterning, blue arrow). (C) Gross appearance of kidney and liver from 4 to 5 month old control (upper panels) and adult Tsc2cKO mice (lower panels) showing typical tumors. (D) Gross appearance of spleen and shoulder region from 4 to 5 month old control (upper panels) and adult Tsc2cKO mice (lower panels). (E) Histologic appearance of shoulder and axillary region of Tsc2cKO mouse. (Ei) Hamartomatous region with abnormal vessels and abundant fat. (Eii) Abnormally large blood vessel with thick, fibrotic vessel wall and endothelial dysplasia. (Eiii) Lipomatous area contains adipose-like cells with variably-increased eosinophilic cytoplasm. (Eiv) Lymphatic dysplasia near lymph node. Immunohistochemical studies including anti-GFP (F, G) anti-CD31 (H, I), anti-alpha-smooth muscle actin (SMA) (J, K) and anti-HMB-45 (L, M) of forelimb hamartomas in Tsc2cKO mice (F, H, J, L) and forelimb vessels of control mice (G, I, K, M). IHC staining of controls and Tsc2cKO tissue was consistent in sections from at least n = 4 mice. Scale bars: 0.5 mm for E; 0.05 mm for Ei, 0.025 mm for Eii-Eiv, G and K; 0.05 mm for F, H, I J, L and M.
Figure 2—figure supplement 1

IHC of kidney and liver tumors.
A-D: Liver and kidney tumors in Tsc2cKOPrrx1-cre mice were similar in histologic appearance to published reports in Tsc1- and Tsc2- haploinsufficient mice. (A) H&E staining of 4 month Tsc2cKOPrrx1-cre kidney showing presence of cystademas developing in the tubular epithelium. (B) Anti-GFP staining showing the presence of EYFP-expressing Tsc2 KO cells in kidney cyst epithelium. (C) H&E staining of liver tumors in Tsc2cKO mice showed vascular channels filled with blood. (D) Anti-GFP staining showing the presence of EYFP-expressing Tsc2 KO cells in tumor region but not hepatocytes. Scale bars for A-D: 0.15 mm.
Figure 2—figure supplement 2

MRI angiography of Tsc2cKOPrrx1-cre mice.
(A–D) Sagittal-view angiograms were created from reconstructed images with maximum signal intensity projections. (A) WT anterior region (B) Tsc2cKOPrrx1-cre anterior region shows numerous tortuous vessels in head and foreleg regions compared to WT. (C) WT posterior region. (D) Tsc2cKOPrrx1-cre posterior region contains numerous tortuous vessels. E-F: Transverse view of upper chest region. (E) WT upper chest and upper forelimbs. (F) Tsc2cKOPrrx1-creupper chest with abnormal vasculature including numerous disorganized vessels in the upper forelimb and cranial regions.
Figure 2—figure supplement 3
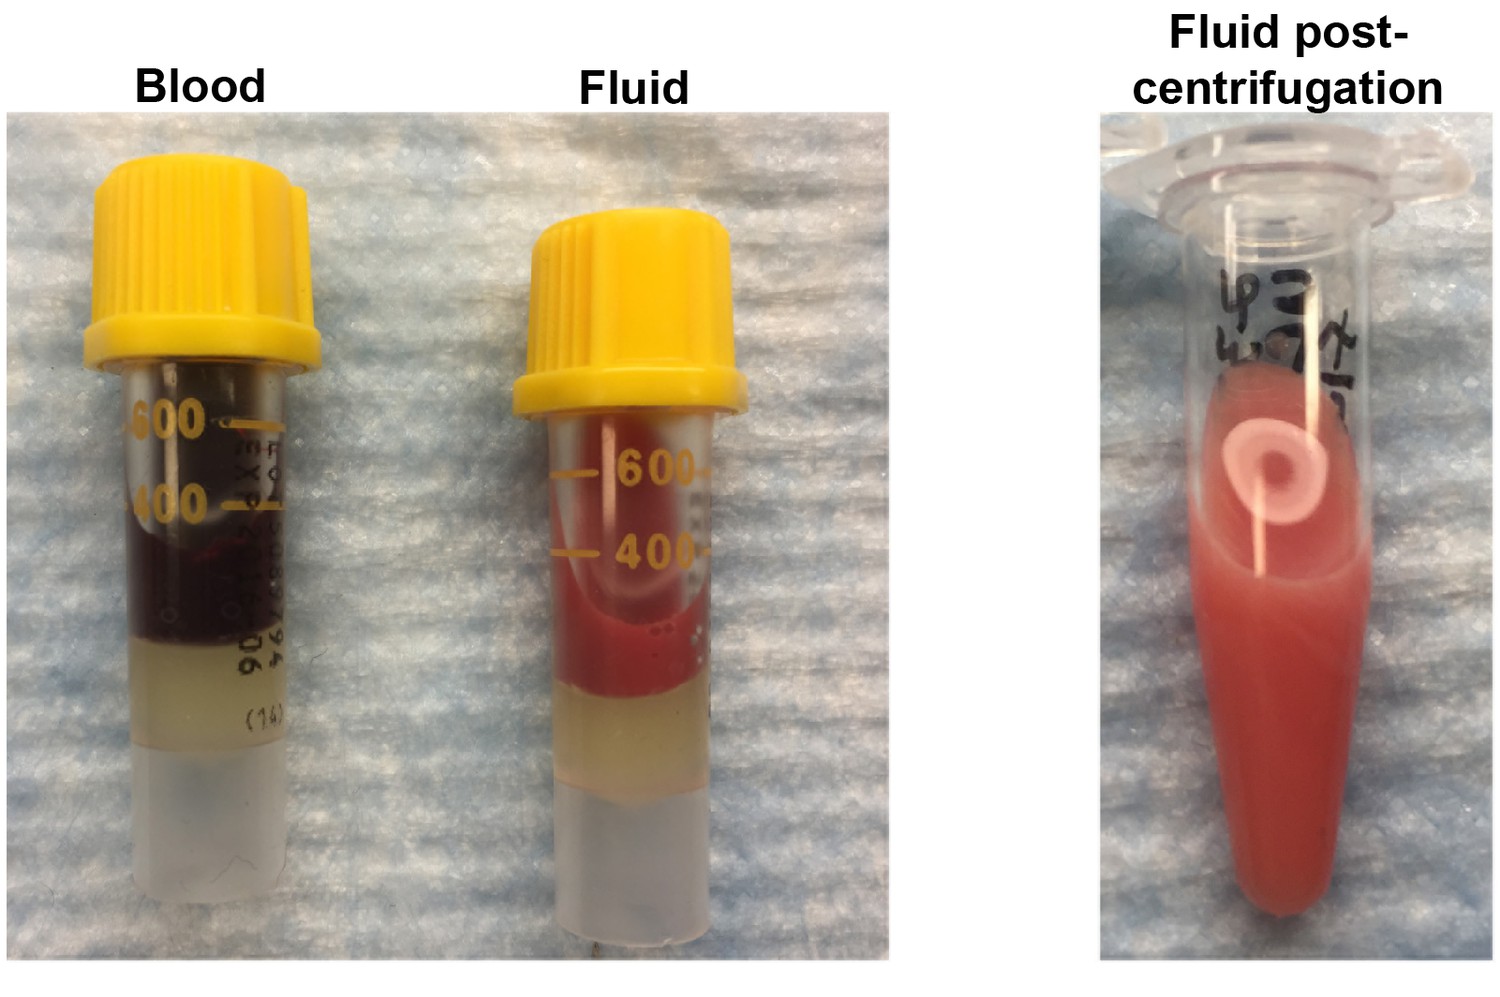
Triglyceride and cholesterol analysis of fluid from axillary mass outside thorax.
Photos show fluid with cloudy mixture of fluid before and after centrifugation in serum separator tube. Fluid samples in 3/3 mice had higher triglyceride levels (408, 230, and 1726 mg/dL) compared to paired serum samples (136, 74, and 167mg/dL, respectively). Normal for serum = 41-258 mg/dL. Cholesterol levels in fluid of these three mice was lower in 3/3 mice (90, 90, and 95 mg/dL) compared to serum (119, 117, and 170 mg/dL). High triglyceride levels compared to paired serum samples suggest a contribution of chyle in the fluid.
Figure 2—figure supplement 4

Elastin staining of human and mouse blood vessels.
(A) Normal-appearing vessel from LAM patient kidney (left) with arrows indicating elastic fiber. Dysplastic vessel (right) from AML region of the same kidney with arrows showing thin, fragmented elastic fibers. Scale bars, 0.100 mm. (B) Blood vessel from WT mouse (left) with typical stained elastic fiber (arrow). Tumor from shoulder of TSc2cKOPrrx1-cre mouse (right) with dysplastic vessel with arrow indicating thin and fragmented elastic fibers. Elastin stained with Hart’s method using reagents purchased from Rowley Biochemical, Inc., #F-379. Scale bars, 0.050 mm.
Figure 2—figure supplement 5
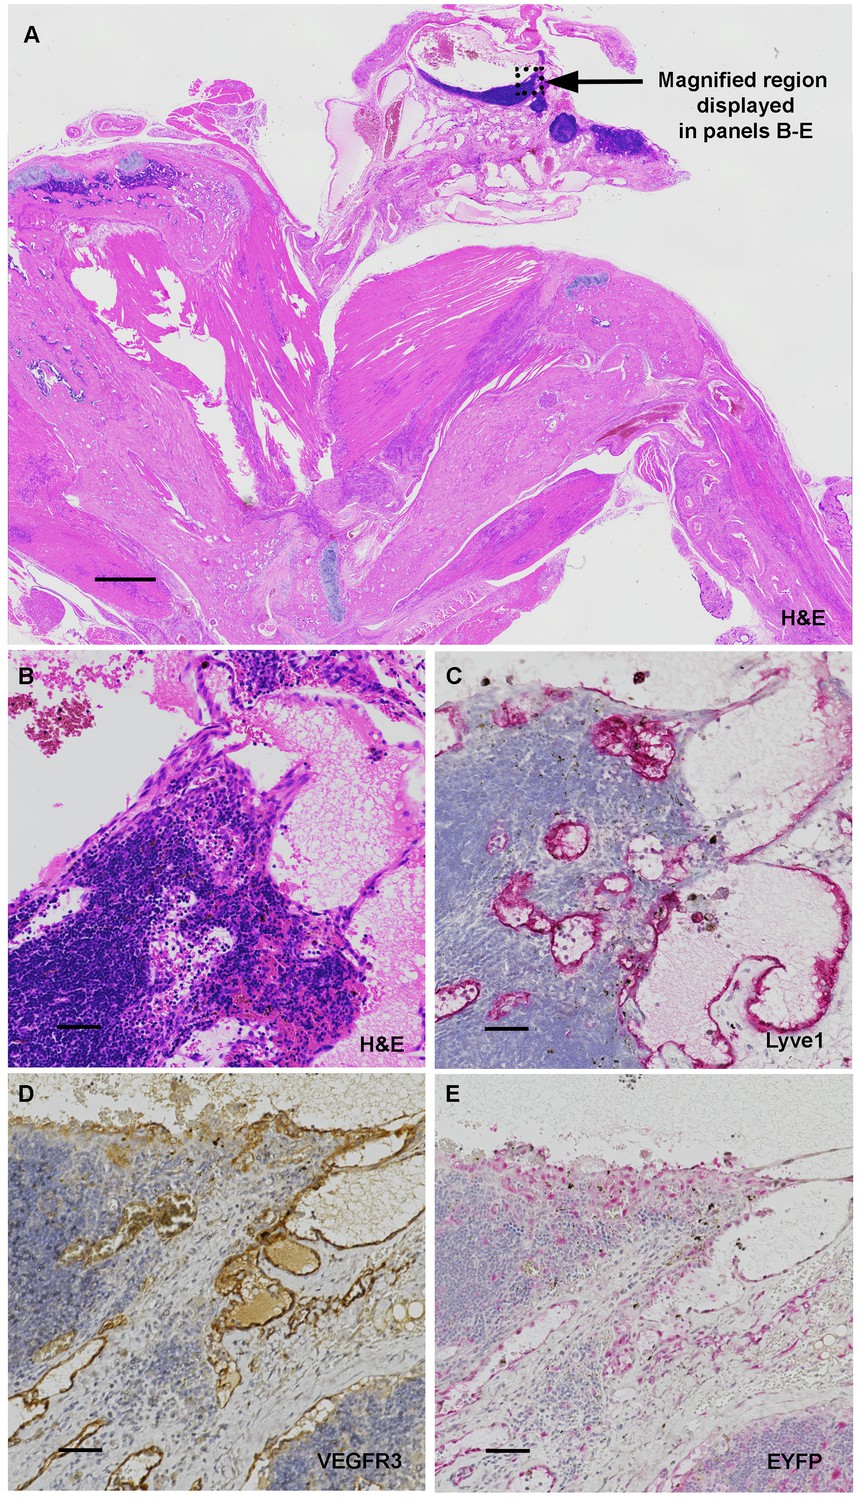
Upper forelimb lymphatic hamartoma in Tsc2cKOPrrx1-cre mice.
(A) H&E showing longitudinal forelimb containing a dysplastic and cystic axillary lymph node as part of a lymphatic hamartoma. Bar, 1 mm. (B–E) serial sections from region indicated in ‘A’. Scale bars, 0.050 mm. (B) Region of dysplastic lymph node containing fibrosis and thin, dilated vessels with rounded endothelial cells. (C) Lymphatic marker LYVE1 expression within abnormal lymphatic vessels from lymph node. (D) Lymphatic marker VEGFR3 expression within abnormal lymphatic vessels from lymph node. (E) Anti-GFP staining to detect EYFP expression shows endothelial expression of EYFP in Tsc2cKO axillary lymph node.
Figure 2—figure supplement 6
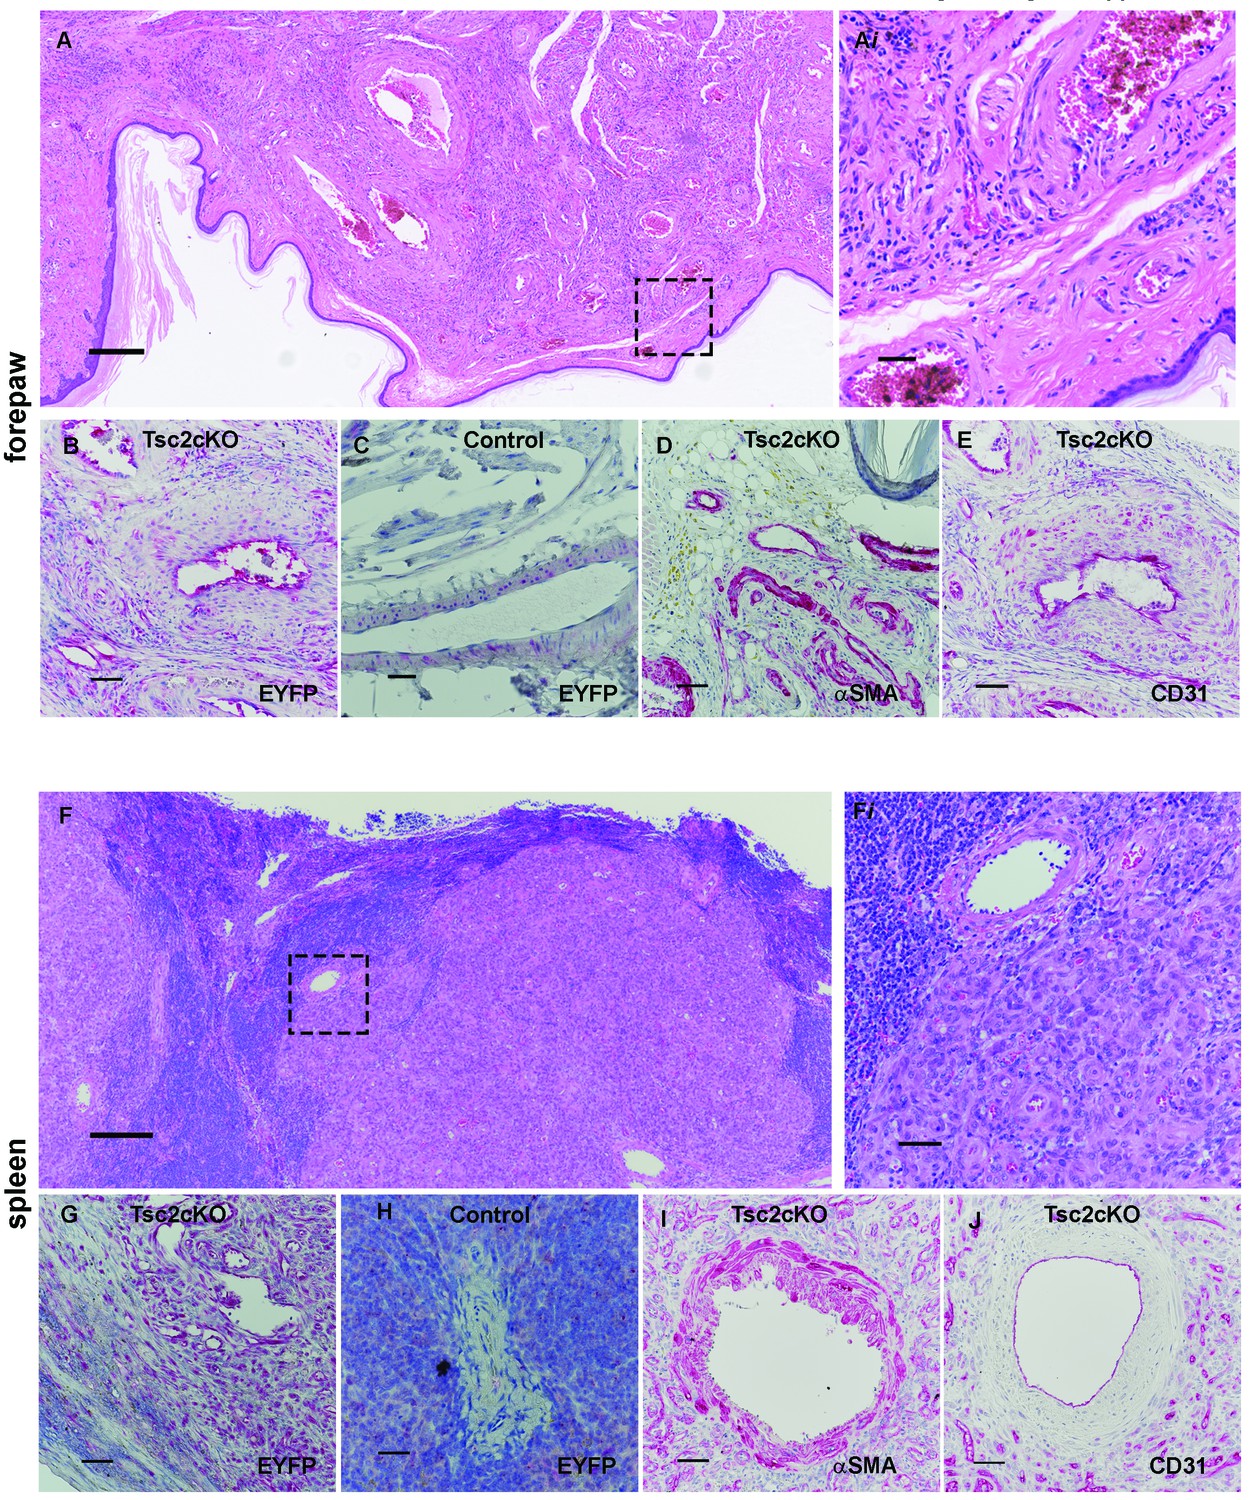
Histology of Tsc2cKO forepaw and spleen tumors.
(A) H&E staining of forepaw showing extensive hamartoma in the volar region. Scale bar, 0.250 mm. (Ai). From Figure 2—figure supplement 1A inset. Scale bar, 0.05 mm. (B) Anti-GFP immunostaining of EYFP expression of forepaw tumor. Scale bar, 0.05 mm. (C) Anti-GFP staining showing blood vessel from EYFP positive control mouse forepaw. Scale bar, 0.025 mm. (D) αSMA staining of hamartoma from cKO forepaw. Scale bar, 0.05 mm. (E) CD31 staining of hamartoma from cKO forepaw. (F) H&E staining of splenic hamartoma nodule. Scale bar, 0.250 mm. (Fi): From Figure 2—figure supplement 1F inset. Scale bar, 0.05 mm. (G) Anti-GFP of splenic hamartoma. Scale bar, 0.05 mm. (H) Anti-GFP of splenic vessel from EYFP positive control mouse. Scale bar, 0.025 mm. (I) Anti-αSMA staining of splenic tumor. Scale bar, 0.05 mm. (J) Anti-CD31 staining. Scale bar, 0.05 mm.
Figure 3
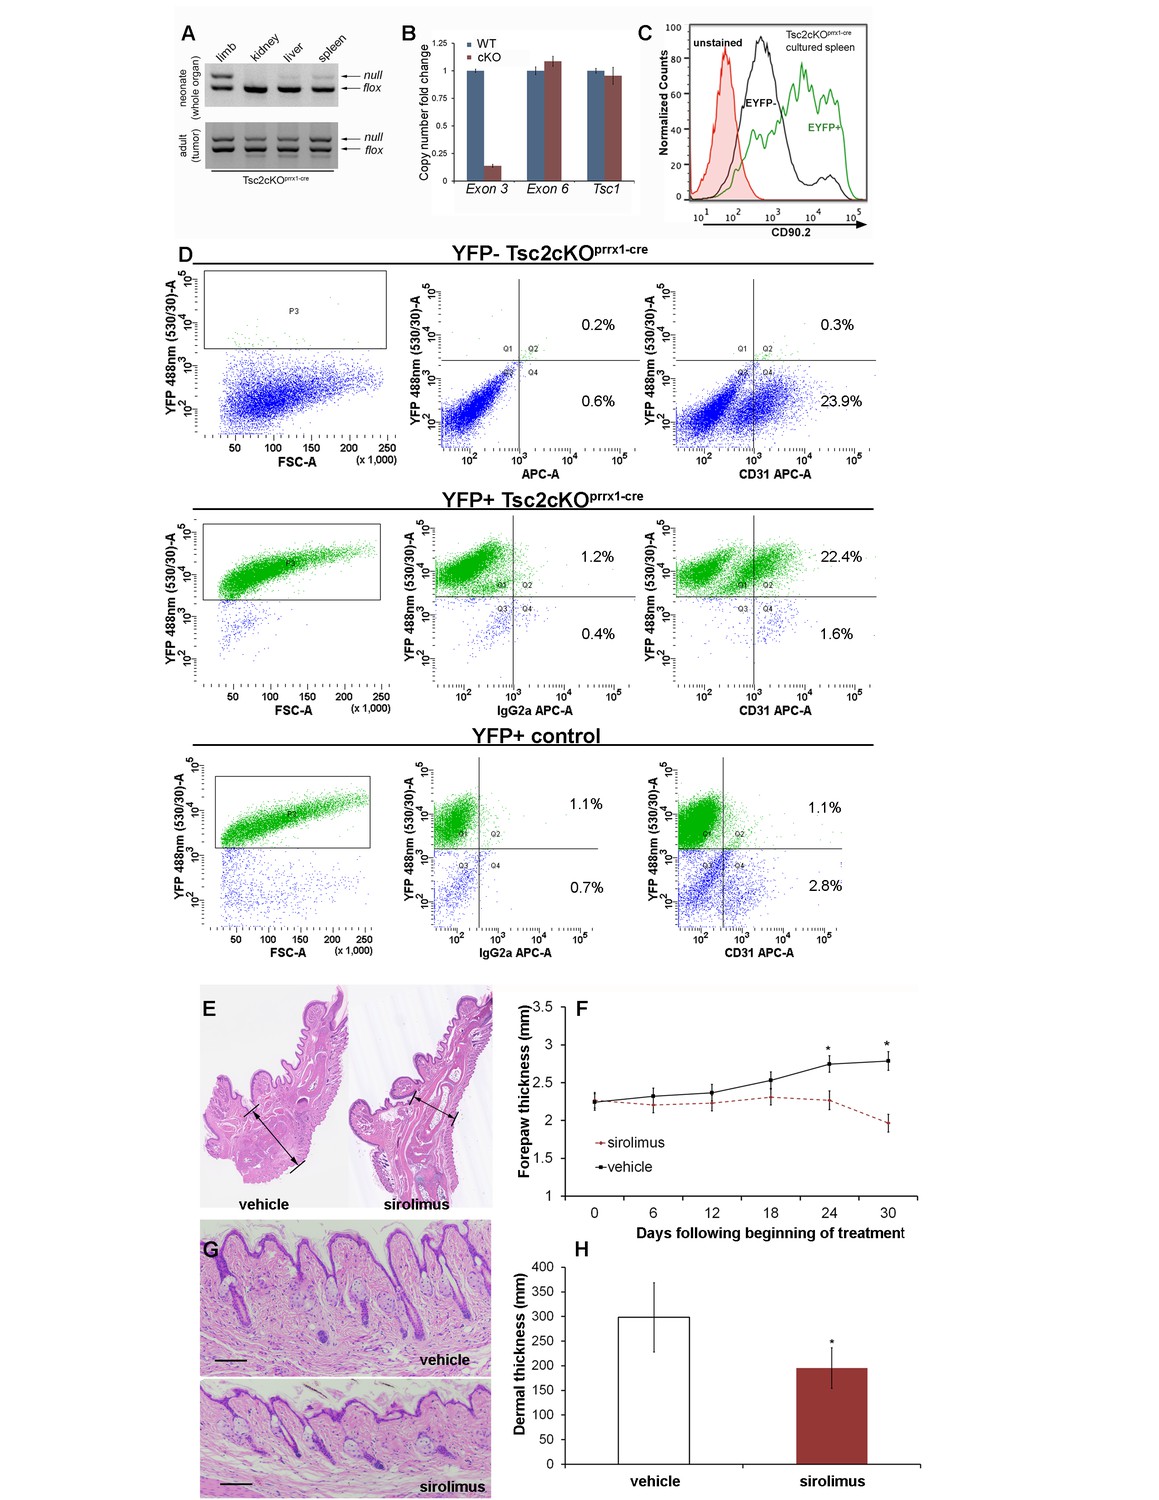
Hamartomas of Tsc2cKOPrrx1-cre (Tsc2cKO) mice contain both mesenchymal and endothelial KO cells and are sirolimus-sensitive.
(A) 3-primer PCR detection of Tsc2-, Tsc2fl and Tsc2+ alleles in neonatal organs (upper panel) and adult tumor tissue using genotyping primers (lower panel). Similar results found in three separate neonatal and adult Tsc2cKO mice. (B) Copy numbers of Tsc2 exon 3 were reduced in DNA isolated from EYFP-expressing splenocytes enriched by FACS compared to DNA isolated from WT cells. Tsc2 exon 6 and Tsc1 copy number assays run as controls (n = 3 from YFP+ spleen tumors). (C) The presence CD90.2 expression in EYFP-positive cultured splenocytes from cKO mice confirms Tsc2-deficient mesenchymal component containing Tsc2-deficient cells in spleen tumor. Similar results observed in two other cKO spleens. (D) Flow cytometry of dissociated and cultured forepaw tumor confirms that these tumors contain Tsc2-deficient CD31-positive cells. Upper: YFP-negative Tsc2cKO forepaw tumor cells. Middle: YFP-positive Tsc2cKO forepaw tumor cells. Lower: Dissociated and cultured EYFP-expressing cells from control forepaw. E, F: Reduction of tumor size by sirolimus. Sirolimus (5 mg/kg) or vehicle was injected IP every other day in Tsc2cKO mice starting at postnatal day 25 for 30 days. Forepaw thickness was then measured weekly by calipers and mice were sacrificed at day 30. (E) Histological sections of forepaws from 30 day treatment with vehicle (left) or sirolimus (right). (F) Forepaw thickness in cKO measured during treatment (day 24 *p=0.03, day 30 *p<0.001). G, H: Partial normalization of dermal thickness by sirolimus. (G) Histological image of dermis following 30 day sirolimus. Scale bar, 0.1 mm. (H) Measurement of dermal thickness following 30 day sirolimus (vehicle n = 8, sirolimus n = 10 mice, *p=0.003). Error bars for F and H indicate ± S.D. The source data for this figure are in Figure 3—source datas 1–3.
-
Figure 3—source data 1
Source data for Figure 3B.
Measurement of Tsc2 gene copy number in splenic cells enriched for EYFP fluorescence.
- https://doi.org/10.7554/eLife.23202.018
-
Figure 3—source data 2
Source data for Figure 3H.
Dermal thickness in Tsc2cKO mice treated with sirolimus or vehicle.
- https://doi.org/10.7554/eLife.23202.019
-
Figure 3—source data 3
Source data for Figure 3F.
Paw thickness measurement in Tsc2cKO mice treated with sirolimus and vehicle.
- https://doi.org/10.7554/eLife.23202.020
Figure 4
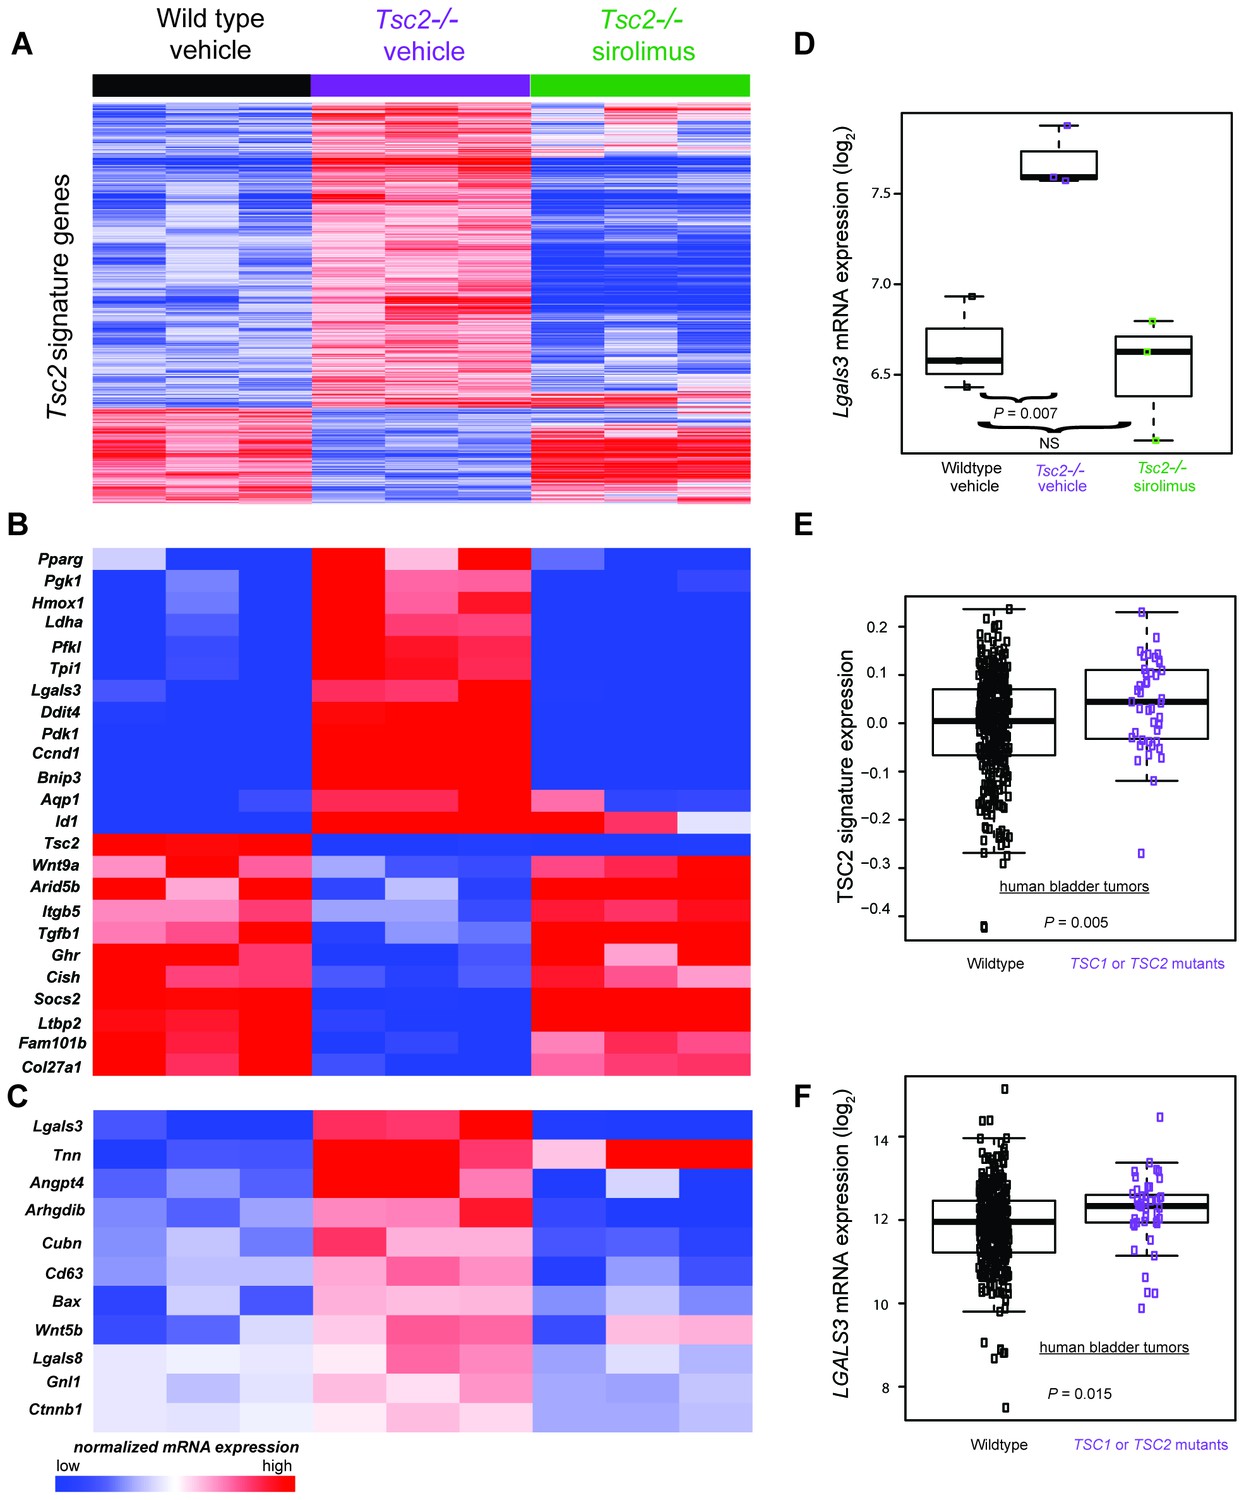
Transcriptomic analysis of mouse neonatal dermal fibroblasts identified Tsc2-dependent and mTORC1-dependent signature genes including LGALS3, whose mRNA is elevated in cancers with TSC1 or TSC2 mutations.
(A) Heatmap of differentially regulated genes from n = 3 (each sample represents one neonate from a different litter of pups) WT, Tsc2−/− + vehicle, and Tsc2−/− + sirolimus-treated mouse neonatal dermal fibroblasts with FDR of <10%. Genes are centered to the median of wild type vehicle and Tsc2−/−vehicle. (B) Heatmap of selected genes from both Tsc2-dependent and mTORC1-dependent signature genes based on statistically over-represented gene ontology categories (p<0.001) including response to hypoxia, regulation of cell death, regulation of cell cycle, and glycolytic processes. (C) Heatmap of 11 genes overexpressed in Tsc2−/− and decreased by sirolimus treatment that matched to GO categories ‘extracellular region’ and ‘signaling’. (D) Lgals3 expression in WT, Tsc2−/− + vehicle, and Tsc2−/− + sirolimus-treated dermal fibroblasts. (E) Mouse Tsc2-dependent gene expression signature is increased in human bladder cancers with non-silent mutations in either TSC1 or TSC2 (n = 43) compared with tumors containing WT TSC1 or TSC2 genes (n = 348, p=0.005). (F) LGALS3 mRNA expression is elevated in human bladder cancers with non-silent mutations in TSC1 or TSC2, p=0.015. Boxplot horizontal lines mark 25th, 50th, and 75th percentiles, whiskers extend to the furthest point less than or equal to 1.5 times the interquartile range. The source data for this figure are in Figure 4—source data 1, 2, 3, 4 and 5.
-
Figure 4—source data 1
Source data for Figure 4A.
Gene expression changes in KO (Tsc2-/-) fibroblasts versus WT (wild-type) fibroblasts with FDR < 10%.
- https://doi.org/10.7554/eLife.23202.023
-
Figure 4—source data 2
Source data for Figure 4A.
Gene expression changes in KO fibroblasts treated with sirolimus or vehicle.
- https://doi.org/10.7554/eLife.23202.024
-
Figure 4—source data 3
Source data-Figure 4A.
Gene expression changes in WT fibroblasts treated with sirolimus or vehicle.
- https://doi.org/10.7554/eLife.23202.025
-
Figure 4—source data 4
Source data-Figure 4A.
Differentially expressed genes corrected by sirolimus.
- https://doi.org/10.7554/eLife.23202.026
-
Figure 4—source data 5
Source data 5-Figure 4E and F.
Non-silent mutations in TSC1 or TSC2 found in bladder tumors (The Cancer Genome Atlas).
- https://doi.org/10.7554/eLife.23202.027
Figure 5
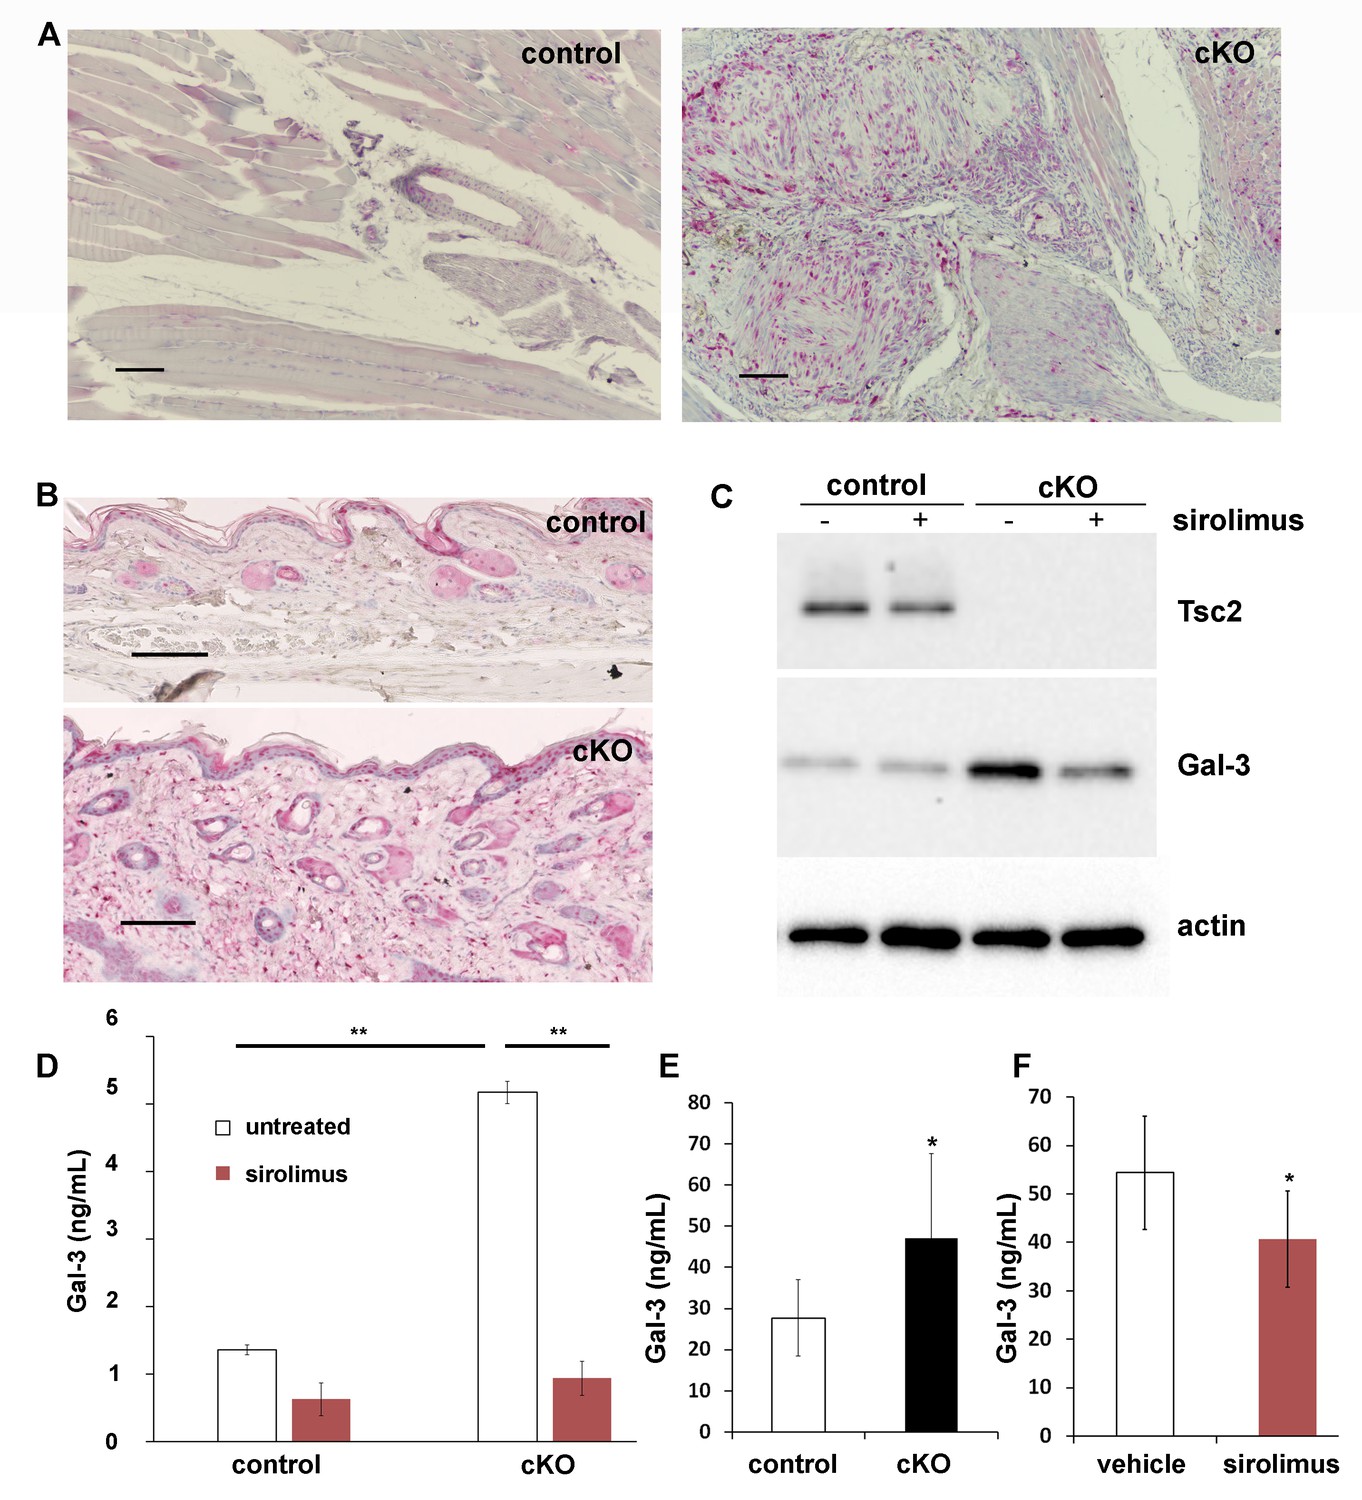
Increased production and secretion of Gal-3 in Tsc2cKOPrrx1-cre mice (cKO), which is partially under the control of mTORC1.
(A) Gal-3 immunostaining of forelimb tissues of control and cKO. Hamartoma of cKO mice shows Gal-3 positive staining within vascular and perivascular cells. (B) Gal-3 immunostaining of forepaw dermis from control and cKO mice. (C) Western blot of neonatal WT and KO dermal fibroblasts untreated or treated with 20 nM sirolimus for 48 hr. Blots were probed with antibodies to Tsc2, Gal-3 and actin. (D) Gal-3 secretion from 48 hr culture supernatants of WT and KO neonatal dermal fibroblasts treated as indicated. Gal-3 levels were measured by a mouse ELISA assay (n = 3 cell lines for each group). *p<0.05. (E) A significant increase (p=0.004) in serum levels of Gal-3 from adult Tsc2cKOPrrx1-cre mice (n = 11) compared to control mice (n = 15) was observed. (F) Serum from 8 week-old, 30 day sirolimus-treated treated mice (n = 8 mice) showed a significant (p=0.04) decrease in Gal-3 compared to controls (n = 6 mice). Error bars for D-F indicate ± S.D. Scale bars in A and B are 0.1 mm. The source data for this figure are in Figure 5—source data 1, 2.
-
Figure 5—source data 1
Source data-Figure 5D.
Gal-3 levels (pg/mL) in Tsc2 WT or KO limb dermal fibroblasts ± 48 hr treatment with sirolimus.
- https://doi.org/10.7554/eLife.23202.029
-
Figure 5—source data 2
Source data-Figure 5E and F.
Gal-3 levels in serum of Tsc2cKO and control mice (5E) and Gal-3 serum levels in Tsc2cKO mice treated with sirolimus (5F).
- https://doi.org/10.7554/eLife.23202.030
Figure 6 with 3 supplements
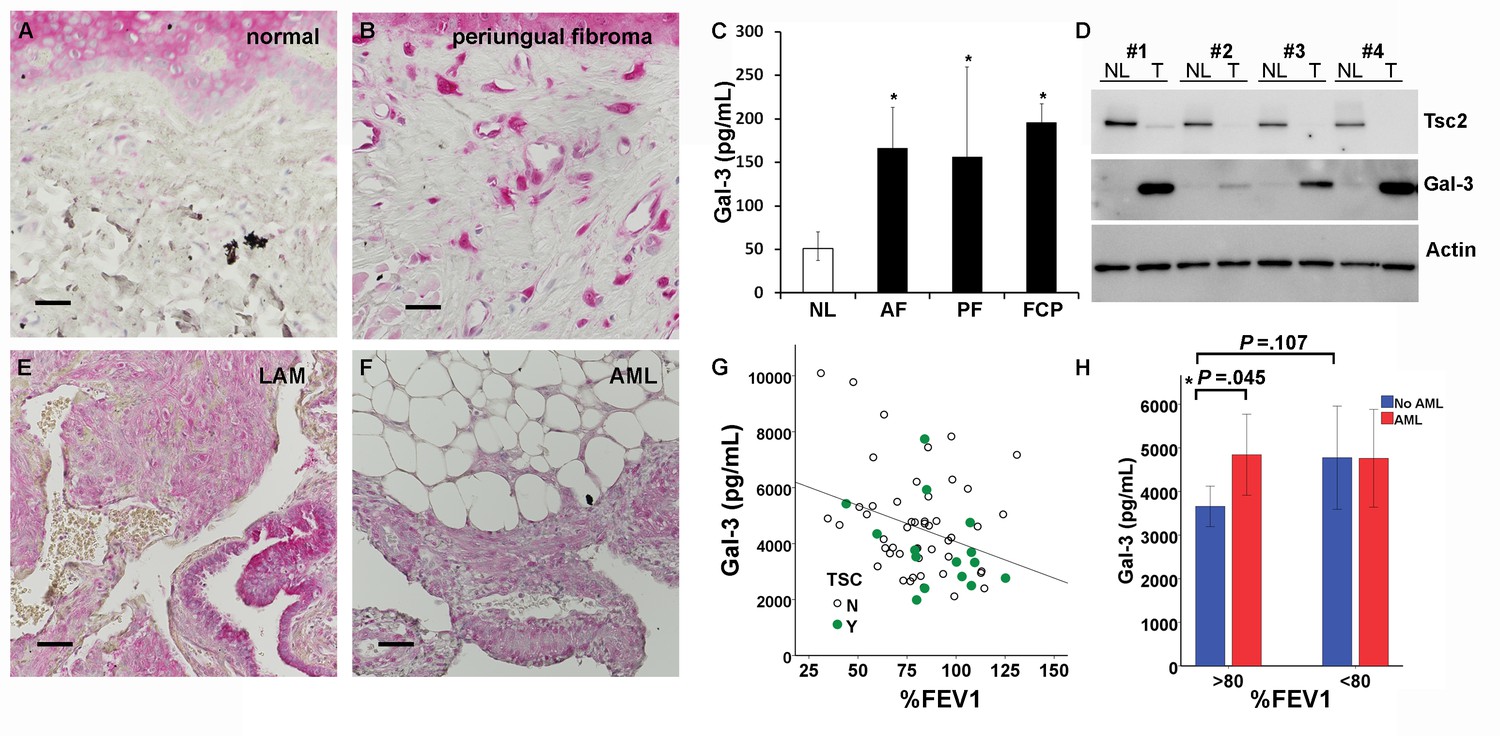
Gal-3 expression in TSC skin tumors, LAM nodules and AML of the kidney.
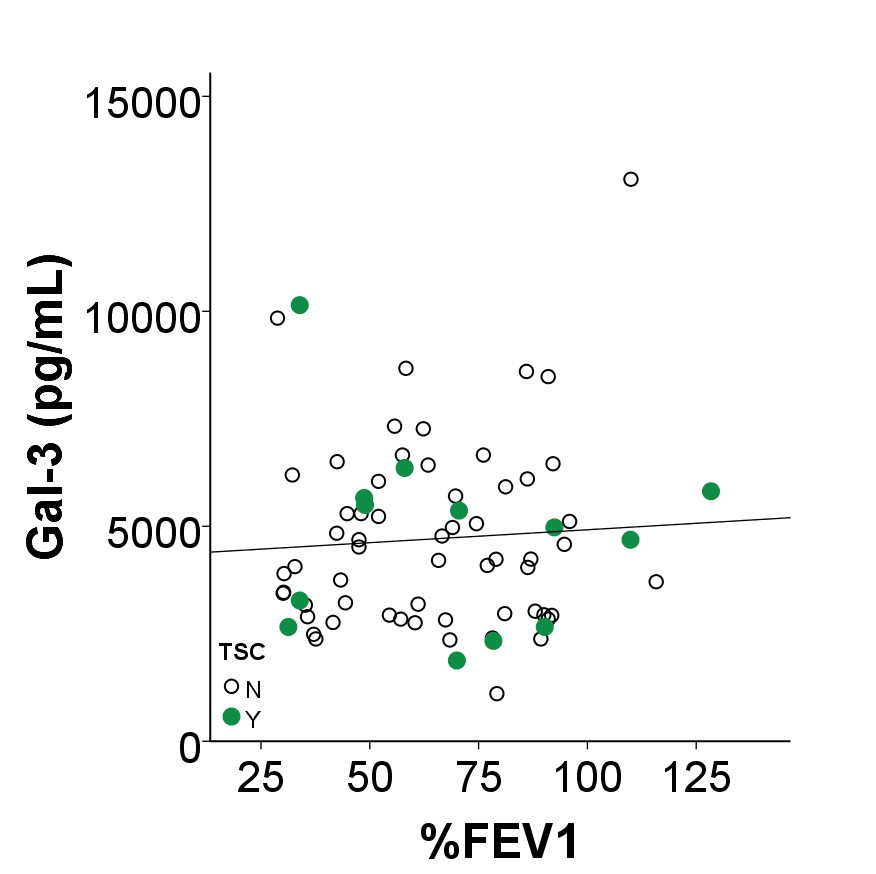
(A) Gal-3 immunostaining of normal-appearing skin biopsy from TSC patient. (B) Gal-3 expression in TSC periungual fibroma skin tumor. (C) Gal-3 levels from culture supernatants of fibroblasts grown from TSC skin tumors. Normal-appearing skin from ear (NL) n = 11 patients; angiofibroma (AF) n = 7 patients, p=0.020 vs. NL; periungual fibroma (PF) n = 5 patients, p=0.028 vs. NL; fibrous cephalic plaque (FCP) n = 3 patients, p=0.026 vs. NL. For some patients, Gal-3 levels from multiple skin tumor cell lines were averaged. (D) Western blot showing correlation of TSC2 and Gal-3 levels. Paired skin samples from four representative patients are shown. NL = cultured normal skin fibroblasts and T = TSC skin tumor fibroblasts. (E) Gal-3 expression in LAM nodule representative of n = 4 LAM patient samples tested. Airway epithelium in lower left of panel is also positive. (F) Gal-3 expression in angiomyolipoma (AML) lesion representative of n = 3 AML patient samples tested. (G) Significant negative correlation of %FEV1 with Gal-3 serum levels in patients with proven LAM and not taking mTOR inhibitor (r = −0.32, p=0.010, n = 64 with only one sample per individual used for analysis). N = no TSC (sporadic LAM). Y = TSC-LAM. (H) Comparison of Gal-3 levels in LAM patients with and without AML. For patients with mild LAM (%FEV1 > 80), Gal-3 levels were higher in those with AML (n = 33) than without (n = 25). *p=0.045. There was no significant difference for Gal-3 levels with respect to AML status for patients with %FEV1 < 80. For all panels, * represents p<0.05. Error bars indicate ± S.D. Scale bars in A, B, E, and F are 0.05 mm. The source data for this figure are in Figure 6—source data 1, 2 and 3.
-
Figure 6—source data 1
Source data-Figure 6C.
Gal-3 levels (log2) in culture supernatants from TSC patient-derived skin tumor cell lines.
- https://doi.org/10.7554/eLife.23202.032
-
Figure 6—source data 2
Source data-Figure 6G and H.
Gal-3 levels in serum from LAM patients not taking mTOR inhibitor. AML status and %FEV1 are indicated. Each row is from a different patient.
- https://doi.org/10.7554/eLife.23202.033
-
Figure 6—source data 3
%FEV1 and Gal-3 levels in serum from LAM patients taking mTOR inhibitor.
Each row is a different patient.
- https://doi.org/10.7554/eLife.23202.034
Figure 6—figure supplement 1
Galectin-3 expression in LAM nodule tumor cells, as well as lung epithelium.
Serial sections of a LAM nodule are shown in A-D. (A) H&E of LAM nodule. (B) Anti-Gal-3 at higher magnification (C) Anti-αSMA showing positive smooth muscle LAM cells. (D) Anti-HMB45 showing scattered positive staining characteristic of LAM nodules. Scale bars: A-D = 0.025 mm.
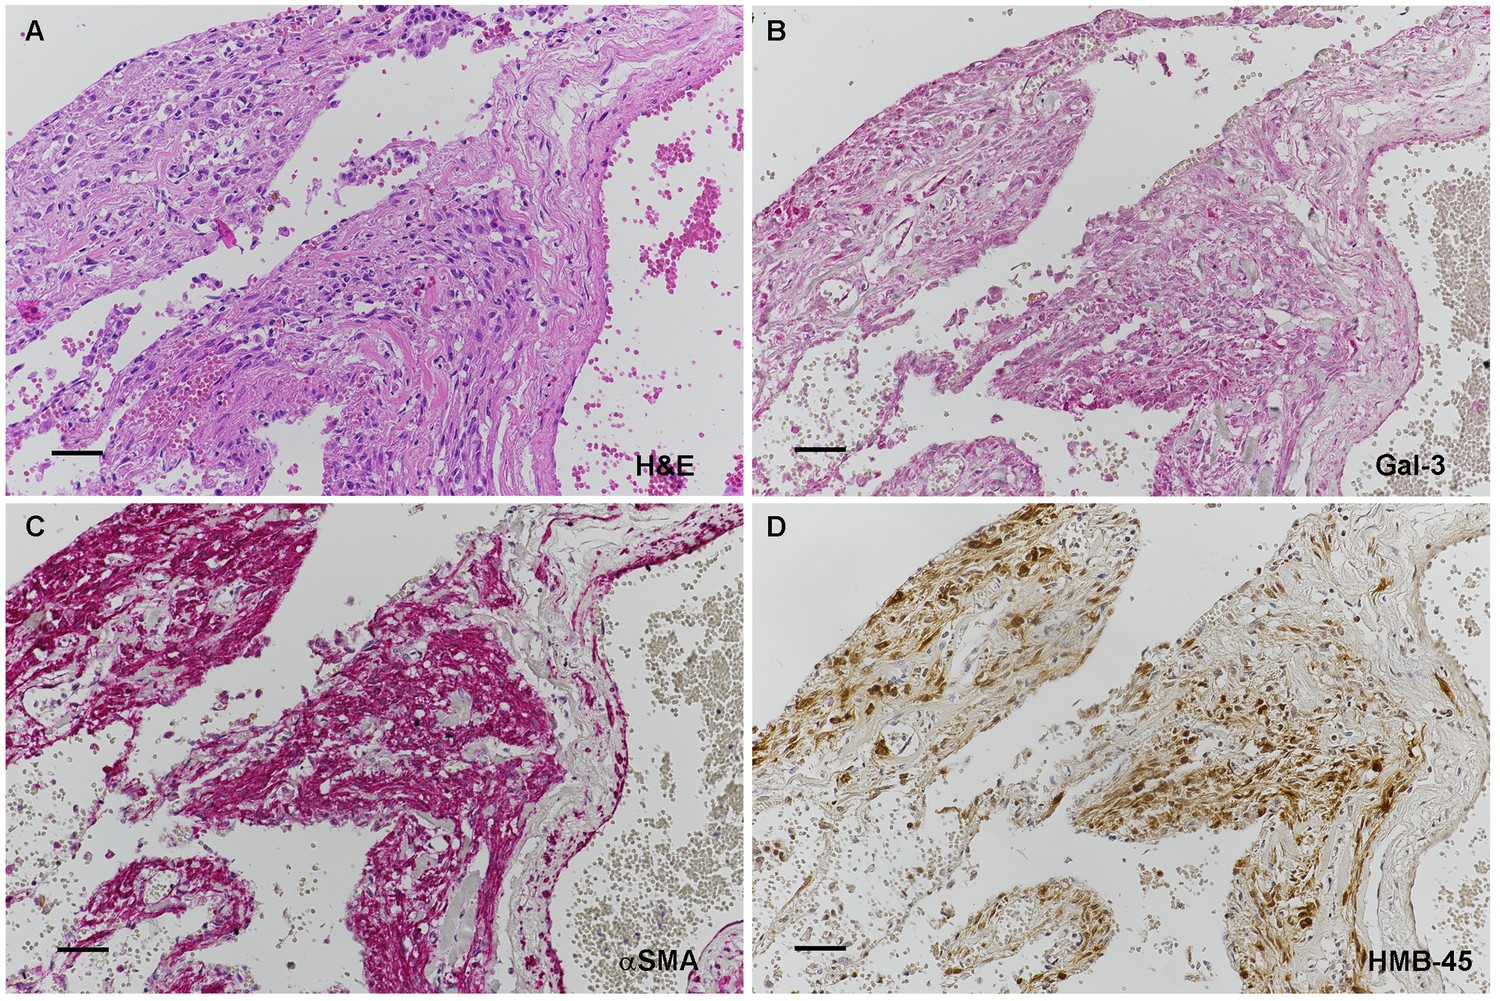
Figure 6—figure supplement 2
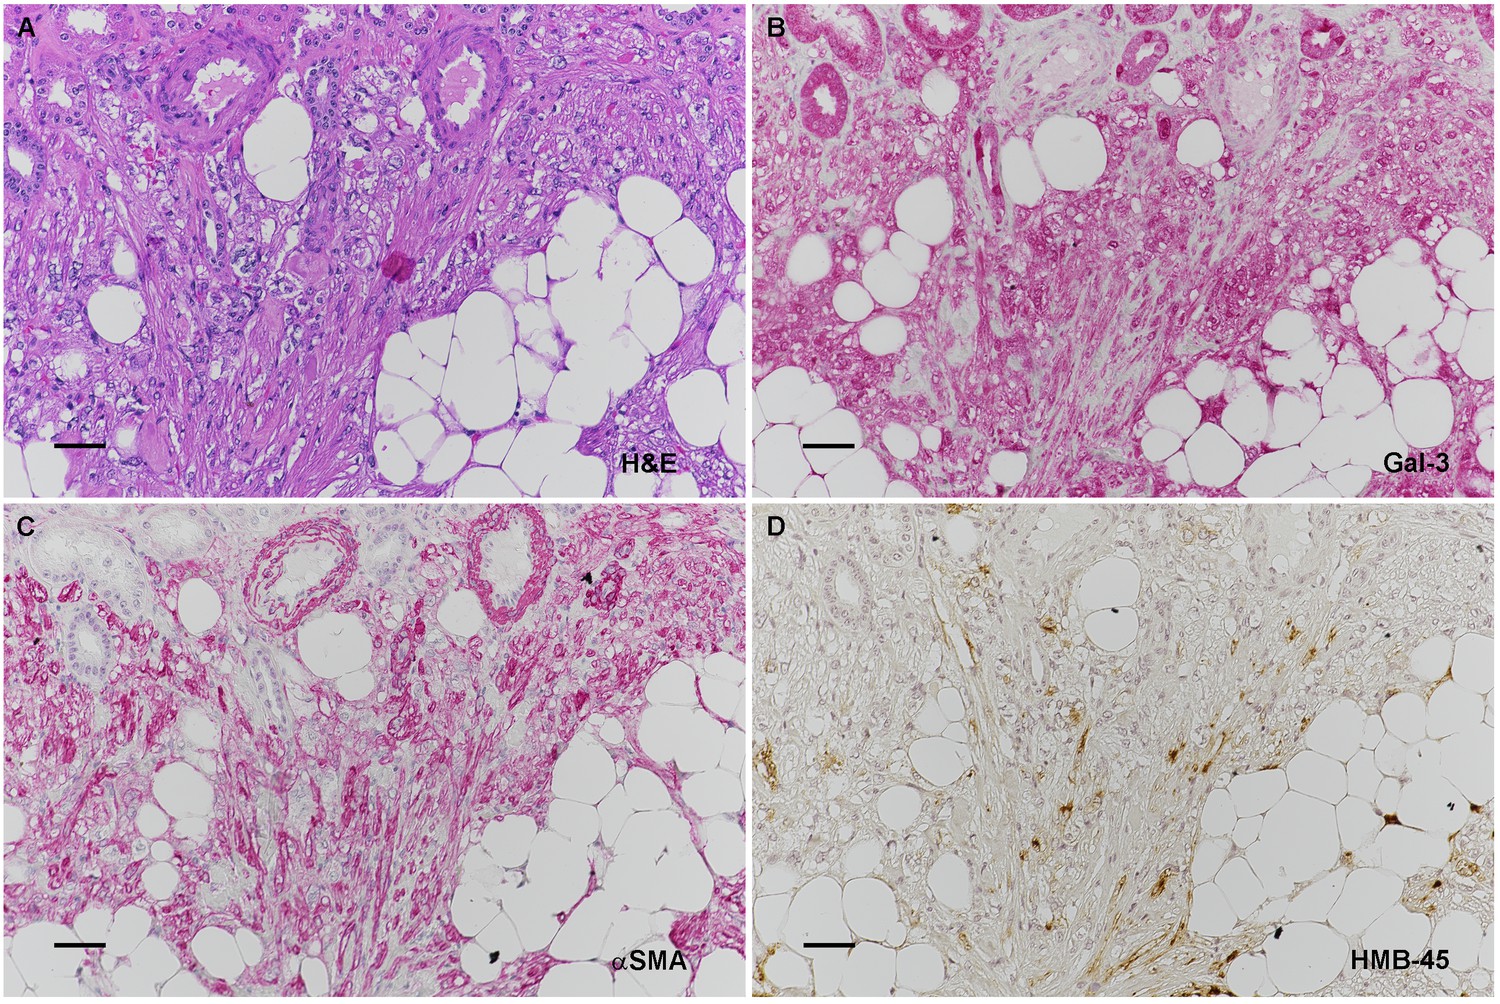
Galectin-3 expression AML tumor cells, as well as normal kidney.
Serial sections of a renal AML are shown in A-D. (A) H&E of AML. (B) Anti-Gal-3 at higher magnification. (C) Anti-αSMA showing positive smooth muscle AML cells. (D) Anti-HMB45 showing scattered positive staining characteristic of AML nodules. Scale bars: A-D = 0.025 mm.
Figure 6—figure supplement 3
No correlation of %FEV1 with Gal-3 serum levels in patients with proven LAM taking mTOR inhibitor.
Gal-3 serum levels of patients receiving mTOR inhibitor treatment plotted against %FEV1. Data show that for LAM patients (n = 72) taking mTOR inhibitor, no correlation of Gal-3 with %FEV1 was found (R=0.066, p=0.580).
Tables
Table 1
Numbers of mice with abnormalities in organs or upper chest (UC) based on serial MRI analysis of 6 Tsc2cKO mice at 4, 8, and 12 weeks of age to determine the onset of detectable hamartoma formation.
| Age | Kidney | Spleen | Liver | UC |
|---|---|---|---|---|
| 4 weeks | 1/6 | 0/6 | 0/6 | 3/6 |
| 8 weeks | 5/6 | 3/6 | 0/6 | 3/6 |
| 12 weeks | 6/6 | 5/6 | 1/6 | 5/6 |
Table 2
Gross and histopathological analysis of tumors present in 11 Tsc2cKO mice. Tumors were considered present by microscopic observation. The age range from mice in this group was 18–40 weeks with an average of 24 weeks. NL=normal, TA= tubular adenoma, VH= vascular hamartoma.
| Mouse | Kidney | Liver | Spleen | Paw |
|---|---|---|---|---|
| 1 | NL | VH | VH | NL |
| 2 | TA | VH | VH | VH |
| 3 | TA | VH | VH | VH |
| 4 | TA | VH | VH | VH |
| 5 | TA | VH | VH | VH |
| 6 | NL | NL | VH | VH |
| 7 | TA | VH | VH | VH |
| 8 | TA | VH | VH | VH |
| 9 | TA | NL | VH | VH |
| 10 | TA | NL | VH | VH |
| 11 | TA | VH | VH | VH |
| totals | 9/11 | 8/11 | 11/11 | 10/11 |
Table 3
Tsc2cKO mice were treated with either vehicle (n = 8) or 5 mg/kg sirolimus (n = 10) every other day for 30 days. Kidney, spleen, and paw were collected and analyzed by histological examination.
| Location | Vehicle | Sirolimus |
|---|---|---|
| Kidney | 4/8 | 0/10 |
| Spleen | 7/8 | 0/10 |
| Paw | 8/8 | 1/10 |
Download links
A two-part list of links to download the article, or parts of the article, in various formats.
Downloads (link to download the article as PDF)
Open citations (links to open the citations from this article in various online reference manager services)
Cite this article (links to download the citations from this article in formats compatible with various reference manager tools)
Tsc2 disruption in mesenchymal progenitors results in tumors with vascular anomalies overexpressing Lgals3
eLife 6:e23202.
https://doi.org/10.7554/eLife.23202


