A mutant with bilateral whisker to barrel inputs unveils somatosensory mapping rules in the cerebral cortex
- Sorbonne Universités, UPMC Univ Paris 06, INSERM, CNRS, Institut de la Vision, France
- University of Maryland School of Medicine, United States
- Friedrich Miescher Institute for Biomedical Research, Switzerland
- University of Basel, Switzerland
- Institut du Fer à Moulin, France
Figures
Figure 1 with 1 supplement
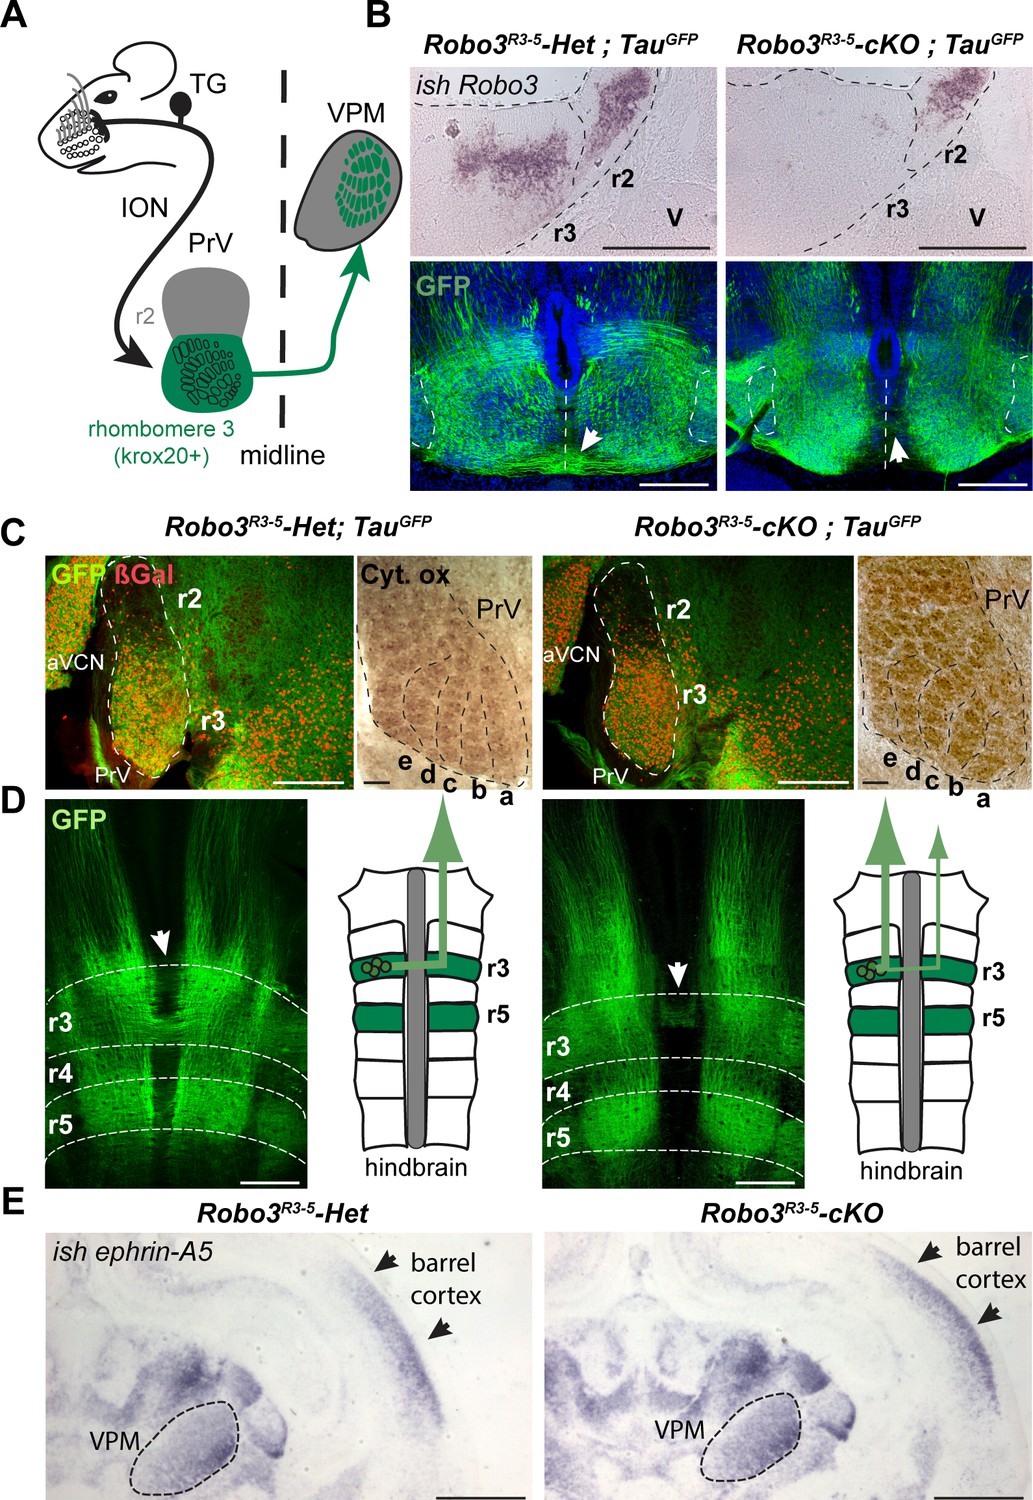
Rewiring of r3 and r5 derived hindbrain projections to midbrain/forebrain projections in Robo3R3-5-cKO mice.
(A) Schematic representation of the mouse whisker to barrel somatosensory pathway. (B) Top panels: in situ hybridization (ish) with a robo3 probe on coronal sections at rhombomeres 3 and 2 (r3, r2) level in E12 embryos. No staining is observed in Robo3R3-5-cKO mice in r3. Trigeminal ganglion (V) neurons do not express Robo3. Bottom panels: coronal sections at r3 level in E13 Robo3R3-5-Het;TauGFP or Robo3R3-5-cKO;TauGFP embryos stained for GFP. GFP+ commissures are strongly reduced in mutants, but a few axons still cross (arrows). (C) Cytochrome oxidase staining (Cyt. ox.), and ßGal, GFP co-immunostaining of coronal sections of P4 Robo3R3-5-Het;TauGFP or Robo3R3-5-cKO;TauGFP brains at the level of the brainstem principal trigeminal nucleus (PrV), showing the barrellettes. Rows a to e are indicated. The barrelette patterns and ßGal+ cell distribution are similar in control and Robo3R3-5-cKO mutant mice. aVCN: anterior ventral cochlear nucleus. (D) Flat-mount view and scheme of the hindbrain of E12 Robo3R3-5-Het;TauGFP or Robo3R3-5-cKO;TauGFP embryos. Commissures are strongly reduced at r3 and r5 levels in mutants but a subset of axons still cross in r3 (arrowheads). GFP+ axons still project rostrally towards the midbrain. (E) Coronal sections at the level of the forebrain VPM thalamic nucleus and barrel cortex of P0 controls or Robo3R3-5-cKO brains hybridized with an ephrin-A5 probe, showing the expression gradients of the molecule, which are unaffected by the conditional deletion of the Robo3. Scale bars are 400 µm, except ish and Cyt. ox. (100 µm) and (E) (500 µm).
Figure 1—figure supplement 1
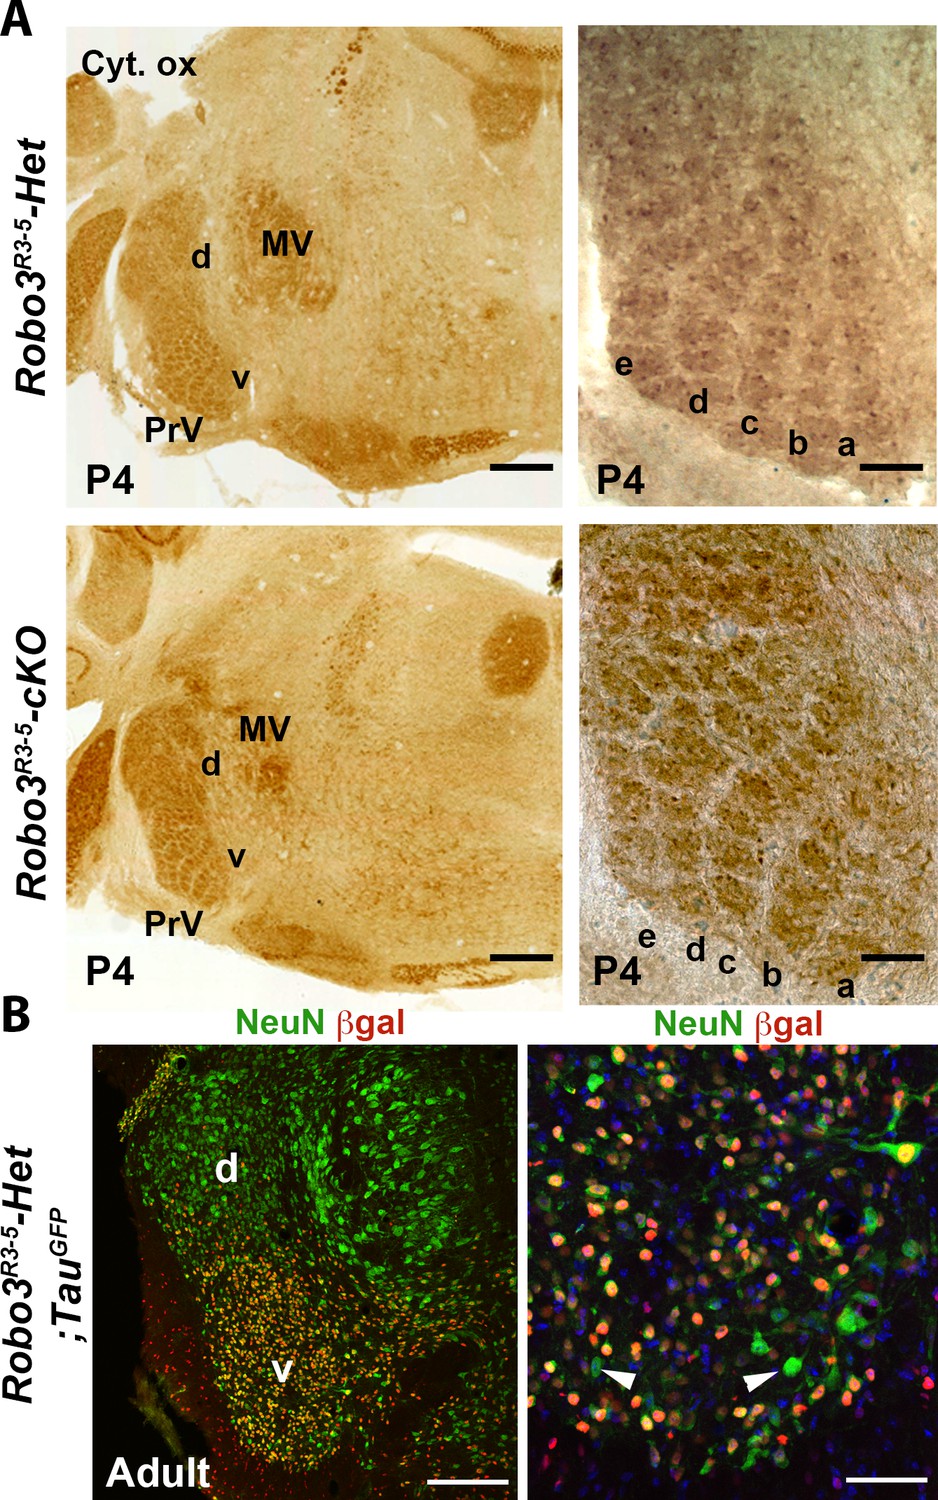
Normal organization of the principal trigeminal nucleus (PrV) in Robo3R3-5-cKO mice.
(A) Cytochrome oxidase staining of coronal sections of P4 brains at the level of the PrV, showing the barrellettes. Rows a to e are indicated. The barellette pattern is similar in control and Robo3R3-5-cKO mutant mice. MV: Trigeminal motor nucleus, d: dorsal PrV, v: ventral PrV. (B) Coronal sections at the level of the PrV in adult Robo3R3-5-Het;TauGFP, stained with anti NeuN and anti ßGal. ßGal- and NeuN+ cells can be found in the ventral PrV (arrowheads). Scale bars, 400 µm and 100 µm (A); 200 µm and 50 µm (B).
Figure 2 with 1 supplement

Organization of the projections to the VPM.
(A) Whole-mount immunostaining for GFP in Robo3R3-5-Het;TauGFP and Robo3R3-5-cKO;TauGFP P4 brains cleared with iDISCO. Dorsal projections (left) and lateral projections (right) are shown for each case. The trigemino-thalamic tract is color-coded in gray, with the rest of the GFP signal in green. (B) Coronal sections of P4 mouse brain through the sensory thalamus (VPM) stained for cytochrome oxidase. In Robo3R3-5-Het;TauGFP mice, GFP+ axons project to the barreloid area of the VPM. In Robo3R3-5-cKO;TauGFP mice, barreloids are found in two regions, a lateral region containing most of the GFP+ axons and a medial region (arrows) containing only a few patches of GFP axons. (C) P4 mice injected bilaterally with DiI and DiA at the level of the PrV nucleus. Sections were collected at the level of the VPM. In controIs, the PrV-VPM projection is entirely crossed. In mutants, the VPM receives bilateral inputs from the ipsilateral and contralateral PrV. (D) P4 hindbrain cross-sections at the level of the PrV in controls and mutants after unilateral injections of DiA and DiI in the VPM (depicted in the schematics). In controls, PrV trigemino-thalamic projection neurons are labeled by dye injected into the contralateral VPM. In mutants, the dorsal PrV also has only contralaterally labeled neurons, whereas the ventral PrV contains interspersed ipsilaterally and contralaterally labeled neurons. Scale bars are 300 µm.
Figure 2—figure supplement 1
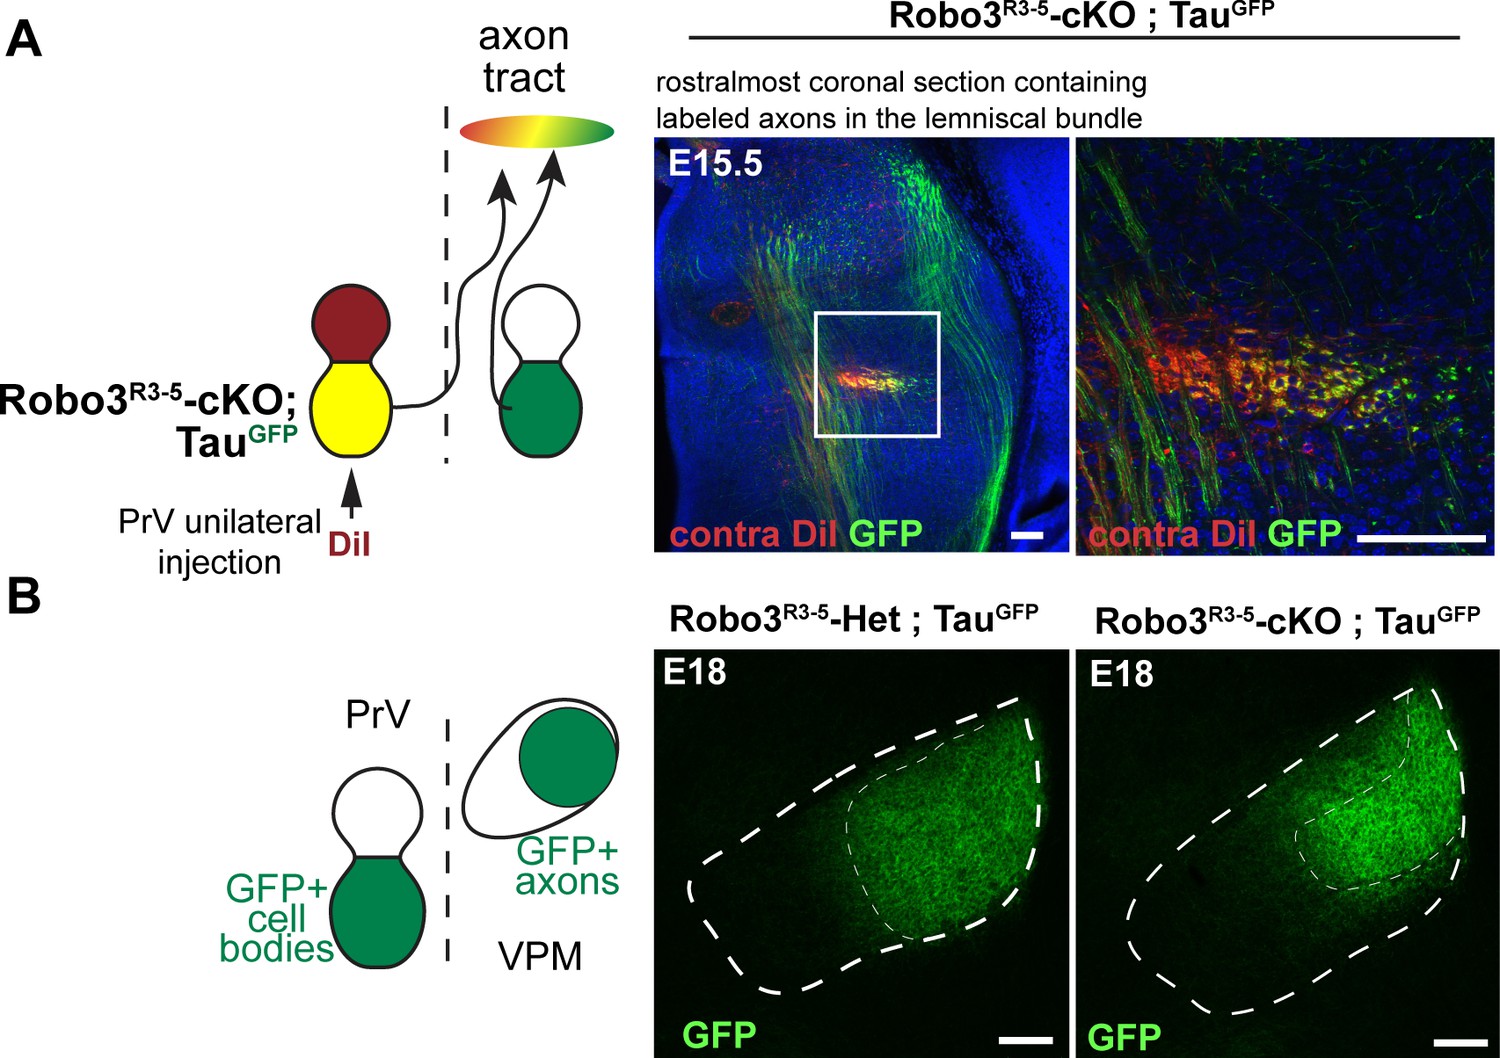
Tract organization and timing of arrival of ipsilateral and contralateral projections from the principal trigeminal nucleus (PrV) to the thalamus in the Robo3R3-5-cKO embryos.
(A) Coronal sections of E15.5 Robo3R3-5-cKO; tauGFP embryos (n = 3) at the rostral-most level where the axon bundle of the trigemino-thalamic tract (TT) is visible, in the developing thalamus. Contralateral projections from the PrV are labeled with DiI, and r3-PrV axons (ipsi and contra) are labeled with GFP. A medio-lateral gradient of DiI+, DiI+/GFP+ and GFP+ axons is seen in the tract, suggesting that contra- and ipsilateral axons are pre-organized in the tract before reaching the thalamus. Moreover, both contralateral and ipsilateral axons are seen at the end of the developing TT, suggesting no significant delay in development of the contralateral tract compared with the ipsilateral tract. (B) Coronal sections of E18 controls and Robo3R3-5-cKO; tauGFP embryos (n = 3) at the level of the VPM, shortly after the arrival of the TT axons from the PrV. In the mutants, GFP+ terminals in both the dense and sparse clusters are visible, suggesting that both ipsi- and contralateral populations of PrV axons are present early in the developing VPM. Scale bars are 100 µm.
Figure 3 with 1 supplement
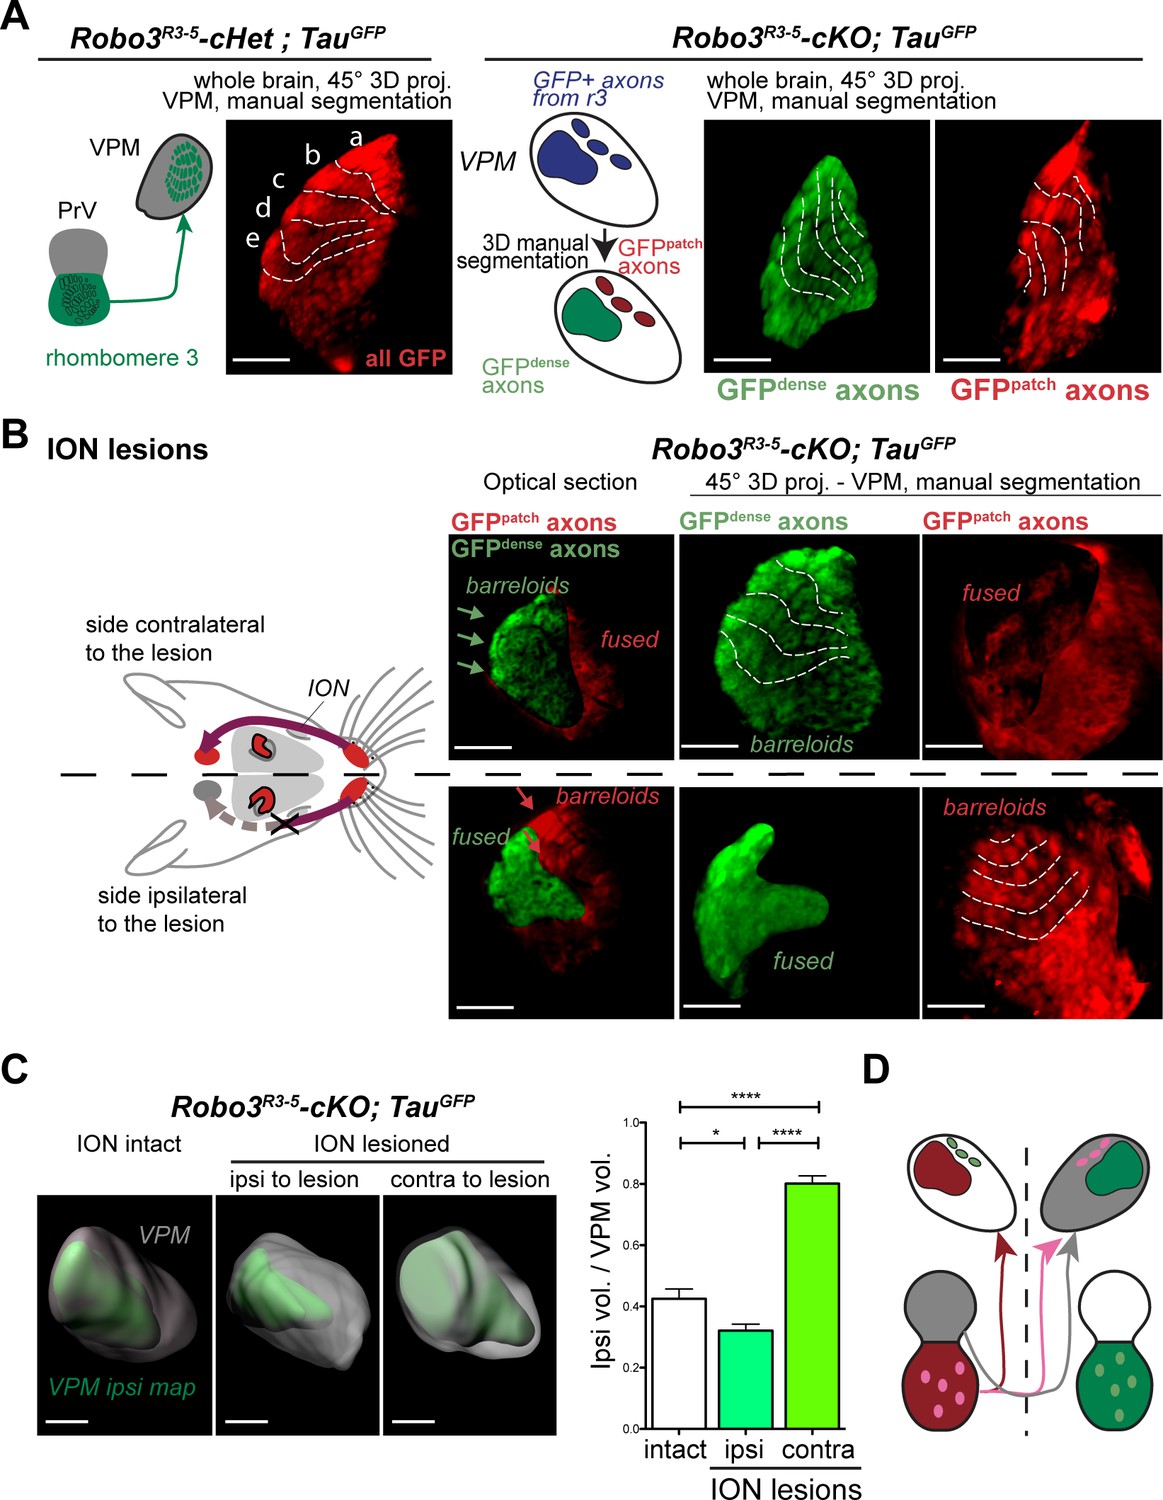
Structure of the VPM maps revealed by infraorbital nerve (ION) lesions.
Whole-mount scans of 3DISCO cleared P8 Robo3R3-5-Het;TauGFP and Robo3R3-5-cKO;TauGFP brains immunostained for GFP. Optical sections and 3D oblique projections are presented. (A) Control and mutant brains, ION intact. The oblique projection reveals the topographic barreloid organization in controls (left panels) or mutants (right panels). In the mutant, the dense and patched domains of GFP+ axons (green and red respectively) were manually segmented. (B) Mutant brains, unilateral ION lesions. The data are presented as in (A). On the side contralateral to the lesion, the barreloids in the patched projection map (red) are fused (n = 3), while the topographic organization of the barreloids in the dense GFP+ domain is still visible (green). The opposite is seen on the side ipsilateral to the lesion: the dense domain of GFP+ axons (green) reveals a fused map while rows of barreloids are visible in the patched domain (red). (C) Expansion and retraction of the VPM domains in P8 Robo3R3-5-cKO;TauGFP brains after lesions. (D) Model of the VPM organization in mutant mice deduced from the lesion experiments. Scale bars are 300 µm.
Figure 3—figure supplement 1

3D manual segmentation of the VPM and description of the projection plane.
(A) Detail of the projection plane used to reveal the VPM topography in whole-mount GFP labeled P8 brains cleared with 3DISCO. (B) Detail of the manual 3D color-coding used in Robo3R3-5-cKO;TauGFPmutant mice to highlight the different domains of the VPM, based on the pattern of GFP+ terminals (dense or patched). (C) Effect of a neonatal lesion of the infraorbital nerve (ION) in control Robo3R3-5-Het;TauGFPmice. Barreloids are visible on the side ipsilateral to the lesion, but not on the side contralateral where they are indicated as ‘fused’. Scale bars are 300 µm.
Figure 4
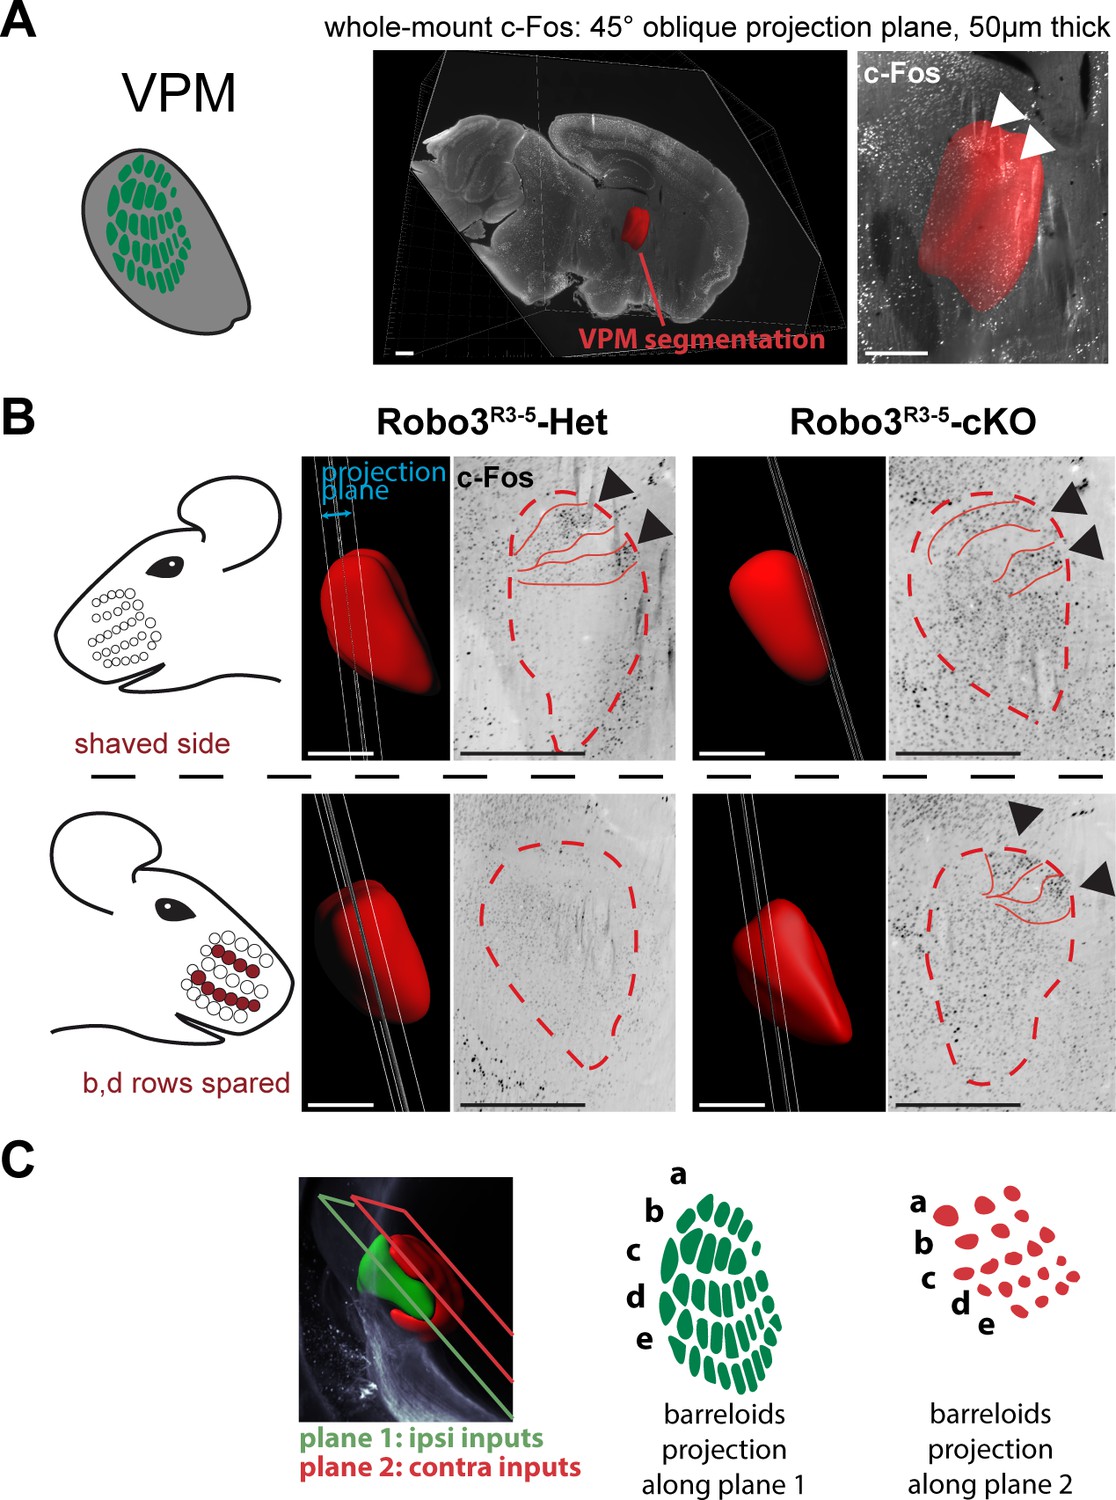
Bilateral inputs to the VPM in Robo3R3-5-cKO mice.
Whole brain iDISCO+ scans from adult mice immunolabeled for c-Fos. The whiskers were shaved on the left side, and b, d rows were spared on the right side. (A) Presentation of the projection plane used in the following panels: a 45° oblique (from both coronal and sagittal) 50 µm projection plane was positioned to intersect with the VPM annotation (in red). (B) Details of the c-Fos pattern in the VPM of Robo3R3-5-Het and Robo3R3-5-cKO mice on each side. In controls, two bands of c-Fos+ cells were seen on the side contralateral to the spared whiskers, revealing the b and d row barreloids. In Robo3R3-5-cKO mice, a dual band pattern in the VPM was seen on both sides of the brain. On the ipsilateral side, the bands were visible on the same intersecting plane as in the controls. On the contralateral side, the bands of activity were visible on a more medial plane, at the edge of the VPM annotation. (C) Representation of the VPM organization in the Robo3R3-5-cKO mice. Scale bars are 500 µm.
Figure 5 with 3 supplements
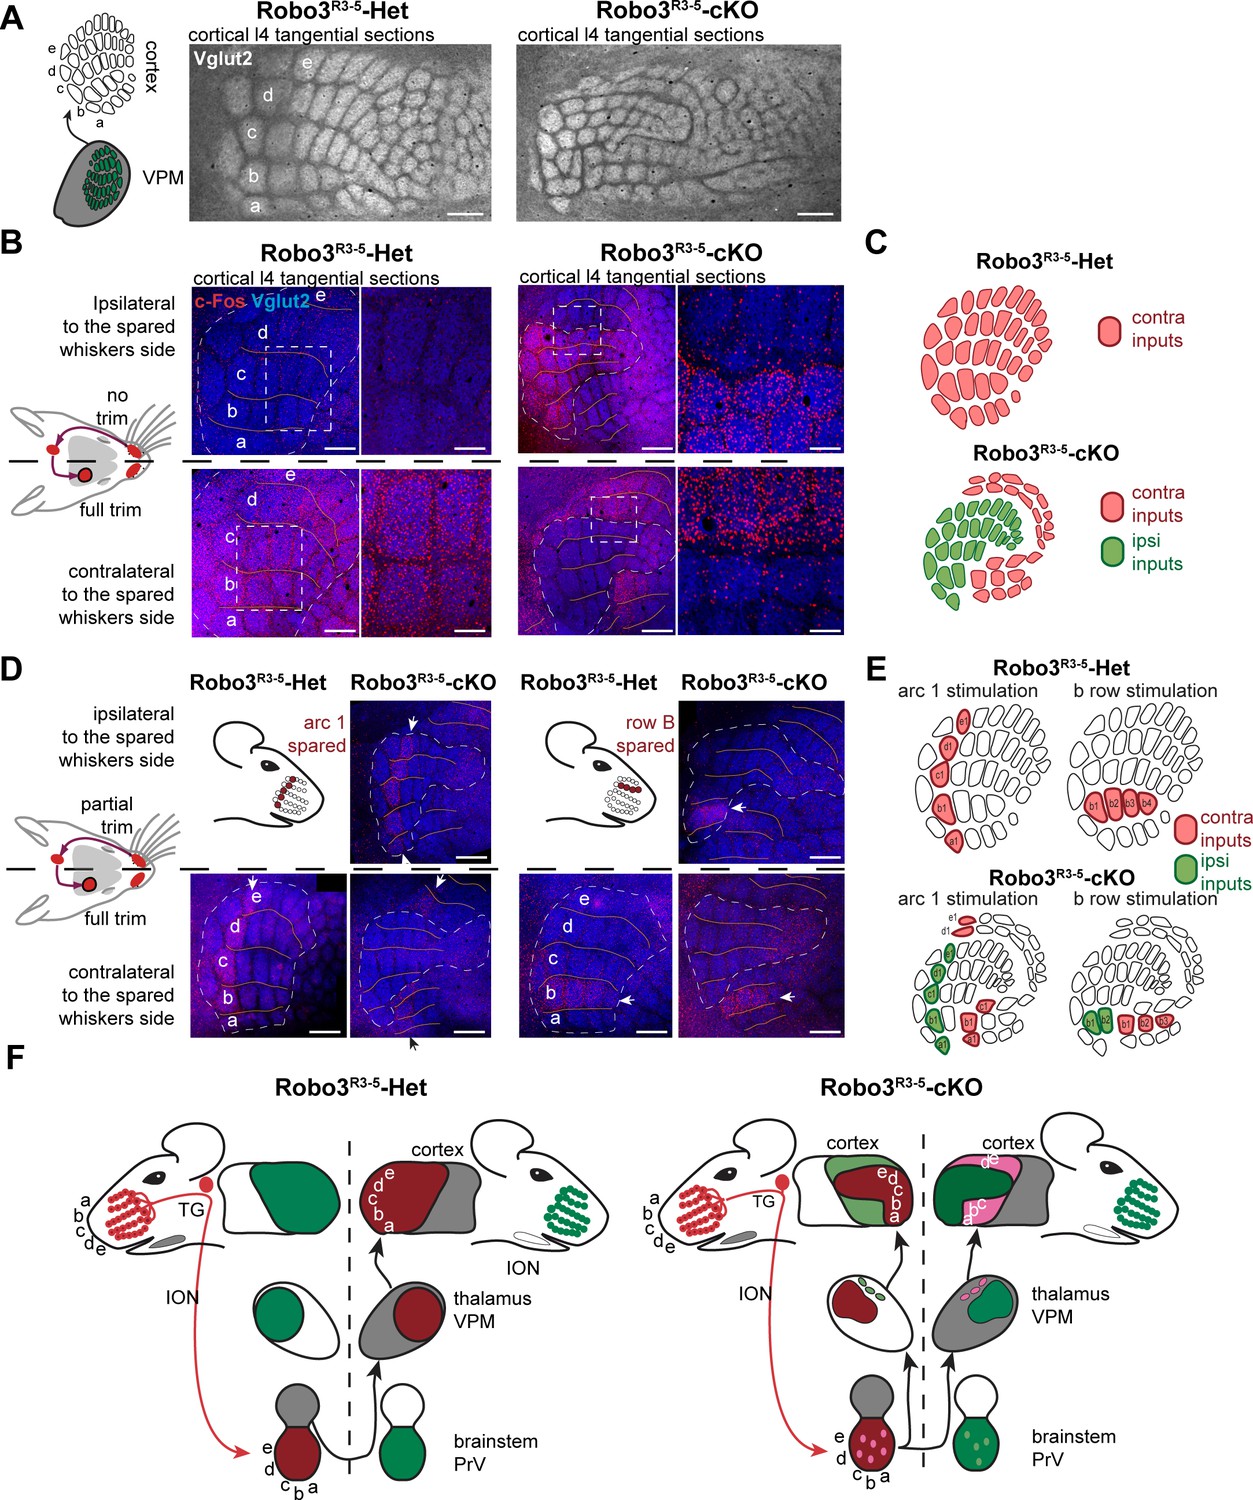
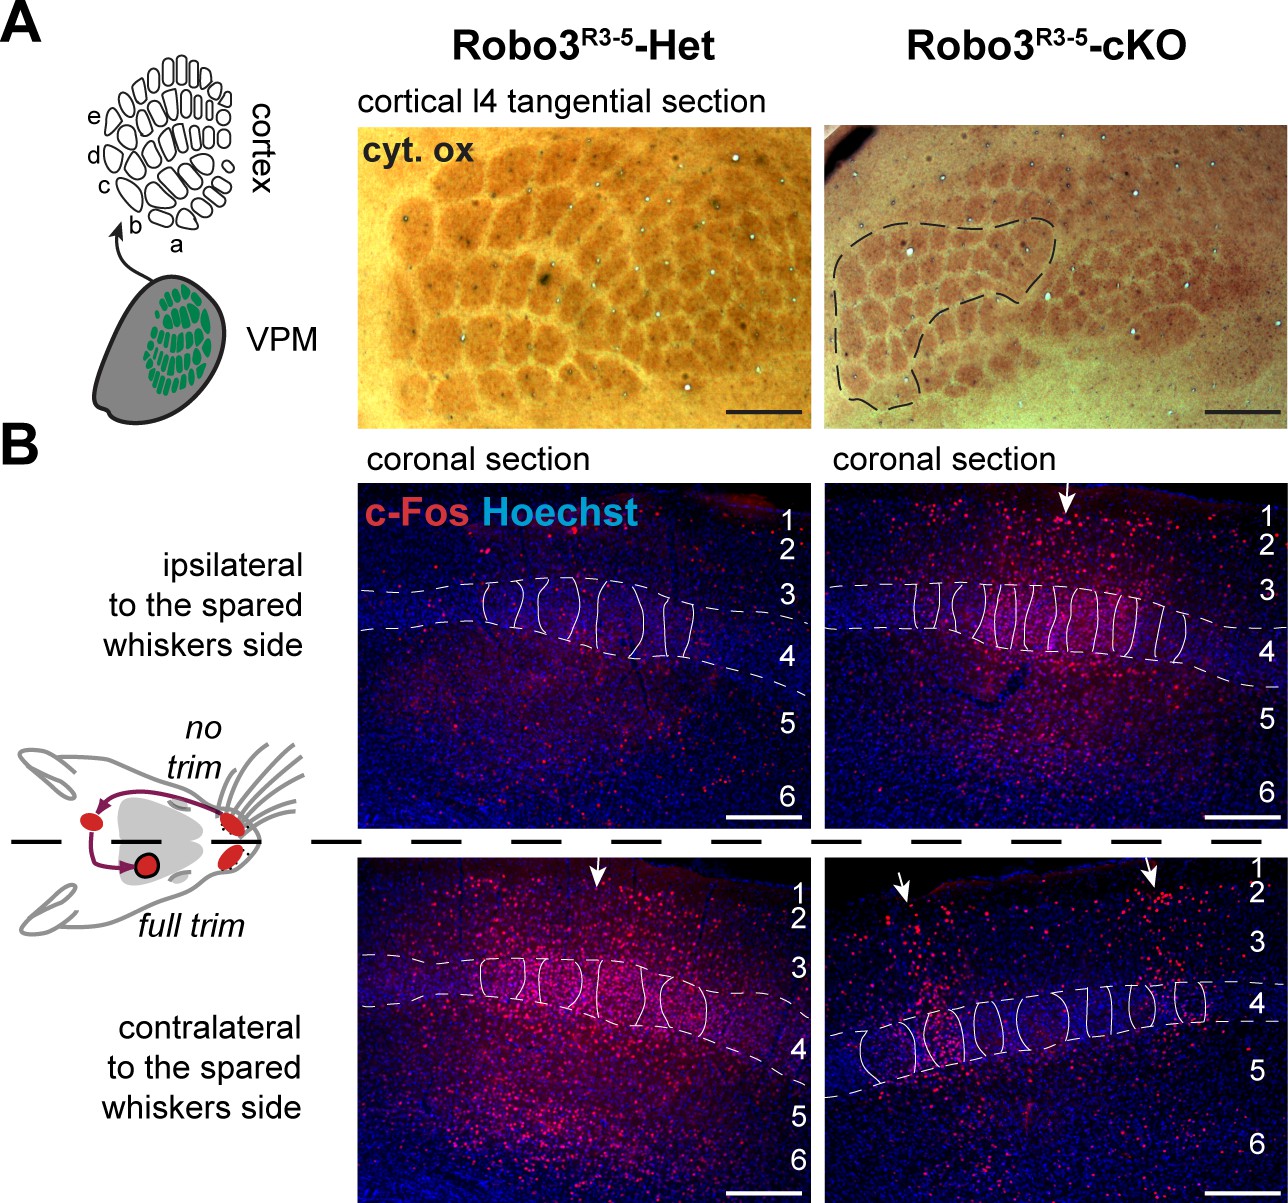
Bilateral inputs to the barrel cortex in Robo3R3-5-cKO mice.
(A) Tangential sections through the barrel cortex from P10 mice stained for anti-Vglut2. Barrels are more numerous and smaller in mutants. (B) Tangential sections through Flat-mounted cortices at the level of the barrel cortex in whisker-deprived adult mice immunostained for Vglut2 and c-Fos. In controls, c-Fos+ cell density is high in the barrel cortex contralateral to the intact whiskers and low on the ipsilateral side. In Robo3R3-5-cKO mutants, c-Fos expression is induced bilaterally in complementary domains on either side of the cortex, ipsilateral and contralateral to the stimulated side. (C) Interpretation of the results from (B). (D) Tangential sections through Flat-mounted cortices at the level of the barrel cortex, in whisker-deprived adult mice immunostained for Vglut2 and c-Fos. The left side of the face was fully shaved, while only the first arc (left panels) or b row (right panels) was spared on the right side. Only the contralateral sides are shown for controls. Mutants show bilateral patterns of c-Fos (E) Schematic representation of the whisker map deduced from c-Fos activation patterns. (F) General model for the wiring of the Robo3R3-5-cKO mutant mice. Scale bars are 200 µm.
Figure 5—figure supplement 1
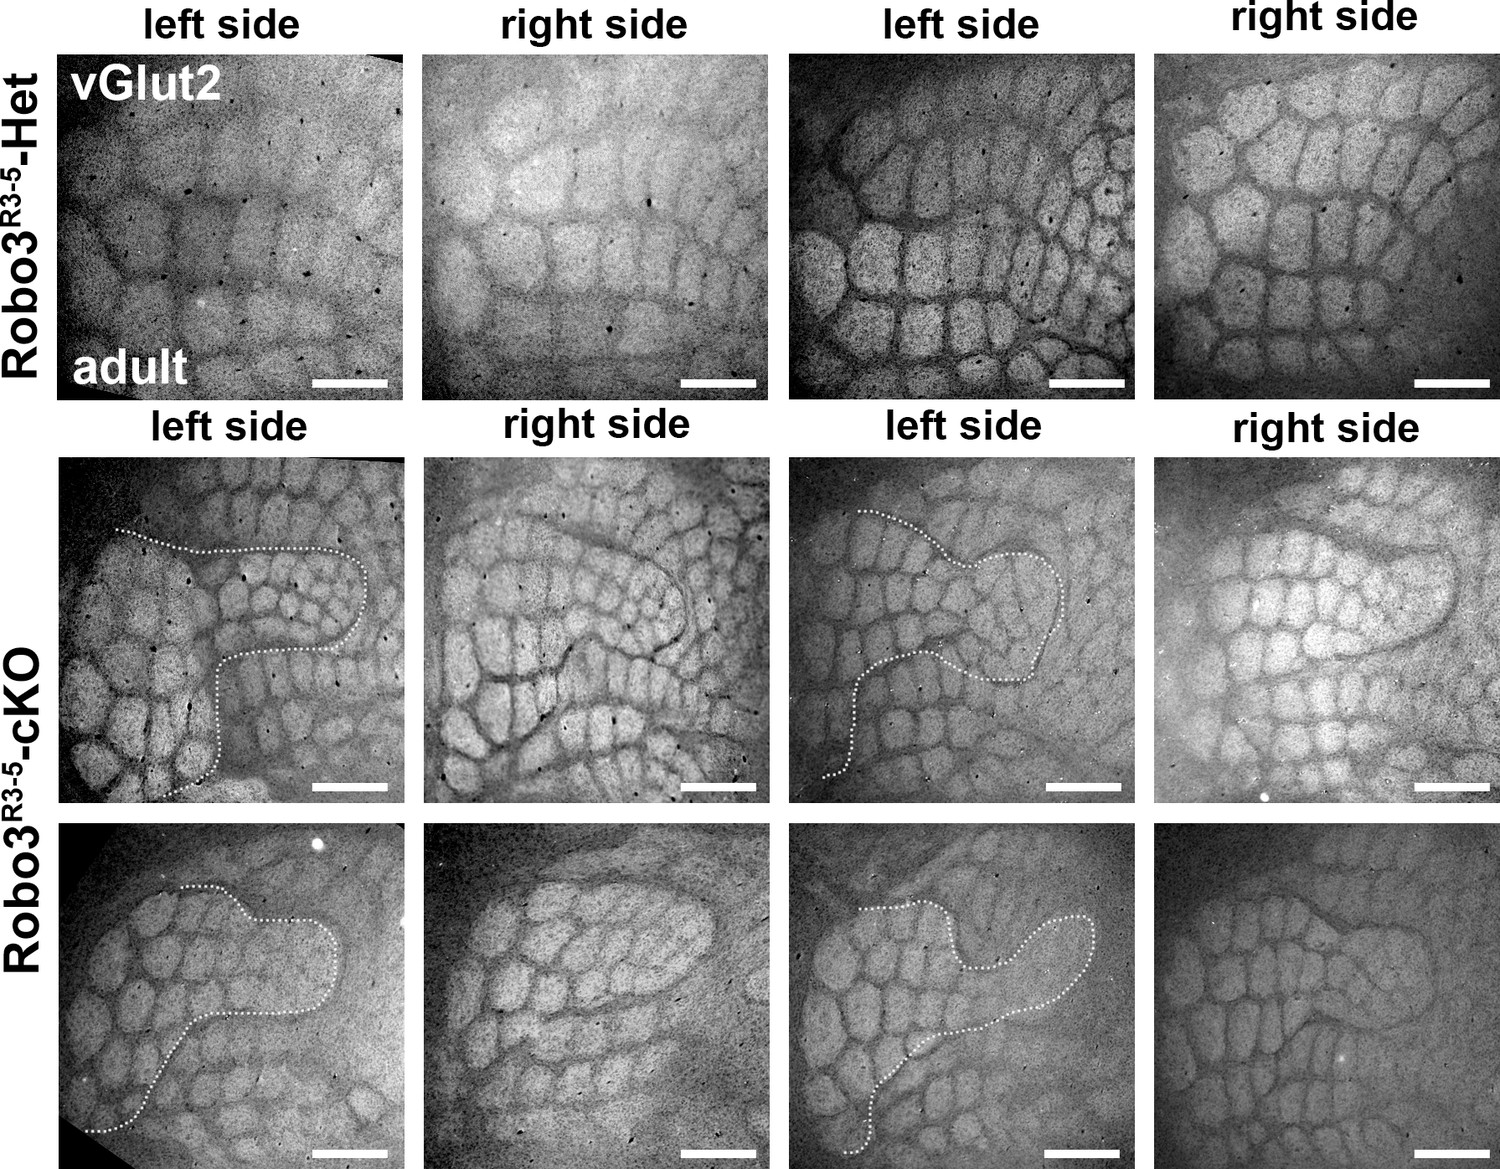
Comparison of the organization of the layer 4 of the Barrel Cortex across several adult mutant and controls.
Tangential sections through cortical layer 4 in adult flat-mounted cortices of control and Robo3R3-5-cKO mutant mice stained for Vglut2. Both left and right sides are shown. In mutant animals, the organization of the barrels is similar, but variations in the shape of the inner maps are seen from animal to animal, and also between left and right sides. Scale bars are 500 µm.
Figure 5—figure supplement 2
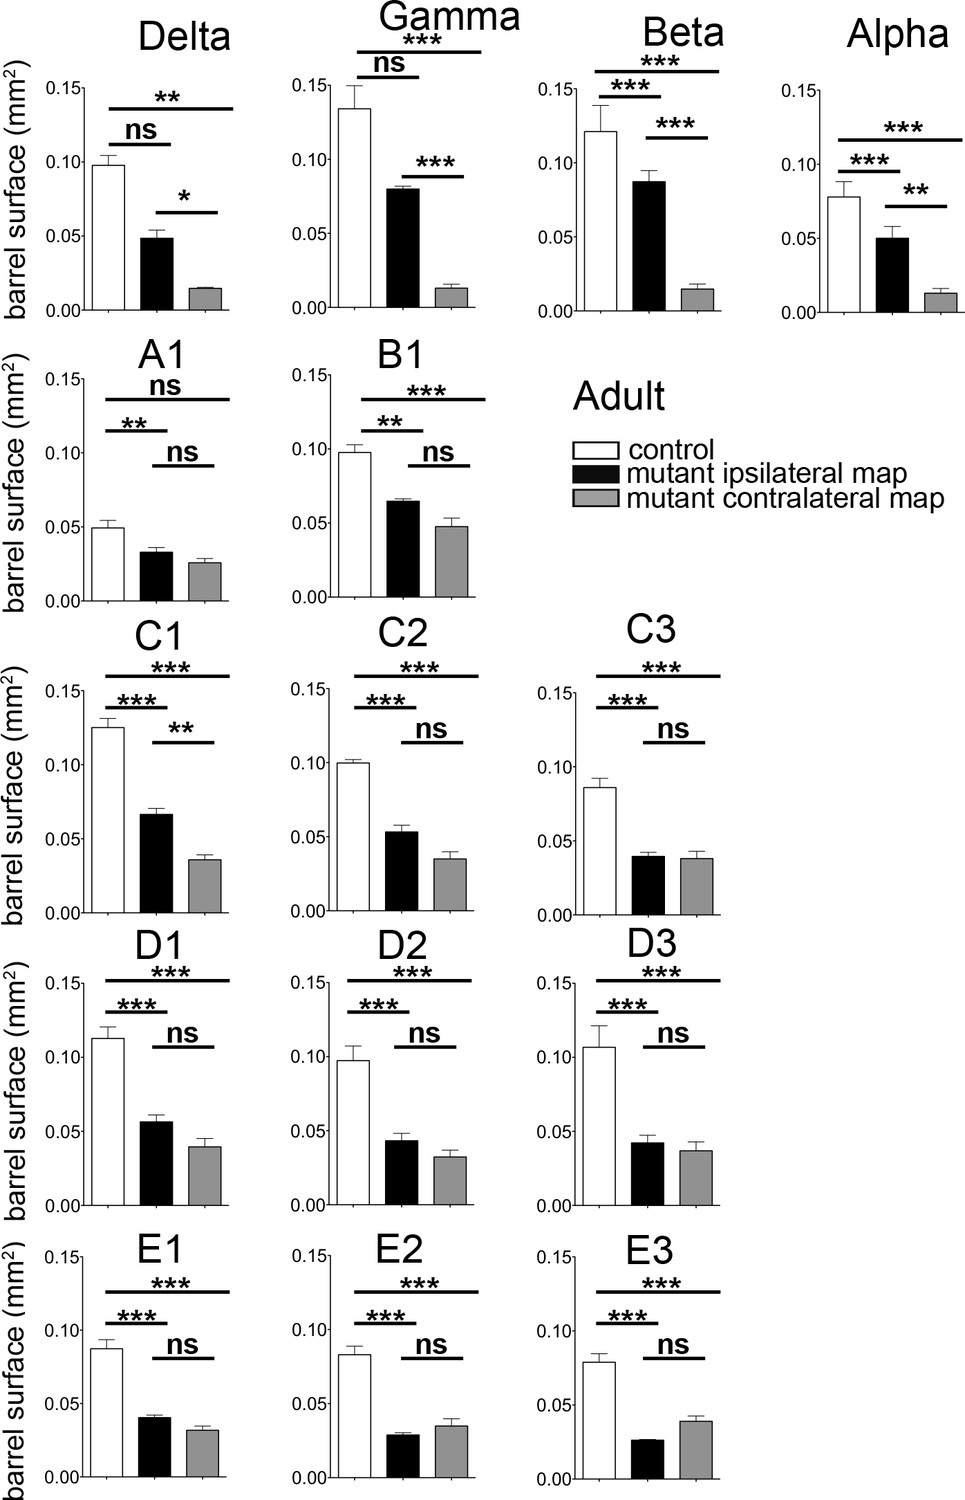
Quantification of the surface of the barrels from sections in adult controls and mutants.
Quantification of the surface of major barrels from tangential sections through cortical layer 4 in P30 control and Robo3R3-5-cKO mutant mice.
Figure 5—figure supplement 3
Quantification of the cross-section surface of individual barrels in cortical layer 4
(A) Tangential sections through cortical layer 4 in P10 flat-mounted cortices of control and Robo3R3-5-cKO mutant mice stained for cytochrome oxidase (Cyt.ox.). The black dashed outline shows the presence of two domains in the mutant map, delimited by a cytochrome oxidase-free band. (B) Coronal sections through adult brains at the level of the barrel cortex in whisker-deprived mice immunostained for c-Fos and Hoechst. Barrels in layer 4 are indicated. In controls, c-Fos+ cell density is high in the barrel cortex contralateral to the intact whiskers and low on the ipsilateral side. In Robo3R3-5-cKO mutants, c-Fos expression is induced bilaterally in complementary domains on either side of the cortex, ipsilateral and contralateral to the stimulated side. Of note, the bilateral activation of c-Fos in mutants is visible across all cortical layers. Scale bars are 200 µm.
Figure 6
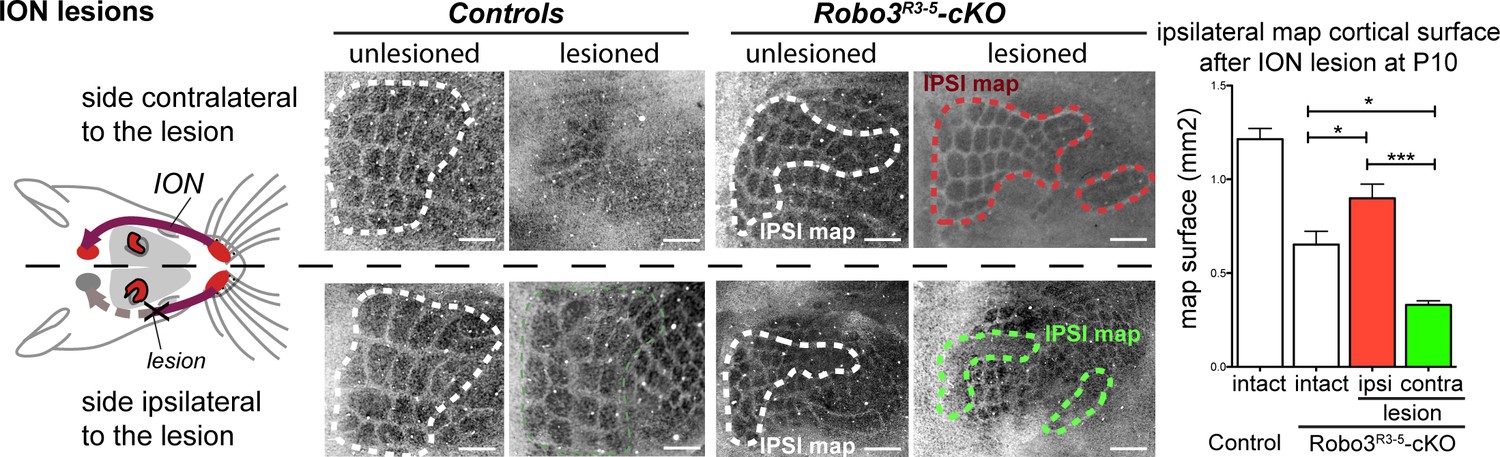
Activity-dependent competition between ipsilateral and contralateral inputs in mutant barrel cortex.
Tangential sections of controls or Robo3R3-5-cKO flat-mounted P10 cortices stained for cytochrome oxidase in control conditions or after unilateral lesion of the infraorbital nerve (ION) at P1. In Robo3R3-5-Het controls, the barrels do not form in S1 contralateral to the lesion, whereas a normal map is seen on the ipsilateral side. In Robo3R3-5-cKO mutants, contralateral to the lesion, barrels form in the domain processing ipsilateral inputs, and ipsilateral to the lesion , a barreless region is noted in the domain processing ipsilateral inputs. The size of the ipsilateral map is indicated to compare with the maps in unlesioned mutants and controls. Quantification of the surface occupied by the large whisker barrels is shown on the right side. Scale bars are 200 µm.
Figure 7 with 1 supplement
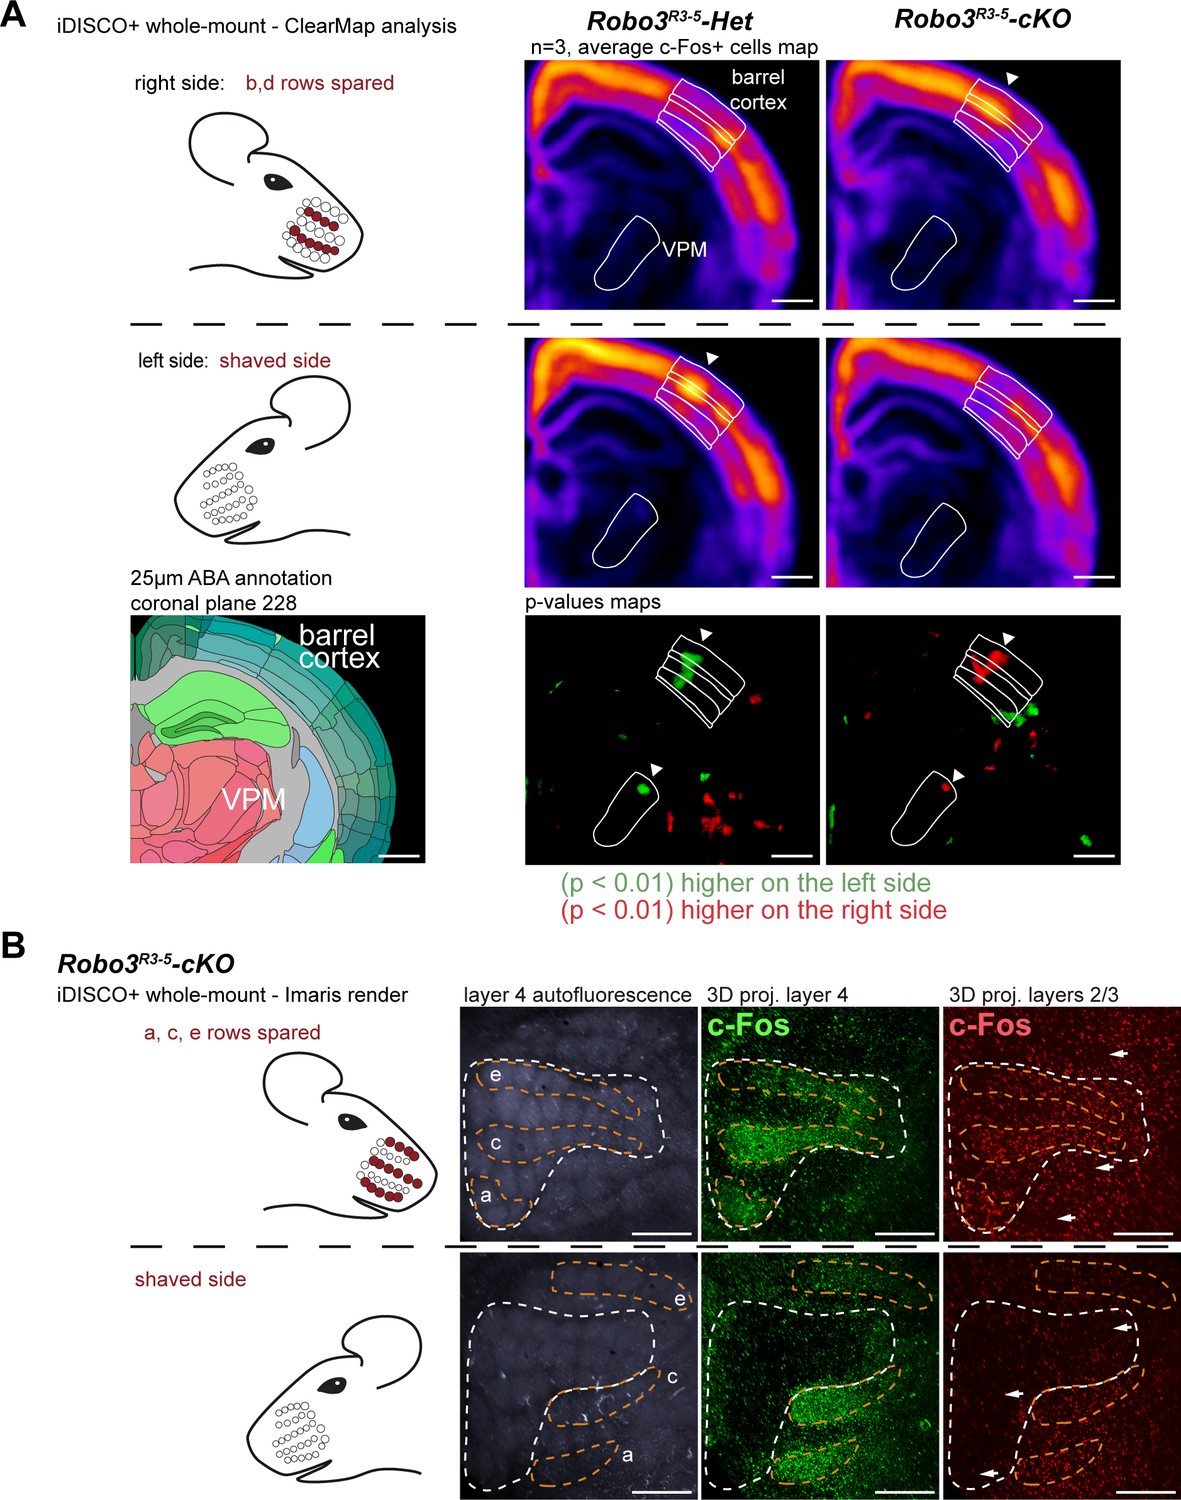
Cortical integration of sensory information.
(A) ClearMap analysis of the c-Fos patterns in iDISCO+ cleared brains in control and mutant mice after 1 hour of exploration of a new environment (n = 3 for each group). The whiskers were shaved on the left side, and b, d rows were spared on the right side. Heatmaps present averaged c-Fos+ cell densities on both sides for three brains for each group, and the p-value maps present the statistically different voxels between the left and right sides, in green when the left side is more active, in red when the right side is more active. At the level of the barrel cortex, as expected, activation was reversed between control and mutant maps in both the VPM and cortex, at the level of the d row (arrowheads). (B) iDISCO+ whole-mount c-Fos immunostaining and imaging of adult brains after unilateral stimulation of the rows a, c and e, manually segmented by cortical layers. The pattern in the lower right panel shows spread of c-Fos+ cells between active rows, but no spill-over of activity from the contralateral map to the adjacent ipsilateral map (arrows show blank rows in layers 2/3). Scale bars are 400 µm.
Figure 7—figure supplement 1
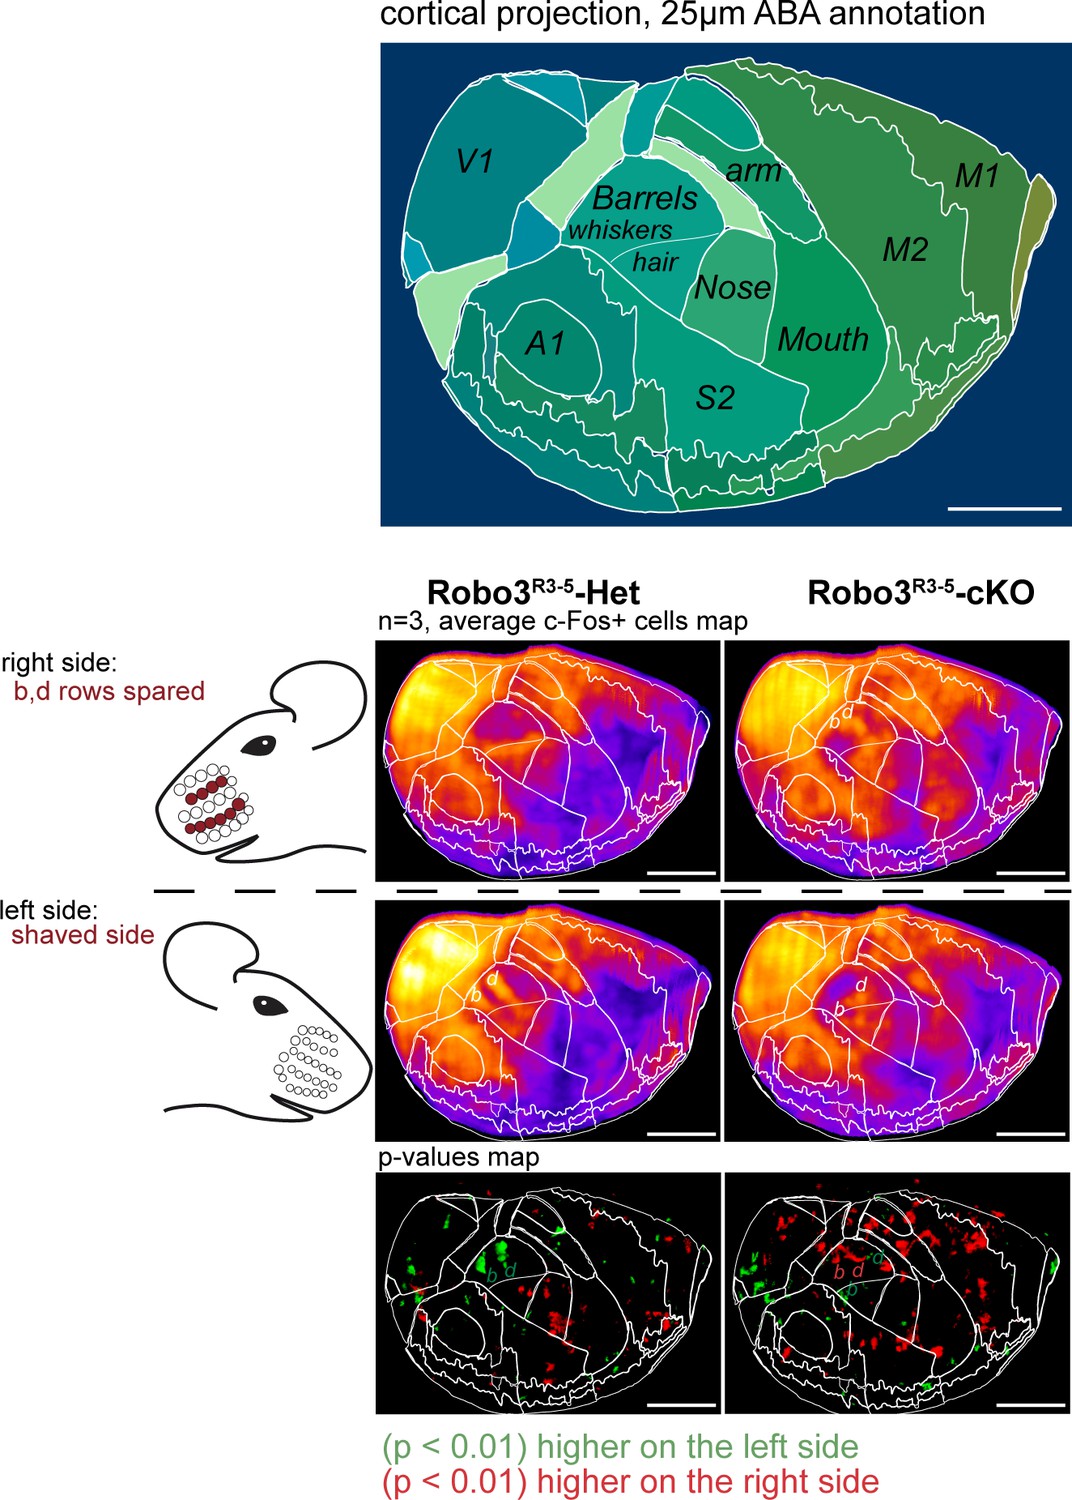
Cortical neuronal activity elicited by an exploration task in adult control and mutants mice.
ClearMap analysis of the c-Fos patterns in iDISCO+ cleared brains in control and mutant mice after 1 hour of exploration of a new environment (n = 3 for each group). Projections of the dorsal cortex are shown. The mice whiskers were shaved on the left side, and b, d rows were spared on the right side. Heatmaps present averaged c-Fos+ cell densities on both sides for three brains for each group, and the p-value maps present the statistically different voxels between the left and right sides, in green when the left side is more active, in red when the right side is more active. Scale bars are 2 mm.
Videos
Video 1
Rhombomere 3 projections from the brainstem to the VPM.
Whole-mount immunostaining for GFP in Robo3R3-5-Het;TauGFP P4 brains cleared with 3DISCO. The GFP is shown in green, and the trigemino-thalamic tract is color-coded in gray.
Video 2
Segmentation of the VPM in Robo3R3-5-Het;TauGFP mutants.
Whole-mount immunostaining for GFP in Robo3R3-5-Het;TauGFP P8 brains cleared with 3DISCO. The GFP dense cluster is segmented in green, and the GFP+ patches are color-coded in red.
Download links
A two-part list of links to download the article, or parts of the article, in various formats.
Downloads (link to download the article as PDF)
Open citations (links to open the citations from this article in various online reference manager services)
Cite this article (links to download the citations from this article in formats compatible with various reference manager tools)
A mutant with bilateral whisker to barrel inputs unveils somatosensory mapping rules in the cerebral cortex
eLife 6:e23494.
https://doi.org/10.7554/eLife.23494


