Functional mapping of yeast genomes by saturated transposition
- ETH Zurich, Switzerland
- University of Fribourg, Switzerland
Figures
Figure 1 with 3 supplements

Principle of the method.
(A) Outline of the experimental procedure. Left, the transposon (green) can insert either into non-essential DNA (blue) and give rise to a clone, or into essential DNA (orange), in which case no clone is formed. Right, procedure to identify transposon insertion sites by deep-sequencing. (B) Profile of the transposon density across the whole genome, when the transposon original location is either a centromeric plasmid (top) or the endogenous ADE2 locus on chromosome XV (bottom). The dashed lines indicate the chromosome centromeres. (C) Six examples of genomic regions and their corresponding transposon coverage in seven independent transposon libraries of indicated genotypes. Each vertical grey line represents one transposon insertion event. Genes annotated as essential are shown in orange, others in blue. Green arrowheads indicate the places where the absence of transposon coverage coincides with an essential gene. (D) Histogram of the number of transposons found in every annotated gene (CDS). The vertical dashed line is the median of the distribution. (E) Same as D, with genes categorized as non-essential (blue) and essential (orange) according to previous annotations.
Figure 1—figure supplement 1
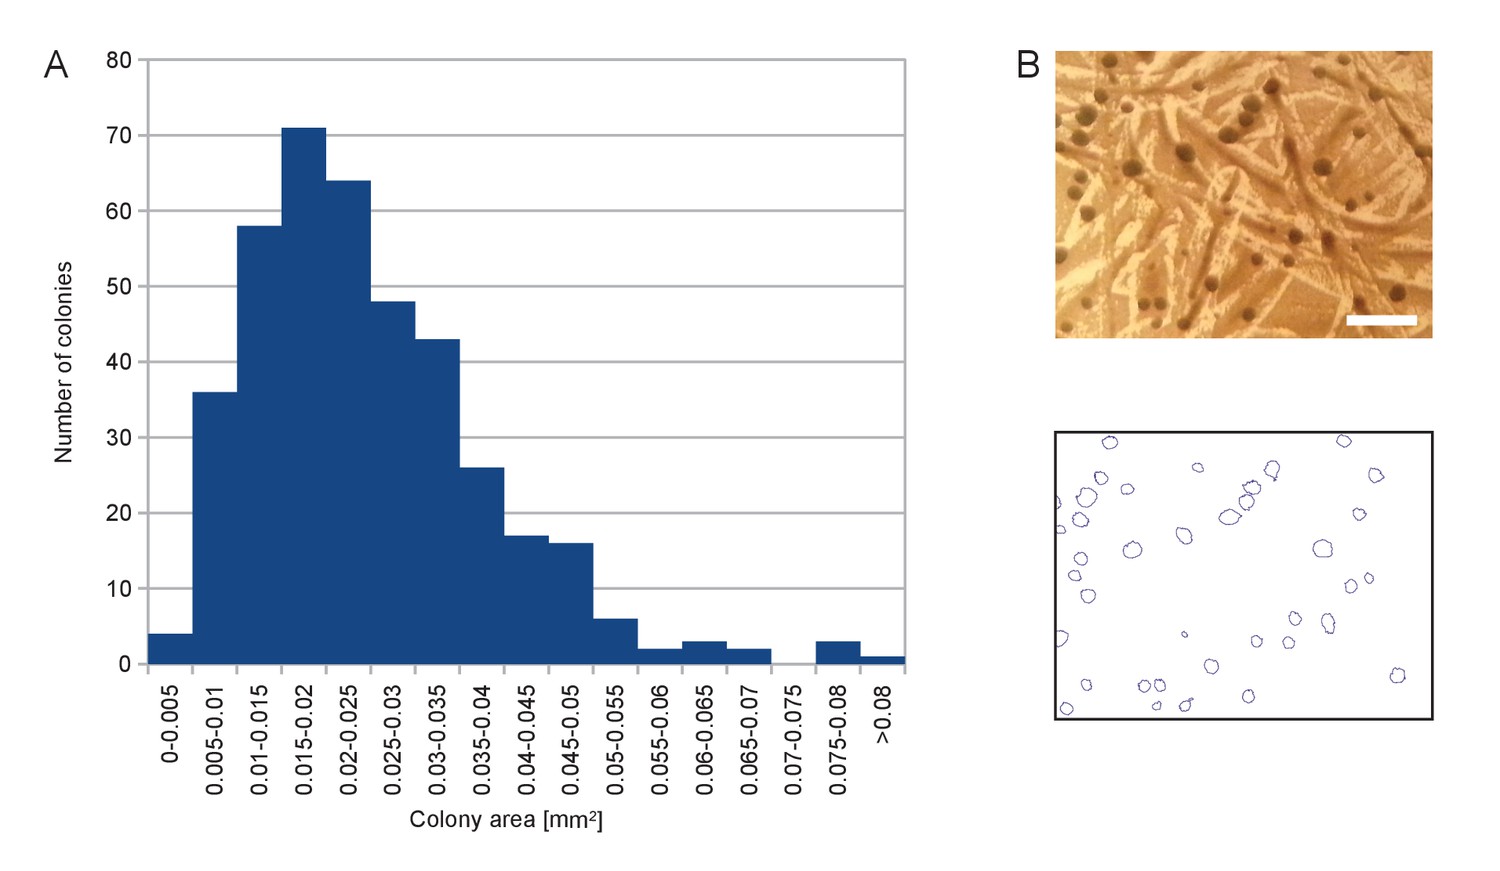
Size distribution of the colonies appearing on SD +Galactose -Ade.
(A) Histogram of colony area for a randomly chosen sample of 402 colonies. (B) Example of picture of colonies (top) and segmentation thereof (bottom) used to calculate histogram in (A). Scale bar, 1 mm.
Figure 1—figure supplement 2
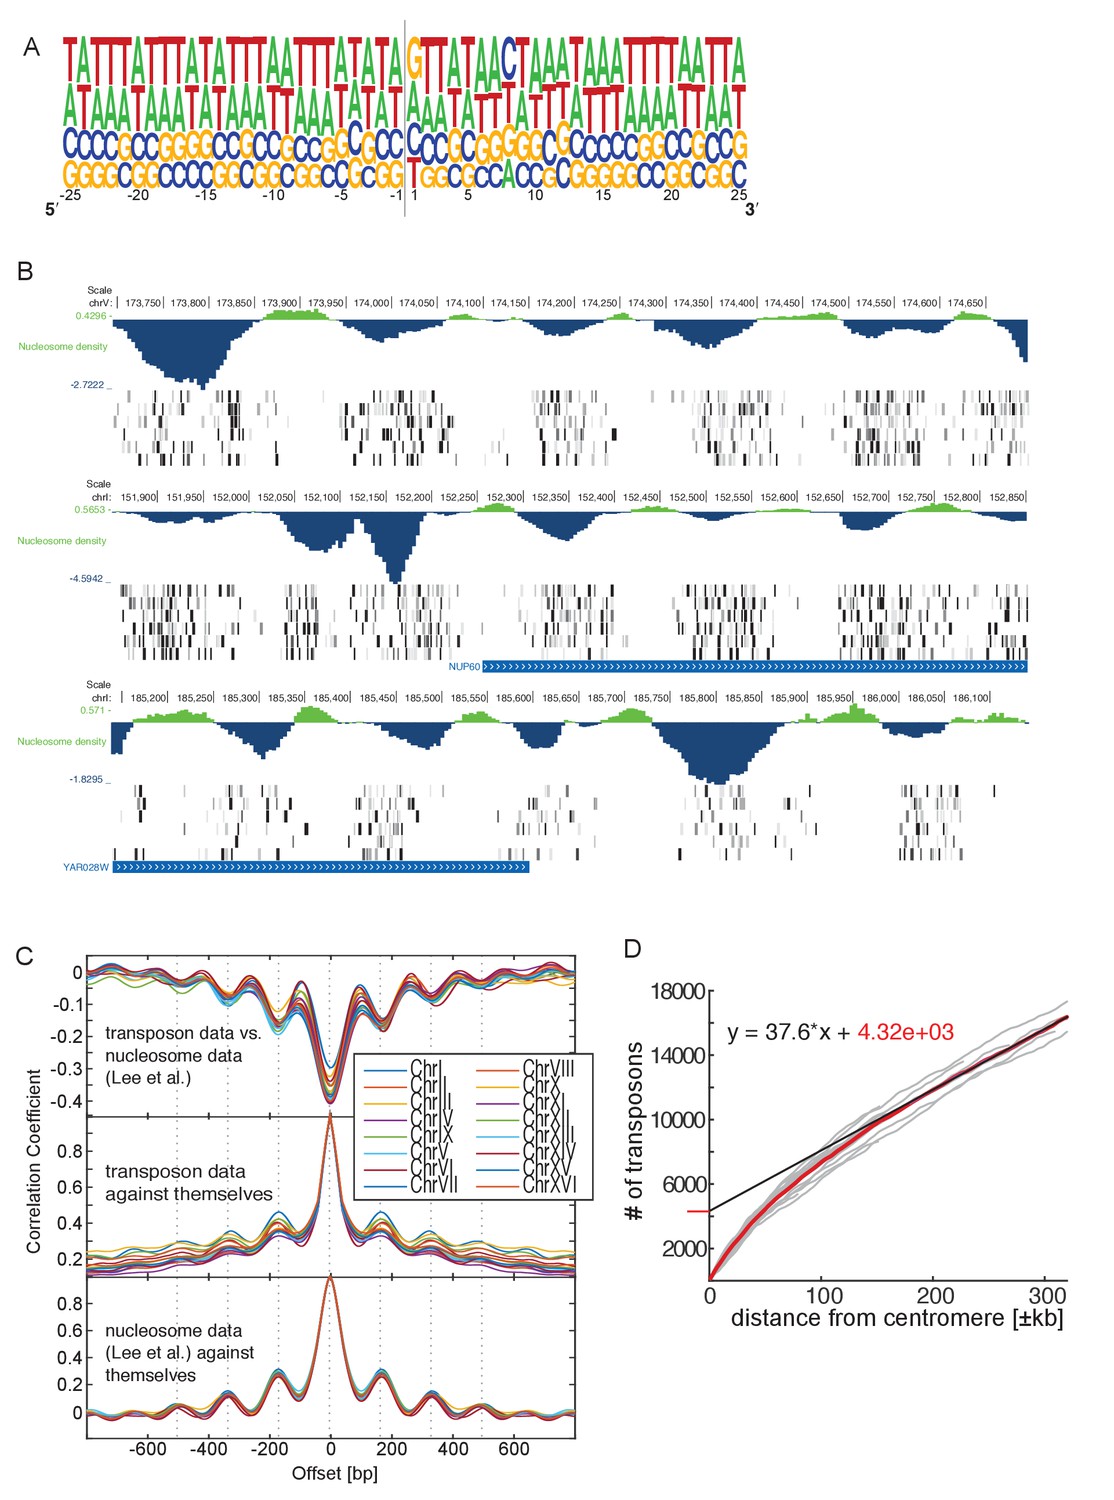
Genome-wide analysis of transposon insertion sites.
(A) Frequency plot of nucleotide composition around transposon insertion site. The strand is determined according to the orientation of the transposon insertion. Plot was calculated with a random sample of 50,000 transposon in the wild-type library 1. Note that GC-content of the yeast genome is 38%. (B) Preferential transposon insertion into internucleosomal DNA. Three genomic regions are shown. For each, the top panel shows the nucleosomal density as determined in (Lee et al., 2007), and the bottom panels show transposon insertion as in Figures 2–5. (C) Correlation analysis of nucleosome and transposon density. Transposon densities were calculated on the wild-type library 1 by averaging transposon number within a 40 bp moving average. Top, correlation coefficient calculated between the nucleosome and the transposon data offset by the indicated number of bp. The correlation is most negative when offset = 0. The periodicity is ~160 bp. Middle, autocorrelation of transposon data. The periodicity is identical as above. Bottom, autocorrelation of the nucleosome density data. The periodicity is identical as above. (D) Analysis of transposon number relative to distance from centromere. For each chromosome, the number of transposons mapping within a certain distance from their respective centromere was computed and plotted (grey lines). The number of transposons increases linearly with the distance, except in the vicinity of the centromere, where transposon enrichment can be observed. The intercept of the linear regression, computed on the linear part of the plot and multiplied by 16 chromosomes, gives a rough estimate of the numbers of transposons enriched at pericentromeric regions (~20% of the total transposon number).
Figure 1—figure supplement 3
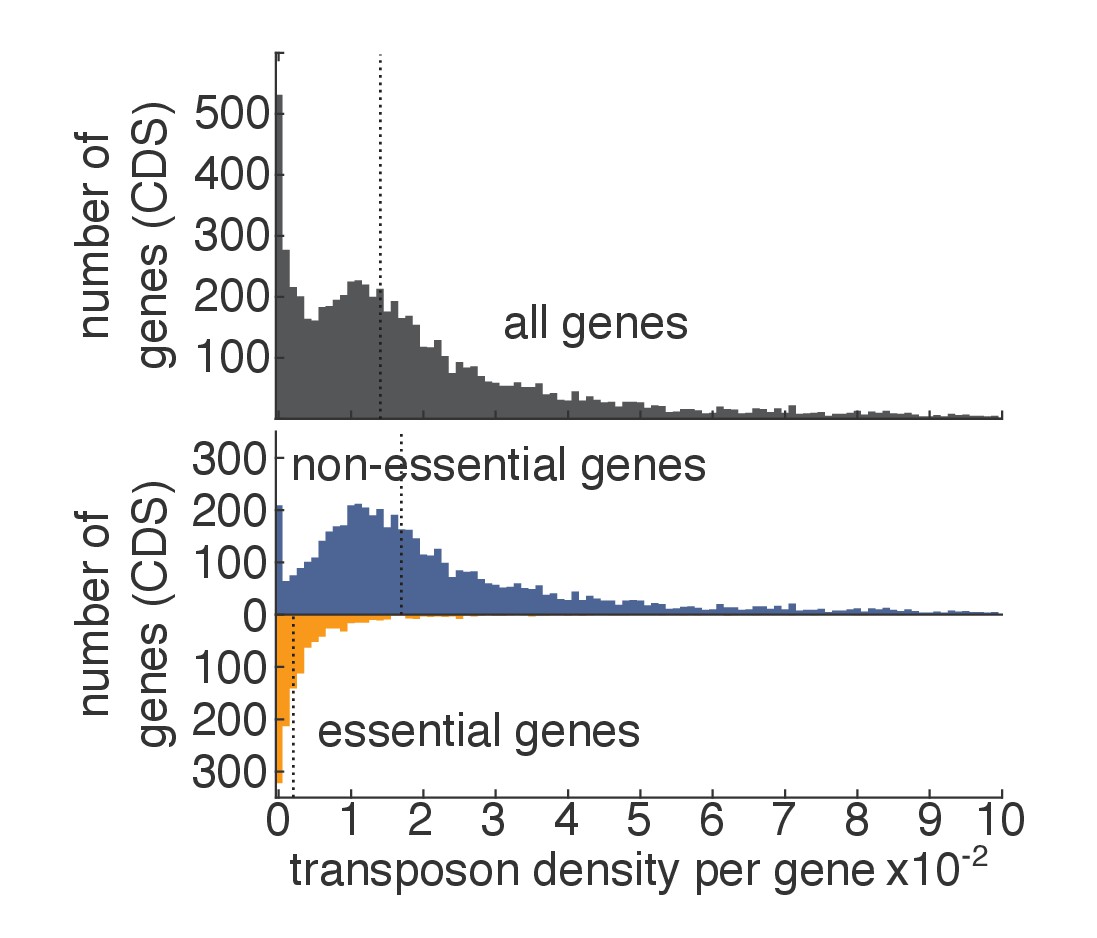
Transposon density in essential and non-essential genes.
As in Figure 1D–E, except that, for each gene, the transposon density (i.e. number of transposons divided by length of the gene) is shown.
Figure 2 with 5 supplements
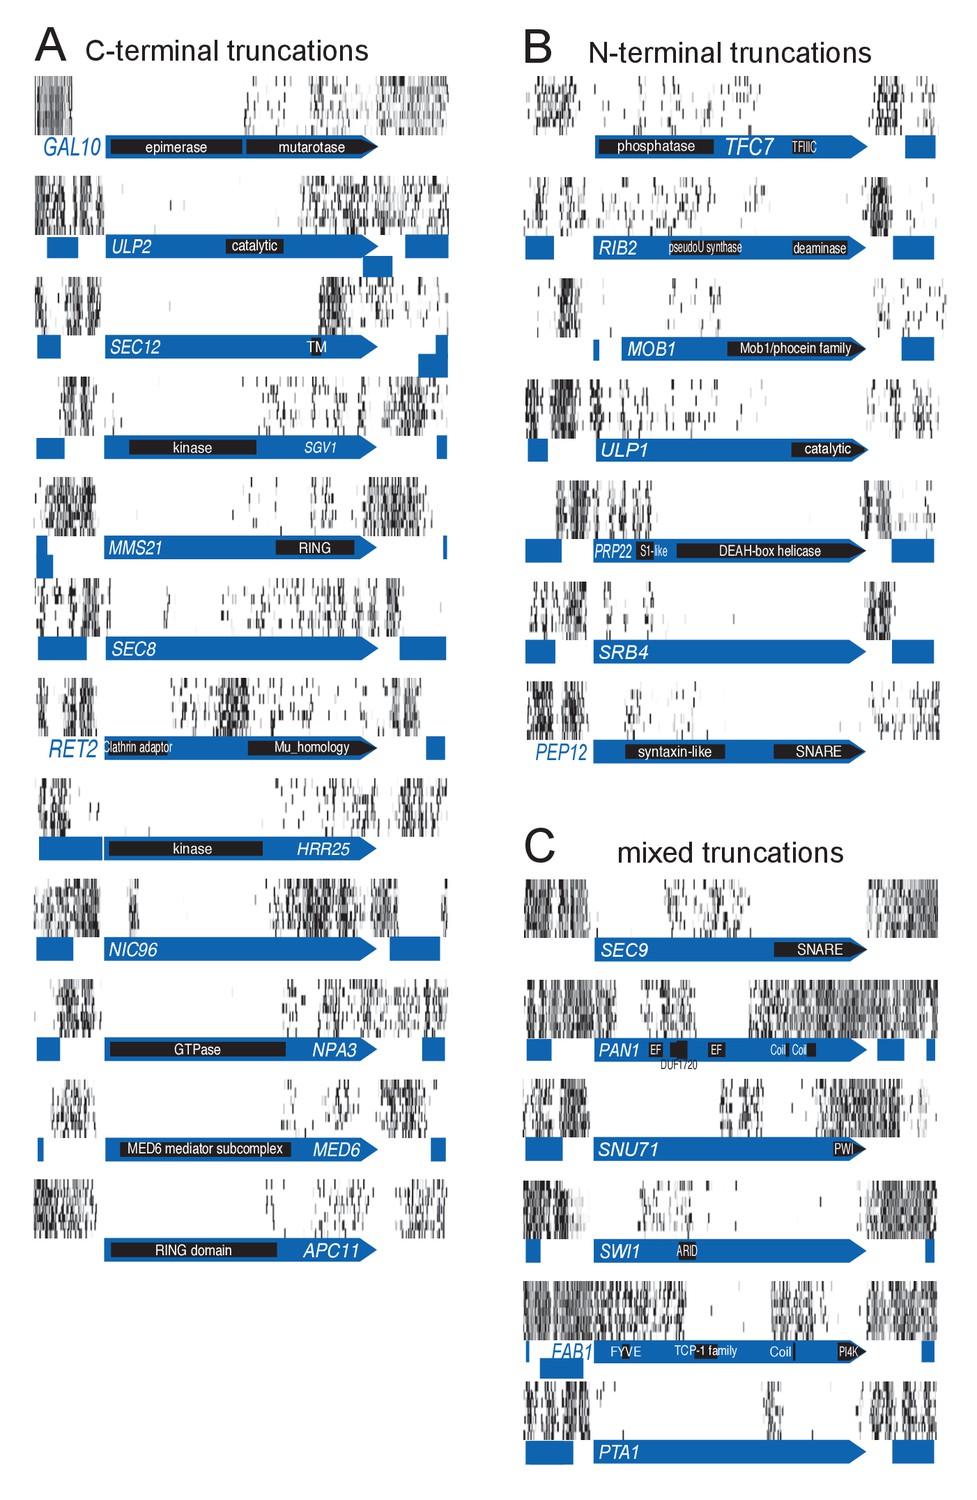
Examples of genes showing partial loss of transposon coverage.
The grey level is proportional to the number of sequencing reads. Known functional domains are indicated. (A) Essential genes for which C-terminal truncations yield a viable phenotype. (B) Essential genes for which N-terminal truncations yield a viable phenotype. (C) Essential genes for which various truncations yield a viable phenotype.
Figure 2—figure supplement 1
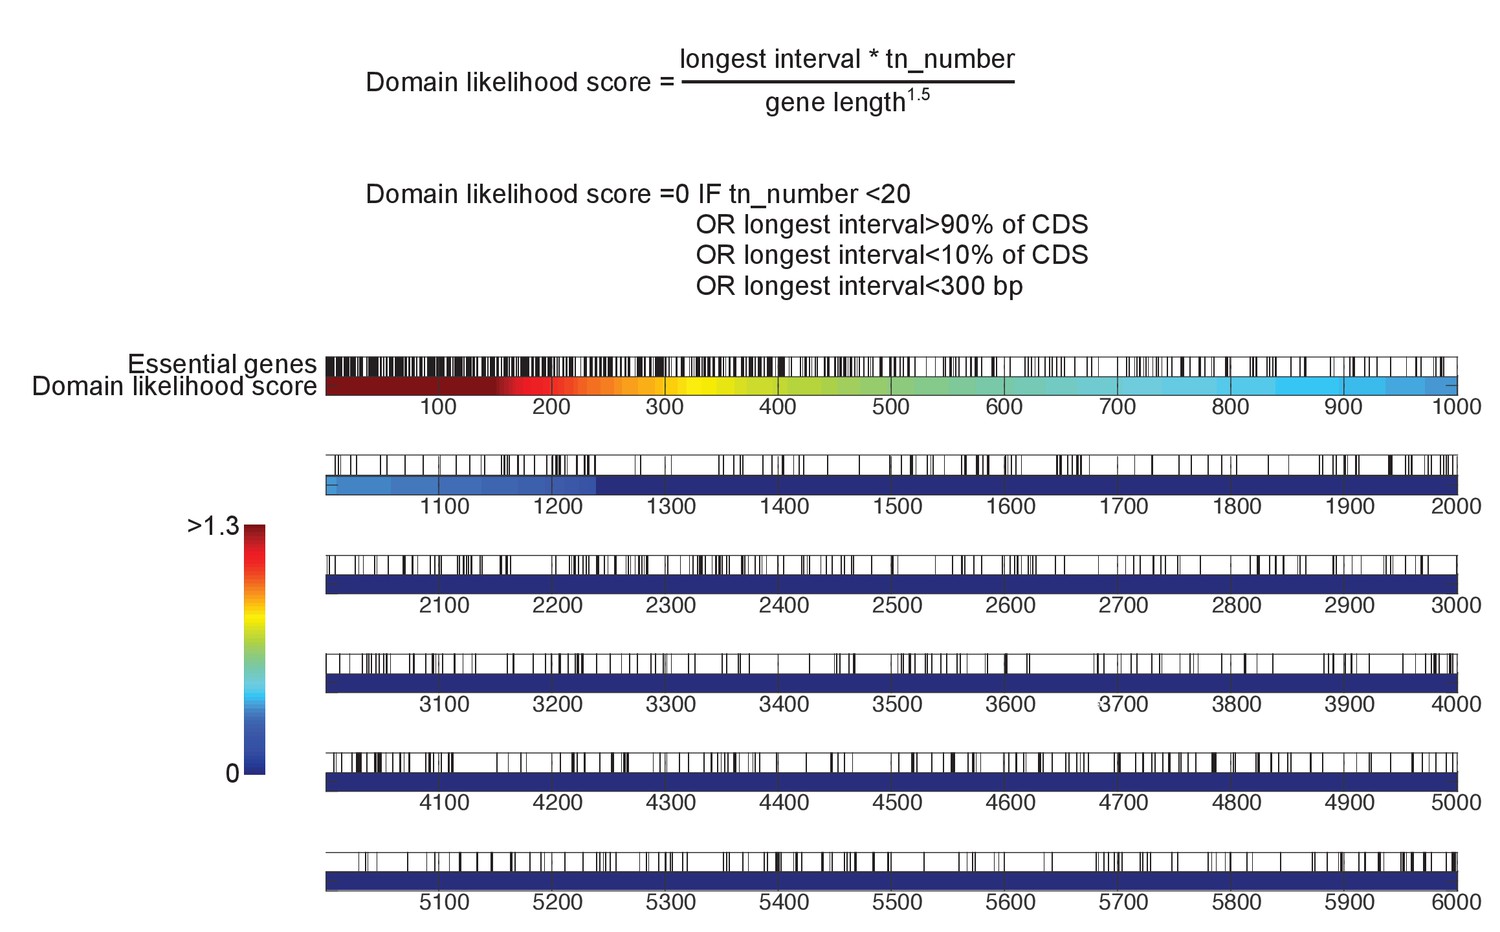
Detection of essential protein domains.
Top, algorithm to detect essential protein domains. This algorithm is implemented in Source code 2. For each gene, a score is computed as follows: the longest interval between transposon n and transposon n + 5, multiplied by the total number of transposons mapping to that gene, divided by the gene length to the power of 1.5. A score of 0 is assigned to genes targeted by less than 20 transposons, in which the longest interval is smaller than 300 bp, and/or in which the longest interval represents more than 90% or less than 10% of the CDS length. Bottom, yeast genes sorted according to their domain likelihood score. Vertical black bars above the graph indicate previously annotated essential genes.
Figure 2—figure supplement 2
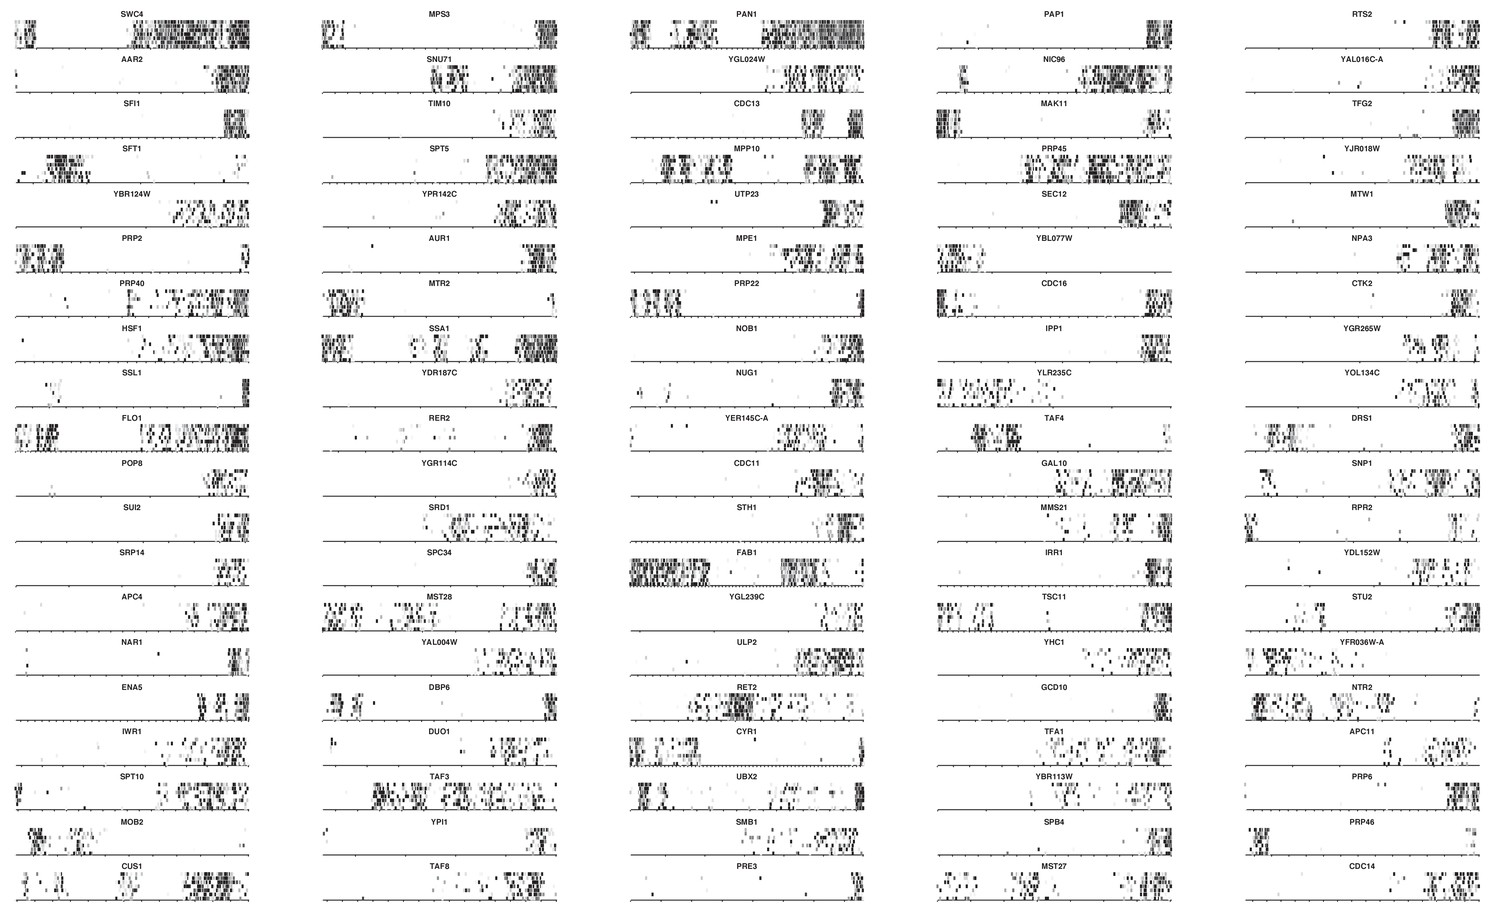
Transposon maps in the 100 highest scoring genes.
Grey scale indicates the number of sequencing reads as in Figure 2.
Figure 2—figure supplement 3
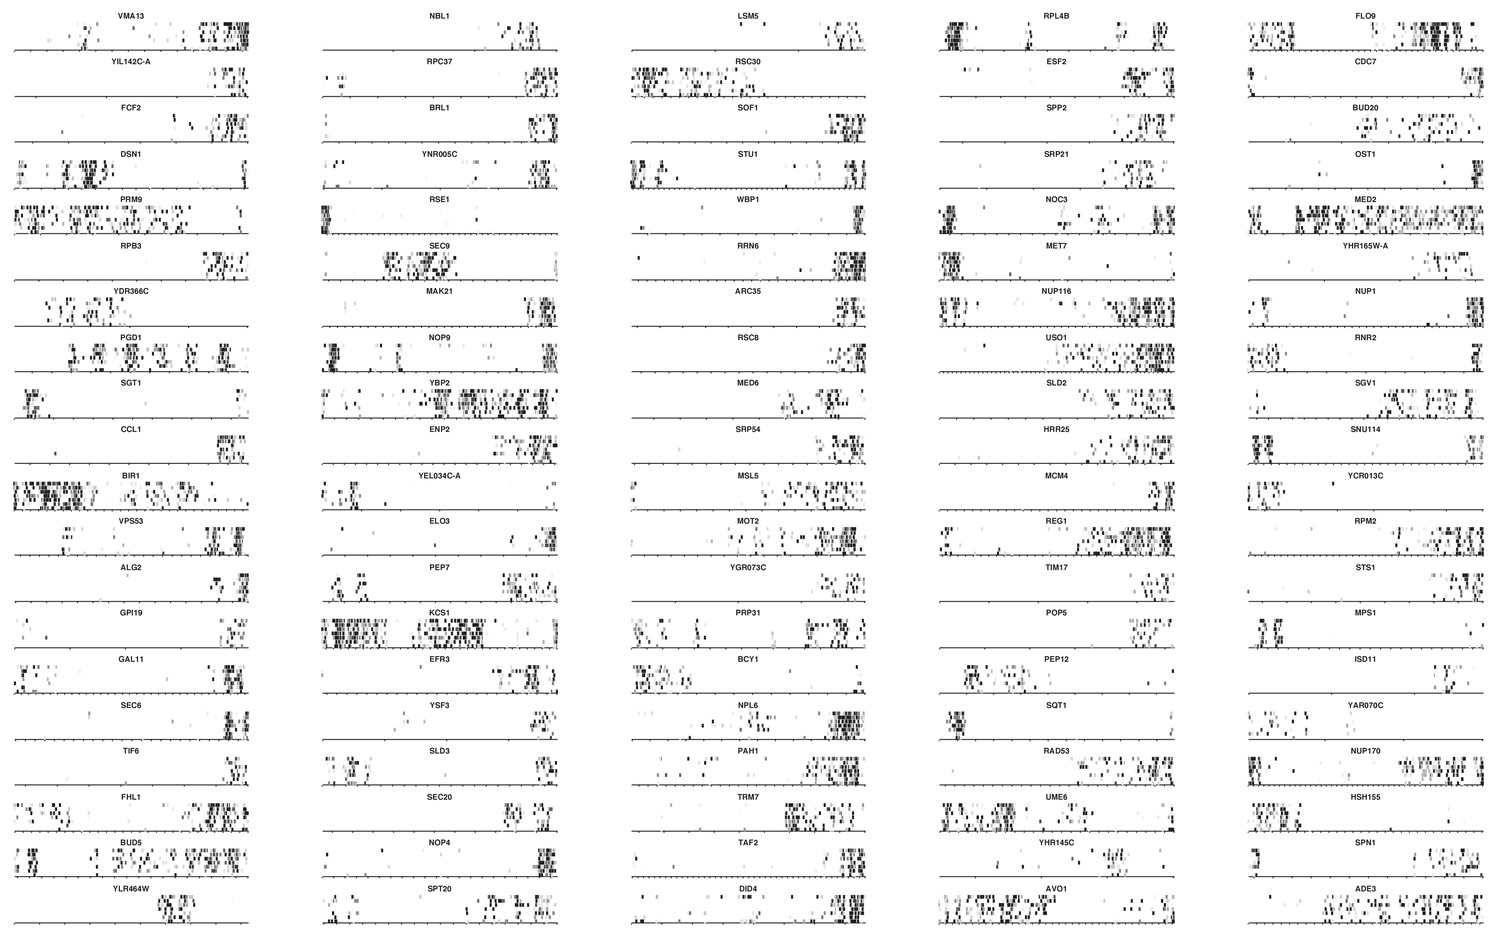
Transposon maps in the genes scoring 101 to 200.
https://doi.org/10.7554/eLife.23570.011
Figure 2—figure supplement 4

Transposon maps in the genes scoring 201 to 300.
https://doi.org/10.7554/eLife.23570.012
Figure 2—figure supplement 5
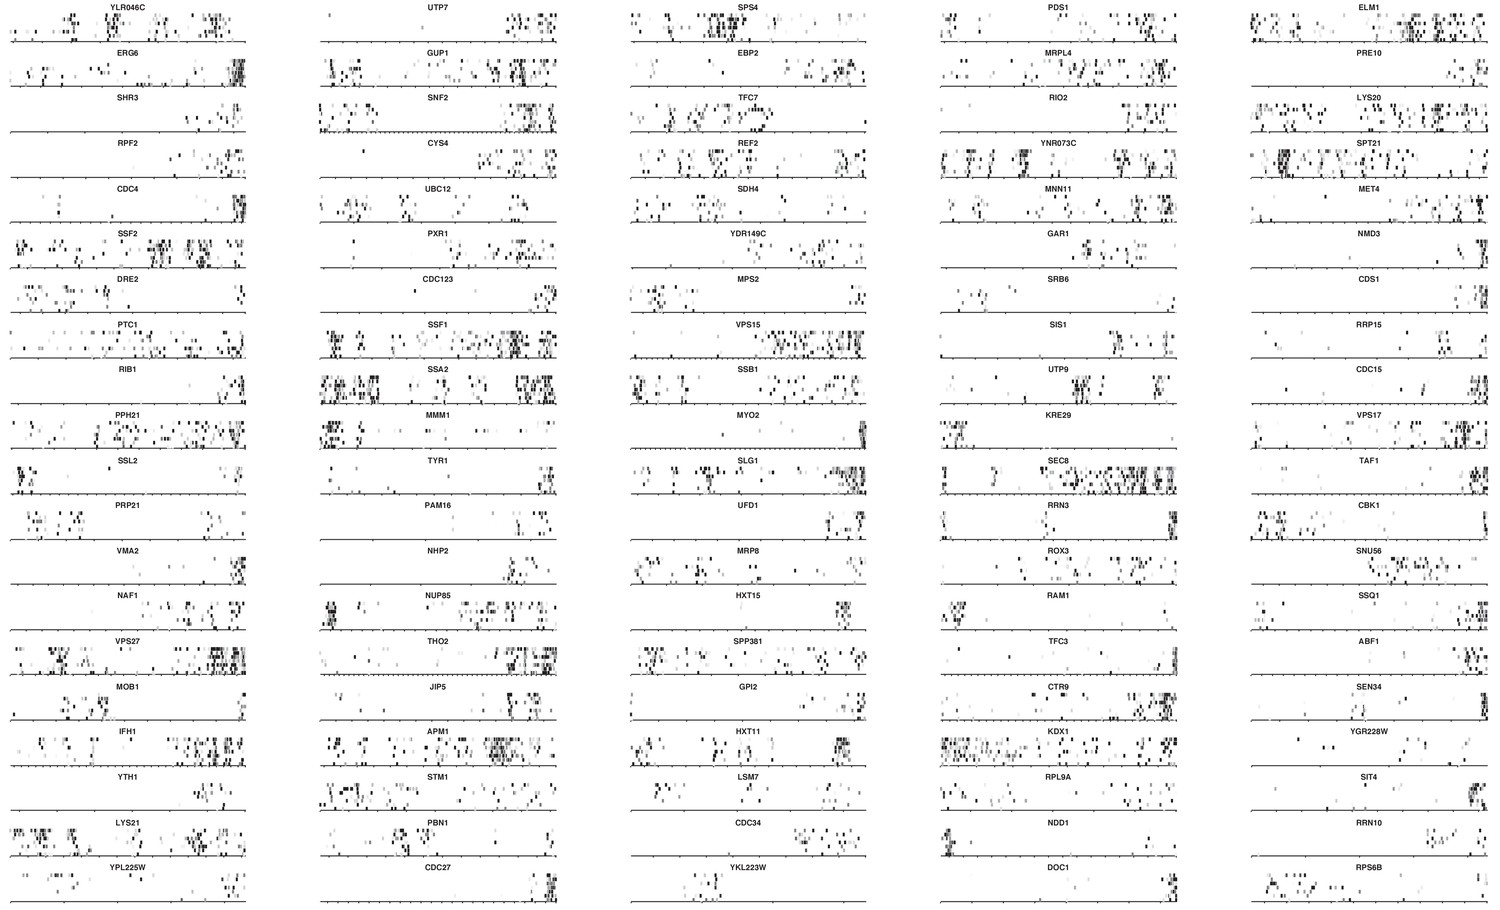
Transposon maps in the genes scoring 301 to 400.
https://doi.org/10.7554/eLife.23570.013
Figure 3
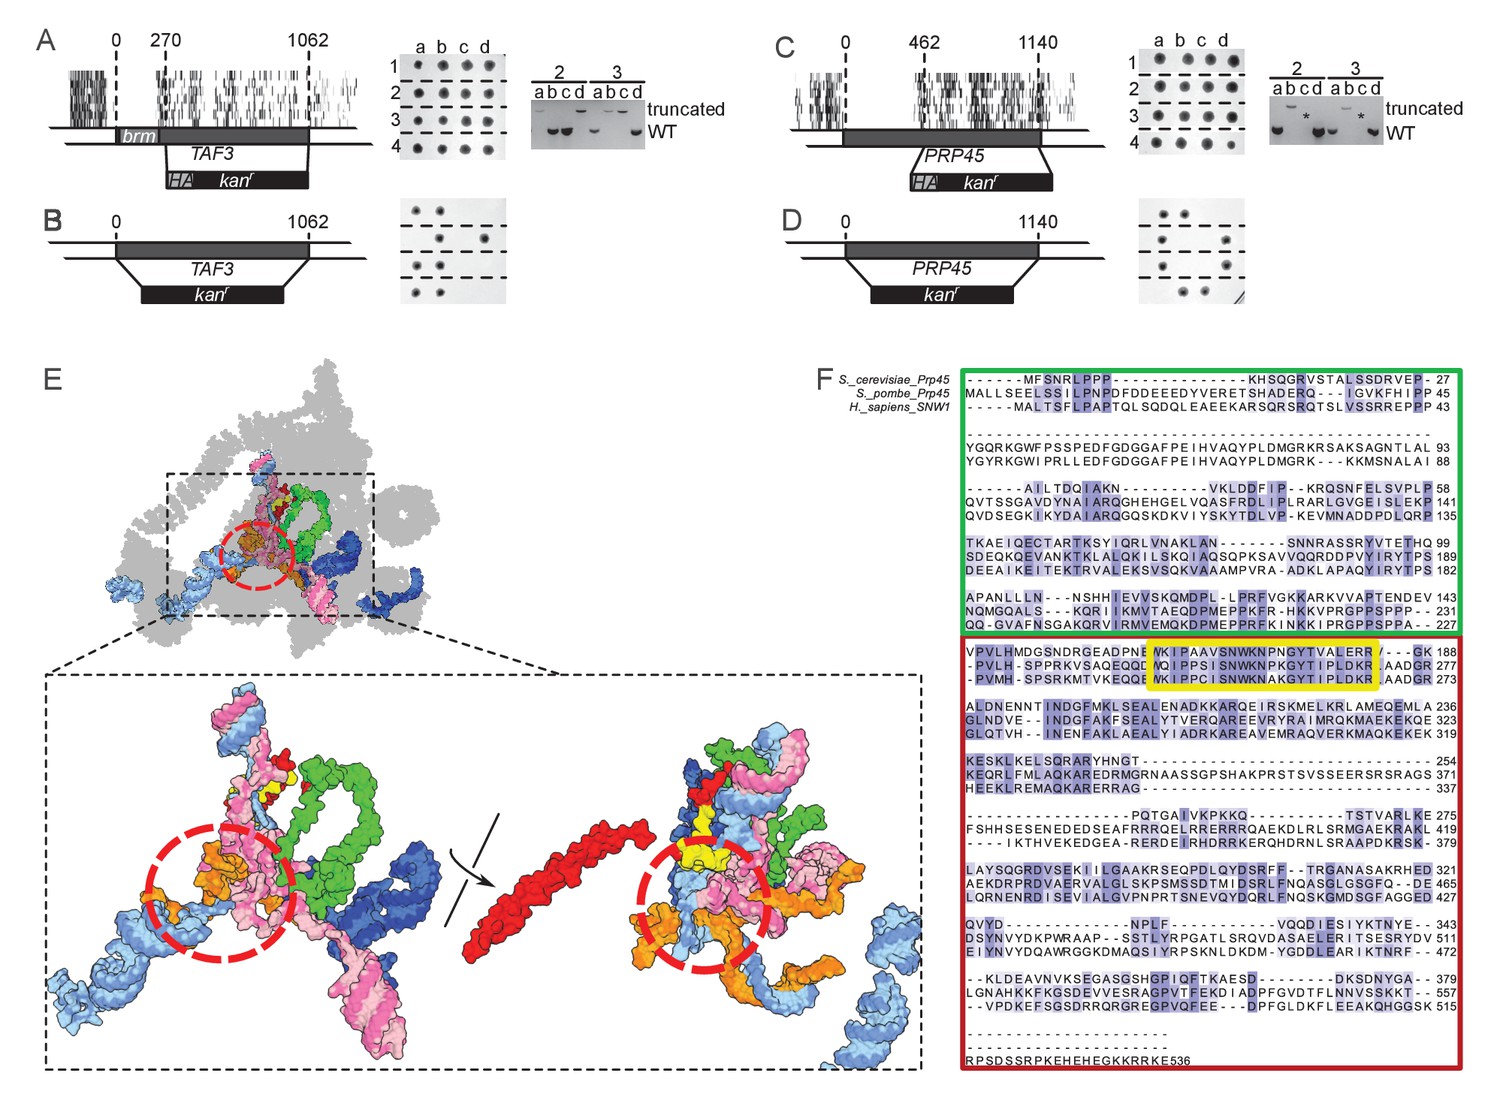
TAF3 and PRP45 can be truncated without visible effects on cell growth.
(A) A truncation of TAF3 was generated in a heterozygous diploid strain (left) by introduction of an HA tag and a G418-resistance cassette (HA kanr). The strain was tetrad dissected (middle). Tetrads 2 and 3 were further analyzed by PCR to confirm the Mendelian segregation of the truncated allele (right). (B) A complete TAF3 deletion was generated in a heterozygous diploid strain (left) by introduction of a G418-resistance cassette (kanr). Meiosis yields only two viable, G418-sensitive spores per tetrad, confirming that TAF3 complete deletion is lethal. (C–D) As in (A–B) but applied to PRP45. Asterisks in the right panel designate PCR reactions that were inefficient at amplifying the large truncated allele. The genotype of these spores can nevertheless be inferred from the Mendelian segregation of the G418 resistance. (E) Top, cryo-EM structure of the S. cerevisiae spliceosome (PDB accession 5GMK, Wan et al., 2016). Bottom, the same structure stripped of every protein except Prp45. The essential portion of Prp45 as defined in (C) is in green and the non-essential part is in red and yellow. U2, U6, U5 and substrate RNAs are depicted in pale blue, pink, dark blue and orange, respectively. The red circle indicates the catalytic active site of the spliceosome. (F) Alignment of the Human, S. cerevisiae, and S. pombe Prp45 orthologs. The green, red and yellow boxes are colored as in (E). The yellow box features the most conserved region of the protein.
Figure 4 with 1 supplement
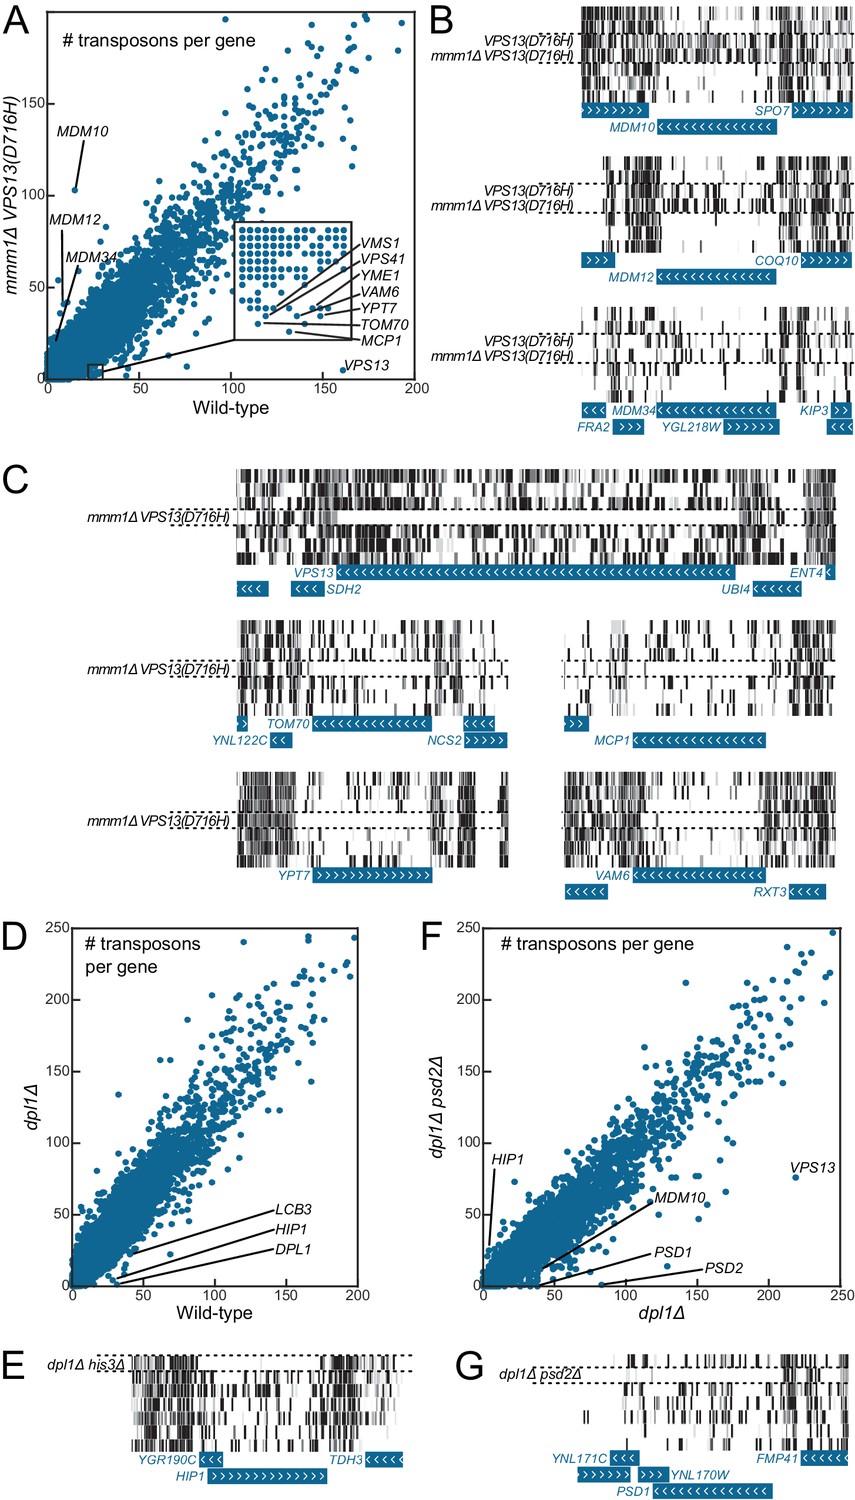
Genetic interaction analyses.
Libraries in panels B, C, E and G are displayed in the same order as in Figure 1C. (A) Comparison of the number of transposons inserted in each of the 6603 yeast CDSs in the wild-type (x-axis) and mmm1Δ VPS13(D716H) (y-axis) libraries. (B) Transposon coverage of genes encoding ERMES components is increased in libraries from strains bearing the VPS13(D716H) allele. (C) Examples of genes showing synthetic sick/lethal interaction with mmm1Δ VPS13(D716H). (D) Comparison of the number of transposons inserted in each of the 6603 yeast CDSs in the wild-type (x-axis) and dpl1Δ (y-axis) libraries. (E) Transposon coverage of the HIP1 locus in the dpl1Δ his3Δ library and in all the other libraries (HIS3). (F) Comparison of the number of transposons inserted in each of the 6603 yeast CDSs in the dpl1Δ (x-axis) and dpl1Δ psd2Δ (y-axis) libraries. (G) Transposon coverage of the PSD1 locus in the dpl1Δ psd2Δ and in all other libraries.
Figure 4—figure supplement 1
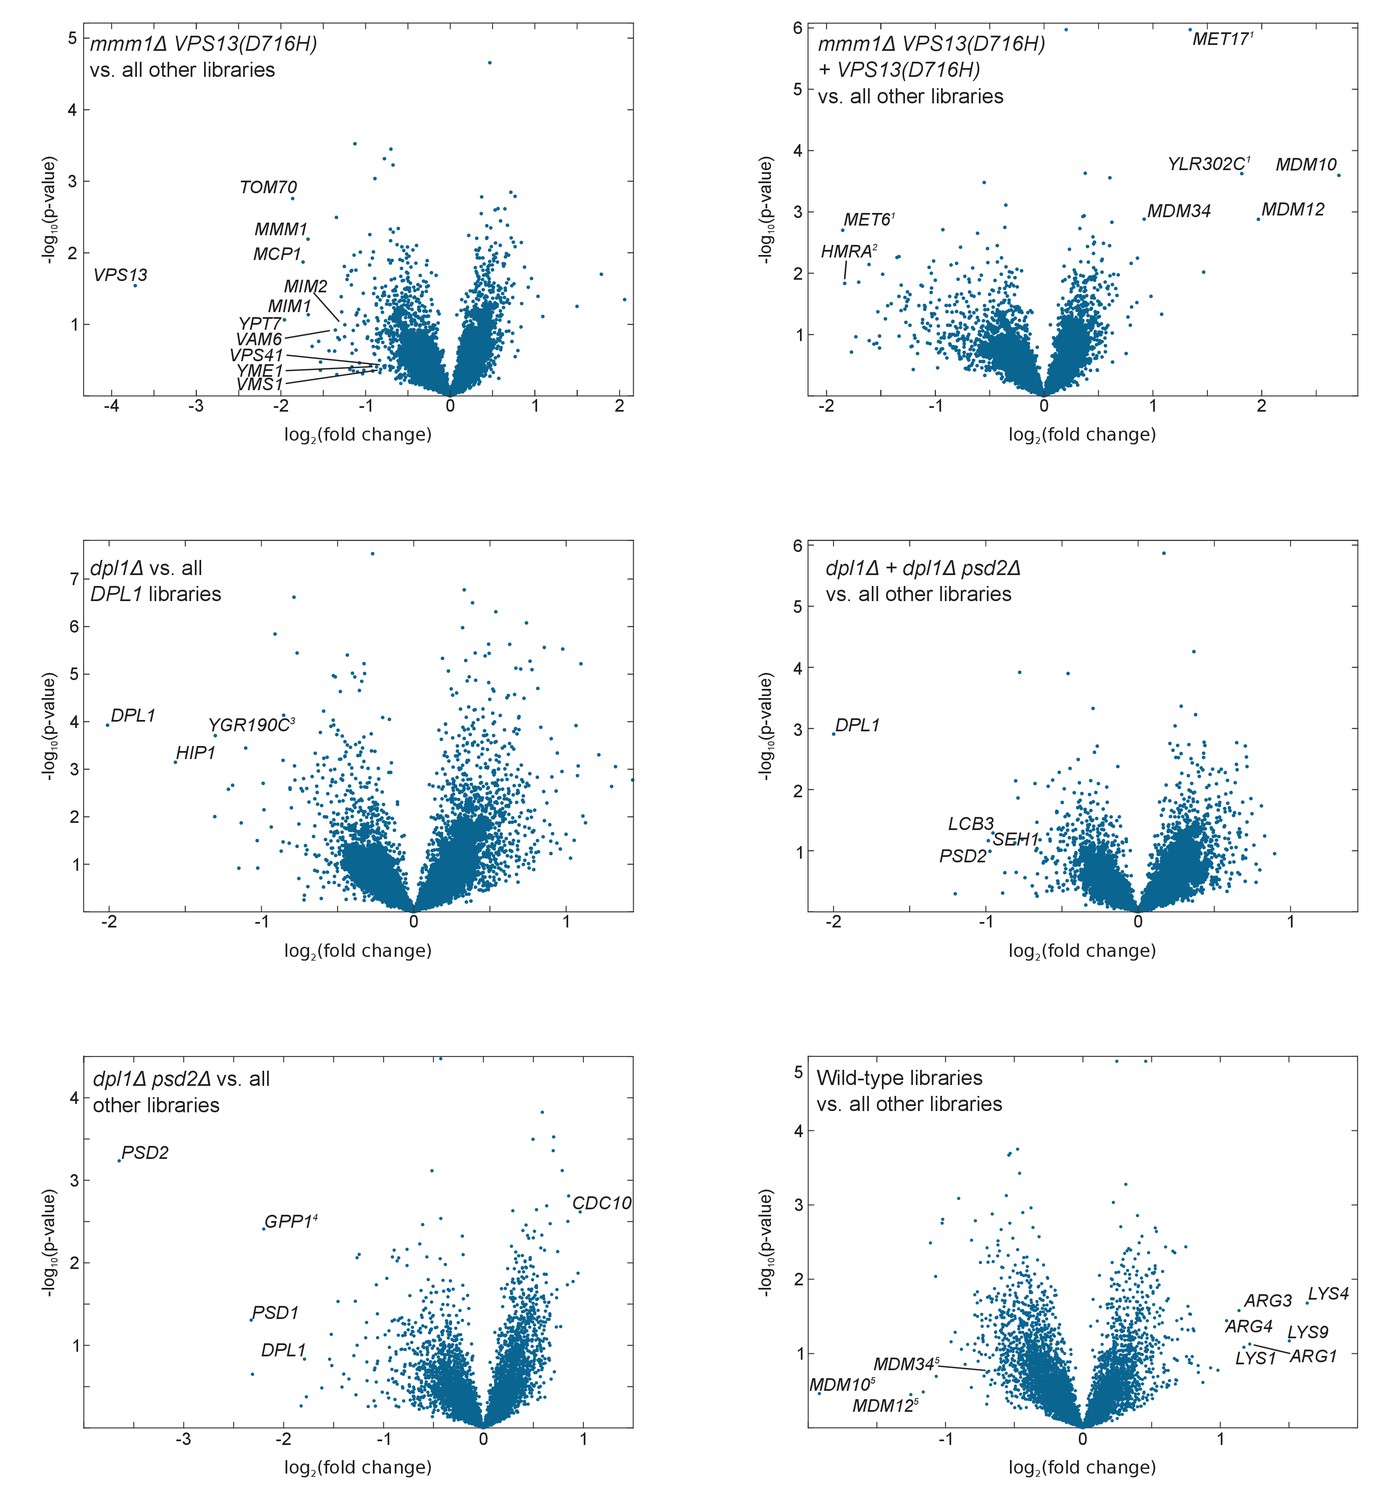
Volcano plots comparing libraries or combinations of libraries as indicated.
The calculated fold-change in transposon density between the two sets of libraries is plotted in log2 scale on the x-axis. The -log10(p-value) (computed using the Student’s t-test) is plotted on the y-axis. (1)The VPS13(D716H) and the mmm1Δ VPS13(D716H) strains were generated in a MET17 background while all other libraries where generated in a met17Δ background. As a result MET17 and the overlapping ORF YLR302C appear as transposon free in the reference set. MET6 is more targeted by transposons in met17Δ libraries, likely because Met17 produces homocysteine, which needs to be converted to methionine by Met6, or might otherwise accumulate to toxic levels. (2)The VPS13(D716H) and mmm1Δ VPS13(D716H) strains were generated in a Matα background, while the others were generated in a Mata background. (3)YGR190C overlaps with HIP1. (4)GPP1 shows synthetic lethality with a recessive Mendelian variant present in the psd2Δ dpl1Δ strain. However, this variant is neither linked to DPL1 nor to PSD2 (data not shown). (5)ERMES component genes scores very high with respect to fold change, because two of the five libraries in the reference set bear the VPS13(D716H) allele. The p-value, by contrast, is not significant.
Figure 5
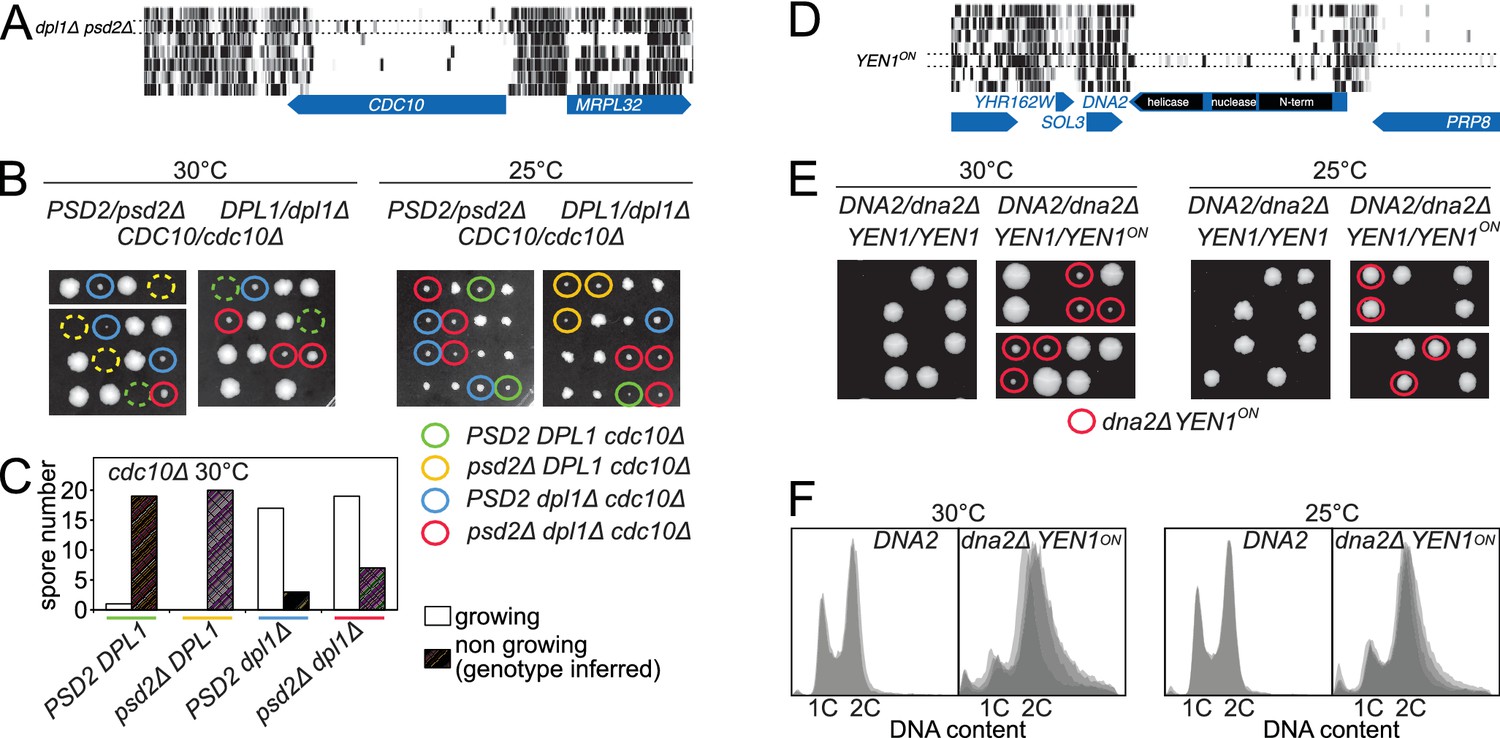
Synthetic rescue of lethal phenotypes.
(A) Transposon coverage of CDC10 in the seven libraries. The coverage is increased in the dpl1Δ psd2Δ library. (B) Tetrad dissection of a PSD2/psd2Δ DPL1/dpl1Δ CDC10/cdc10Δ triple heterozygote at 30°C (left) and 25°C (right). The cdc10Δ spores of ascertained genotype are circled with a color-coded solid line. cdc10Δ spores for which the genotype can be inferred from the other spores of the tetrad are circled with a color-coded dashed line. (C) Quantification of growing and non-growing cdc10Δ spores of the indicated genotype obtained from 48 tetrads (three independent diploids). (D) Transposon coverage of DNA2 in the seven libraries. The coverage is increased in the YEN1on library. (E) Tetrad dissection of a DNA2/dna2Δ YEN1/YEN1 single heterozygote and of a DNA2/dna2Δ YEN1/YEN1on double heterozygote at 30°C (left) and 25°C (right). All viable dna2Δ spores additionally carry the YEN1on allele (red circle). (F) FACS profile of propidium-iodide-stained DNA content in DNA2 and dna2Δ YEN1on strains exponentially growing at 30°C (left) and 25°C (right). For DNA2 panels, each profile is an overlay of two independent strains. For dna2Δ YEN1on panels, each profile is an overlay of four independent strains.
Figure 6 with 1 supplement

Detection of rapamycin resistant strains.
(A) Comparison of the number of sequencing reads mapping to each of the 6603 yeast CDSs in rapamycin-untreated (x-axis) and -treated (y-axis) libraries. Note the difference in scale between both axis due to the high representation of rapamycin-resistant clones. (B) Distribution of transposons and number of associated sequencing reads on the PIB2 gene. Transposons with high number of sequencing reads in the rapamycin-treated library are clustered at the 5’-end of the CDS. (C) Wild-type (WT) and pib2Δ strains were transformed with either an empty plasmid (∅) or plasmids encoding full-length (FL) or indicated fragments of Pib2 (see E, numbers refer to the amino acid position in the full-length Pib2 protein). 5-fold serial dilutions of these strains were spotted on YPD or YPD containing 10 ng/ml rapamycin. Centromeric plasmids were used in all strains, except in those denoted with 2 µ, which carried multi-copy plasmids. (D) Strains of the indicated genotypes, transformed with either an empty plasmid (∅) or plasmids encoding full length (pPIB2) or truncated (pPIB2165-635) versions of Pib2, were grown exponentially in minimal medium with proline as nitrogen source. 3 mM glutamine was added to the culture and the cells were harvested 2 min later. Protein extracts were resolved on an SDS-page and probed with antibodies either specific for Sch9-pThr737 (P-Sch9), or for total Sch9 to assess TORC1 activity. (E) Schematic overview of Pib2 architecture and of the fragments used for genetic studies. (F) Summary of yeast-two-hybrid interactions between Pib2 fragments and the TORC1 subunit Kog1 (Figure 6—figure supplement 1). Fragments indicated by a black box interacted with Kog1, fragments indicated by a white box did not. (G) pib2Δ cells expressing the indicated Pib2 fragments from plasmids (see E) were assayed for their sensitivity to rapamycin (2.5 or 5 ng/ml) as in C. (H) WT or pib2Δ cells expressing the indicated Pib2 fragments from plasmids were assayed as in G, except that cells were spotted on synthetic medium to apply a selective pressure for plasmid maintenance.
Figure 6—figure supplement 1
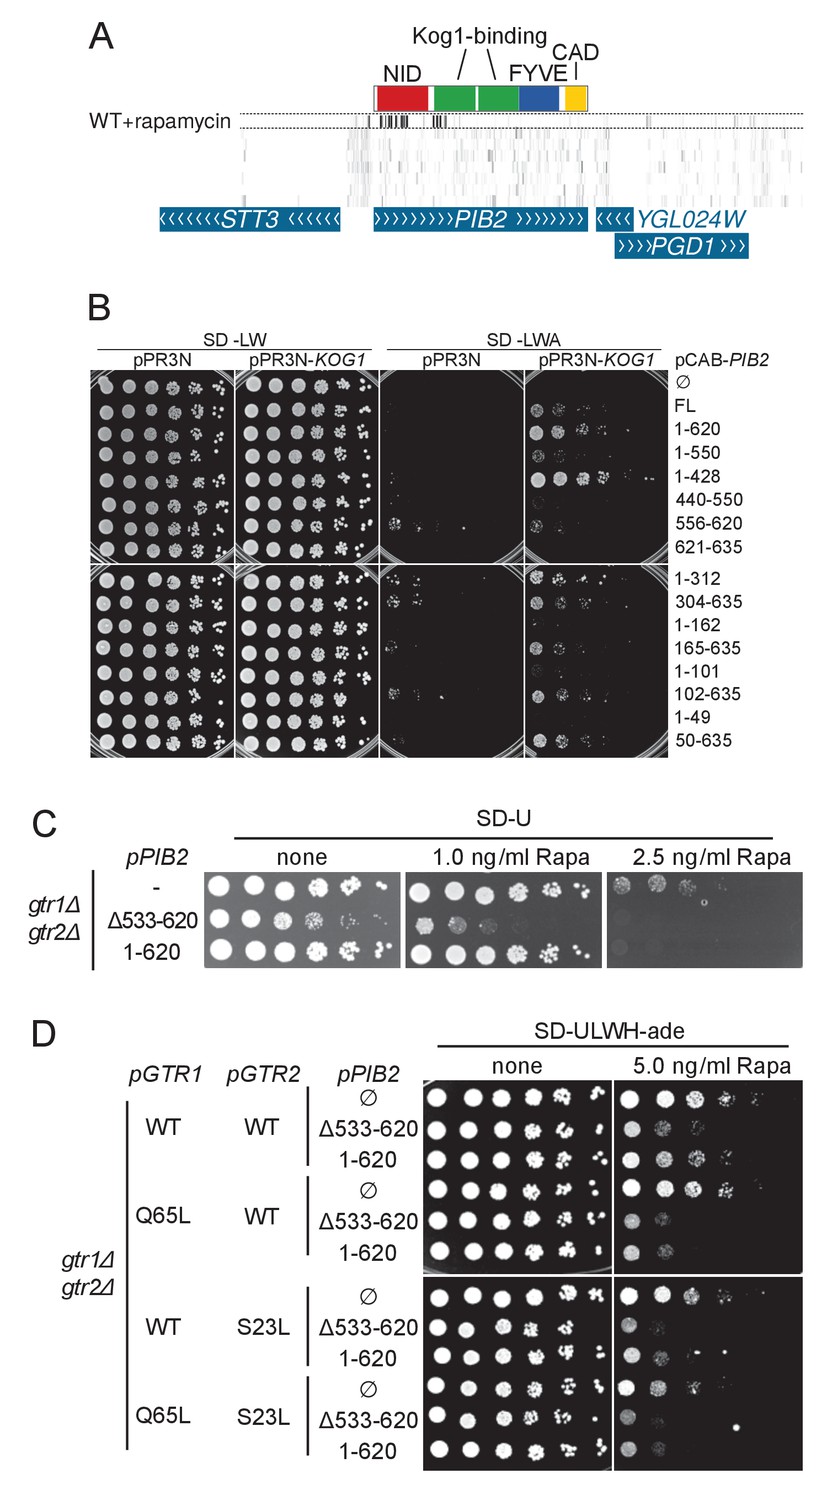
A) Transposon coverage of the PIB2 gene.
Top row is the rapamycin-treated library and rows below are presented as in Figures 2–5. The gray scale has been adjusted to account for the large number of sequencing reads mapping in the 5’ region of the gene. (B) Yeast-two-hybrid assay assessing the interaction of the indicated Pib2 fragments encoded on the pCAB plasmid, with full-length Kog1 encoded on the pPR3N plasmid. (C) gtr1Δ gtr2Δ cells expressing indicated, plasmid-encoded Pib2 fragments (see Figure 6E) were assayed for their sensitivity to rapamycin. Note that expressing Pib2Δ533-620 in gtr1Δ gtr2Δ cells appears to inhibit growth even in the absence of rapamycin. (D) gtr1Δ gtr2Δ cells, transformed with centromeric plasmids expressing Pib2 fragments (see Figure 6E) and alleles of Gtr1 and Gtr2 as indicated, were assayed for their sensitivity to rapamycin.
Tables
Table 1
Characteristics of the libraries
| Library | Number of colonies | Reads mapped | Transposons mapped | Median read per transposon | Number of MiSeq runs | Overlap between MiSeq runs |
|---|---|---|---|---|---|---|
| Wild-type 1 | ~1.6×10⁶ | 31794831 | 284162 | 22 | 2* | 54%, 88%* |
| Wild-type 2 | ~2.4×10⁶ | 15303285 | 258568 | 12 | 1 | NA |
| VPS13(D716H) | ~4.7×10⁶ | 24958456 | 414114 | 13 | 2† | 41%, 42%† |
| Mmm1Δ VPS13(D716H) | ~1.9×10⁶ | 17799948 | 303323 | 12 | 1 | NA |
| dpl1Δ | ~2.3×10⁶ | 15077156 | 401126 | 8 | 1 | NA |
| dpl1Δ psd2Δ | ~2.9×10⁶ | 11649561 | 363179 | 9 | 1 | NA |
| YEN1on | ~2.8×10⁶ | 9517877 | 495125 | 6 | 1 | NA |
| Wild-type 2 + rapamycin | ~2.4×10⁶ | 9664956 | 169322 | 9 | 1 | NA |
-
* The harvested library was grown in two flasks, one at 30°C and the other at 37°C. DNA was extracted separately from the two cultures and sequenced in two separate MiSeq runs
-
† The library was harvested as ten subpools, which were grown in ten separate flasks. DNA was extracted separately. In one case, DNA from all ten subpools was pooled and processed to sequencing in one MiSeq run. In the other case, DNAs were kept separate and processed until the PCR step (1 × 100 µl PCR by subpool). PCR products were pooled and sequenced as another MiSeq run.
Table 2
Yeast strains used in this study.
| Name | Parent | Genotype | Reference |
|---|---|---|---|
| CWY1 | BY4723 | MATa his3Δ0 ura3Δ0 ade2:Ds-1 | Weil and Kunze (2000) |
| ByK157 | BY4743 | MATα his3Δ1 leu2Δ0 lys2Δ0 ura3Δ0 VPS13(D716H) | Lang et al. (2015b) |
| ByK352 | BY4741 | MATa his3Δ1 leu2Δ0 met17Δ0 ura3Δ0 ade2Δ::HIS3* | This study |
| ByK484 | By4742 | MATα his3Δ1 leu2Δ0 lys2Δ0 ura3Δ0 ade2Δ::HIS3* | This study |
| ByK485 | ByK352 and ByK484 | MATa/α his3Δ1/his3Δ1 leu2Δ0/leu2Δ0 LYS2/lys2Δ0 met17Δ0/MET17 ura3Δ0/ura3Δ0 ade2Δ::HIS3*/ade2Δ::HIS3* | This study |
| ByK446 | ByK157 | MATα his3Δ1 leu2Δ0 ura3Δ0 ade2Δ::HIS3* VPS13(D716H) | This study |
| ByK528 | ByK446 | MATα his3Δ1 leu2Δ0 ura3Δ0 ade2Δ::HIS3* VPS13(D716H) mmm1Δ::KanMX6 | This study |
| ByK530 | ByK352 | MATa his3Δ1 leu2Δ0 met17Δ0 ura3Δ0 ade2Δ::NAT* dpl1Δ::KanMX6 | This study |
| ByK533 | ByK352 | MATa his3Δ1 leu2Δ0 met17Δ0 ura3Δ0 ade2Δ::HIS3* psd2Δ::KanMX6 dpl1Δ::NAT | This study |
| ByK576 | ByK485 | MATa/α his3Δ1/his3Δ1 leu2Δ0/leu2Δ0 LYS2/lys2Δ0 met17Δ0/MET17 ura3Δ0/ura3Δ0 ade2Δ::HIS3*/ade2Δ::HIS3* prp45Δ::KanMX6/PRP45 | This study |
| ByK579 | ByK485 | MATa/α his3Δ1/his3Δ1 leu2Δ0/leu2Δ0 LYS2/lys2Δ0 met17Δ0/MET17 ura3Δ0/ura3Δ0 ade2Δ::HIS3*/ade2Δ::HIS3* PRP451-462-HA(KanMX6)/ PRP45 | This study |
| ByK583 | ByK485 | MATa/α his3Δ1/his3Δ1 leu2Δ0/leu2Δ0 LYS2/lys2Δ0 met17Δ0/MET17 ura3Δ0/ura3Δ0 ade2Δ::HIS3*/ade2Δ::HIS3* taf3Δ::KanMX6/TAF3 | This study |
| ByK588 | ByK485 | MATa/α his3Δ1/his3Δ1 leu2Δ0/leu2Δ0 LYS2/lys2Δ0 met17Δ0/MET17 ura3Δ0/ura3Δ0 ade2Δ::HIS3*/ade2Δ::HIS3* TAF31-270-HA(KanMX6)/ TAF3 | This study |
| ByK725 | ByK533 and ByK484 | MATa/α his3Δ1/his3Δ1 leu2Δ0/leu2Δ0 LYS2/lys2Δ0 met17Δ0/MET17 ura3Δ0/ura3Δ0 ade2Δ::HIS3*/ade2Δ::HIS3* psd2Δ::KanMX6/PSD2 dpl1Δ::NAT /DPL1 | This study |
| ByK726 | ByK533 and ByK484 | MATa/α his3Δ1/his3Δ1 leu2Δ0/leu2Δ0 LYS2/lys2Δ0 met17Δ0/MET17 ura3Δ0/ura3Δ0 ade2Δ::HIS3*/ade2Δ::HIS3* psd2Δ::KanMX6/PSD2 dpl1Δ::NAT /DPL1 | This study |
| ByK739 | ByK725 | MATa/α his3Δ1/his3Δ1 leu2Δ0/leu2Δ0 LYS2/lys2Δ0 met17Δ0/MET17 ura3Δ0/ura3Δ0 ade2Δ::HIS3*/ade2Δ::HIS3* psd2Δ::KanMX6/PSD2 dpl1Δ::NAT /DPL1 cdc10Δ::URA3/CDC10 | This study |
| ByK740 | ByK726 | MATa/α his3Δ1/his3Δ1 leu2Δ0/leu2Δ0 LYS2/lys2Δ0 met17Δ0/MET17 ura3Δ0/ura3Δ0 ade2Δ::HIS3*/ade2Δ::HIS3* psd2Δ::KanMX6/PSD2 dpl1Δ::NAT /DPL1 cdc10Δ::URA3/CDC10 | This study |
| ByK741 | ByK726 | MATa/α his3Δ1/his3Δ1 leu2Δ0/leu2Δ0 LYS2/lys2Δ0 met17Δ0/MET17 ura3Δ0/ura3Δ0 ade2Δ::HIS3*/ade2Δ::HIS3* psd2Δ::KanMX6/PSD2 dpl1Δ::NAT /DPL1 cdc10Δ::URA3/CDC10 | This study |
| YJM3916 | ByK352 | MATa his3Δ1 leu2Δ0 met17Δ0 ura3Δ0 ade2Δ::HIS3* YEN1on | This study |
| YL516 | BY4741/BY4742 | MATa his3Δ1 leu2Δ0 ura3Δ0 | Binda et al. (2009) |
| MB32 | YL516 | MATa his3Δ1 leu2Δ0 ura3Δ0 gtr1Δ::kanMX | Binda et al. (2009) |
| RKH106 | YL516 | MATa his3Δ1 leu2Δ0 ura3Δ0 pib2Δ::kanMX | This study |
| RKH241 | MB32 | MATa his3Δ1 leu2Δ0 ura3Δ0 gtr1Δ::kanMX gtr2Δ::hphMX4 | This study |
| NMY51 | his3∆200 trp1-901 leu2-3,112 ade2 LYS::(lexAop)4-HIS3 ura3::(lexAop)8- lacZ ade2::(lexAop)8-ADE2 GAL4 | Dualsystems Biotech AG |
-
*ADE2 deleted −56 before ATG +62 after STOP with PCR primers #6 and #7 on pFA6a-His3MX6.
Table 3
Oligonucleotides used in this study.
| # | Original name | Sequence | Purpose |
|---|---|---|---|
| 1 | P5_MiniDs | AATGATACGGCGACCACCGAGATCTACtccgtcccgcaagttaaata | amplify library |
| 2 | MiniDs_P7 | CAAGCAGAAGACGGCATACGAGATacgaaaacgaacgggataaa | amplify library |
| 3 | 688_minidsSEQ1210 | tttaccgaccgttaccgaccgttttcatcccta | sequence library |
| 4 | ADE2Fwd | GGTTCGAGCTCCCTTTTGATGCGGAATTGAC | clone ADE2 MiniDS |
| 5 | ADE2Rev | GACCTGAGCTCTTACTGGATATGTATGTATG | clone ADE2 MiniDS |
| 6 | Ade2PriFwd | GTATAAATTGGTGCGTAAAATCGTTGGATCTCTCTTCTAAcggatccccgggttaattaa | delete ADE2 |
| 7 | Ade2PriRev | TATGTATGAAGTCCACATTTGATGTAATCATAACAAAGCCgaattcgagctcgtttaaac | delete ADE2 |
| 8 | Dpl1_Janke_S1 | AGCAAGTAGGCTAGCTTCTGTAAAGGGATTTTTCCATCTAATACAcgtacgctgcaggtcgac | delete DPL1 |
| 9 | Dpl1_Janke_S2 | GCACTCTCGTTCTTTAAATTATGTATGAGATTTGATTCTATATAGatcgatgaattcgagctcg | delete DPL1 |
| 10 | Psd2_pringle_F | GATGCTGTATCAATTGGTAAAGAATCCTCGATTTTCAGGAGCATCCAACGcgtacgctgcaggtcgac | delete PSD2 |
| 11 | Psd2_pringle_R | CTTGTTTGTACACGCTATAGTCTATAATAAAGTCTGAGGGAGATTGTTCATGatcgatgaattcgagctcg | delete PSD2 |
| 12 | TAF3_R1 | TGGATGAGATAATGACGAAAGAAAATGCAGAAATGTCGTTgaattcgagctcgtttaaac | TAF3 partial deletion |
| 13 | TAF3_aa90_F2 | AGGTATTGTTAAGCCTACGAACGTTCTGGATGTCTATGATcggatccccgggttaattaa | TAF3 partial deletion |
| 14 | Taf3_Fwd | GGCAAGATGTGATCAGGACG | check TAF3 partial deletion |
| 15 | Taf3_Rev | TCTTGAAGAAGCGAAAGTACACT | check TAF3 partial deletion |
| 16 | TAF3_R1 | TGGATGAGATAATGACGAAAGAAAATGCAGAAATGTCGTTgaattcgagctcgtttaaac | TAF3 complete deletion |
| 17 | TAF3_aa1_ F1 | GAAAACAGCGATATCTTTGGGTCAATAGAGTTCCTCTGCTtgaggcgcgccacttctaaa | TAF3 complete deletion |
| 18 | PRP45_R1 | ACTCAAGCACAAGAATGCTTTGTTTTCCTAGTGCTCATCCTGGGCgaattcgagctcgtttaaac | PRP45 partial deletion |
| 19 | PRP45_aa154_F2 | AACGACGAAGTCGTGCCTGTTCTCCATATGGATGGCAGCAATGATcggatccccgggttaattaa | PRP45 partial deletion |
| 20 | PRP45_Fwd | AGGTTGTAGCACCCACAGAA | check PRP45 partial deletion |
| 21 | PRP45_Rev | CAATCATCACACCTCAGCGA | check PRP45 partial deletion |
| 22 | PRP45_R1 | ACTCAAGCACAAGAATGCTTTGTTTTCCTAGTGCTCATCCTGGGCgaattcgagctcgtttaaac | PRP45 complete deletion |
| 23 | PRP45_aa1_F1 | GCTCTGAGCCGAGAGGACGTATCAGCAACCTCAACCAAATtgaggcgcgccacttctaaa | PRP45 complete deletion |
| 24 | CDC10-Ura3_fwd | AAGGCCAAGCCCCACGGTTACTACAAGCACTCTATAAATATATTAtgacggtgaaaacctctgac | CDC10 complete deletion |
| 25 | URA3-CDC10_rev | TTCTTAATAACATAAGATATATAATCACCACCATTCTTATGAGATtcctgatgcggtattttctcc | CDC10 complete deletion |
| 26 | OJM370 | ATGGGTGTCTCACAAATATGGG | Amplify YEN1 |
| 27 | OJM371 | TTCAATAGTGCTACTGCTATCAC | Amplify YEN1 |
| 28 | OJM372 | TTCAATAGTGCTACTGCTATCACTGTCACAGGCTCAAACCGGTCGACTG TTCGTACGCTGCAGGTCGAC | Delitto perfetto on YEN1 |
| 29 | OJM373 | ATGGGTGTCTCACAAATATGGGAATTTTTGAAGCCATATCTGCAAGATTCCCGCGCGTTGGCCGATTCAT | Delitto perfetto on YEN1 |
| 30 | o3958 | gacggtatcgataagcttgatatcgGCGCTGGCATCTTTAATCTC | PIB2 cloning |
| 31 | o3959 | actagtggatcccccgggctgcaggTGCTTGGATCCTTCTTGGTC | PIB2 cloning |
| 32 | o3224 | TAATA CGACT CACTA TAGGG | various PIB2 truncations |
| 33 | o3225 | ATTAA CCCTC ACTAA AGGGA A | various PIB2 truncations |
| 34 | o4034 | atctagttcagggttcgacattctggtctccactac | PIB2165-635 truncation |
| 35 | o4010 | gtagtggagaccagaatgtcgaaccctgaactagat | PIB2165-635 truncation |
| 36 | o4012 | tagtggagaccagaatgttaccgcagcctgct | PIB2304-635 truncation |
| 37 | o4035 | tcaaattagaactagcattcattctggtctccactacaactgtg | PIB2221-635 truncation |
| 38 | o4011 | cacagttgtagtggagaccagaatgaatgctagttctaatttga | PIB2221-635 truncation |
| 39 | o4062 | atagttggtattaagttgattctcattctggtctccactacaactg | PIB2426-635 truncation |
| 40 | o3996 | cagttgtagtggagaccagaatgagaatcaacttaataccaactat | PIB2426-635 truncation |
| 41 | o4063 | cgtgtttgcgttatggttgtcgctgttcggaataga | PIB2Δ426-532 truncation |
| 42 | o3997 | tctattccgaacagcgacaaccataacgcaaacacg | PIB2Δ426-532 truncation |
| 43 | o4064 | cacagagccgataacactcgtggttgaaaggttctc | PIB2Δ533-620 truncation |
| 44 | o3998 | gagaacctttcaaccacgagtgttatcggctctgtg | PIB2Δ533-620 truncation |
| 45 | o4065 | gtctcgcaaaaaatgttcatcagcccaaaacatcattaccttct | PIB21-620 truncation |
| 46 | o3999 | agaaggtaatgatgttttgggctgatgaacattttttgcgagac | PIB21-620 truncation |
| 47 | o1440 | GCTAGAGCGGCCATTACGGCCCCGGAGATTTATGGACCTC | KOG1 cloning into pPR3N |
| 48 | o1442 | CGATCTCGGGCCGAGGCGGCCTCAAAAATAATCAATTCTCTCGTC | KOG1 cloning into pPR3N |
| 49 | o3787 | GCTAGAGCGGCCATTACGGCC GAATTGTACAAATCTAGAACTAGT | cloning PIB2 fragments into pCabWT* |
| 50 | o3788 | CGATCTCGGGCCGAGGCGGCCAA GAAACTACTCCAATTCCAGTTTGC | cloning PIB2 fragments into pCabWT* |
| 51 | o3872 | CGATCTCGGGCCGAGGCGGCCAAGCCCAAAACATCATTACCTTCTTCT | cloning PIB2 fragments into pCabWT* |
| 52 | o3871 | CGATCTCGGGCCGAGGCGGCCAAATCTTCGCCCTCCTCAACGT | cloning PIB2 fragments into pCabWT* |
| 53 | o3870 | CGATCTCGGGCCGAGGCGGCCAAGTTGATTCTGTCGCTGTTCG | cloning PIB2 fragments into pCabWT* |
| 54 | o3933 | GCTAGAGCGGCCATTACGGCCAGGAAGAAATTACGCAATTACTAC | cloning PIB2 fragments into pCabWT* |
| 55 | o3934 | GCTAGAGCGGCCATTACGGCC AGTGTTATCGGCTCTGTGCC | cloning PIB2 fragments into pCabWT* |
| 56 | o3868 | CGATCTCGGGCCGAGGCGGCCAAATTAGTGCTCGAAGCAGGCT | cloning PIB2 fragments into pCabWT* |
| 57 | o3867 | CGATCTCGGGCCGAGGCGGCCAAGTCATCCGTGAATGGCAACG | cloning PIB2 fragments into pCabWT* |
| 58 | o3866 | CGATCTCGGGCCGAGGCGGCCAAGCCTGCCCCTGTTGAGCTCT | cloning PIB2 fragments into pCabWT* |
| 59 | o3865 | CGATCTCGGGCCGAGGCGGCCAAGTCAGCACCGCTTTCCTCAT | cloning PIB2 fragments into pCabWT* |
-
Oligonucleotides #1 and #2, ordered as PAGE-purified and lyophilized, are resuspended at 100 μM in water. Oligonucleotide #3, ordered as HPLC-purified and lyophilized, is resuspended at 100 μM in water and distributed into single-use aliquots.
Table 4
Plasmids used in this study.
| Name | Parent | Description | Reference |
|---|---|---|---|
| pBK257 | pWL80R_4x | CEN/URA3, carries MiniDs in ADE2 and hyperactive Ac transposase under GAL1 promoter | This study |
| pWL80R_4x | CEN/URA3, carries hyperactive Ac transposase under GAL1 promoter | Lazarow et al. (2012) | |
| pCORE-UH | Delitto pefetto URA3 cassette | Storici and Resnick (2003) | |
| pJM7 | pENTRY-YEN1ON | This study | |
| pRS413 | CEN/HIS3, empty vector | Sikorski and Hieter, 1989 | |
| pRS415 | CEN/LEU2, empty vector | Sikorski and Hieter, 1989 | |
| pRS416 | CEN/URA3, empty vector | Sikorski and Hieter, 1989 | |
| p1822 | pRS413 | CEN/HIS3, GTR1 | This study |
| p1451 | pRS415 | CEN/LEU2, GTR2 | This study |
| p1821 | pRS413 | CEN/HIS3, GTR1Q65L | This study |
| p1452 | pRS415 | CEN/LEU2, GTR2S23L | This study |
| p3084 | pRS416 | CEN/URA3, PIB2 | This study |
| p3099 | p3084 | CEN/URA3, PIB2165-635 | This study |
| p3097 | p3084 | CEN/URA3, PIB2304-635 | This study |
| p3101 | p3084 | CEN/URA3, PIB2221-635 | This study |
| p3253 | pRS426 | 2 μ/URA3, PIB2 | This study |
| p3255 | pRS426 | 2 μ/URA3, PIB2165-635 | This study |
| p3163 | p3084 | CEN/URA3, PIB2426-635 | This study |
| p3153 | p3084 | CEN/URA3, PIB2Δ426-532 | This study |
| p3154 | p3084 | CEN/URA3, PIB2Δ533-620 | This study |
| p3156 | p3084 | CEN/URA3, PIB21-620 | This study |
| pPR3N | 2 μ/TRP1, NubG-HA | Dualsystems Biotech AG | |
| pCabWT | CEN/LEU2, Aβ-Cub-LexA-VP16 | Dualsystems Biotech AG | |
| p3081 | pPR3N | 2 μ/TRP1, NubG-HA-KOG1 | This study |
| p2966 | pCabWT | CEN/LEU2, Aβ-PIB2-Cub-LexA-VP16 | This study |
| p3002 | pCabWT | CEN/LEU2, Aβ-PIB21-620-Cub-LexA-VP16 | This study |
| p3007 | pCabWT | CEN/LEU2, Aβ-PIB21-550-Cub-LexA-VP16 | This study |
| p3001 | pCabWT | CEN/LEU2, Aβ-PIB21-428-Cub-LexA-VP16 | This study |
| p3051 | pCabWT | CEN/LEU2, Aβ-PIB2440-550-Cub-LexA-VP16 | This study |
| p3054 | pCabWT | CEN/LEU2, Aβ-PIB2556-620-Cub-LexA-VP16 | This study |
| p3052 | pCabWT | CEN/LEU2, Aβ-PIB2621-635-Cub-LexA-VP16 | This study |
| p3000 | pCabWT | CEN/LEU2, Aβ-PIB21-312-Cub-LexA-VP16 | This study |
| p2987 | pCabWT | CEN/LEU2, Aβ-PIB2304-635-Cub-LexA-VP16 | This study |
| p2999 | pCabWT | CEN/LEU2, Aβ-PIB21-162-Cub-LexA-VP16 | This study |
| p2986 | pCabWT | CEN/LEU2, Aβ-PIB2165-635-Cub-LexA-VP16 | This study |
| p2998 | pCabWT | CEN/LEU2, Aβ-PIB21-101-Cub-LexA-VP16 | This study |
| p2991 | pCabWT | CEN/LEU2, Aβ-PIB2102-635-Cub-LexA-VP16 | This study |
| p2997 | pCabWT | CEN/LEU2, Aβ-PIB21-49-Cub-LexA-VP16 | This study |
| p2990 | pCabWT | CEN/LEU2, Aβ-PIB250-635-Cub-LexA-VP16 | This study |
Additional files
-
Supplementary file 1
Processed dataset containing (1) the position and number of reads for all transposons in each library (in the WIG format),
Processed dataset - Dpl1del.wig
Processed dataset - Mmm1Del_Vps13D716H.wig
Processed dataset - Psd2Del_Dpl1del.wig
Processed dataset - V13D716H.wig
Processed dataset - WildType1.wig
Processed dataset - WildType2.wig
Processed dataset - WT_plus_rapamycin.wig
Processed dataset - Yen1on.wig
summaries of the number of transposon and number of reads per gene, for all genes in each library (in the TXT format).
Processed dataset - Dpl1del_pergene.txt
Processed dataset - Mmm1Del_Vps13D716H_pergene.txt
Processed dataset - Psd2Del_Dpl1del_pergene.txt
Processed dataset - V13D716H_pergene.txt
Processed dataset - WildType1_pergene.txt
Processed dataset - WildType2_pergene.txt
Processed dataset - WT_plus_rapamycin_pergene.txt
Processed dataset - Yen1on_pergene.txt
- https://doi.org/10.7554/eLife.23570.023
-
Supplementary file 2
Table of genes appearing as essential in our analysis (i.e., their density of transposon is below 1/400 bp), but were not previously annotated as essential.
The likely explanation for the low transposon density is written in column B for each gene.
- https://doi.org/10.7554/eLife.23570.024
-
Supplementary file 3
Data computed to draw the volcano plots (Figure 4—figure supplement 1)
- https://doi.org/10.7554/eLife.23570.025
-
Source code 1
MatLab Script 1.
- https://doi.org/10.7554/eLife.23570.026
-
Source code 2
MatLab Script 2.
- https://doi.org/10.7554/eLife.23570.027
Download links
A two-part list of links to download the article, or parts of the article, in various formats.
Downloads (link to download the article as PDF)
Open citations (links to open the citations from this article in various online reference manager services)
Cite this article (links to download the citations from this article in formats compatible with various reference manager tools)
Functional mapping of yeast genomes by saturated transposition
eLife 6:e23570.
https://doi.org/10.7554/eLife.23570


