The dynamic three-dimensional organization of the diploid yeast genome
- University of Washington, United States
- Northwestern University, United States
- Howard Hughes Medical Institute, University of Washington, United States
Figures
Figure 1 with 4 supplements
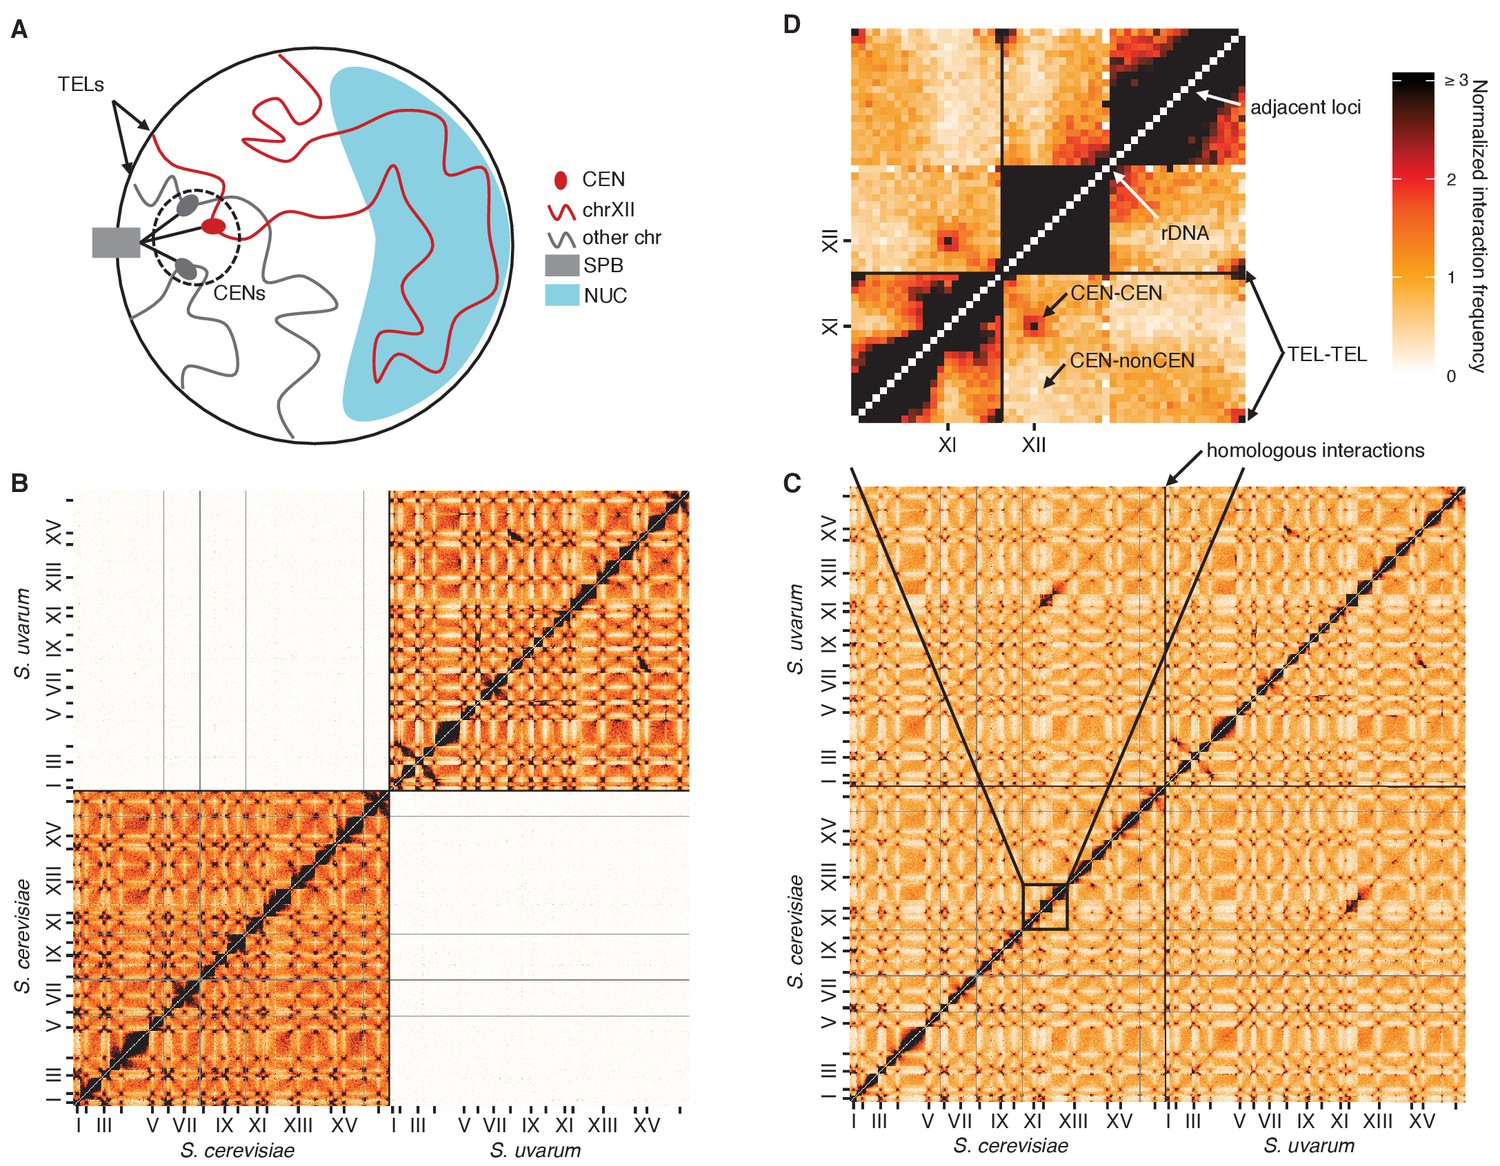
Diverged hybrids provide a genome-wide view of diploid chromosome conformation.
(A) Schematic of the Rabl-like orientation. CEN, centromere; SPB, spindle pole body; TEL, telomere; NUC, nucleolus. (B) Hi-C contact map for saturated S. cerevisiae and S. uvarum mixture control, at 32 kb resolution. Each axis represents the S. cerevisiae genome followed by the S. uvarum genome in syntenic order, separated by a black line. Ticks indicate centromeres. Odd-numbered centromeres are labeled. Rows and columns with insufficient data are colored grey. (C) Hi-C contact map for saturated S. cerevisiae x S. uvarum hybrid, as in (B). (D) The portion of the map outlined in black in (C), is enlarged with annotated features of the Rabl-like orientation.
Figure 1—figure supplement 1
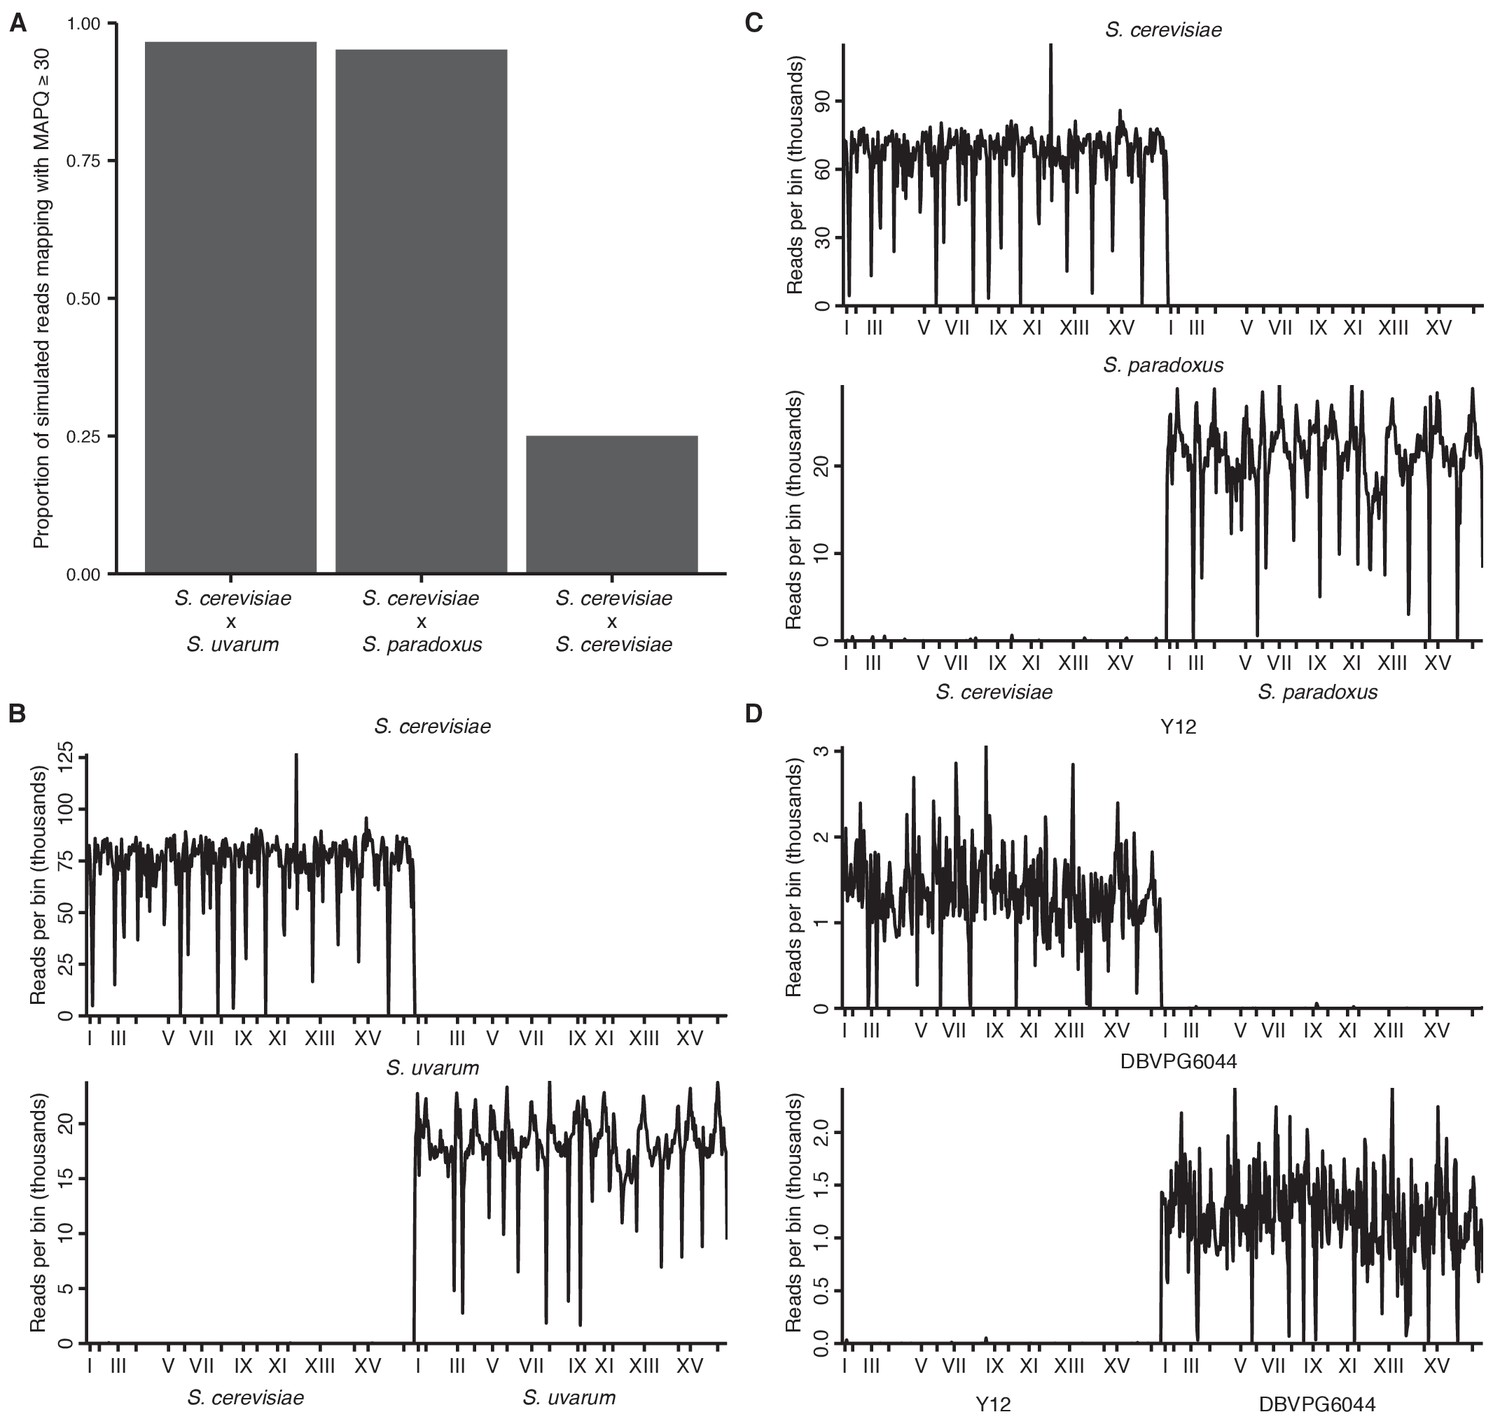
Mappability of hybrid yeast genomes.
(A) Proportion of simulated reads from each hybrid (80 bp for interspecific and 150 bp for intraspecific hybrids, in 10 bp windows across the reference genome) that can be remapped correctly to the reference with a mapping quality score (MAPQ) of at least 30. (B) Number of reads (in thousands) from separate S. cerevisiae (left) or S. uvarum (right) Hi-C libraries mapping to each 32 kb genomic bin in the S. cerevisiae x S. uvarum hybrid reference genome. x ticks indicate centromeres; odd-numbered centromeres are labeled. (C) Same as (B) for S. cerevisiae (left) and S. paradoxus (right) mapping to S. cerevisiae x S. paradoxus. (D) Same as (B) for S. cerevisiae Y12 (left) and S. cerevisiae DBVPG6044 (right) mapping to Y12 x DBVPG6044.
Figure 1—figure supplement 2
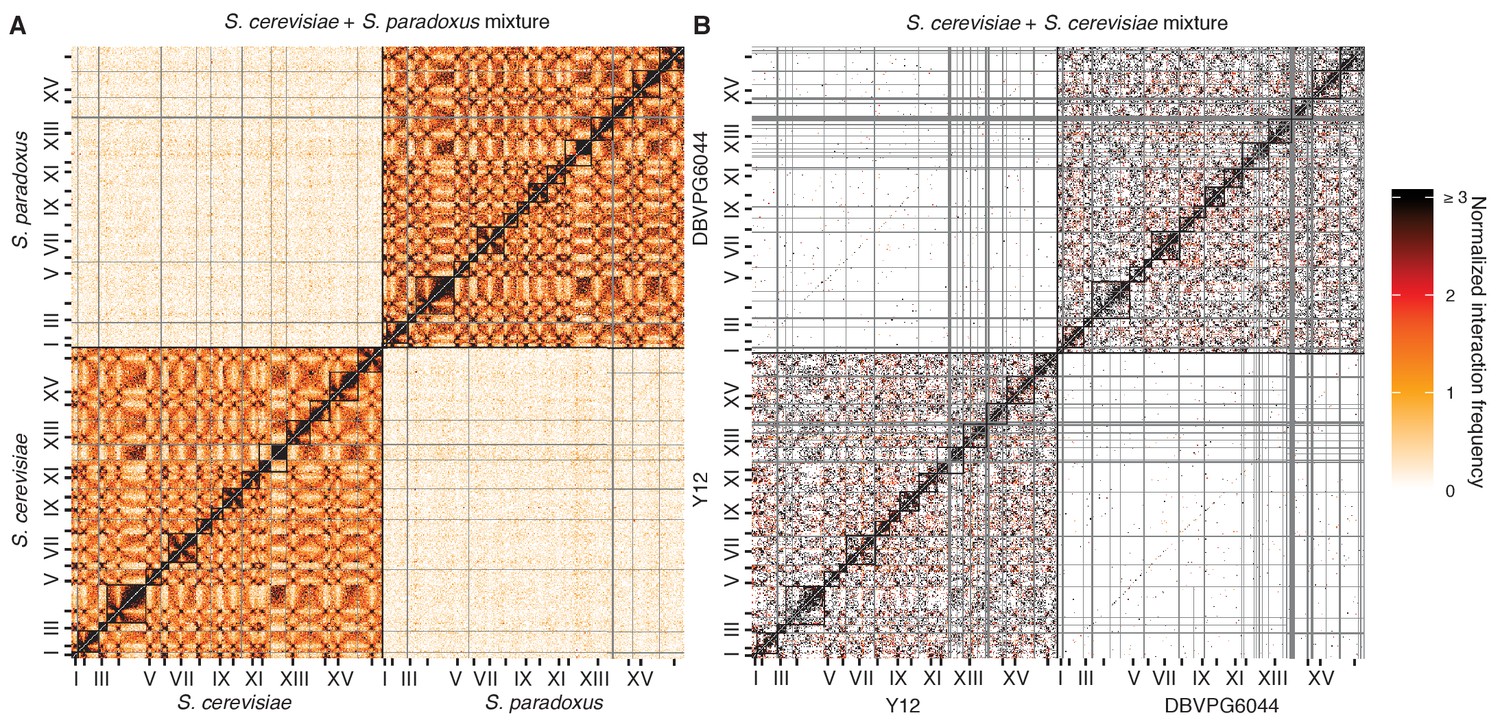
Mixture control experiments for S. cerevisiae x S. paradoxus and S. cerevisiae x S. cerevisiae hybrids.
(A) Hi-C contact map for a mixture of S. cerevisiae and S. paradoxus in exponential growth, at 32 kb resolution. Each axis represents the S. cerevisiae genome followed by the S. paradoxus genome, in syntenic order, separated by a black line; tick marks indicate centromere positions, and odd-numbered chromosome centromeres are labeled. Intrachromosomal interactions are outlined by black squares along the diagonal. Rows and columns with an average of less than one read pair per bin were filtered out, and are colored grey. (B) Hi-C contact map for a mixture of S. cerevisiae Y12 and S. cerevisiae DBVPG6044 haploids in exponential growth, as in (A).
Figure 1—figure supplement 3
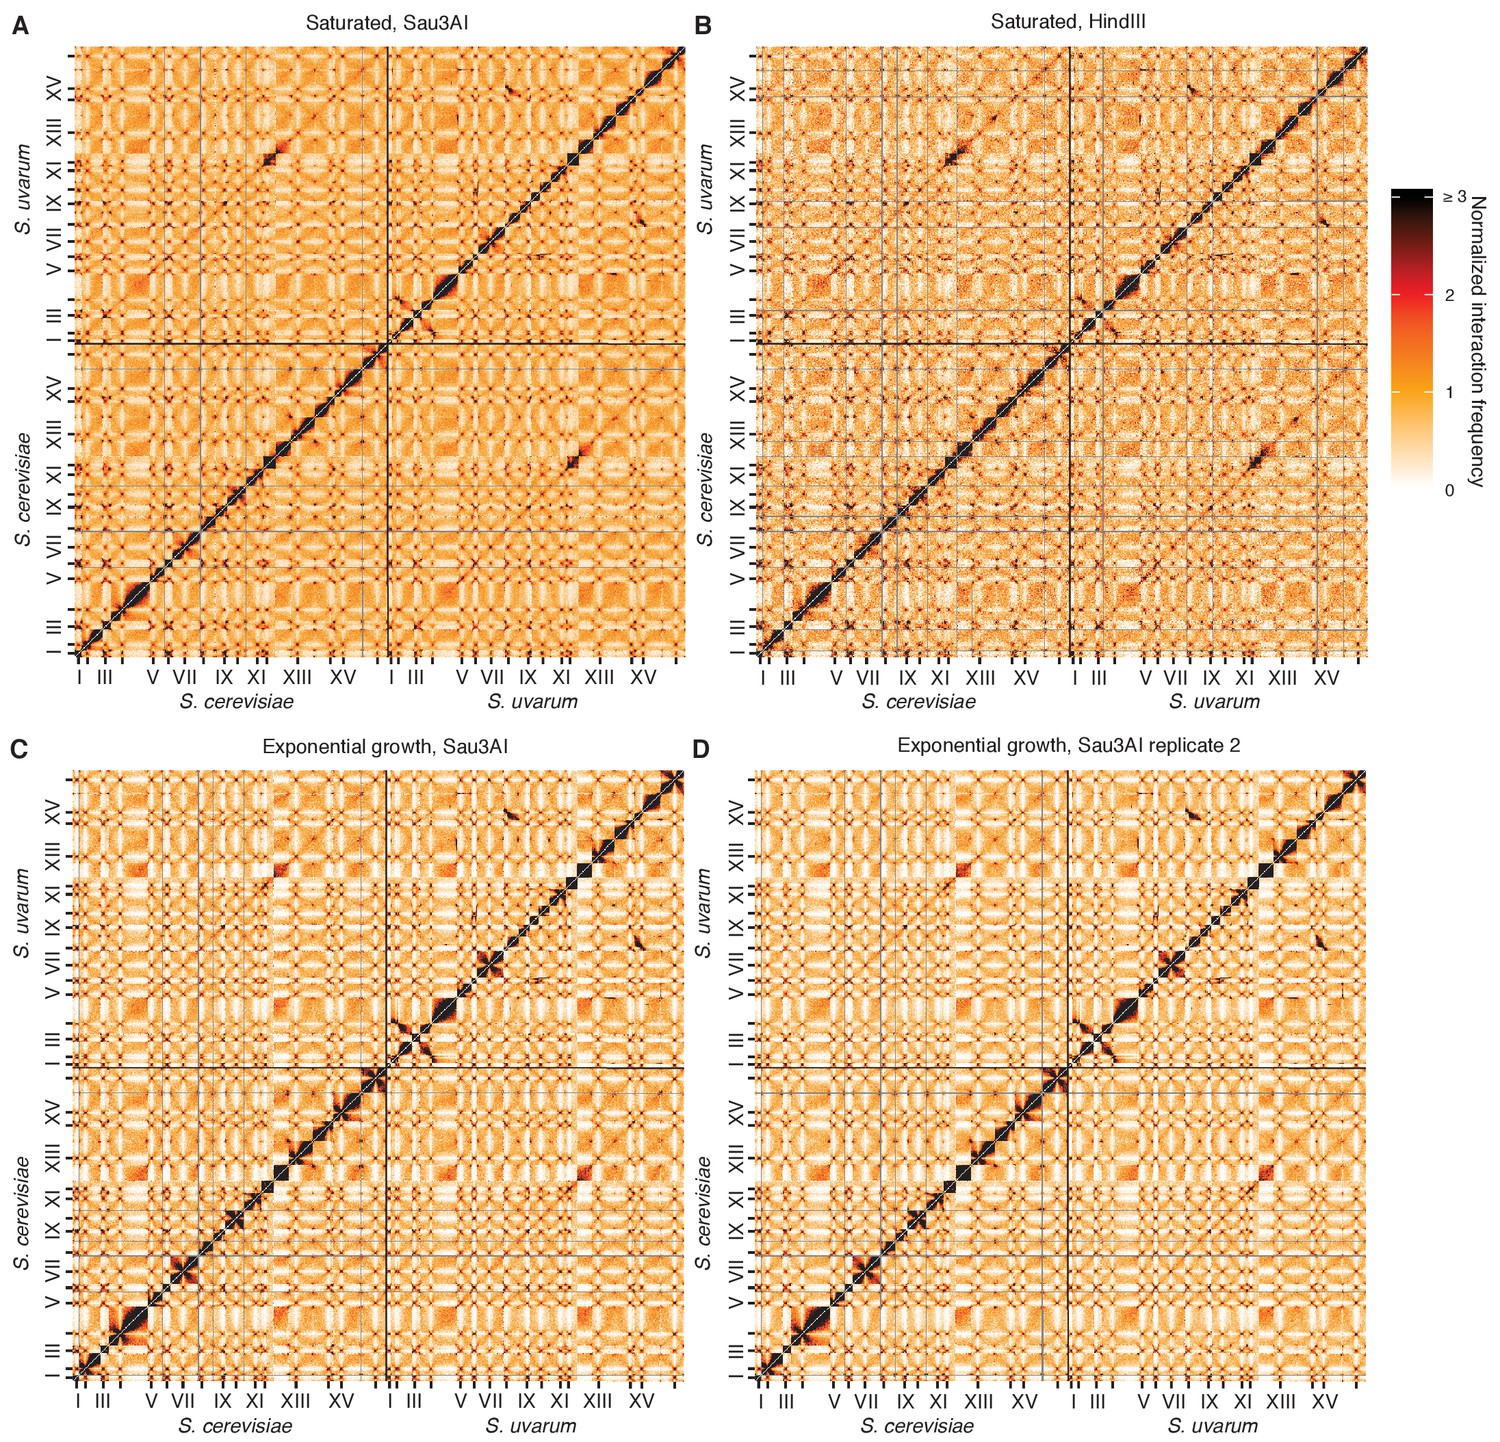
Reproducibility of Hi-C across replicates and restriction enzymes.
(A and B), Hi-C contact maps at 32 kb resolution for the S. cerevisiae x S. uvarum hybrid in saturated cultures, using the restriction enzyme Sau3AI (A) or HindIII (B). Each axis represents the S. cerevisiae genome followed by the S. uvarum genome, in syntenic order, separated by a black line; ticks indicate centromeres, and odd-numbered centromeres are labeled. Rows and columns with insufficient data are colored grey. (C and D) Same as (A) and (B) for two biological replicates of S. cerevisiae x S. uvarum hybrid in exponential growth, using the restriction enzyme Sau3AI.
Figure 1—figure supplement 4
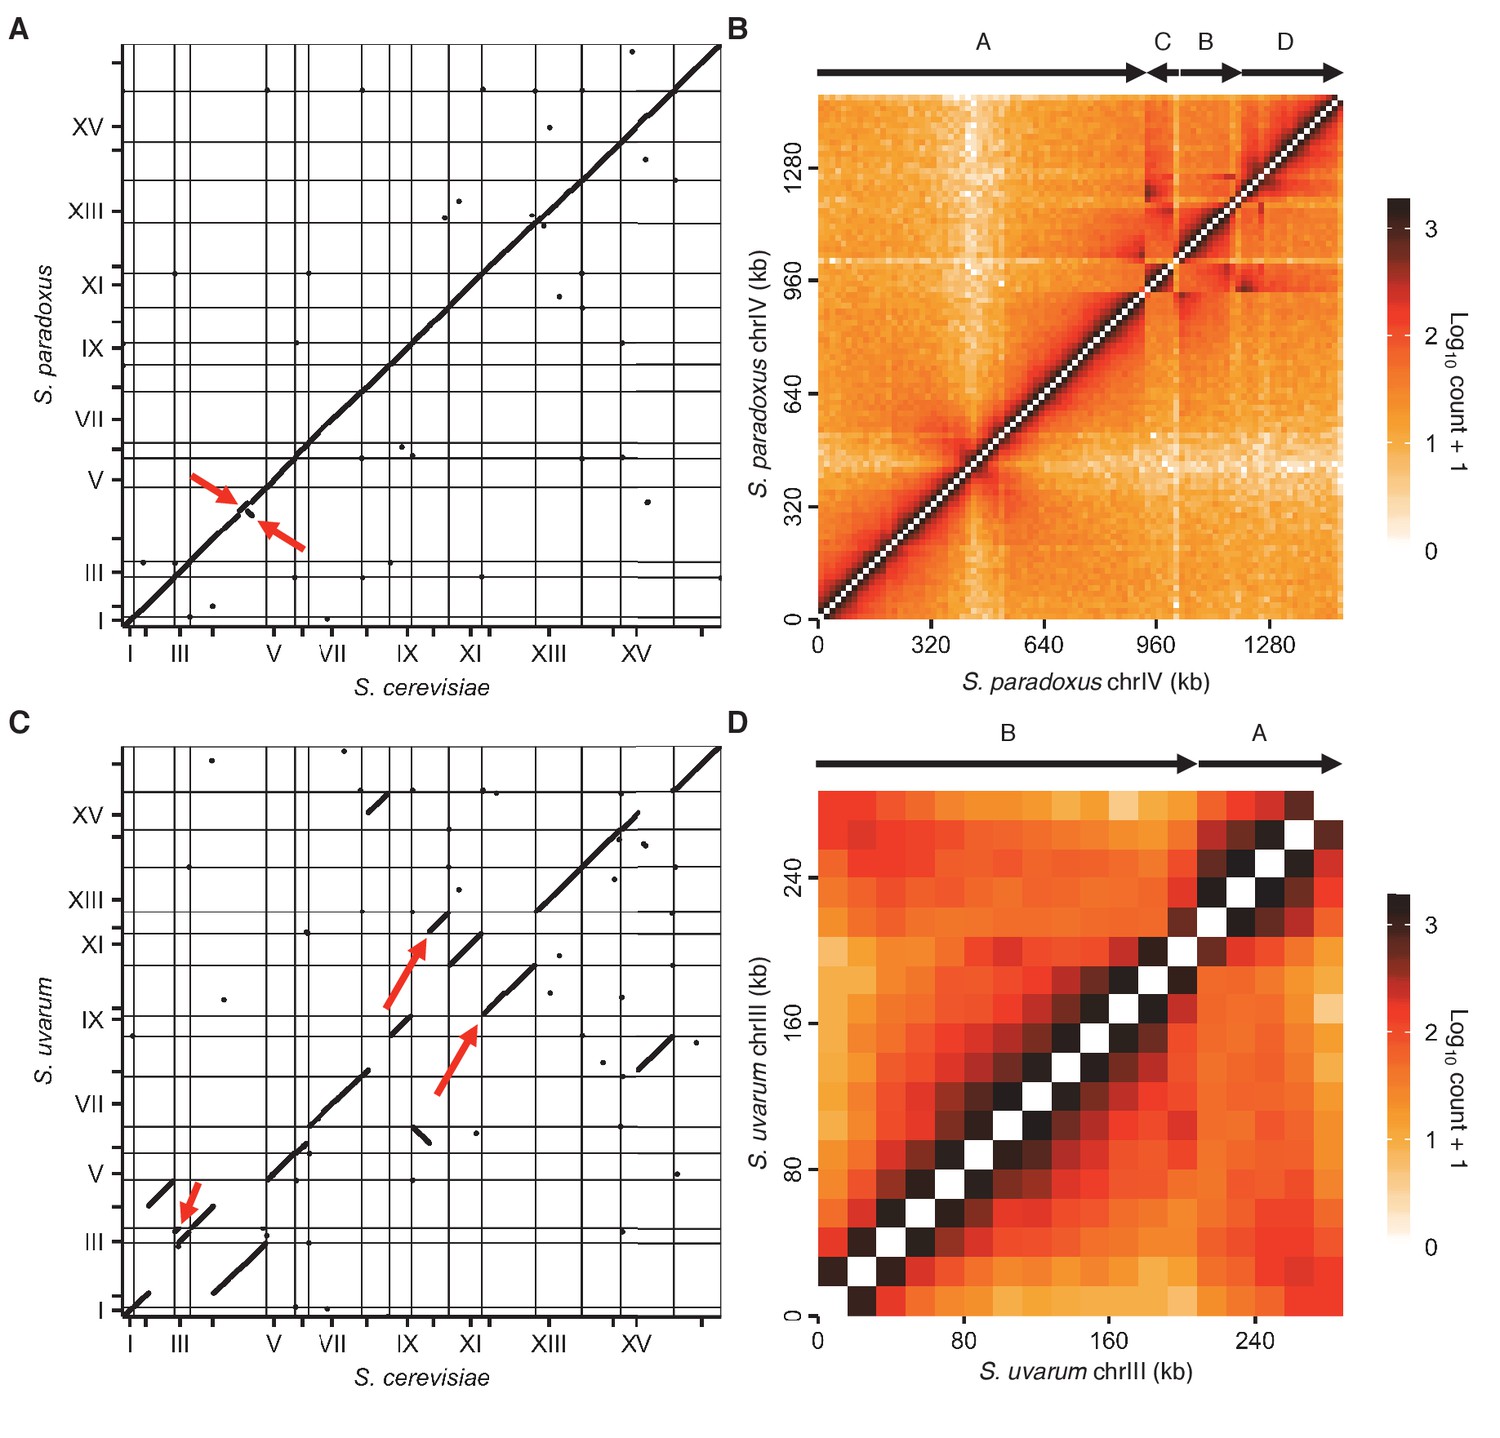
Revisions to S. paradoxus and S. uvarum reference genomes.
(A) Start and end positions of homologous genes on the original S. cerevisiae and S. paradoxus reference genomes. Each point represents the start or end of a homologous gene pair. Horizontal and vertical lines indicate starts of chromosomes, and ticks indicate centromere positions. Odd numbered chromosomes are numbered. Red arrows indicate unexpected rearrangements. (B) Raw contact map for S. paradoxus chromosome IV using the original reference genome. Arrows above the heat map represent segments of the chromosome, labeled A-D in order and orientation of synteny. (C) Same as (A) for S. cerevisiae and S. uvarum. Red arrows indicate an unexpected rearrangement in chromosome III, and S. uvarum chromosomes X and XII, which are homologous to S. cerevisiae chromosome XII and X, respectively. (D) Same as (B) for S. uvarum chromosome III.
Figure 2 with 2 supplements
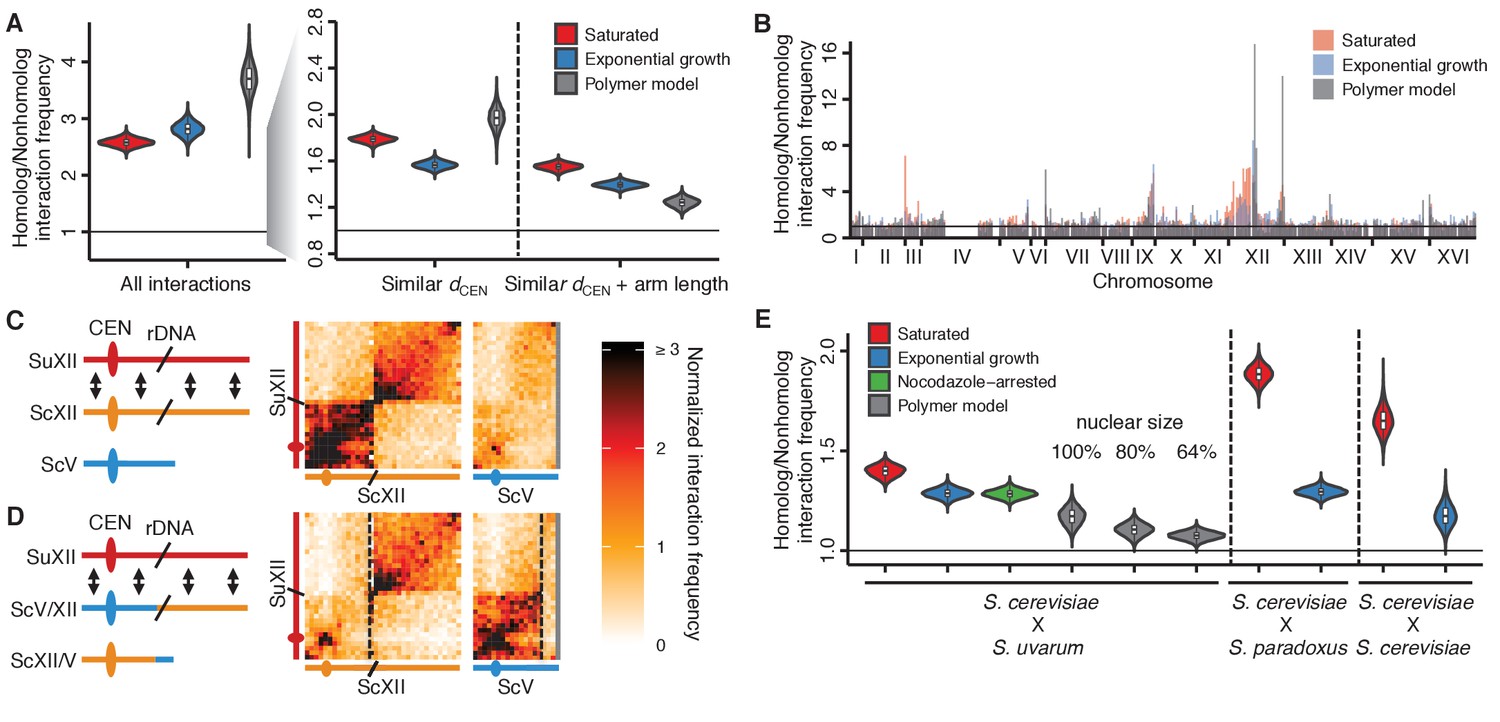
Homolog proximity exceeds predicted effects of Rabl-like orientation.
(A) Violin plot of the distribution of 10,000 sampled estimates of genomic homolog proximity (ratio of homologous to nonhomologous interaction frequencies) in the S. cerevisiae x S. uvarum hybrid, as a function of increasing comparison stringency (left to right) to account for Rabl-like orientation (Figure 2—figure supplement 1). Saturated culture data are shown in red, exponential growth in blue, and simulated data from a homology-agnostic polymer model in grey. dCEN, distance from centromere. Boxplot indicates median and interquartile range. Whiskers correspond to the highest and lowest points within 1.5× interquartile range. (B) Variation in homolog proximity across the S. cerevisiae x S. uvarum hybrid genome at 32 kb resolution, in saturated culture (red), exponential growth (blue), and the polymer model (grey). Nonhomologous interactions were restricted to similar centromere distance and chromosome arm length. Bins with insufficient data (<2 comparisons) are left blank. Data are plotted by S. cerevisiae genome position. x ticks indicate ends of chromosomes. (C and D) Schematics and Hi-C contact maps (at 32 kb resolution) of interactions between S. uvarum chromosome XII (SuXII) and either S. cerevisiae chromosome XII (ScXII) or S. cerevisiae chromosome V (ScV), in wild-type S. cerevisiae x S. uvarum hybrids (C) and a strain with a translocation between ScXII and ScV (D), both in saturated cultures. Exponential growth data are shown in Figure 2—figure supplement 2. Ovals indicate centromeres and slanted lines indicate the locations of rDNA arrays. Double-headed arrows indicate enhanced interactions. Dashed lines indicate translocation breakpoints. (E) Violin plot of homolog proximity across conditions, polymer models, and hybrids. S. cerevisiae x S. cerevisiae indicates hybrid between Y12 and DBVPG6044 strains. Calculated as in (A), but excluding chromosome XII and all 32 kb bins that include centromeres. Saturated culture data are shown in red, exponential growth in blue, nocodazole-arrested in green, and polymer models in grey. Boxplot indicates median and interquartile range. Whiskers correspond to the highest and lowest points within the 1.5× interquartile range.
Figure 2—figure supplement 1
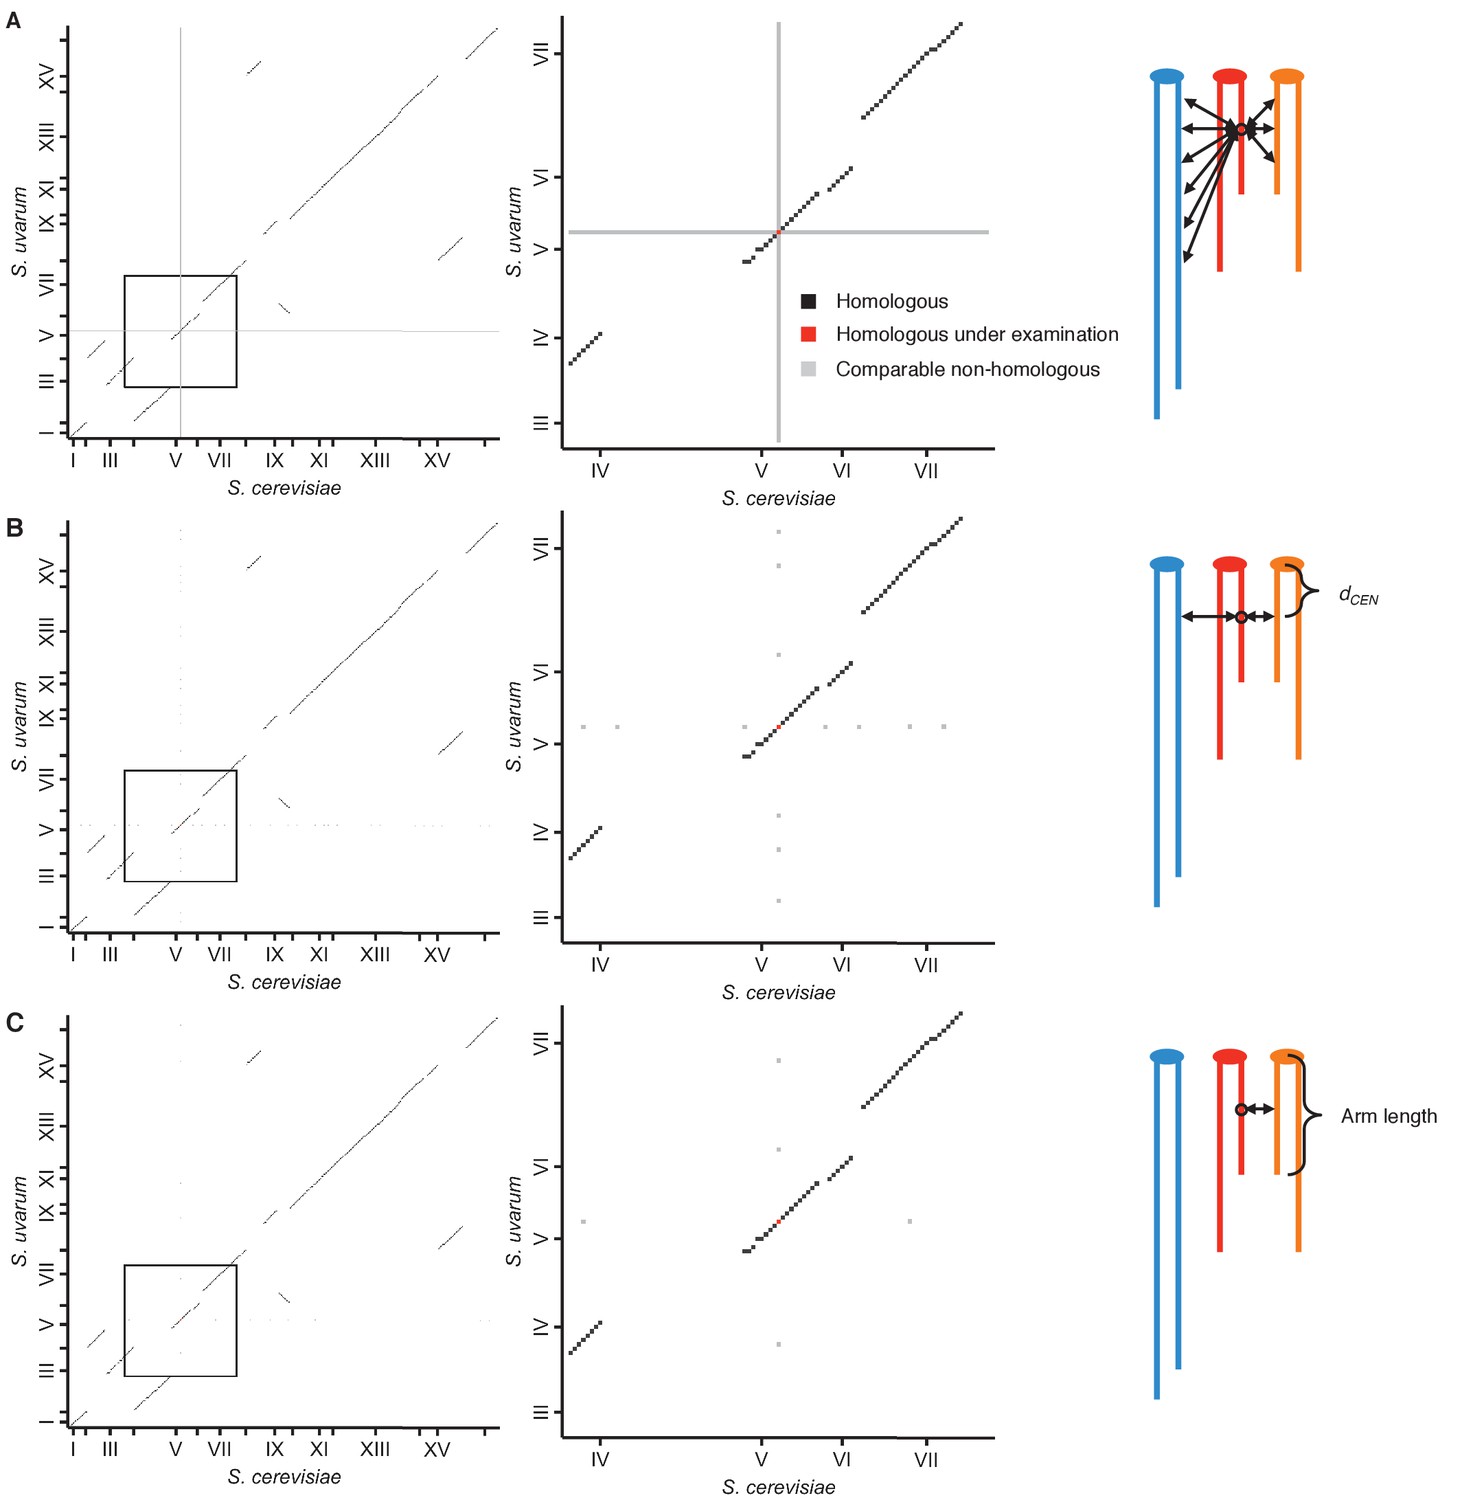
Schematic of homolog proximity analysis.
Representation of how homologous interactions (black squares) were compared to various subsets of nonhomologous interactions (grey squares), either including all interactions with either homologous locus (red squares) (A), restricted to interactions with loci at a similar centromeric distance, or dCEN (same number of 32 kb bins) (B), or restricted to interactions with loci at a similar centromeric distance and on a chromosome arm of similar length (within 25%) (C). Left panels show all interactions between the S. cerevisiae and S. uvarum genomes; middle panels show enlarged view of the area outlined in the left panels. Tick marks indicate centromere positions. Right panels represent the nonhomologous interactions being used for comparison; different colors represent nonhomologous chromosomes, and double-headed arrows represent interactions with the locus of interest (circled).
Figure 2—figure supplement 2
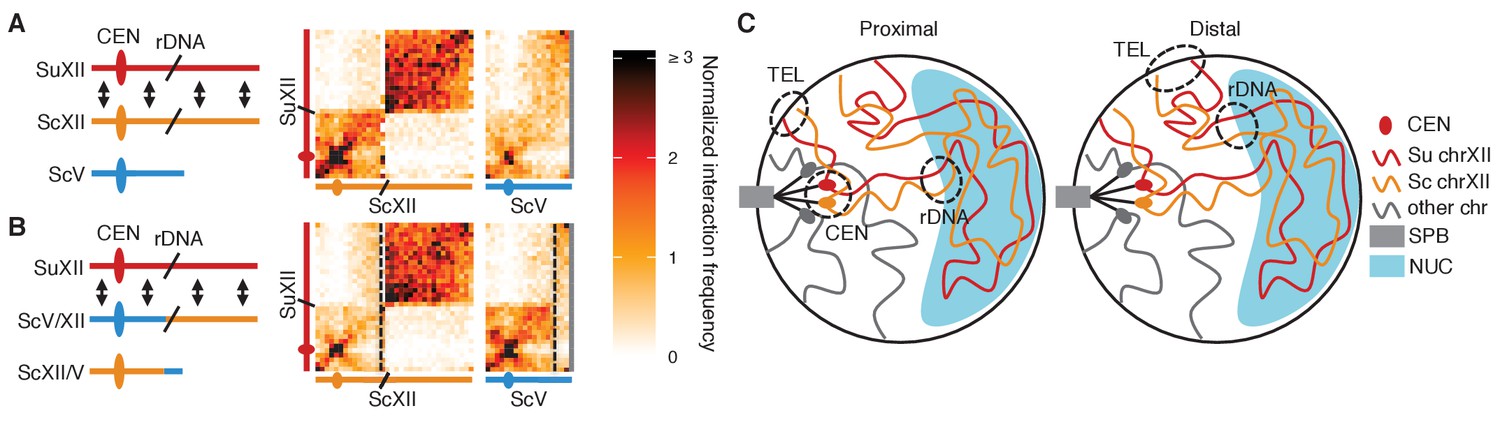
rDNA-carrying chromosomes interact preferentially due to shared tethering.
(A and B) Schematics and contact maps of rDNA-carrying chromosomes S. uvarum chromosome XII (SuXII) and S. cerevisiae chromosome XII (ScXII), and S. cerevisiae chromosome V (ScV), in wild-type S. cerevisiae x S. uvarum hybrids (A) and a strain with a translocation between ScXII and ScV (B), both in exponential growth. Ovals indicate centromeres and slanted lines indicate the rDNA arrays. Double-headed arrows indicate enhanced interactions. Dashed lines in the contact maps indicate the translocation breakpoints. (C) Schematic of how the rDNA-carrying chromosomes S. cerevisiae (Sc) chrXII and S. uvarum (Su) chrXII preferentially interact due to shared tethering. The proximal halves (left diagram) of the chromosomes, which contain the centromeres (CEN), are tethered at the spindle pole body (SPB) at their centromeres, at the periphery at their telomeres (TEL), and at the nucleolus (NUC) at their rDNA arrays (rDNA). The distal halves (right diagram) are tethered at their telomeres and rDNA, but not their centromeres. These combinations of tethering points are not found in other chromosomes (shown in grey). Su, S. uvarum; Sc, S. cerevisiae.
Figure 3 with 1 supplement
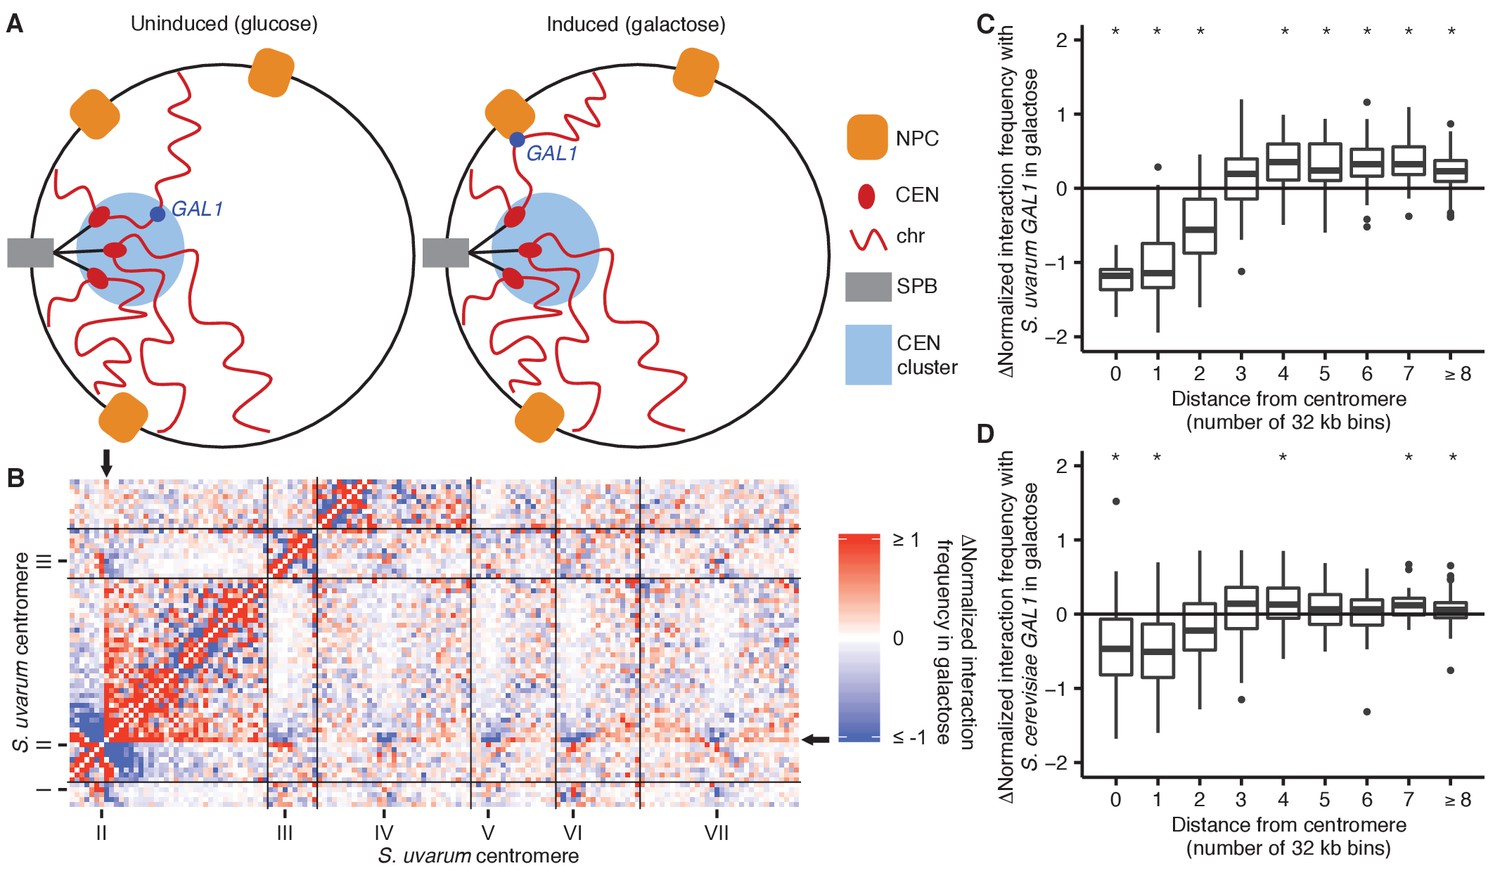
GAL1 shifts away from centromeres upon galactose induction.
(A) Schematic of GAL1 positioning (dark blue) in glucose (left) and galactose (right). NPC, nuclear pore complex; CEN, centromere; chr, chromosome; SPB, spindle pole body. (B) Example region of differential Hi-C map of S. cerevisiae x S. uvarum hybrids in galactose vs. glucose, at 32 kb resolution. Interactions that strengthen in galactose are in red, while those that weaken are in blue. Ticks indicate centromeres; black lines indicate chromosomes. Arrows indicate location of S. uvarum GAL1. (C) Boxplot of the difference in S. uvarum GAL1 interaction frequency in galactose vs. glucose across the S. cerevisiae x S. uvarum genome, excluding intrachromosomal interactions and binned by distance from the centromere (in 32 kb bins). Whiskers correspond to the highest and lowest points within the 1.5× interquartile range. *p<0.05 after Bonferroni correction (n = 9); Mann-Whitney test. Note: some outliers are beyond the plot range and are not shown. (D) Same as (C) for S. cerevisiae GAL1.
Figure 3—figure supplement 1
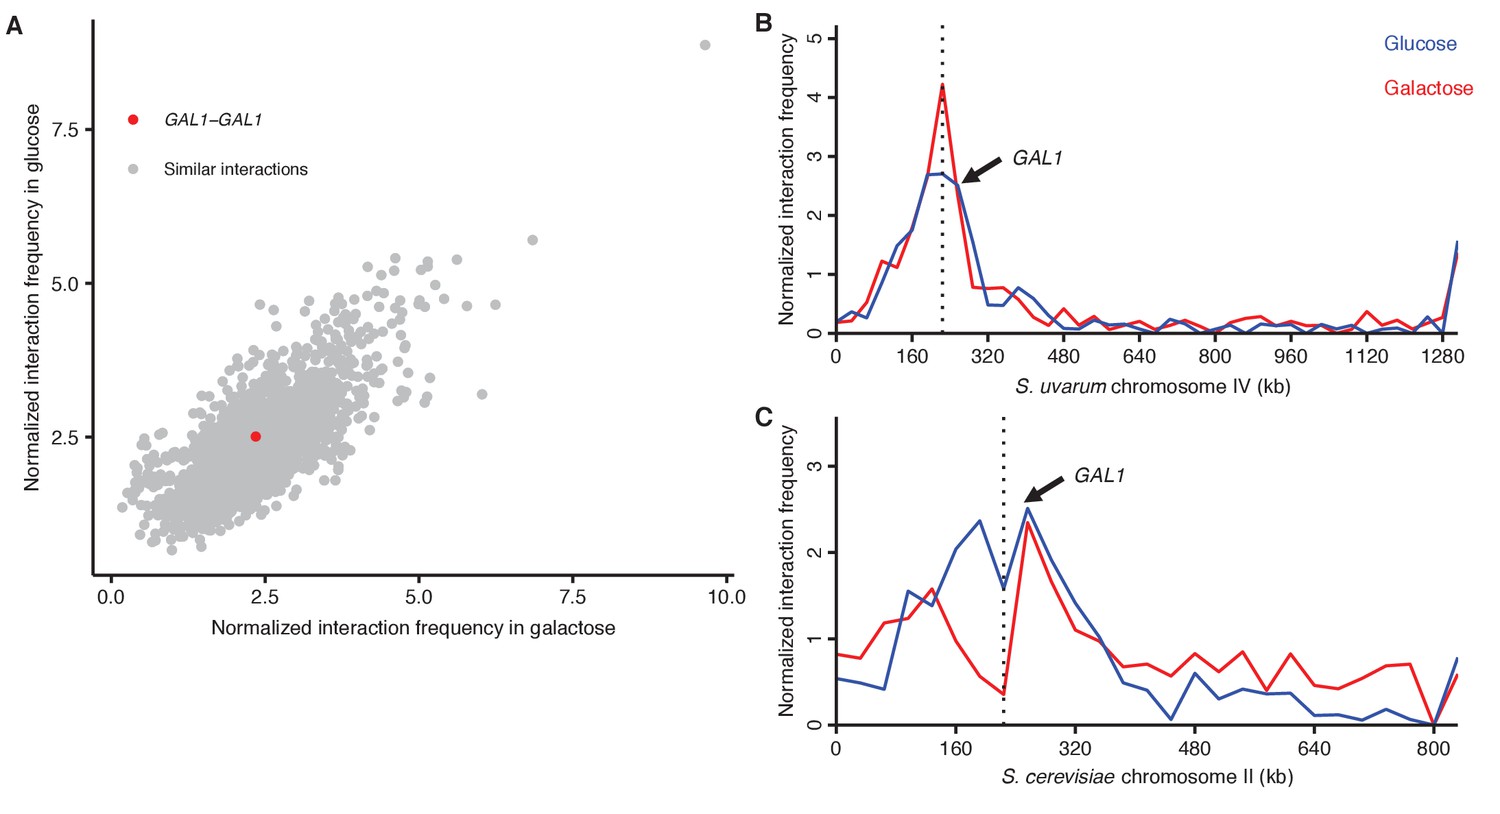
GAL1 homologs do not detectably pair during galactose induction.
(A) Scatter plot of normalized interaction frequencies in galactose (x-axis) and in glucose (y-axis), between the GAL1 homologs (in red) and other interactions between loci at the same centromeric distance (in grey). All interactions are between 32 kb bins. (B) Normalized interaction frequencies between the S. cerevisiae GAL1 and the S. uvarum chromosome IV in glucose (blue) and galactose (red). Arrow points toward interaction between GAL1 homologs, and the dashed line indicates the location of the centromere. (C) Same as (B) for the S. uvarum GAL1 and the S. cerevisiae chromosome II.
Figure 4 with 3 supplements
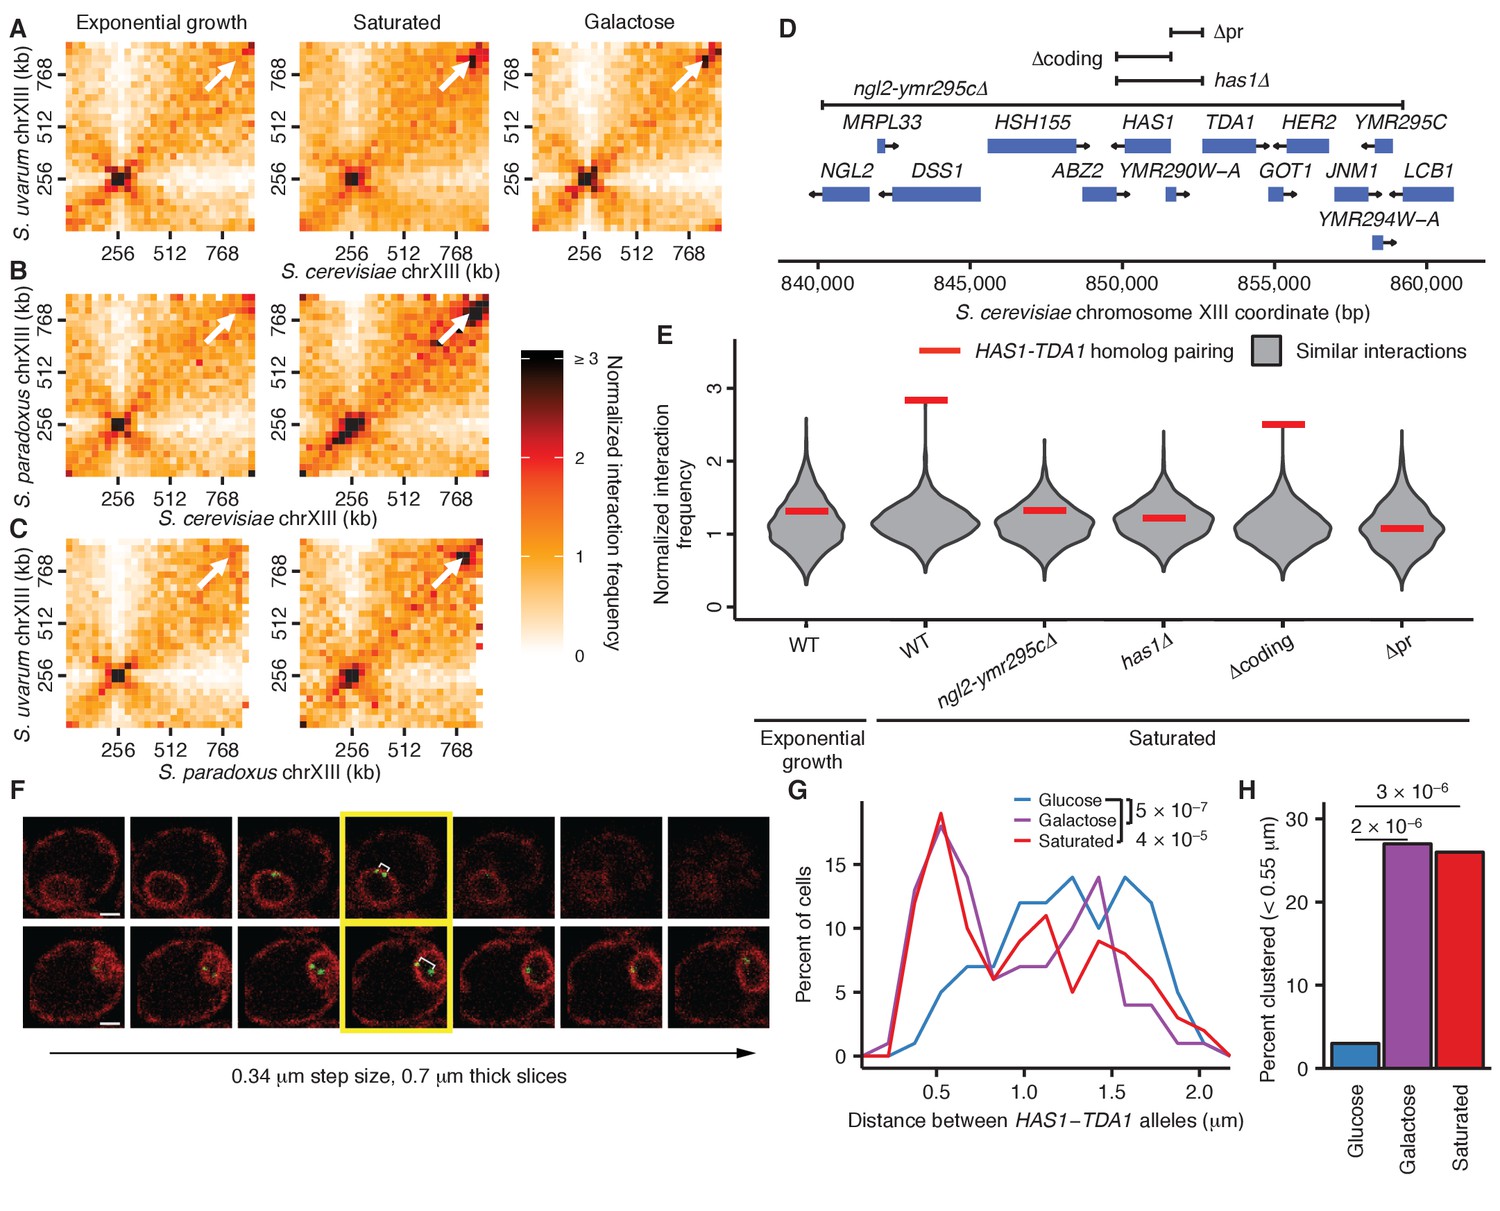
Inducible pairing of HAS1-TDA1 homologs is evolutionarily conserved and sequence-specific.
(A), (B), and (C) Hi-C contact maps of chromosome XIII interactions at 32 kb resolution in S. cerevisiae x S. uvarum (A), S. cerevisiae x S. paradoxus (B), and S. paradoxus x S. uvarum (C) hybrids in exponential growth (left column), saturated cultures (middle column), and in S. cerevisiae x S. uvarum hybrids (A), galactose (right column). White arrows indicate the interaction between the homologous HAS1-TDA1 loci. (D) Genome browser shot of open-reading frames (ORFs; blue boxes) and tested deletions (brackets) in the S. cerevisiae region surrounding the genes HAS1 and TDA1, from positions 840,000–860,000 (Figure 4—figure supplement 1A). Arrows indicate ends and directionalities of ORFs. (E) Strength of HAS1-TDA1 homolog pairing at 32 kb resolution (red lines) compared to similar interactions (grey violin plots; i.e. interactions between an S. cerevisiae locus and an S. uvarum locus, where both loci are ≥15 bins from a centromere and ≥1 bin from a telomere, and not both on chromosome XII) in wild-type and deletion strains of S. cerevisiae x S. uvarum. See Figure 4—figure supplement 2 for Hi-C contact maps of deletion strains. (F) Two example z-stacks of images used to measure distances between HAS1-TDA1 alleles tagged with LacO arrays targeted by LacI-GFP (shown in green), with membranes labeled by ER04 mCherry (shown in red). The yellow outline indicates the images chosen for analysis. White brackets indicate the measured distance. Scale bar = 1 µm. (G) Distributions of the distance between the HAS1-TDA1 alleles measured by microscopy in S. cerevisiae diploids in glucose (blue), galactose (purple), and saturated cultures (red). n = 100 for each condition. p-Values were calculated using the Wilcoxon rank sum test. (H) Frequency of HAS1-TDA1 alleles less than 0.55 µm apart, measured as in (G), in glucose (blue), galactose (purple), or saturated cultures (red). p-Values were calculated using Fisher’s exact test.
-
Figure 4—source data 1
Raw cell counts for Figure 4G and H.
- https://doi.org/10.7554/eLife.23623.014
Figure 4—figure supplement 1
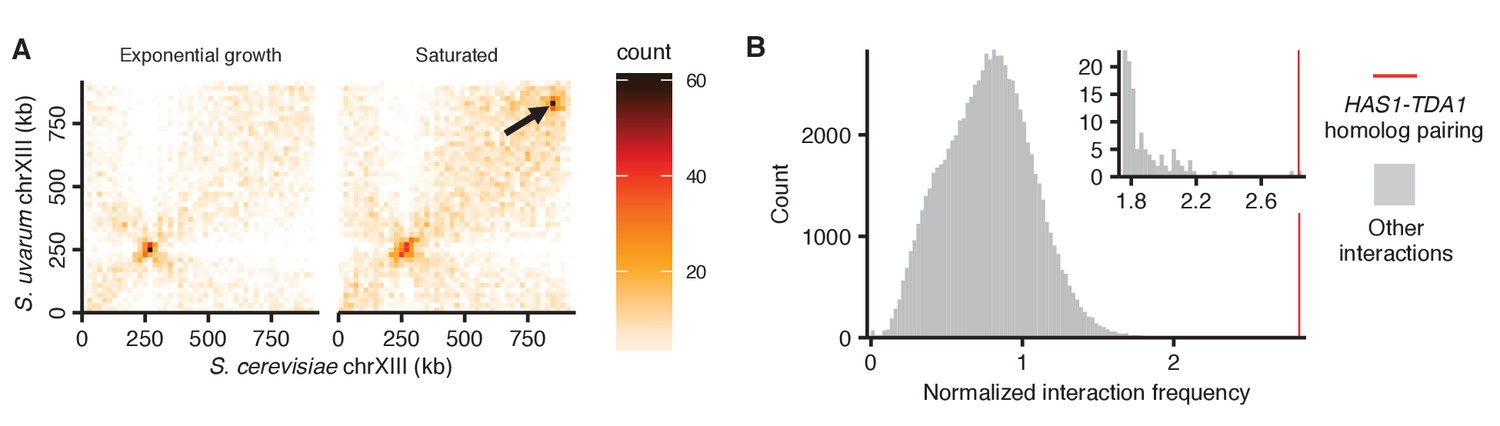
Exceptional inducible homolog pairing at HAS1-TDA1 locus.
(A) Raw Hi-C contact maps at 20 kb resolution for S. cerevisiae and S. uvarum chromosome XIII. Arrow points to strongest interaction in saturated culture excluding regions near centromeres, at positions 840,000–860,000 on the S. cerevisiae chromosome XIII, the target of deletion studies. (B) Histogram comparing HAS1-TDA1 homolog pairing interaction frequency (red line) to all other interactions (grey) between an S. cerevisiae locus and an S. uvarum locus (32 kb bin), with both loci ≥3 bins from a centromere, >1 bin from a telomere, and not both on an rDNA-carrying chromosome. Inset shows enlarged view of right end of plot.
Figure 4—figure supplement 2
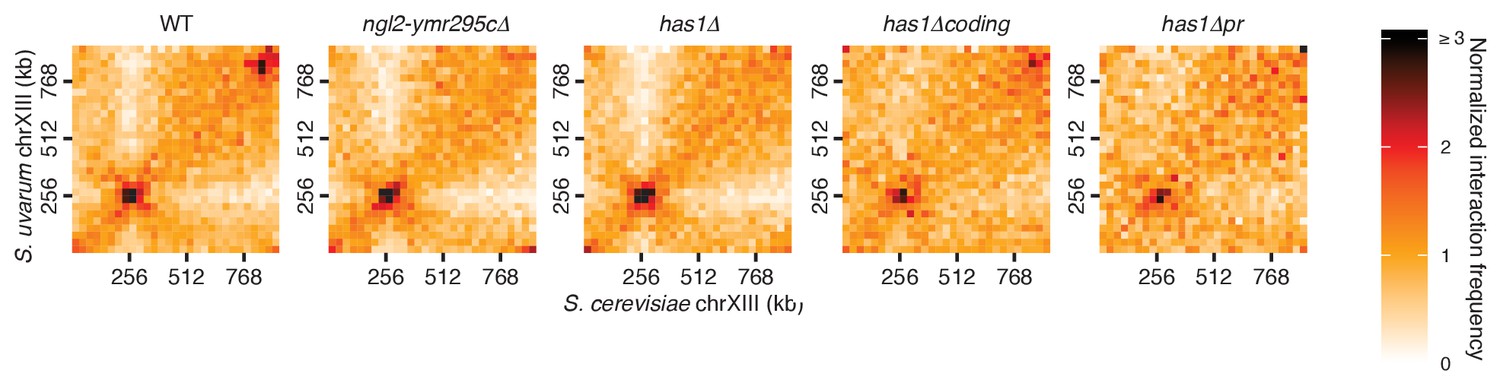
HAS1-TDA1 homolog pairing does not shift nearby upon deletion.
Hi-C contact maps of chromosome XIII interactions at 32 kb resolution in S. cerevisiae x S. uvarum hybrids in saturated cultures, in wild-type (WT) and deletion strains. See Figure 4D for deletion boundaries.
Figure 4—figure supplement 3
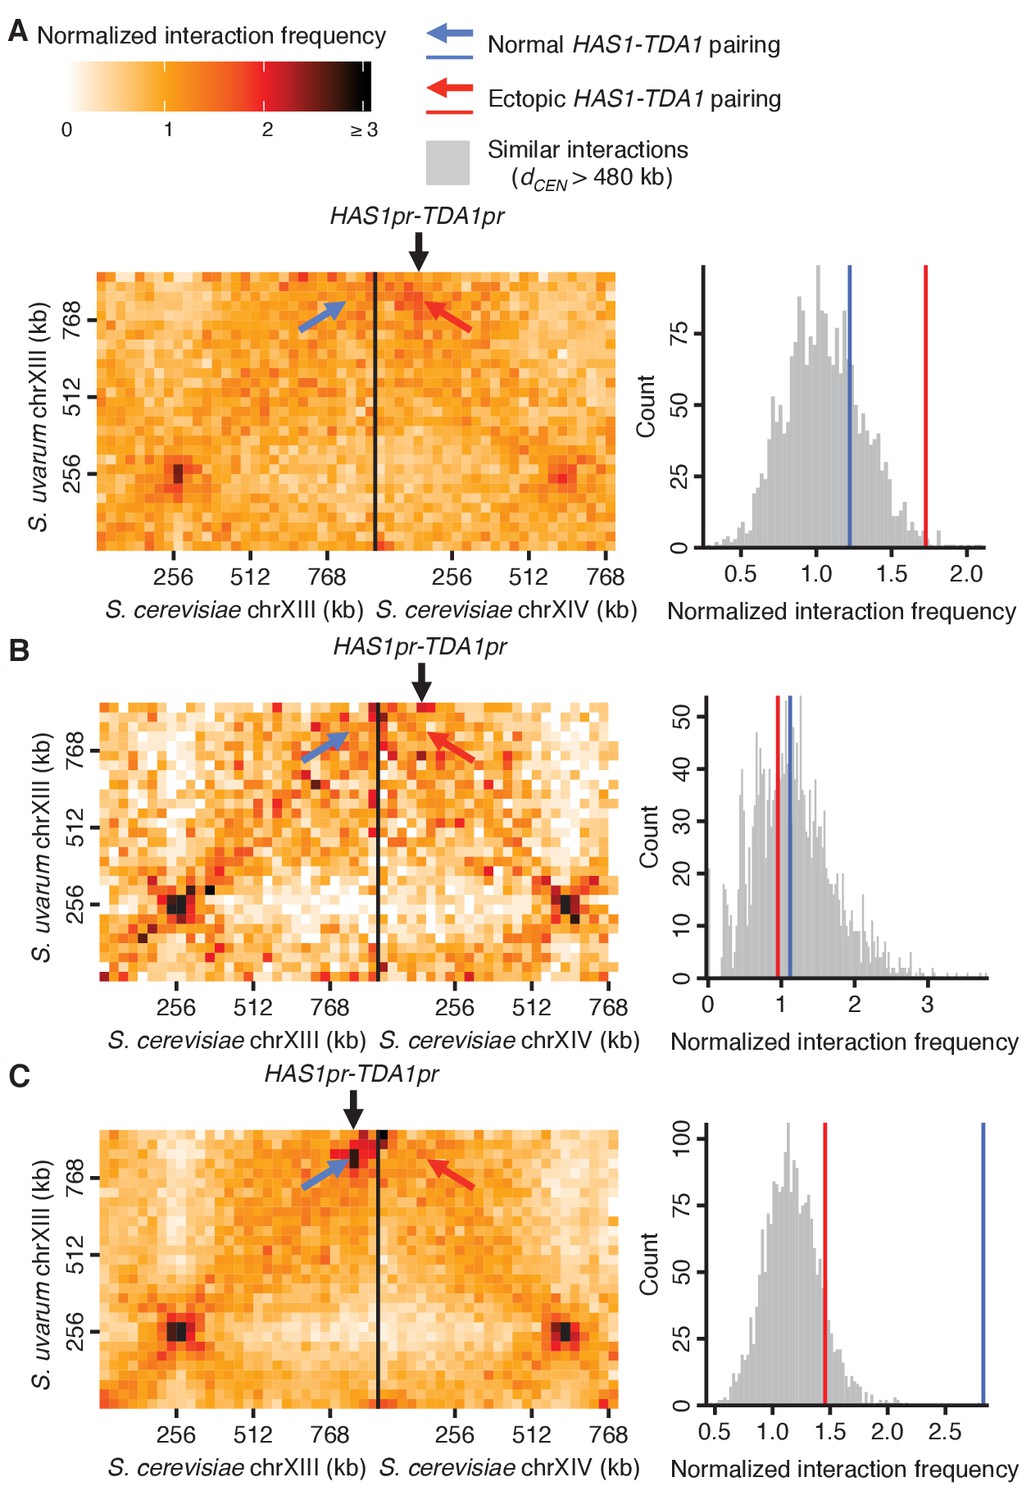
HAS1-TDA1 homolog pairing is recapitulated ectopically by the HAS1 and TDA1 promoters.
Genomic relocation of the S. cerevisiae HAS1pr-TDA1pr 1 kb region causes inducible ectopic pairing with the S. uvarum HAS1-TDA1 allele. (Left) Hi-C contact maps of interactions between S. uvarum chromosome XIII and S. cerevisiae chromosomes XIII and XIV in the S. cerevisiae x S. uvarum hybrid with the S. cerevisiae HAS1pr-TDA1pr region moved to S. cerevisiae chromosome XIV (location indicated by vertical black arrow), in saturated culture (A) and in exponential growth (B), compared to the wild-type hybrid (C) in saturated culture. Interactions between the S. uvarum HAS1-TDA1 locus and the original S. cerevisiae HAS1-TDA1 locus are indicated by a blue arrow, whereas interactions with the new HAS1pr-TDA1pr locus are indicated by a red arrow. (Right) Histograms comparing the pairing frequency of the S. uvarum HAS1-TDA1 locus and either the normal S. cerevisiae HAS1-TDA1 locus (blue line) or the ectopic HAS1pr-TDA1pr locus (red line) to the frequency of all similar interactions, that is, those between an S. cerevisiae locus and an S. uvarum locus (32 kb bin), with both loci ≥15 bins from a centromere (or dCEN >480 kb),>1 bin from a telomere, and not both on an rDNA-carrying chromosome.
Figure 5 with 2 supplements
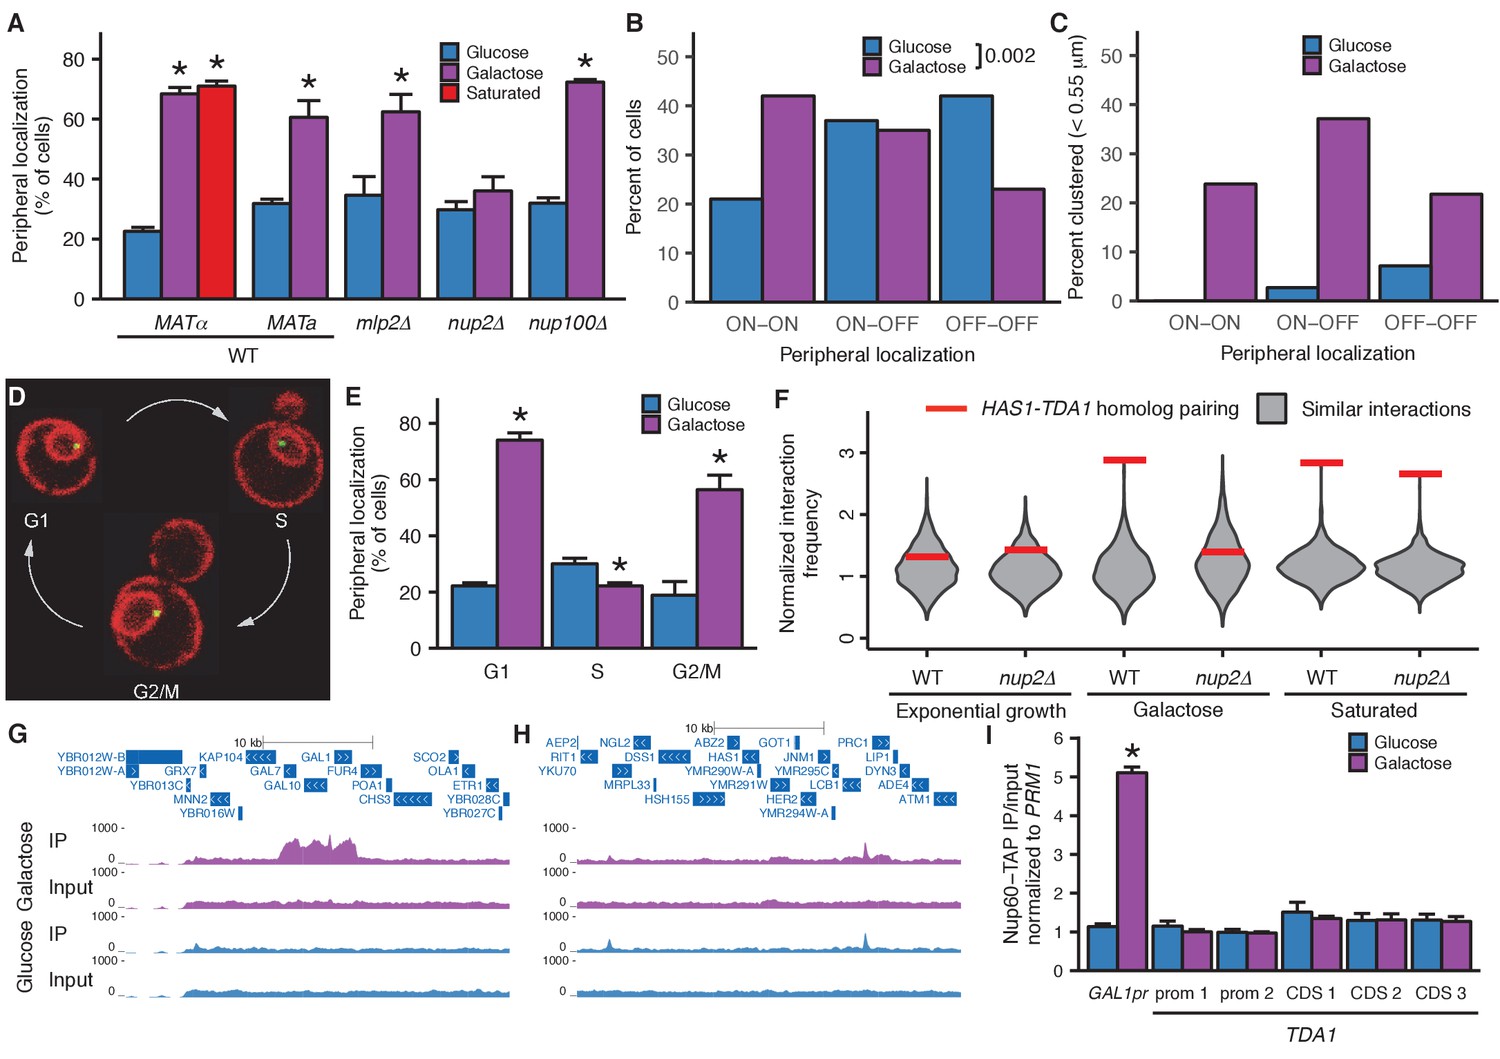
Inducible peripheral localization and pairing of HAS1-TDA1 alleles involve nuclear pore interactions.
(A) Proportions of haploid S. cerevisiae cells exhibiting peripheral HAS1-TDA1 localization in strains with and without deletions of nuclear pore components, in glucose (in blue), galactose (in purple), or saturated culture (in red). Experiments were performed in biological triplicate, with n ≥ 30 per experiment. *p<0.05, Student’s t-test. Center values and error bars represent mean ± s.e.m. (B) Proportion of diploid S. cerevisiae cells exhibiting two (ON-ON), one (ON-OFF), or zero HAS1-TDA1 alleles with peripheral localization, in glucose (blue) and galactose (purple). p-Value calculated using chi-squared test. (C) Proportion of diploid S. cerevisiae cells with HAS1-TDA1 alleles clustered (<0.55 µm apart), in glucose (blue) and galactose (purple) as a function of the peripheral localization of HAS1-TDA1 alleles. Same images used as in (B) and Figure 4G,H. (D) Example images of cells in G1, S, and G2/M phases of cell cycle. (E) Proportions of haploid S. cerevisiae cells exhibiting peripheral HAS1-TDA1 localization in different phases of the cell cycle, in glucose (in blue) and galactose (in purple). *p<0.05, Student’s t-test. Center values and error bars represent mean ± s.e.m. (F) Strength of HAS1-TDA1 homolog pairing at 32 kb resolution (red lines) compared to similar interactions (grey violin plots; that is, interactions between an S. cerevisiae locus and an S. uvarum locus, where both loci are ≥15 bins from a centromere and ≥1 bin from a telomere, and not both on chromosome XII) in wild-type and homozygous nup2△ strains of S. cerevisiae x S. uvarum. (G and H) Nup60-TAP ChIP-seq read coverage tracks for IP and input in galactose (purple) and glucose (blue), zoomed into a 35 kb region surrounding GAL1-GAL10-GAL7 on chromosome II (G), and a 35 kb region surrounding HAS1 and TDA1 on chromosome XIII (H). (I) Nup60-TAP ChIP qPCR as IP/input normalized to the negative control PRM1, for the positive control GAL1pr and five sets of primers in TDA1. Primer sequences are provided in Supplementary file 2. Center values and error bars represent mean ± s.e.m. of three biological replicates. *p<0.05, Student’s t-test.
-
Figure 5—source data 1
Raw cell counts for Figure 5A.
- https://doi.org/10.7554/eLife.23623.019
-
Figure 5—source data 2
Raw cell counts for Figure 5B and C.
- https://doi.org/10.7554/eLife.23623.020
-
Figure 5—source data 3
Raw cell counts for Figure 5E.
- https://doi.org/10.7554/eLife.23623.021
Figure 5—figure supplement 1
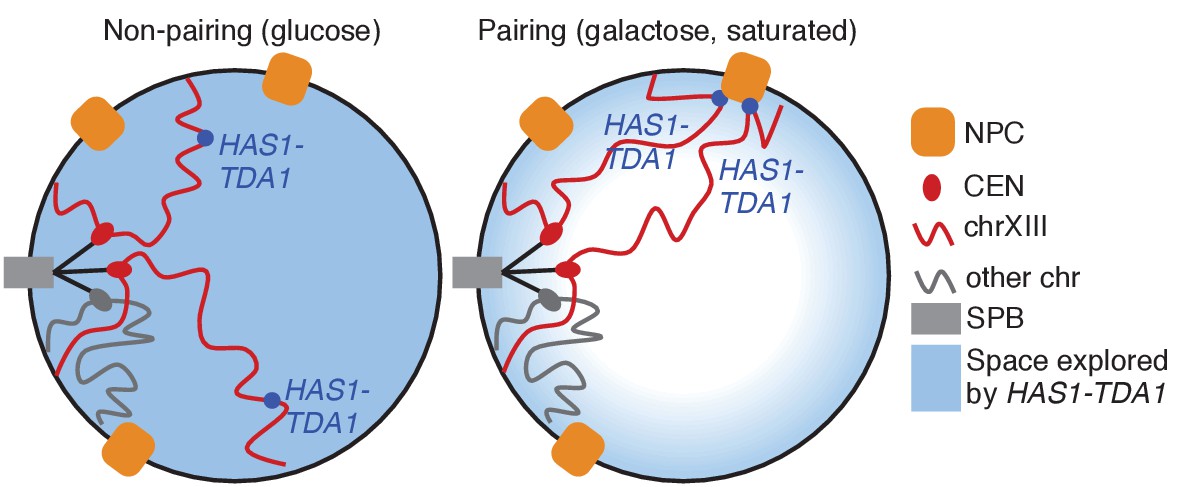
Schematic of how nuclear pore association mediates homologous HAS1 pairing.
NPC, nuclear pore complex; CEN, centromere; chr, chromosome; SPB, spindle pole body.
Figure 5—figure supplement 2
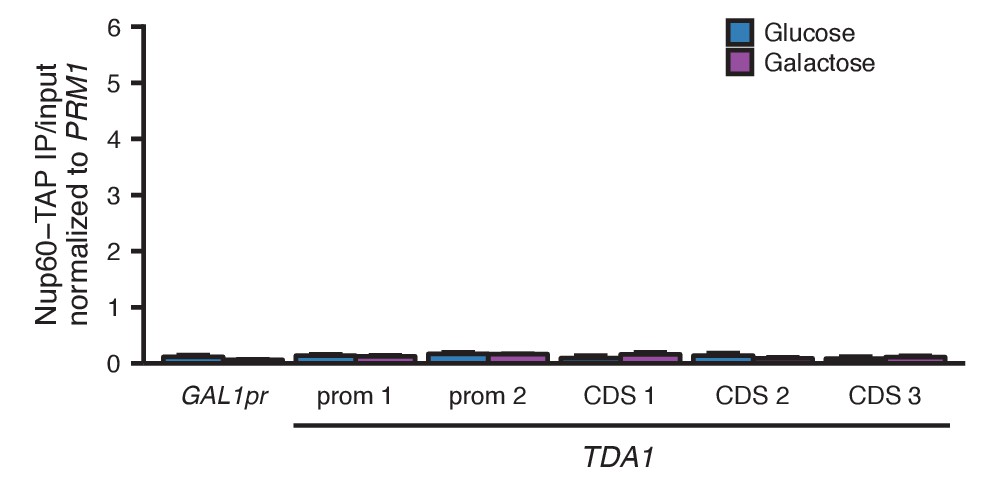
Mock-IP on Nup60-TAP.
Nup60-TAP ChIP qPCR using BSA instead of anti-TAP antibody, plotted as IP/input normalized to the negative control PRM1, for the positive control GAL1pr and five sets of primers in TDA1. Primer sequences are provided in Supplementary file 2. Center values and error bars represent mean ± s.e.m. of three biological replicates. No values are significant (p<0.05, Student’s t-test).
Figure 6
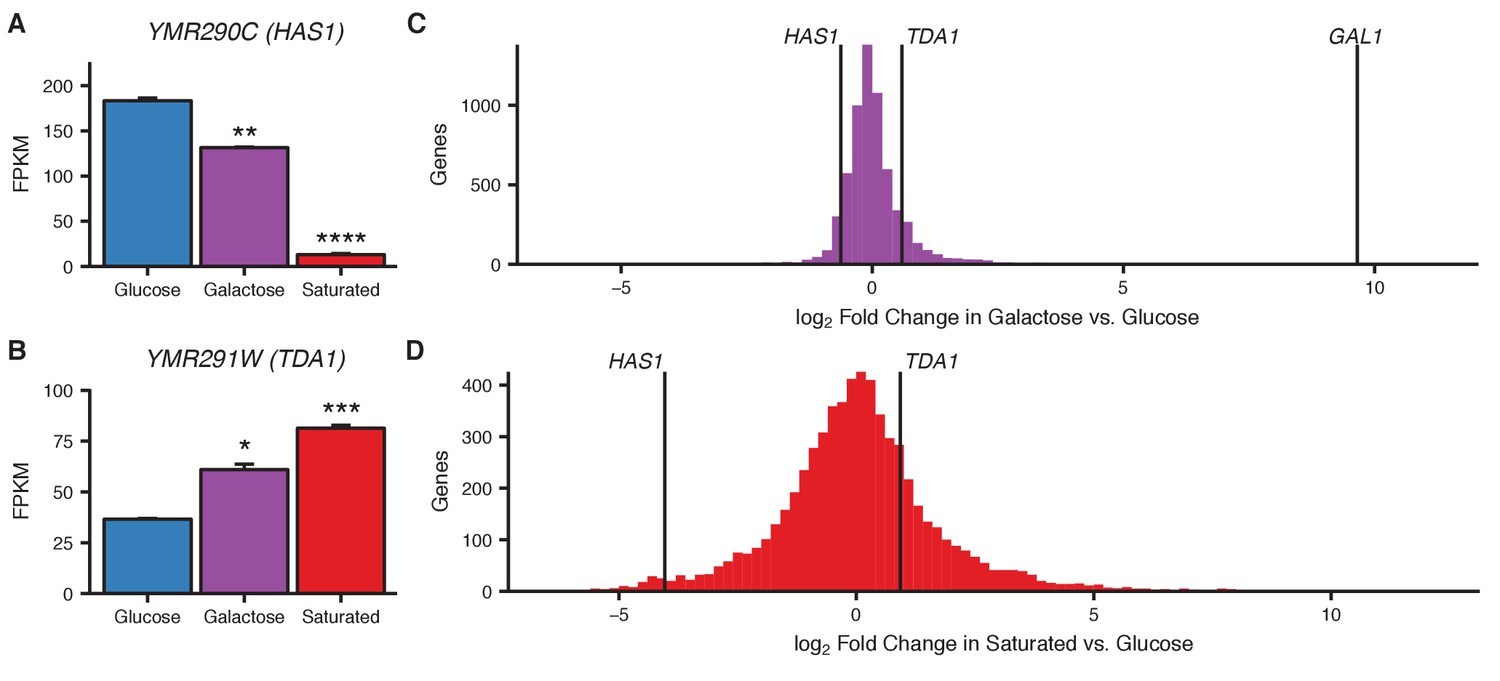
Transcriptional changes in galactose and saturated culture.
(A and B) Bar plots of gene expression in haploid S. cerevisiae grown in glucose, galactose, or to saturation, for HAS1 (A) and TDA1 (B). Asterisks indicate p-values<0.05 (*), 0.01 (**), 0.001 (***), or 0.0001 (****), Student’s t-test. Center values and error bars represent mean ± s.e.m. of three biological replicates (C and D) Histogram of log2 fold change in gene expression in galactose (C) or saturated growth (D) compared to glucose. Vertical lines indicate values for HAS1, TDA1, and GAL1 (C only).
Additional files
-
Supplementary file 1
Strains used in this study.
- https://doi.org/10.7554/eLife.23623.025
-
Supplementary file 2
Primers used in this study.
- https://doi.org/10.7554/eLife.23623.026
-
Supplementary file 3
Hi-C libraries.
- https://doi.org/10.7554/eLife.23623.027
Download links
A two-part list of links to download the article, or parts of the article, in various formats.
Downloads (link to download the article as PDF)
Open citations (links to open the citations from this article in various online reference manager services)
Cite this article (links to download the citations from this article in formats compatible with various reference manager tools)
The dynamic three-dimensional organization of the diploid yeast genome
eLife 6:e23623.
https://doi.org/10.7554/eLife.23623


