Transcription factor TFCP2L1 patterns cells in the mouse kidney collecting ducts
- Columbia University, United States
- Max Delbruck Center for Molecular Medicine, Germany
- Charité - Universitaetsmedizin Berlin, Germany
- Tongji University, China
- Institute for European Expertise in Physiology, France
- University of Washington, United States
- Fudan University, China
- University of Illinois at Chicago, United States
Figures
Figure 1 with 1 supplement
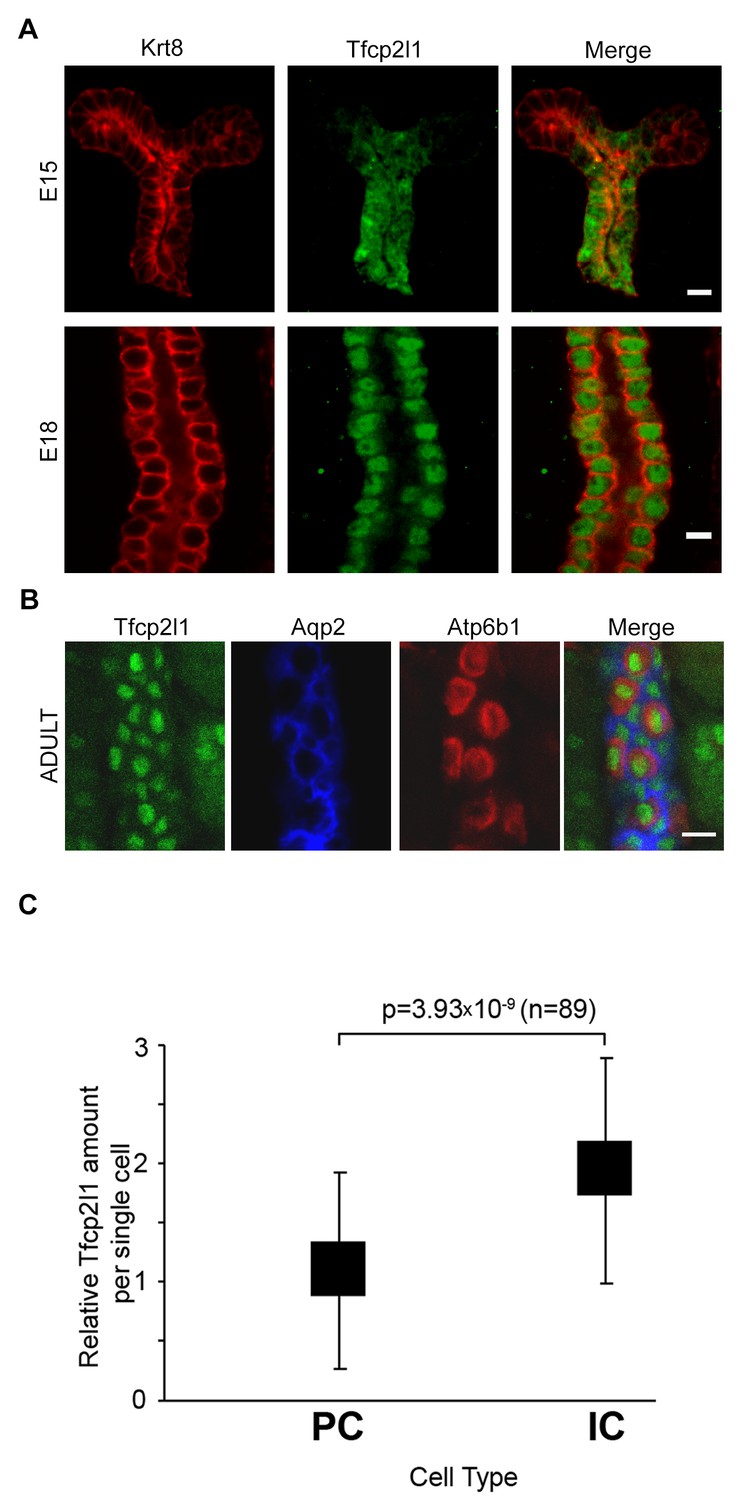
Tfcp2l1 is a nuclear protein expressed in the collecting ducts.
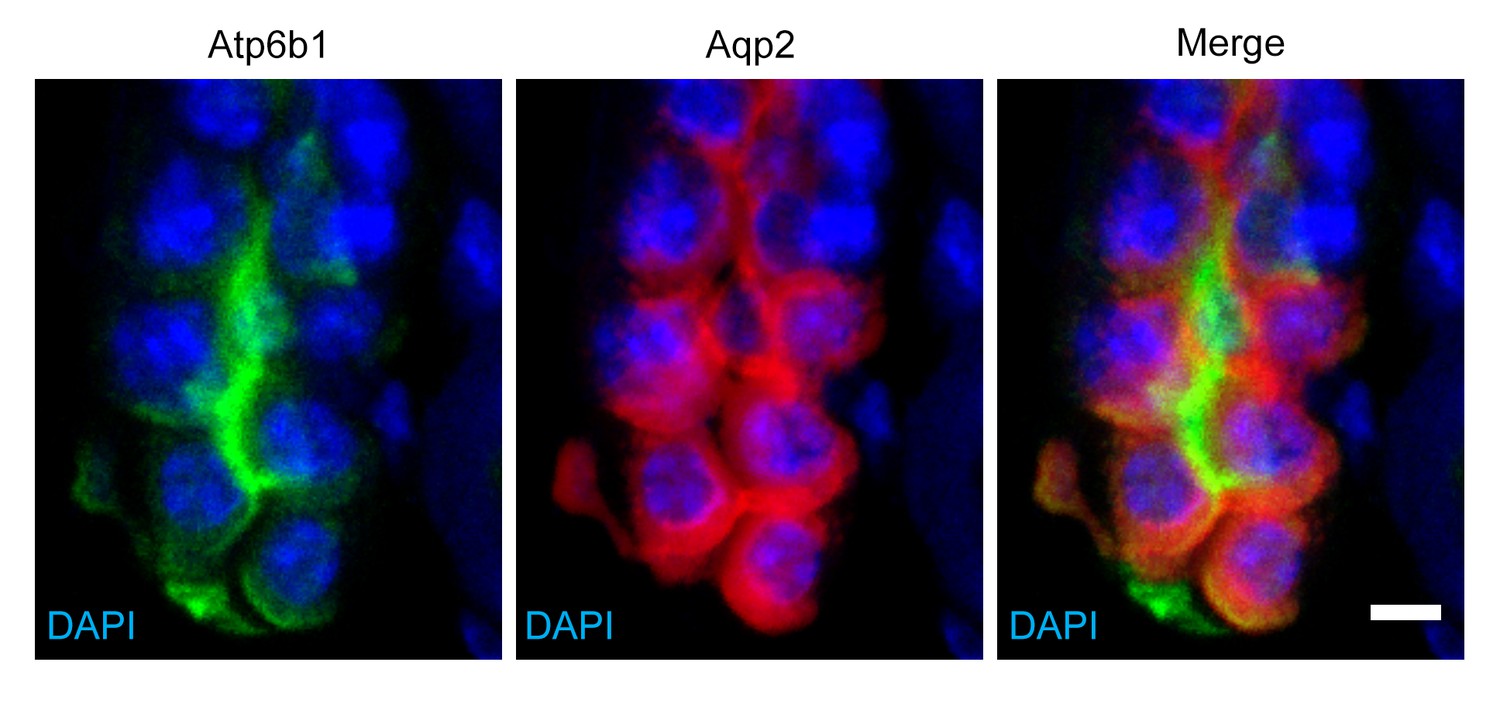
(A) Immunofluorescence detection of Tfcp2l1 (green) in stalks of ureteric-collecting ducts at E15 and at E18. Nuclear localization was prominent at E18. The ducts were identified by the uniform expression of Krt8 (red). Bars = 5 µm. (B) In adult collecting ducts,Tfcp2l1 (green) was expressed by both Intercalated Cells (IC), identified by immunodetection of Atp6v1b1, abbreviated Atp6b1 (red), and Principal Cells (PC) identified by immunodetection of Aqp2 (blue). Z-stack projection. Bar = 10 µm. (C) Quantification of Tfcp2l1 immunoflourescence in adult collecting ducts normalized per measurement area. Atp6b1+ IC cells expressed higher levels of Tfcp2l1 than did Aqp2+ PC cells.
Figure 1—figure supplement 1
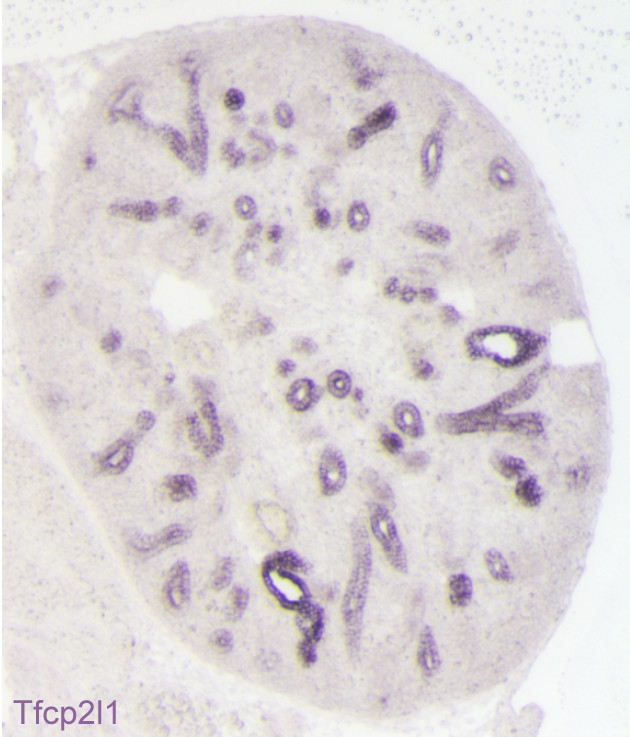
Expression of Tfcp2l1 message in the stalks of the ureteric bud (E15 mouse kidney; in-situ hybridization).
All of the Tfcp2l1+ tubules are cross-sections of the collecting ducts.
Figure 2 with 2 supplements
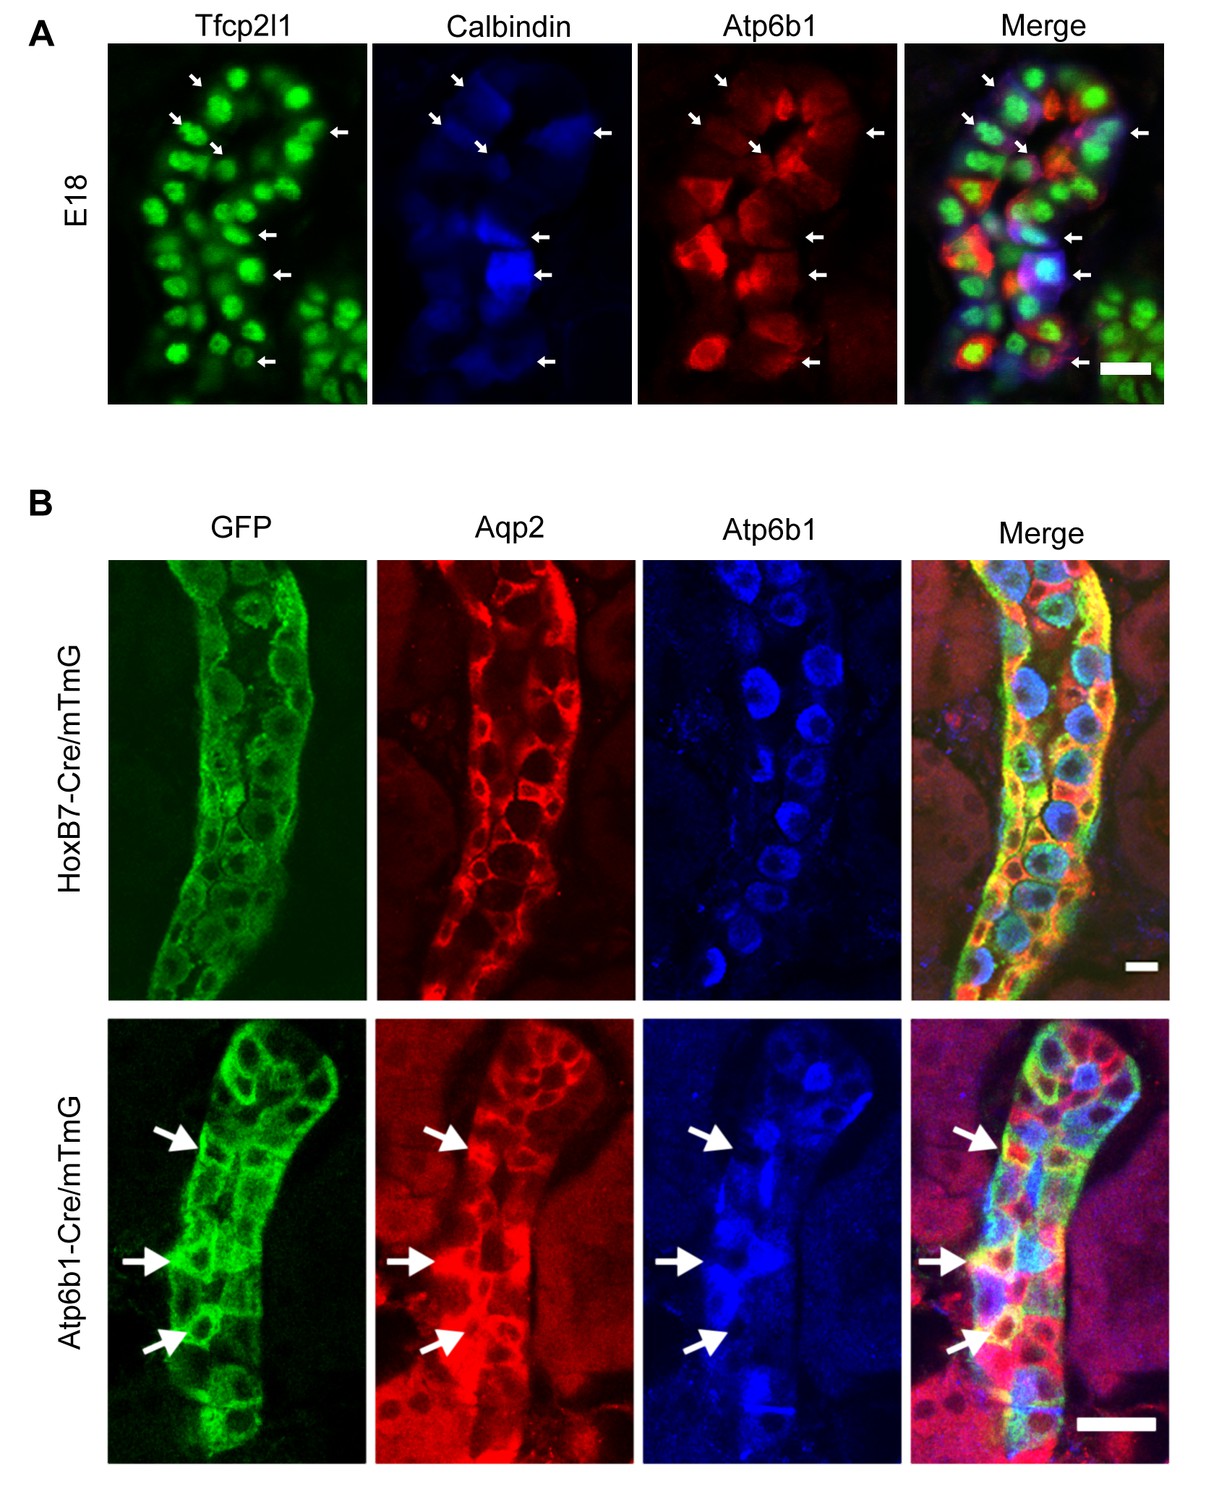
‘Double positive’ progenitors populate the E18 collecting duct.
(A) IC proteins were expressed at E18 in presumptive PC cells. Co-expression of Atp6b1 (typical of ICs, red) and Calbindin (typical of PCs, blue) is shown in Tfcp2l1+ cells in the cortical region of the collecting duct. (white arrows) Bar = 10 µm. (B) Lineage of ICs and PCs was detected with genetic reporters. HoxB7-Cre;mTmG (green) marked every cell in the collecting duct including AQP2+ PC cells (red-yellow) and Atp6b1+ IC cells (blue-green). Atp6b1-Cre;mTmG labeled every IC cell (endogenous Atp6b1+; blue-green), as well as some Aqp2+ PCs (white arrows, yellow). Atp6b1-Cre;mTmG-negative PC cells are also found (Aqp2+, Atp6b1-, Atp6b1-Cre;mTmG-, red) (Bars= top 5 µm, bottom 20 µm).
Figure 2—figure supplement 1
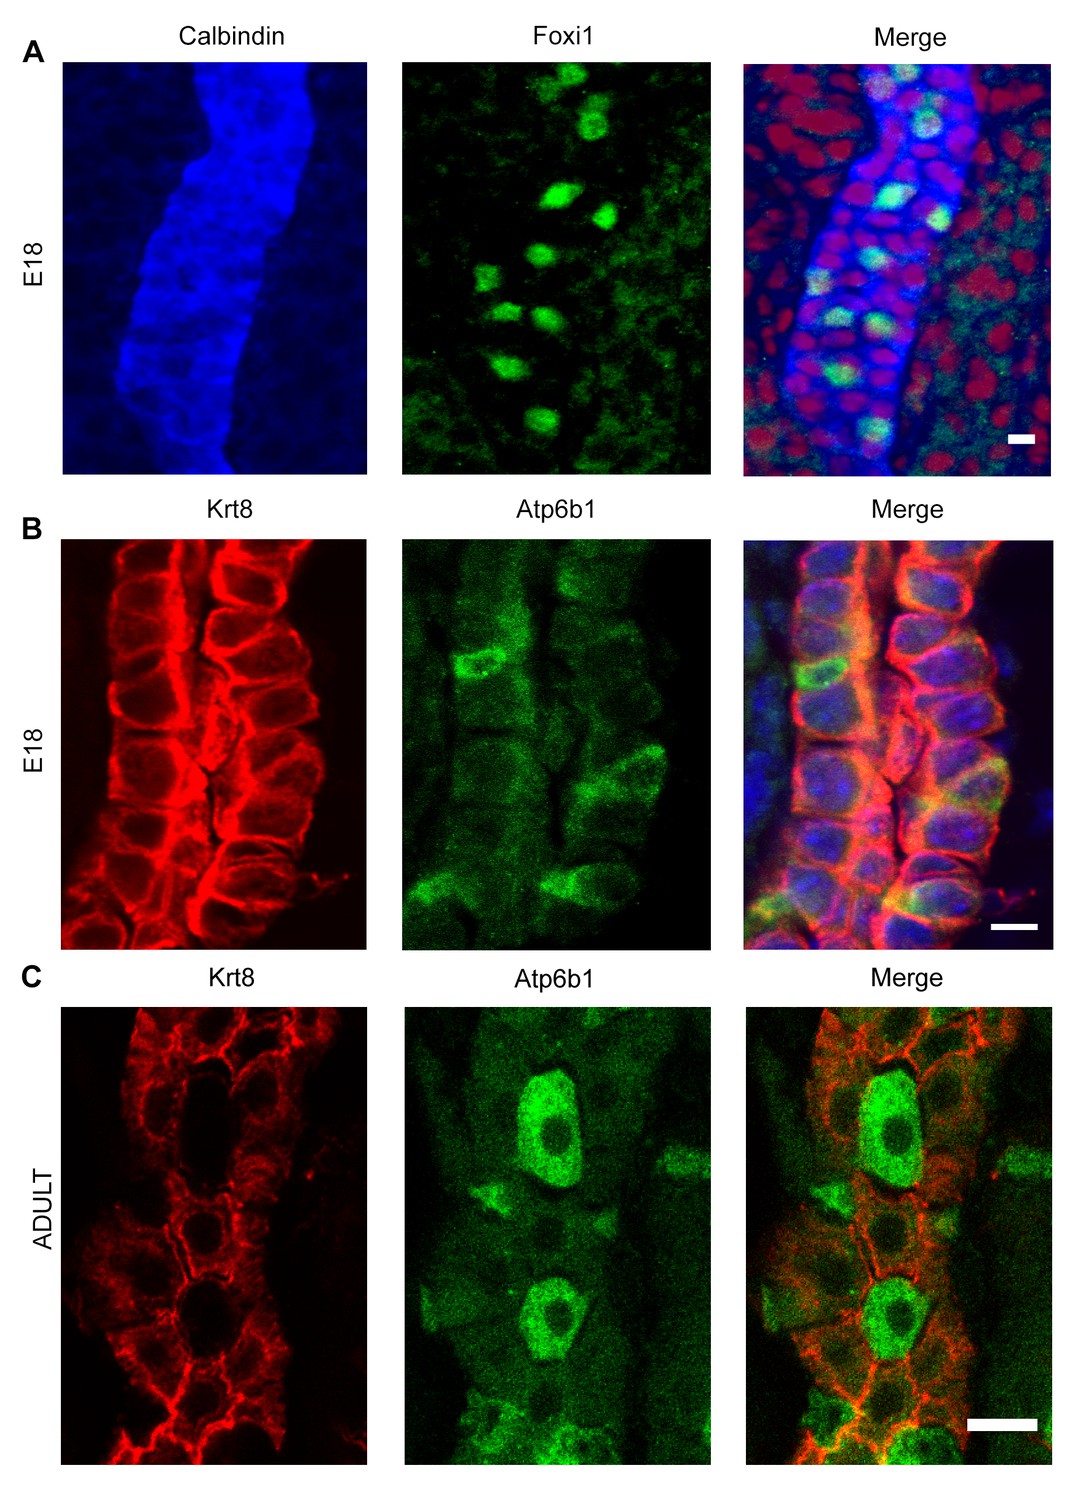
Detection of ‘double positive’ precursors in the embryonic collecting ducts.
(A,B) Detection of ‘double positive’ precursors in the embryonic collecting ducts. Immunofluorescence analysis of developing collecting ducts using markers of PCs (Calb1 blue, Krt8 red) and ICs (Foxi1 green, Atp6b1 green) cells. By E18, IC proteins are expressed in PC cells (i.e.Foxi1+ with Calb1+ or Atp6b1+ with Krt8+; n = 4 independent mice for each immunofluorescence analysis; Bars = 5 µm). (C) In contrast, PC (Krt8, red) and IC (Atp6b1, green) proteins were expressed in separate cells after birth (n = 4 independent mice for each immunofluorescence analysis; Bar = 10 µm).
Figure 2—figure supplement 2
Detection of rare ‘double positive’ cells in adult collecting duct using marker proteins Atpb1 (IC cells) and Aqp2 (PC cells).
Bar = 5 µm.
Figure 3 with 2 supplements
Tfcp2l1 is necessary for the development of ICs.
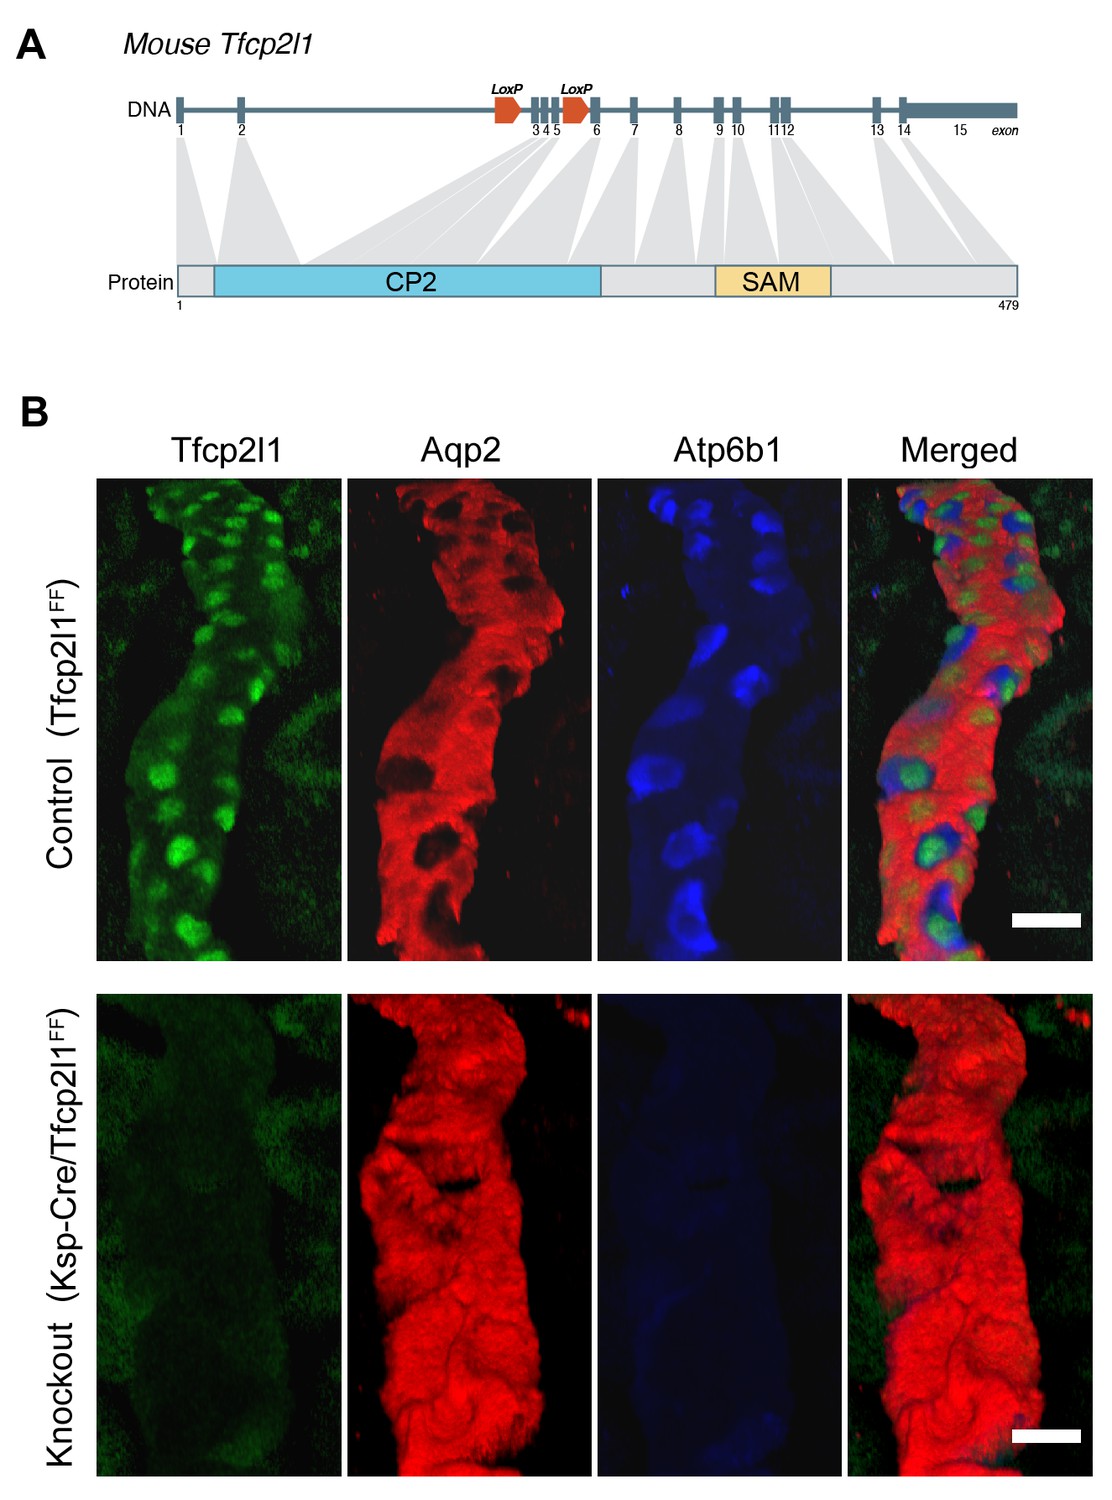
(A) Structure of mouse Tfcp2l1 gene showing LoxP sites flanking the DNA-Binding CP2 domain (exon 3 and 4). (B) Control (Tfcp2l1f/f) and Tfcp2l1 knockout kidneys (Cdh16-Cre;Tfcp2l1f/f) were analyzed for PC (Aqp2 red) and IC (Atp6b1 blue) proteins. Note that the deletion of Tfcp2l1 replaced the normal patterning of IC and PC cells with a monotonous array of PC like cells (Aqp2+). Z-stack reconstruction. Bars = 10 µm.
Figure 3—figure supplement 1
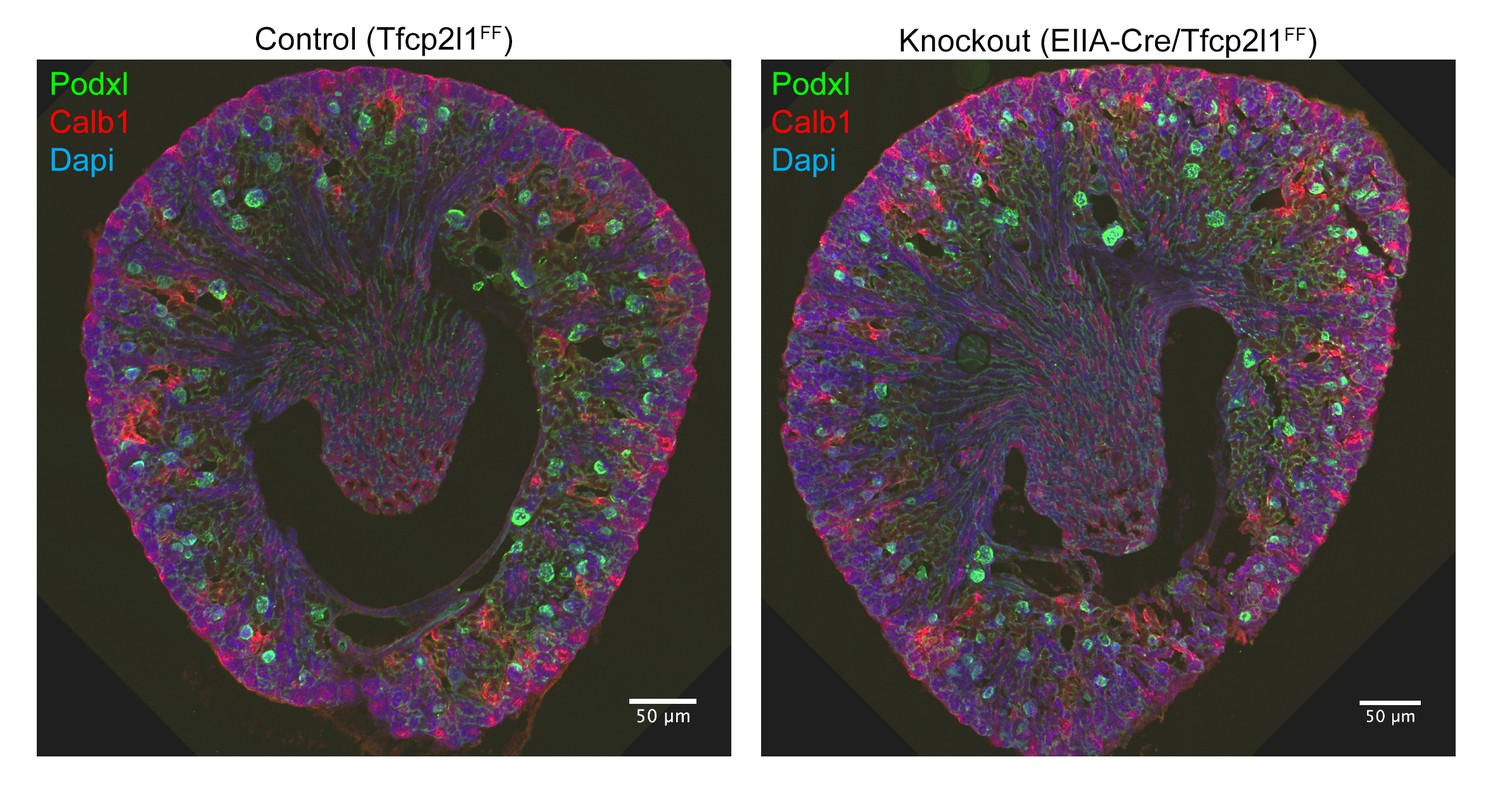
Gross kidney morphology was preserved after the global deletion of Tfcp2l1 (EIIA-Cre;Tfcp2l1f/f).
Bars = 50 µM.
Figure 3—figure supplement 2

Tfcp2l1 is necessary for the development of ICs.
(A,B) The deletion of Tfcp2l1 (Cdh16-Cre;Tfcp2l1f/f) abolished the alternating pattern of IC and PC cells and deleted multiple IC specific proteins. Tfcp2l1 knockout deleted the cellular enzymes Ca2 (red), Atp6b1 (blue), and the transcription factor Foxi1 (green), which are typically expressed by ICs. Conversely, Tfcp2l1 knockout kidneys demonstrated prominent and uniform expression of PC markers Aqp2 (red) and Krt8 (green). (A) Bars = 10 µm; (B) Bars = 5 µm.
Figure 4
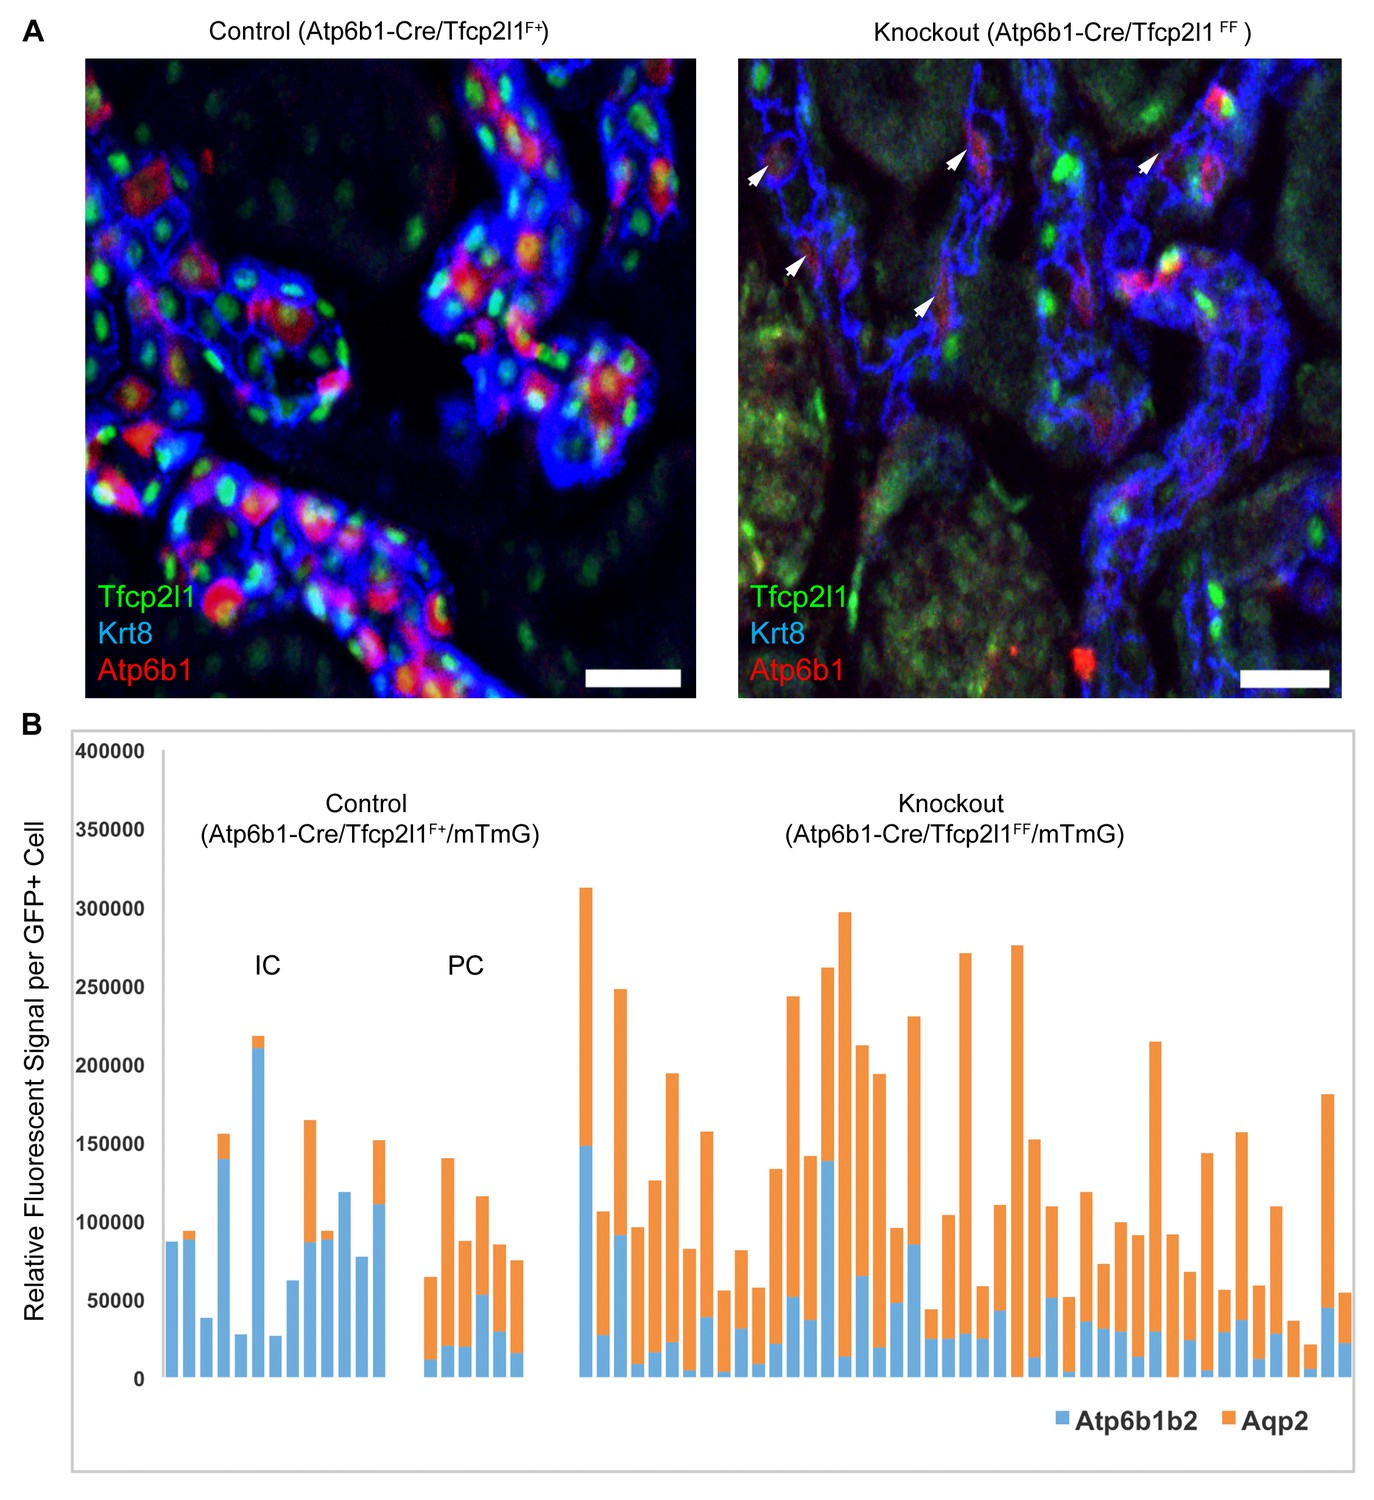
IC specific deletion of Tfcp2l1 (green) by Atp6b1Cre results in loss of IC cells.
(A) Deletion of Tfcp2l1 resulted in the widespread loss of IC and PC patterning. Only residual expression of Atp6b1 (red) in Krt8+ (blue) PCs was detected in cortical collecting ducts (white arrows; n = 3 independent mice; Bars = 25 µm). (B) Cell fate analysis of Tfcp2l1 knockout IC cells using genetic reporter (Atp6b1-Cre;mTmG). We analyzed single GFP+ cells in Control (Atp6b1-Cre;Tfcp2l1f/+;mTmG) and in Knockout (Atp6b1-Cre;Tfcp2l1f/f;mTmG) collecting ducts by spot imaging. In control kidneys, GFP+ cells were ICs or PCs (e.g. GFP+ ICs: Atp6b1>Aqp2 and GFP+ PCs: Aqp2>Atp6b1), or expressed both markers in variable ratios (Atp6b1≈Aqp2). In contrast, in knockout kidneys, the majority of GFP+ cells appeared to be PC-like or double positives cell types (compare knockout with wild type profiles). (n = 20 GFP+ Control and n = 45 Tfcp2l1 deleted GFP+ cells from representative images; n = 4 independent kidneys).
Figure 5 with 2 supplements
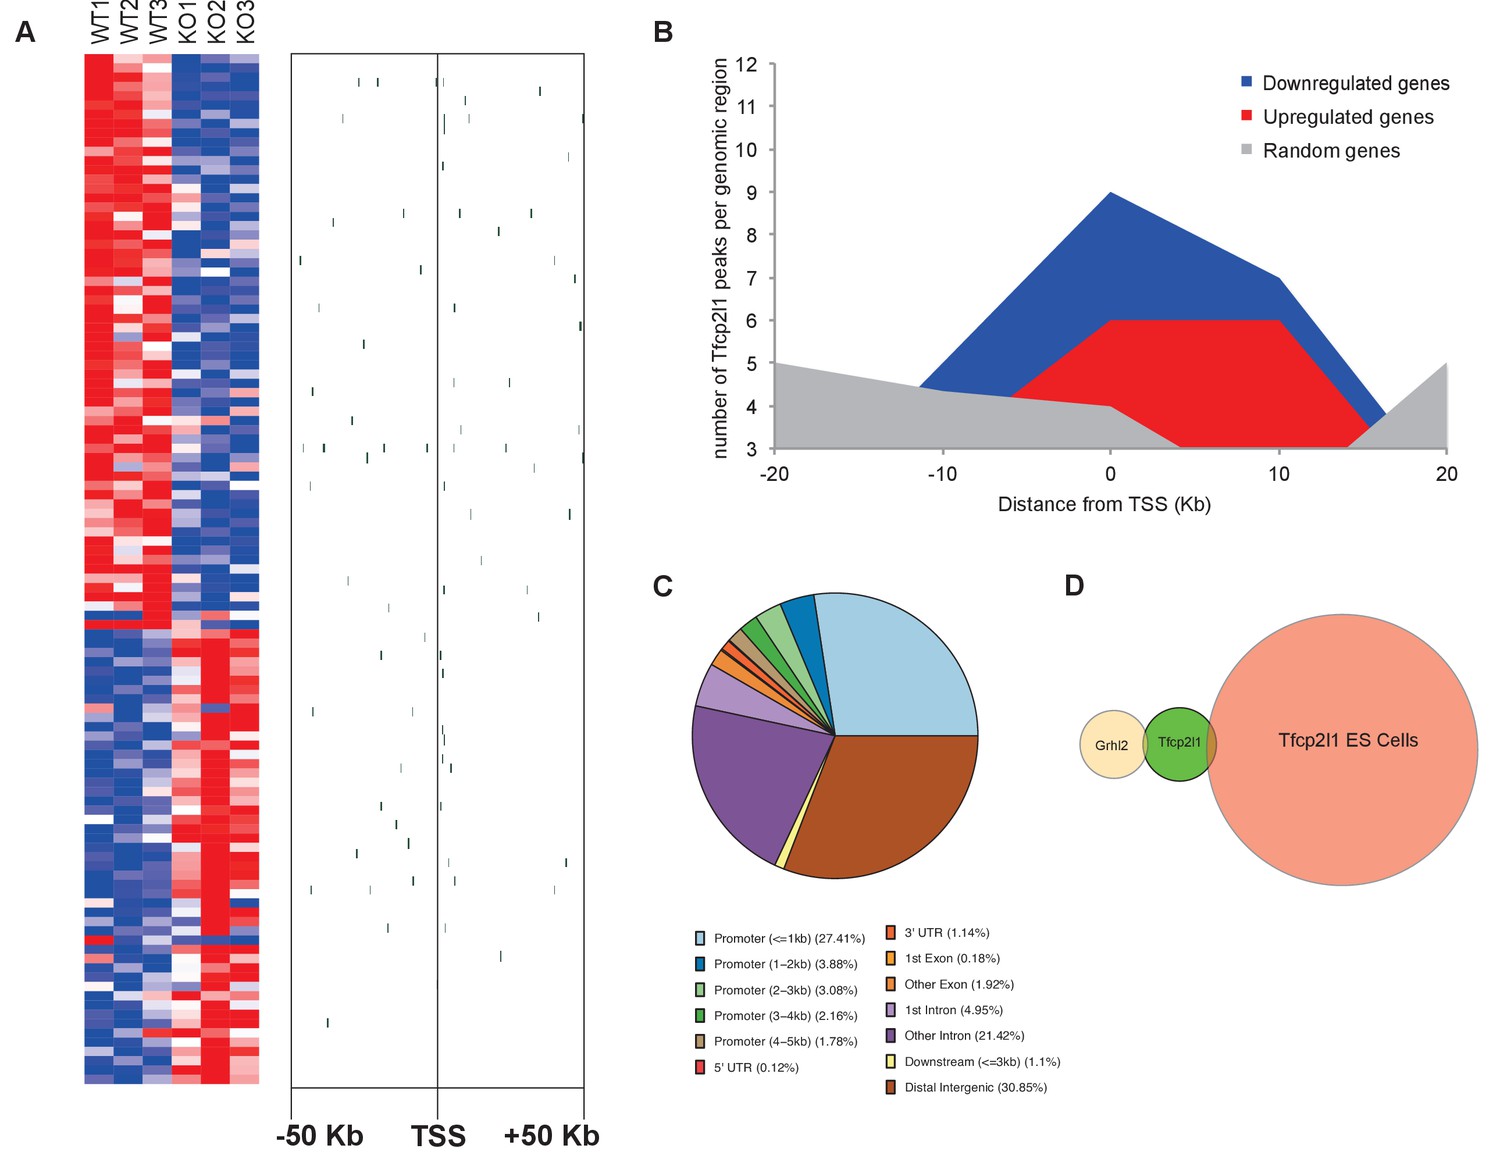
Identification of Tfcp2l1 targets.
(A) Identification of Tfcp2l1 targets. Integration of knockout and Tfcp2l1 ChIP-seq gene expression data obtained from P1 kidneys. Most of the genes significantly up or down regulated by Tfcp2l1 (WT-Tfcp2l1f/f vs KO-EIIACre;Tfcp2l1f/f) demonstrated binding peak(s) mapping between +50 KB to −50 KB relative to the TSS for each gene. (B) Tfcp2l1 peaks of both up and down regulated genes were enriched at the TSS in comparison with a random set of Tfcp2l1 independent genes. (C) Genome wide annotation of Tfcp2l1 peaks revealed that ~27% of peaks were within 1 kb of the TSS and 38% located within 10 kb from TSS. (D) Cell type specificity of Tfcp2l1 ChIP peaks. Comparison of Tfcp2l1 ChIP peaks in different models. P1 kidney (our study, Green) is compared with Tfcp2l1 peaks identified in ES Cells (Chen et al., 2008, Red) and with Grhl2 peaks identified in E18 kidney (Werth et al., 2010), Tan color). Note the limited overlap between these datasets.
Figure 5—figure supplement 1
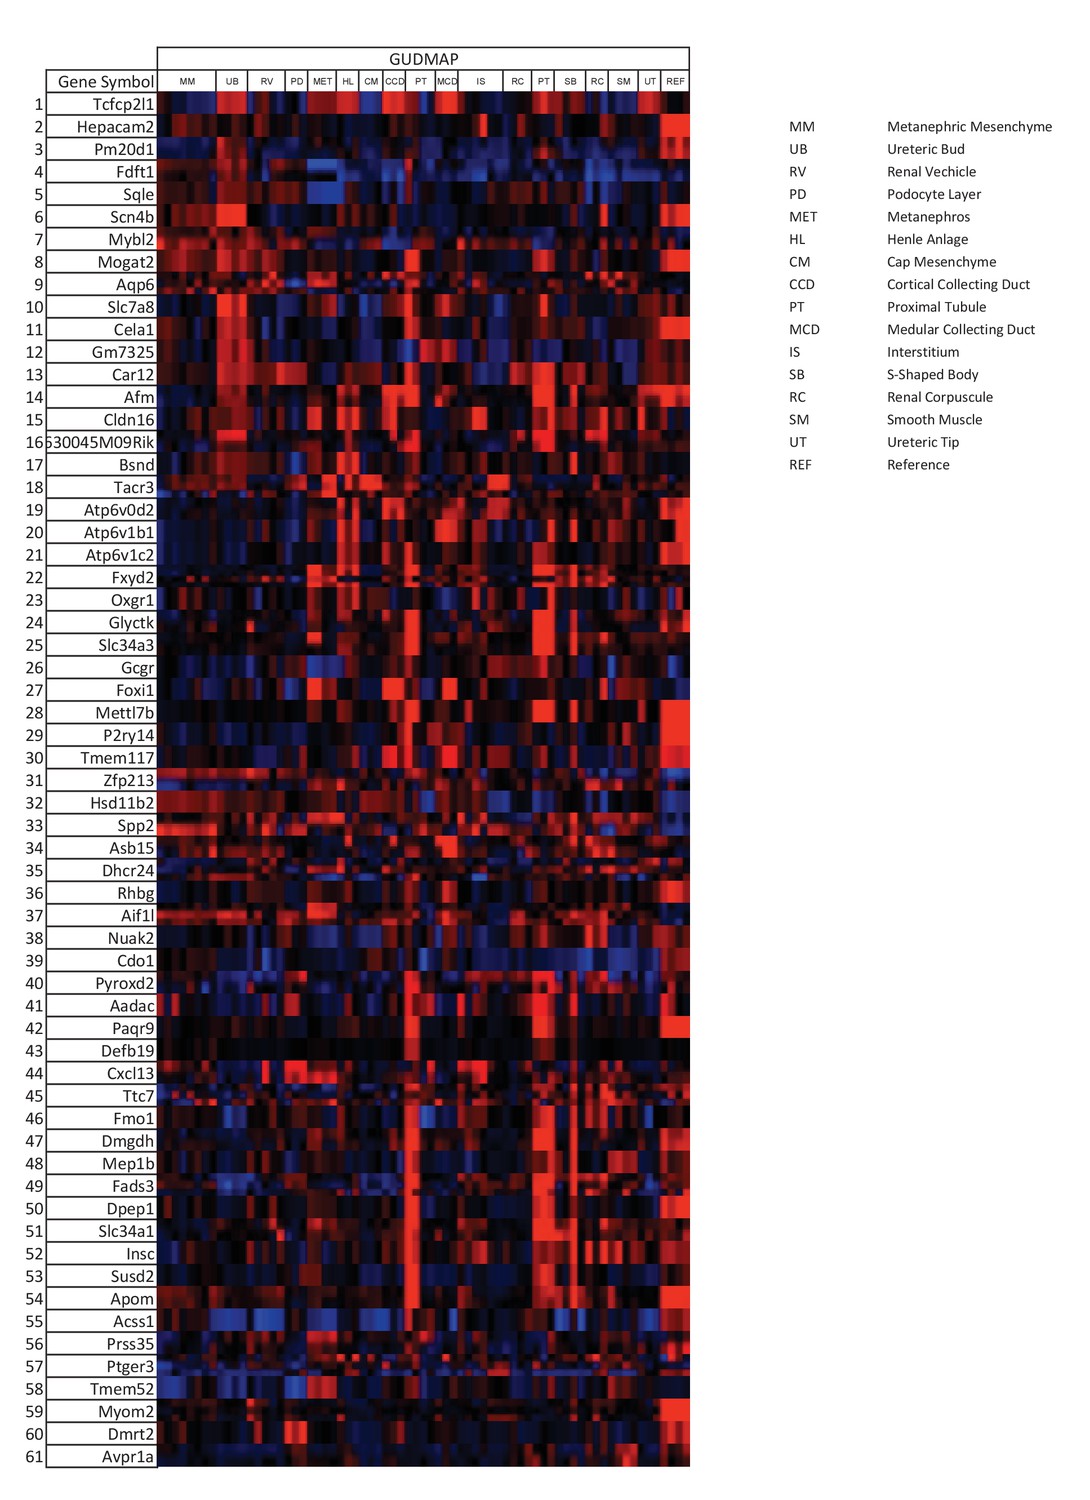
Tfcp2l1 dependent genes localized to the collecting duct.
Genes that were significantly downregulated by the knockout of Tfcp2l1 (EIIA-Cre;Tfcp2l1f/f;>1.25 fold downregulation; p<0.05; n = 3 independent knockout and wild type mice) were localized with the help of GUDMAP (http://www.gudmap.org/). Most of these genes appeared to be highly expressed by the Ureteric Bud (UB), the Loop of Henle (HL), the cortical and medullary collecting ducts (CCD and MCD, respectively), and to a lesser extent by the proximal tubule, parallel with the expression pattern of endogenous Tfcp2l1 (top row). Red color indicates expression; Blue color indicates no expression.
Figure 5—figure supplement 2

Differentially expressed genes from kidneys of Tfcp2l1 knockouts (EIIA-Cre;Tfcp2l1f/f;>1.25 fold up- or down-regulated; p<0.05; n = 3 independent knockout and wild type mice).
https://doi.org/10.7554/eLife.24265.013
Figure 6
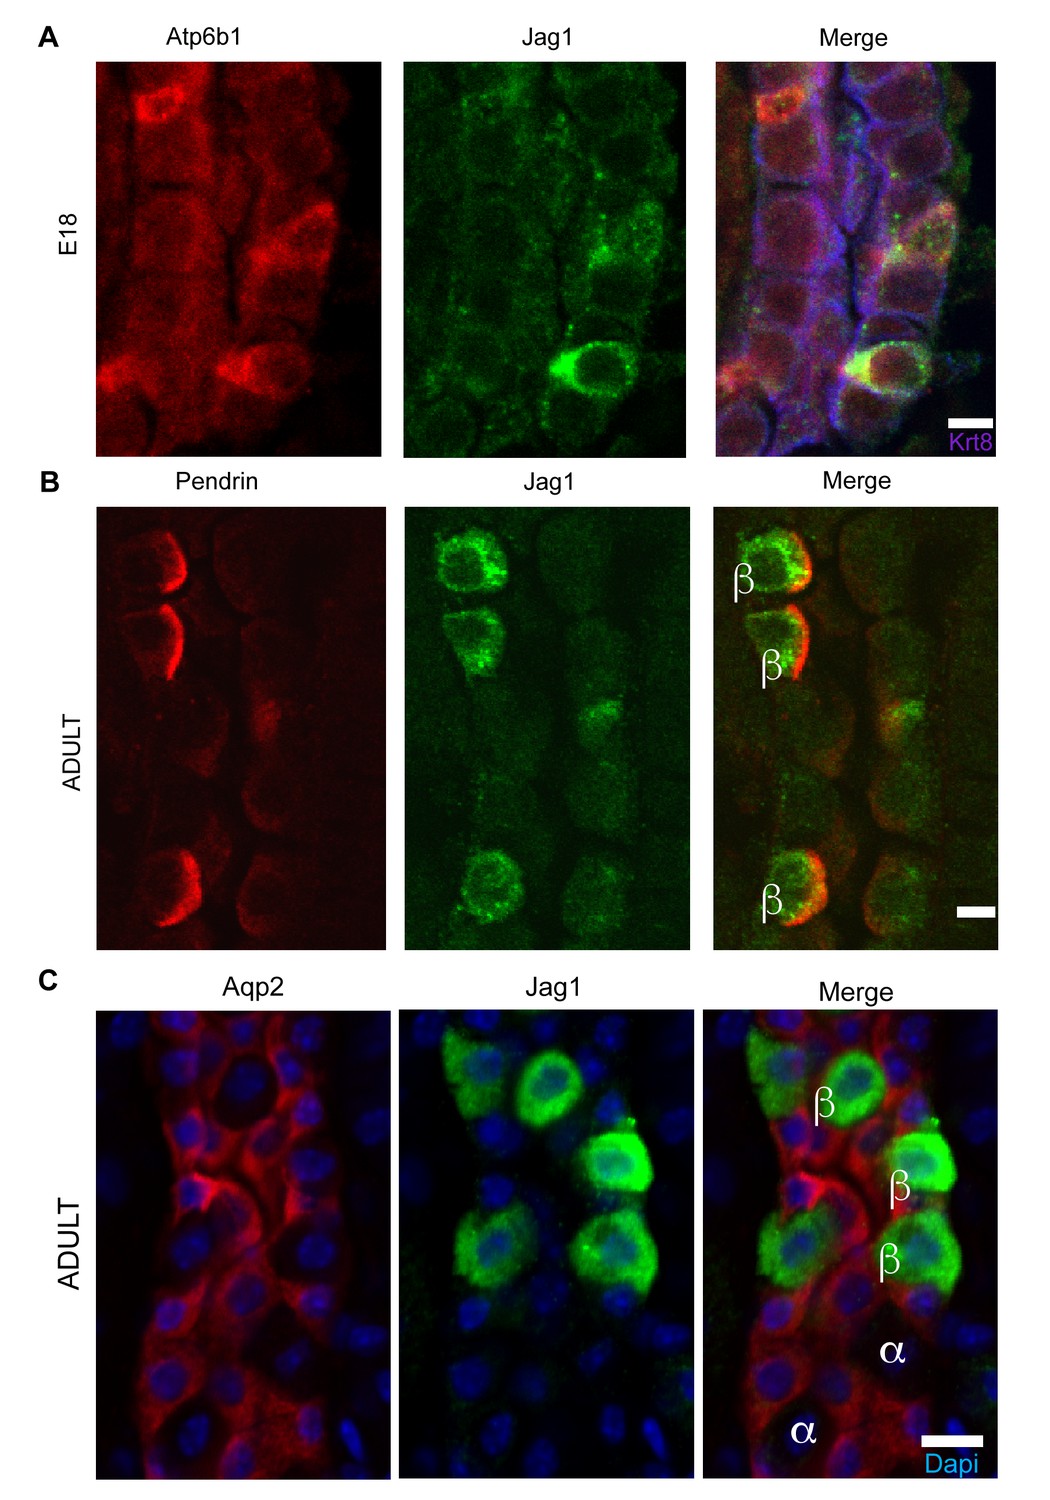
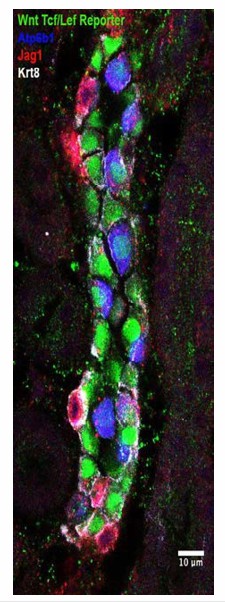
Jag1 is a novel early marker of developing (E18) and adult (P60) IC cells and activated Notch is found in PCs
(A) Jag1 (green) co-expressed with Atp6b1 (red) at the first appearance of ‘double positive’ cells. Krt8 (purple) is expressed by all cells at this stage. (B) In the adult kidney, Jag1 (green) is specifically expressed in a subset of IC cells called Pendrin+ β-ICs (red) (P60), but C not in other collecting duct cell types including Aqp2+ PC and Aqp2- α-ICs. Nuclei, blue (A,B) Bars = 5 µm. (C) Bar = 10 µm.
Figure 7
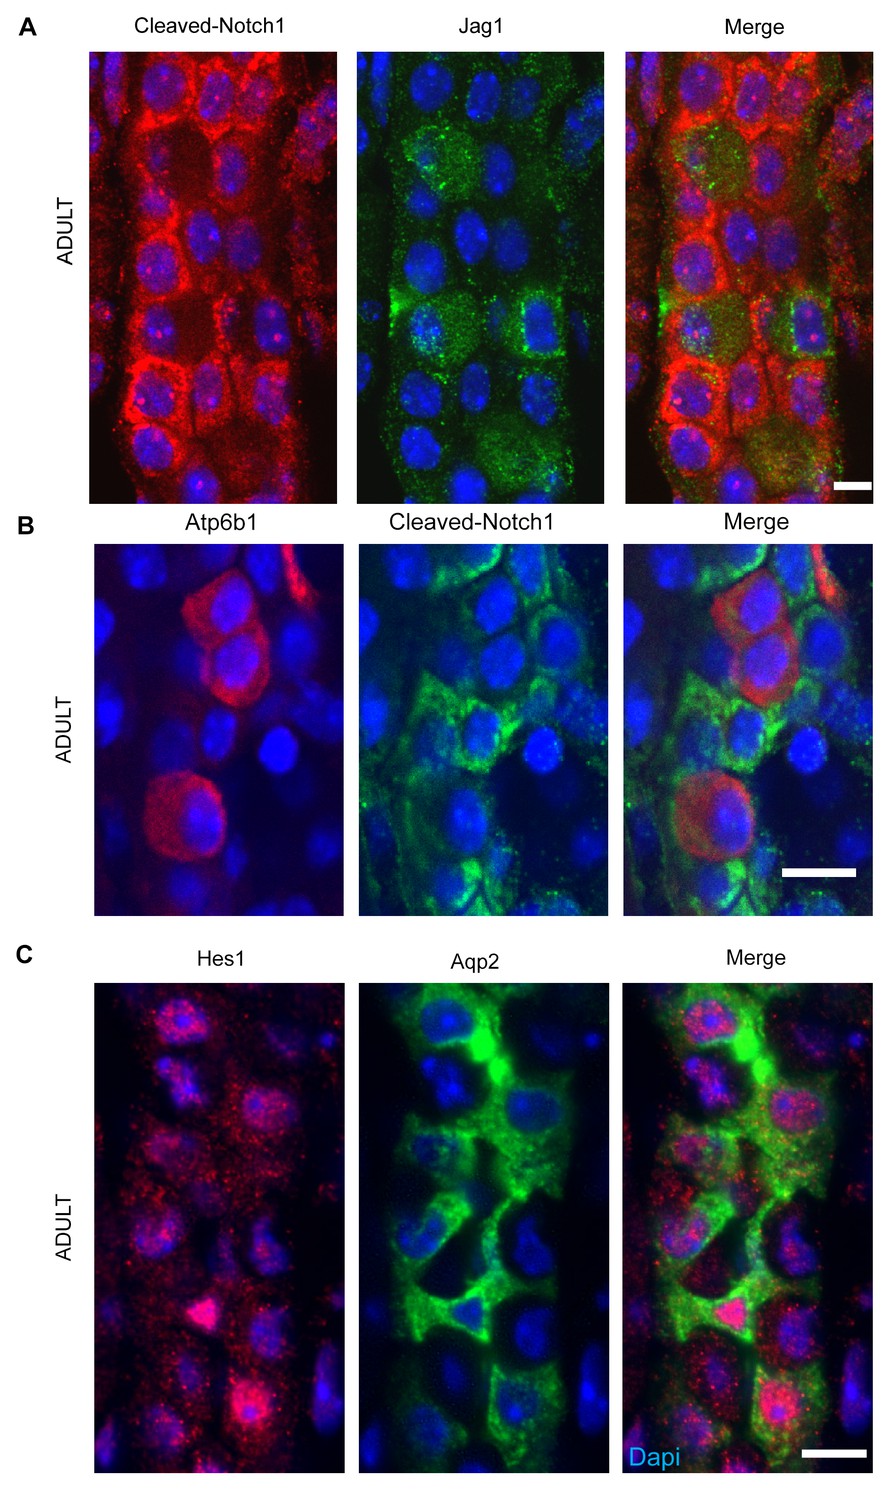
(A,B) Jag1-Notch1 signaling in the collecting duct. Activated Notch is found in PC cells adjacent to Jag1+Atp6b1+β-ICs. (C) Consistently, Notch target gene Hes1 (red) was detected in Aqp2+ PC (green). A, C Bar = 10 µm, B Bar = 5 µm.
Figure 8 with 1 supplement
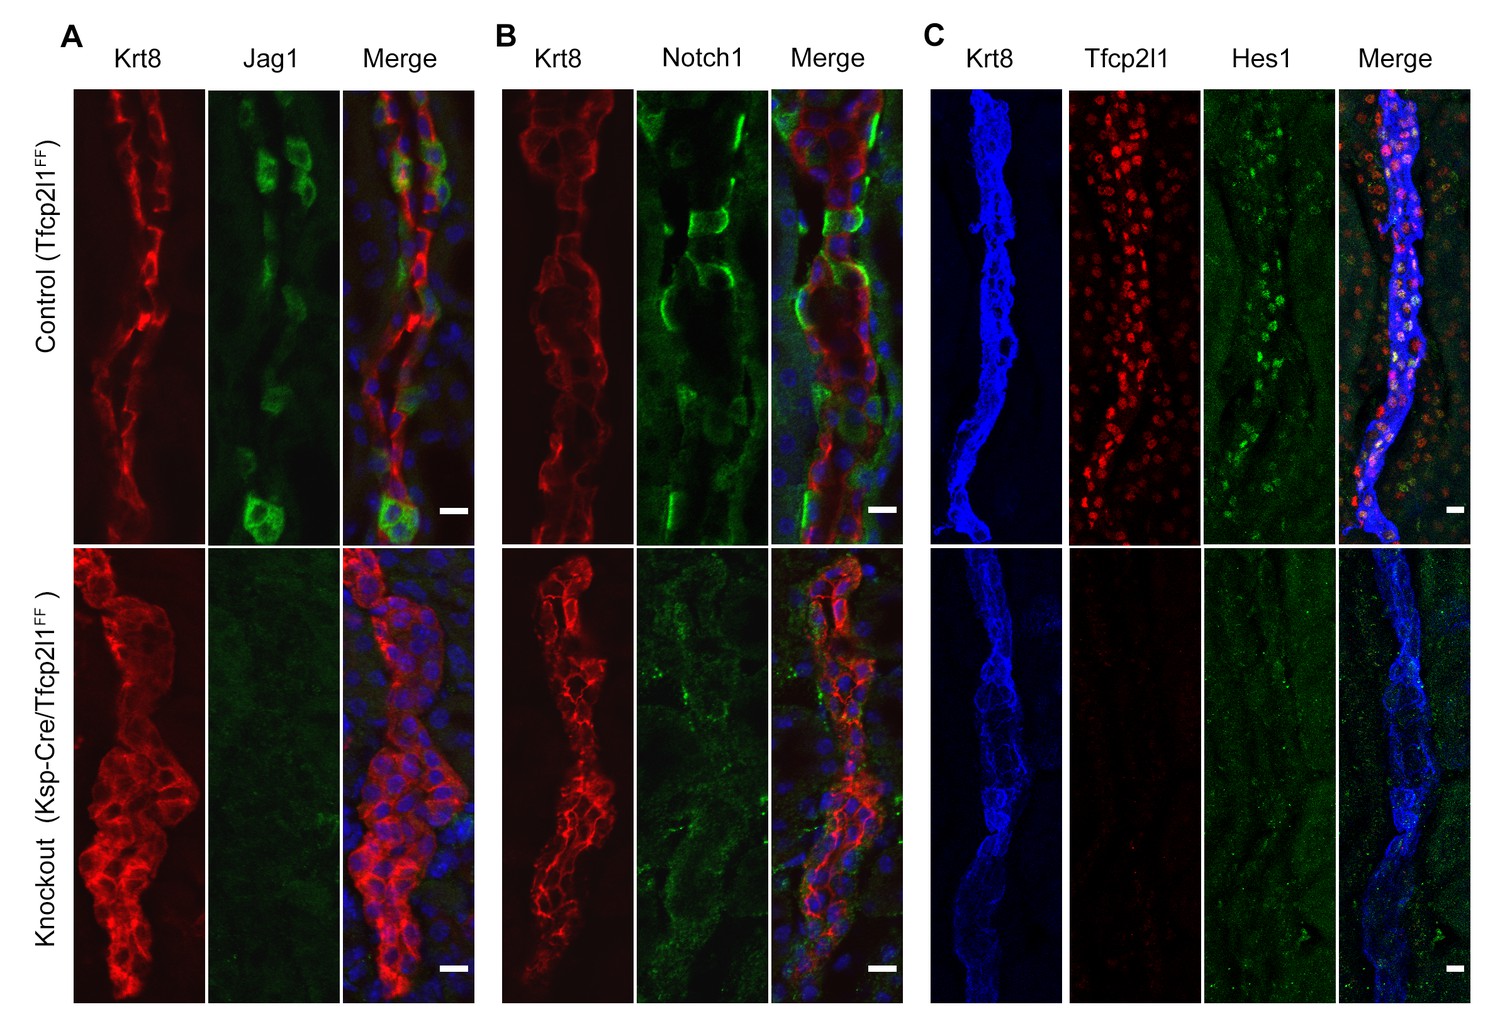
Tfcp2l1 is required for Notch signaling in collecting ducts.
Tfcp2l1 knockout (Cdh16-Cre;Tfcp2l1f/f) results in A depletion of Jag1 (green) from Krt8-β-ICs (red) B. depletion of cell surface (inactive) Notch1 (green) from Krt8- α-ICs (red) C depletion of nuclear Hes (green) from Krt8+ PCs. (n = 4 independent mice for each immunodetection; Bars = 10 µm).
Figure 8—figure supplement 1
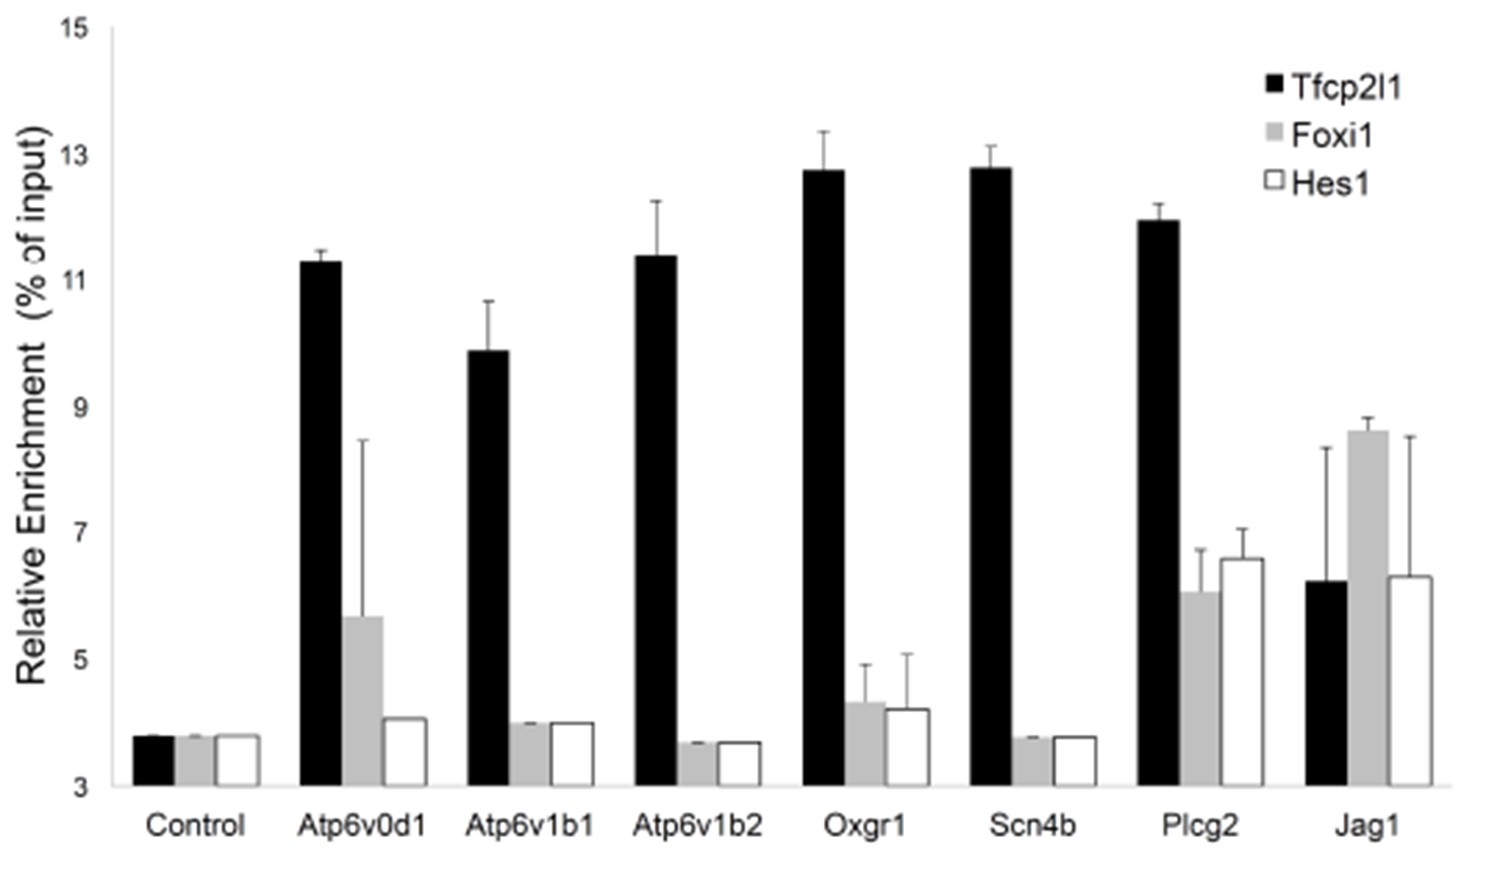
Sequential Chromatin IP.
Tfcp2l1 ChIP was followed by Foxi1 or Hes1 ChIP. Promoters of IC specific genes were analyzed in each ChIP by PCR. Three types of interactions were found in the selected promoters: Tfcp2l1 alone, Tfcp2l1+Foxi1 and Tfcp2l1+Foxi1+Hes1 (n = 3 independent mice and ChIP).
Figure 9 with 4 supplements

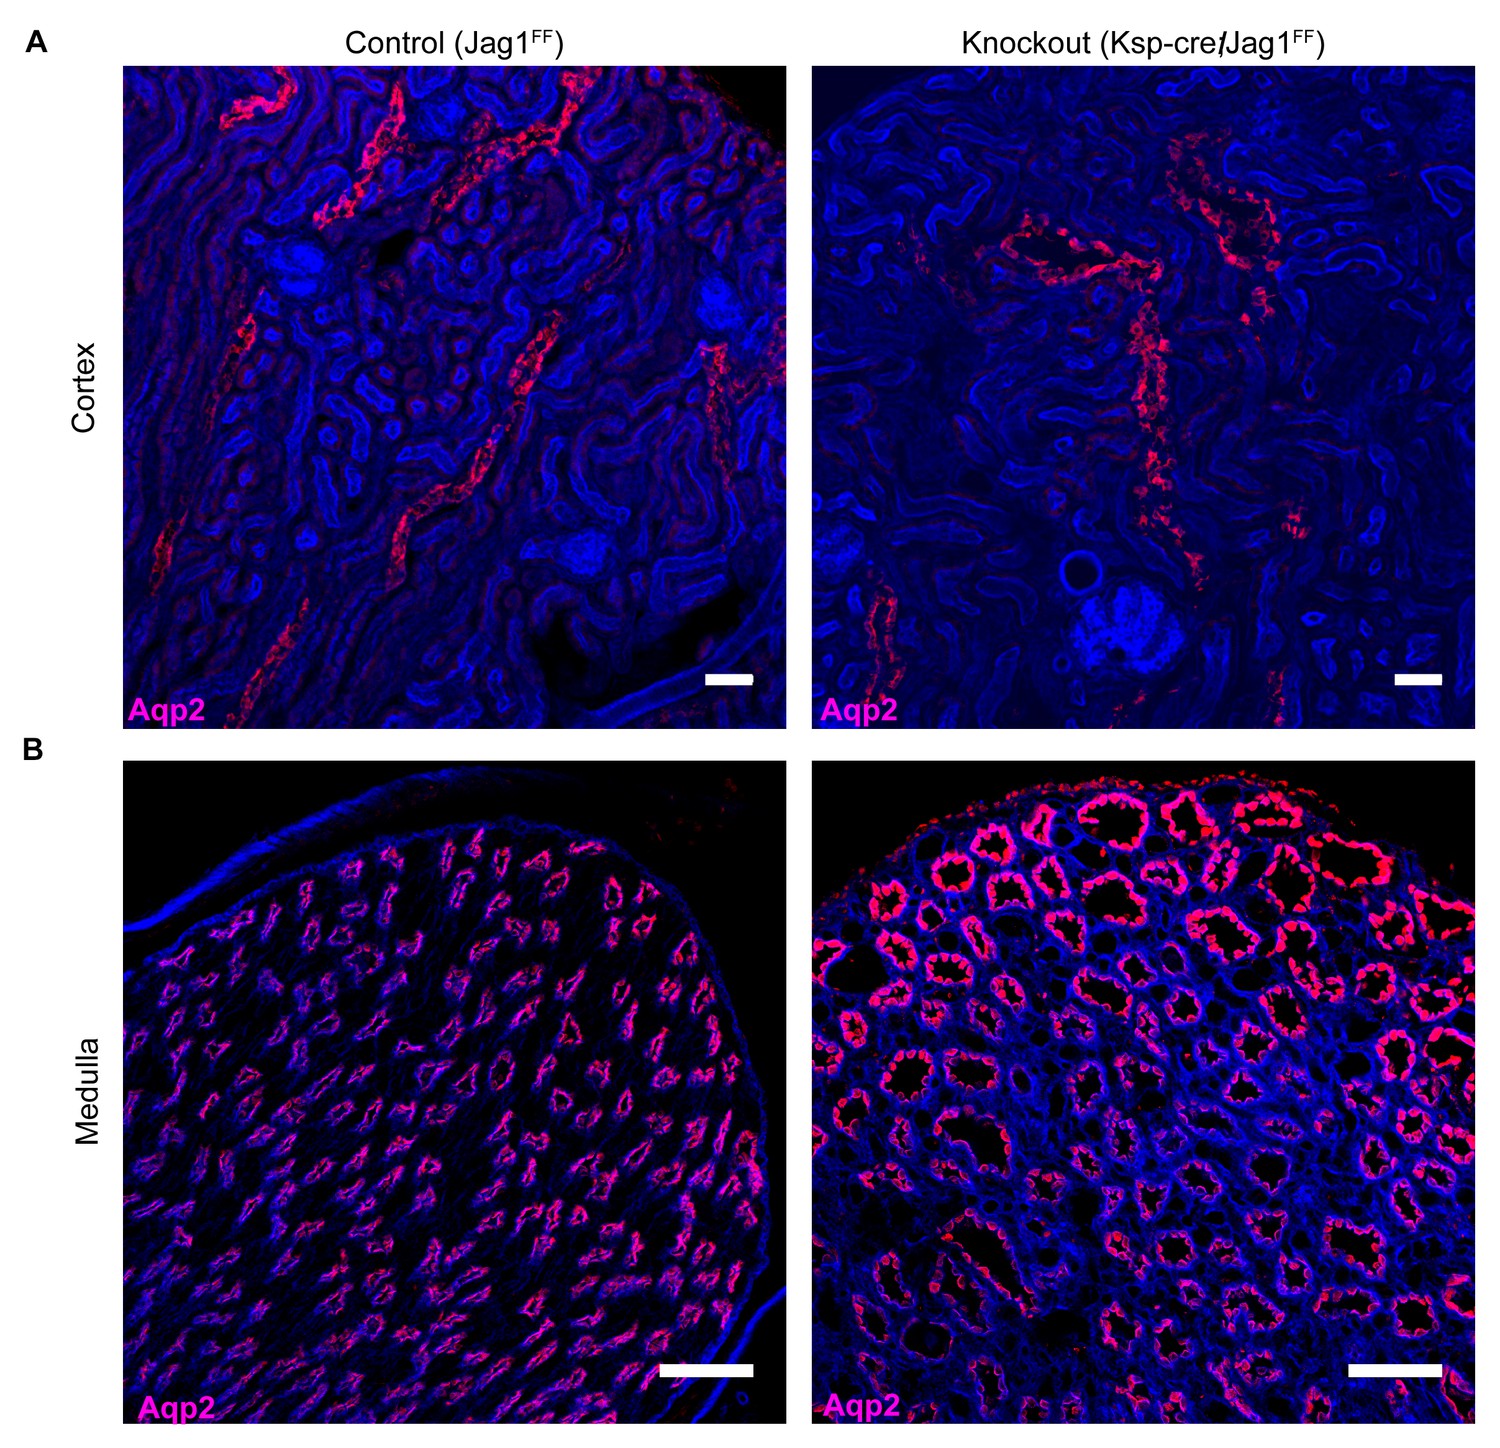
Jag1 regulates the distribution of IC proteins in the collecting ducts.
Knockout of Jag1 (Jag1f/f;Cdh16-Cre) resulted in diffuse expression of IC proteins A Atp6b1 and B Foxi1. Expression of these proteins overlapped with Aqp2 creating ‘double positive’ cells. (n = 4 independent mice; Bars = 10 µm).
Figure 9—figure supplement 1
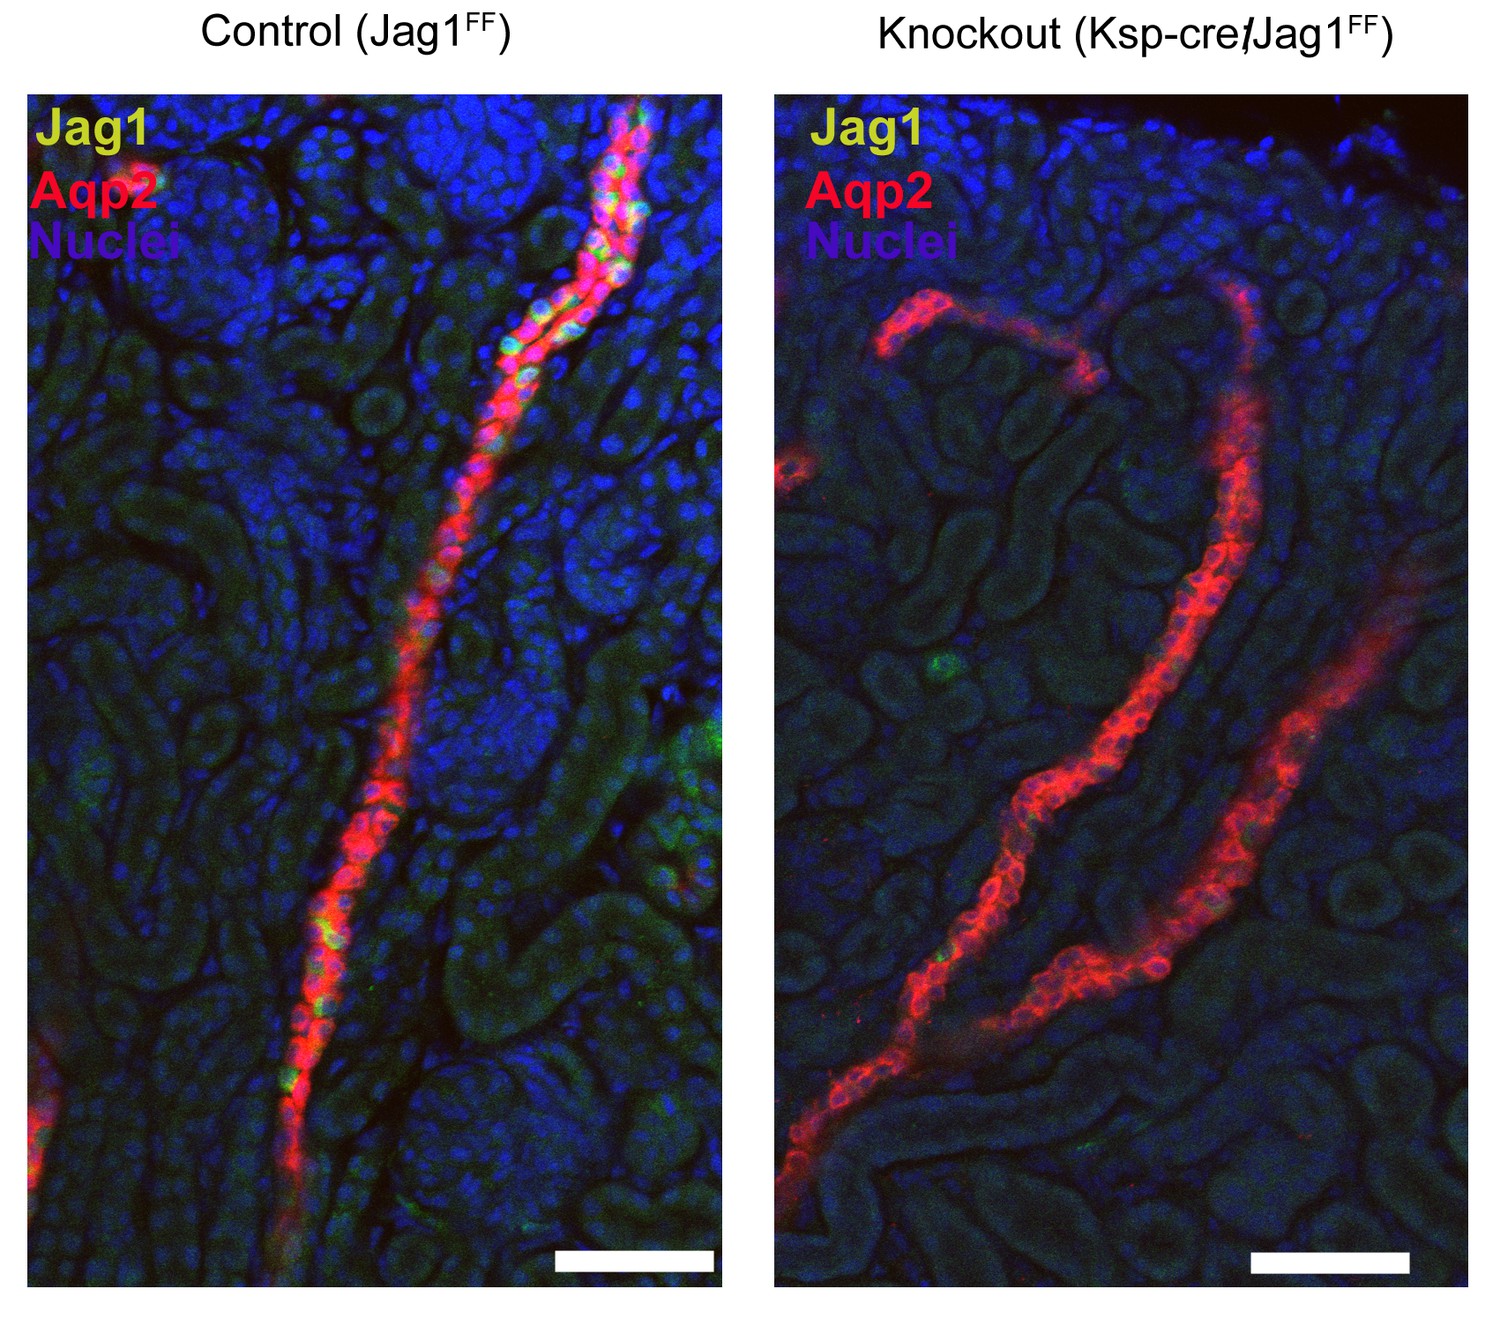
Deletion of Jag1 by Cdh16-Cre.
Note the loss of Jag1 staining. Examined at P1. Bars = 50 µm.
Figure 9—figure supplement 2
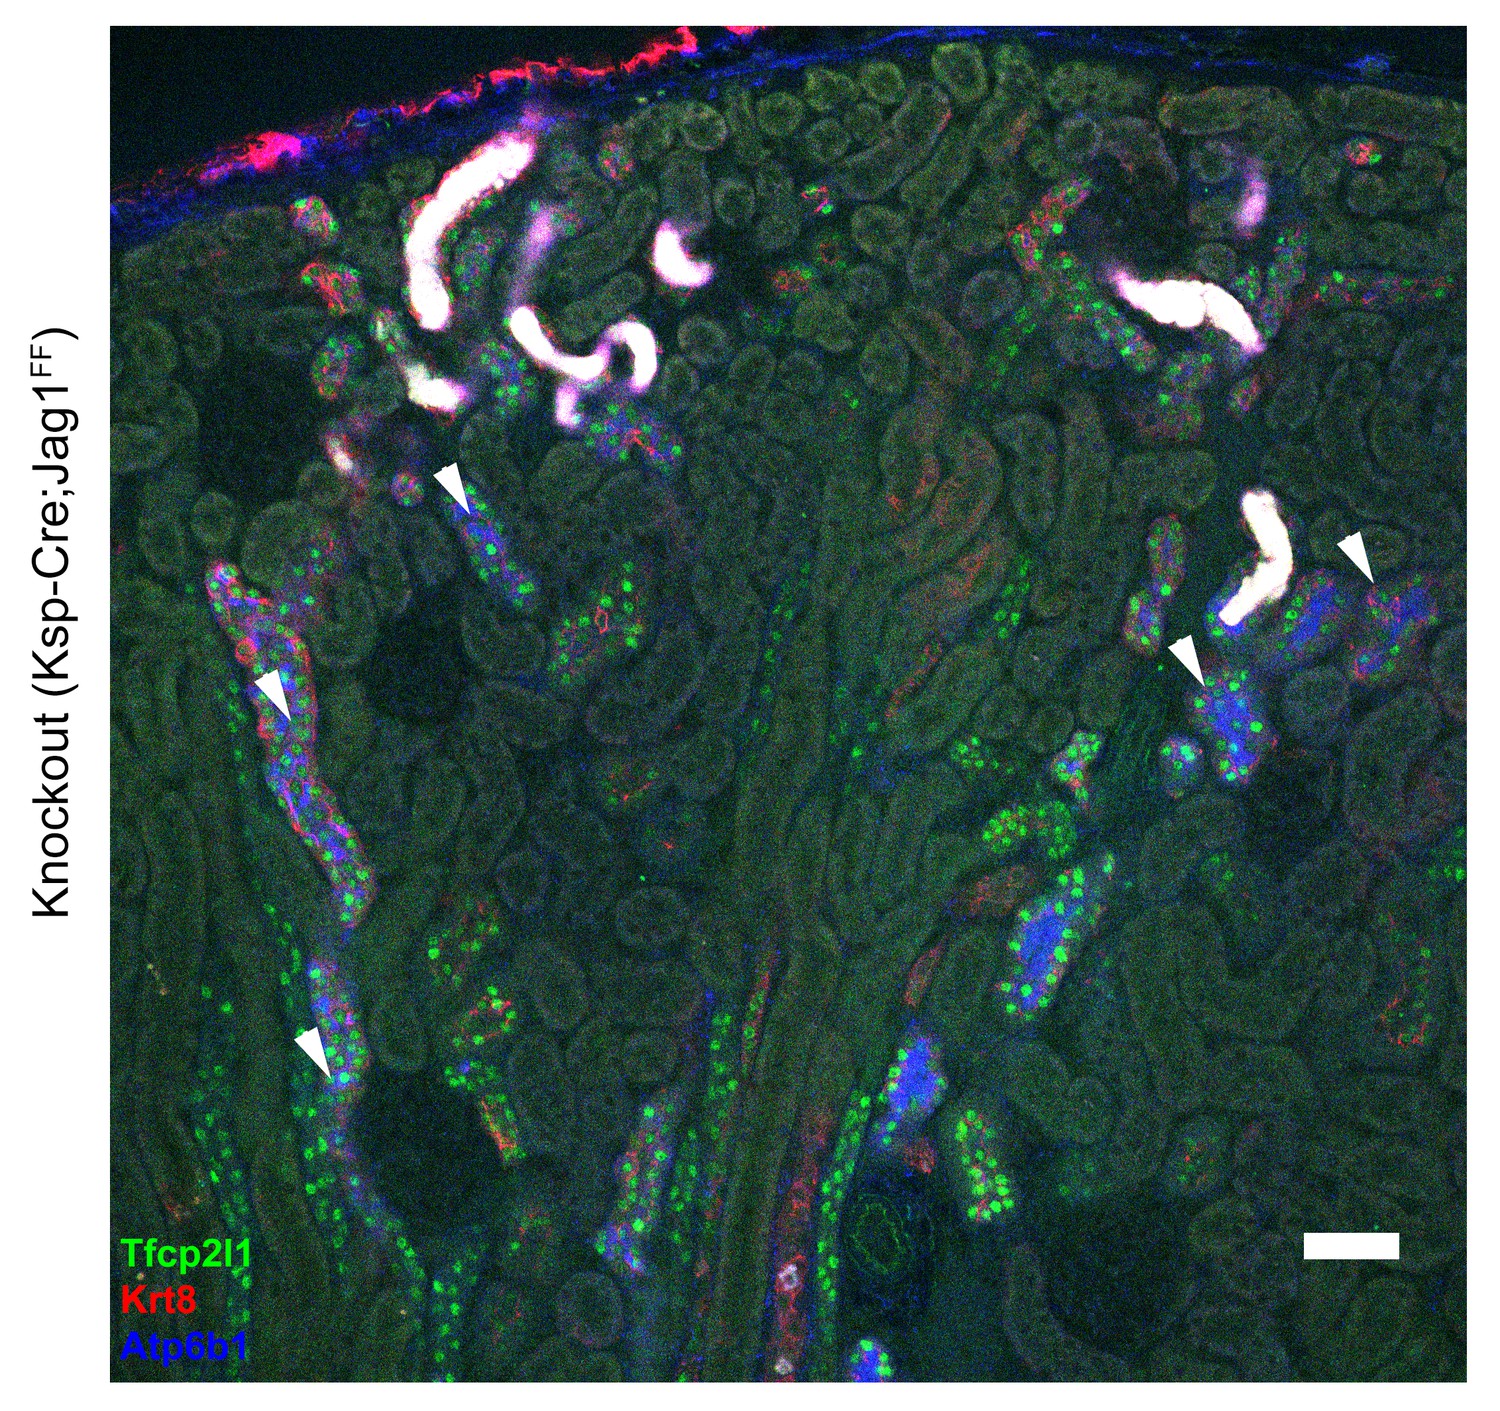
Overview of the gross morphology of Jag1 knockout kidneys.
Knockout of Jag1 (Cdh16-Cre;Jag1f/f) resulted in the uniform and overlapping expression pattern of Atp6b1 (IC marker, blue) and Krt8+ (PC marker, red) in cortical collecting ducts. However, the deletion of Jag1 did not affect the expression of Tfcp2l1. ‘White’ color tubules result from luminal debris. Bar = 50 µm.
Figure 9—figure supplement 3
Jag1 is required for structural integrity of the collecting duct.
(A,B) Deletion of Jag1 (Jag1f/f;Cdh16-Cre) resulted in dilation of Aqp2+ (red) cortical and medullary collecting ducts. Phalloidin (blue) (n = 4 independent mice; Examined at P60. (A) Bars = 25 µm; (B) Bars = 50 µm).
Figure 9—figure supplement 4
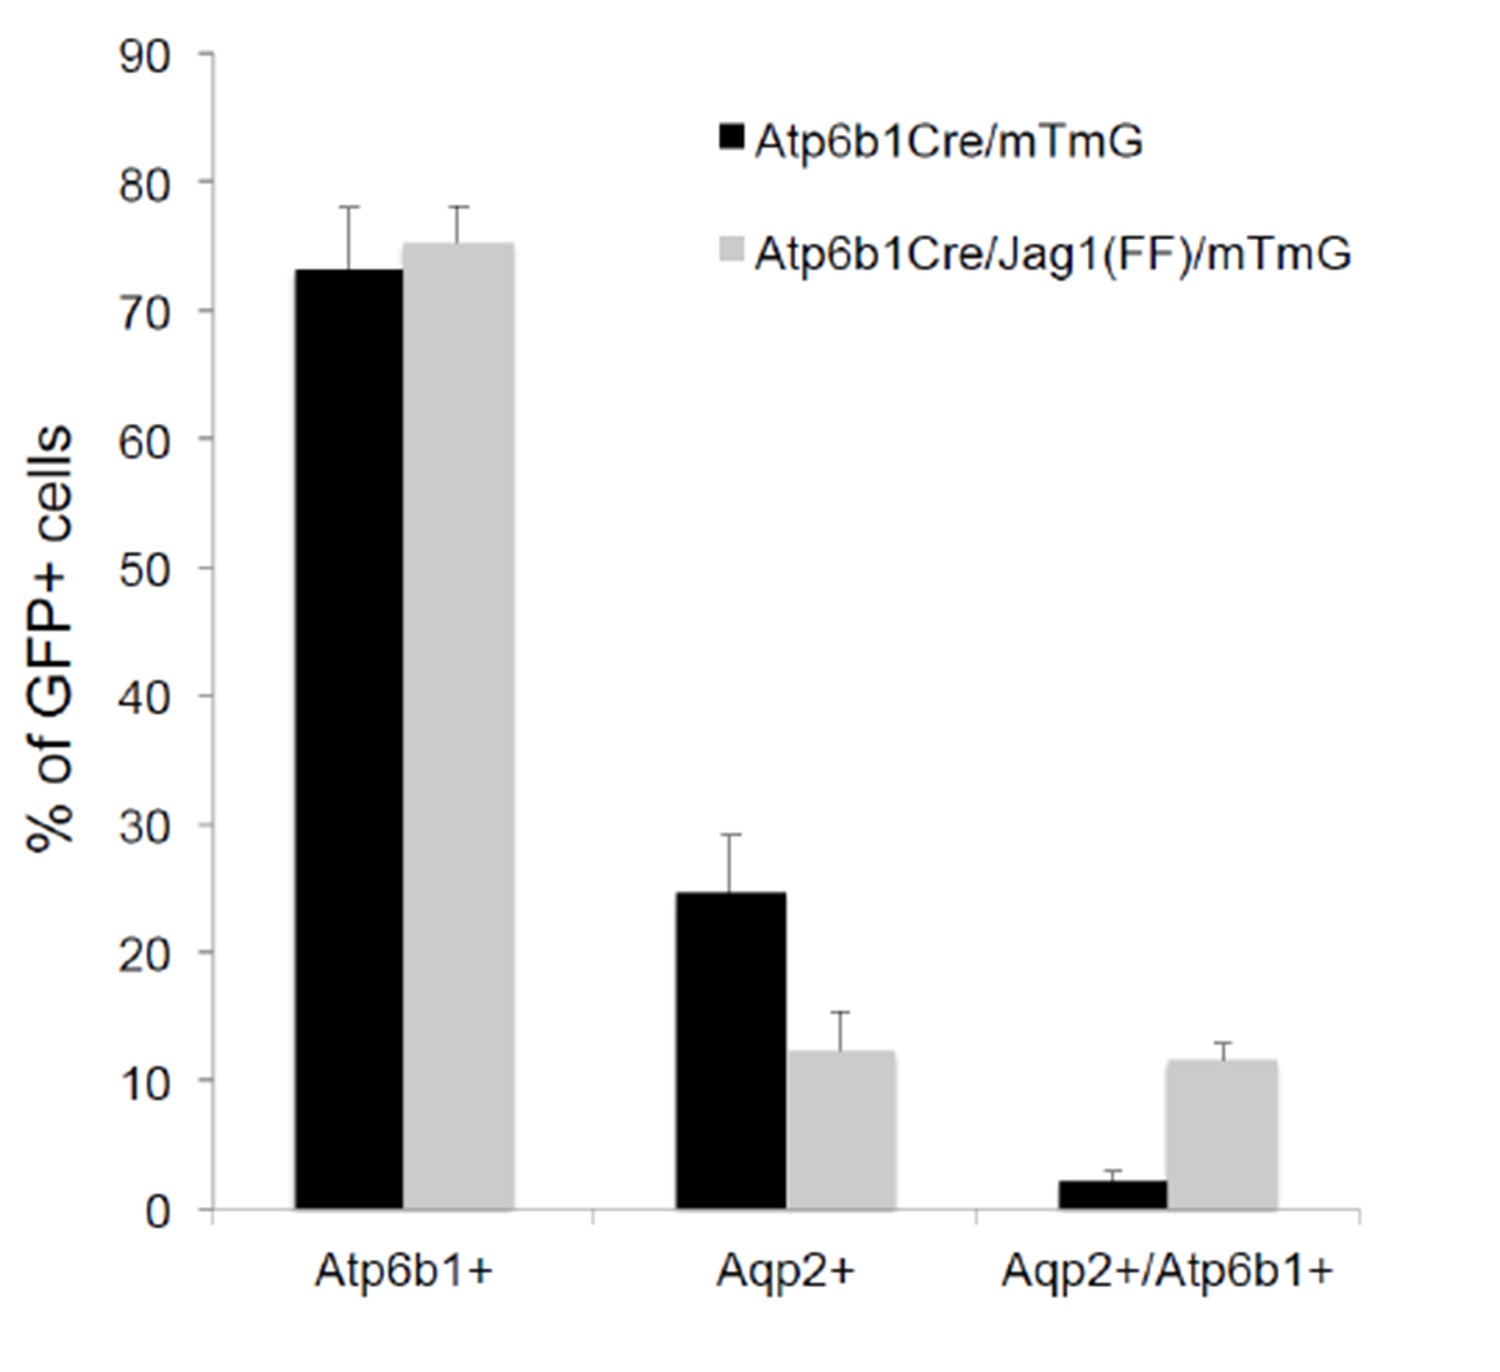
Deletion of Jag1 in IC (Jag1f/f;Atp6b1-Cre;mTmG) resulted in a six fold increase in ‘double positive’ cells (from 2% to 12%; n = 3 independent mice).
Only Atp6b1Cre driven GFP+ cells were assayed.
Figure 10
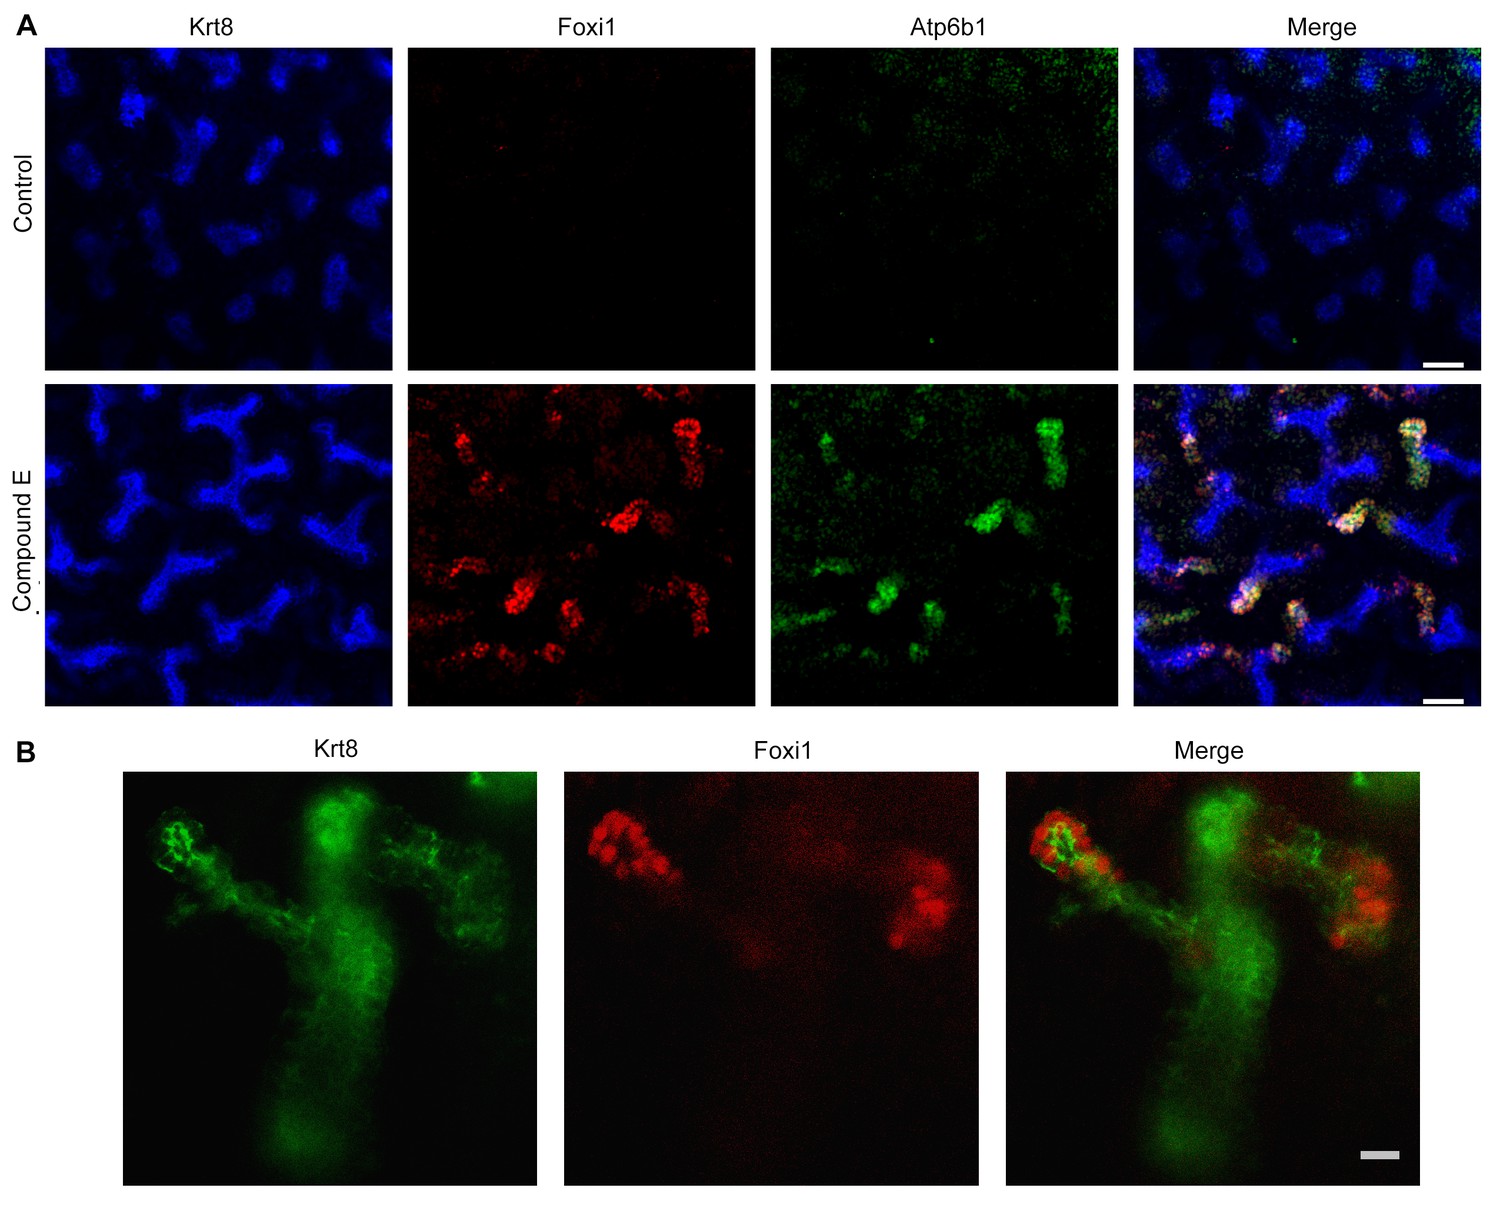
Manipulation of Notch signaling in vivo.
(A) Inhibition of Notch signaling upregulates Foxi1 and promotes IC cell differentiation. Acute inhibition of Notch signaling in E15 kidneys with Compound E (48 hr) resulted in the differentiation of IC cells at the tips of the UB/Collecting Ducts. Note that the IC cells demonstrated a ‘double-positive’ phenotype with the co-expression of PC (Krt8+ blue) and IC (Foxi1+ red, Atp6b1+ green) proteins. (B) High power of Compound E treated kidneys (n = 6 independent mouse kidney cultures). (A) Bars = 50 µm and (B) Bar = 10 µm.
Figure 11
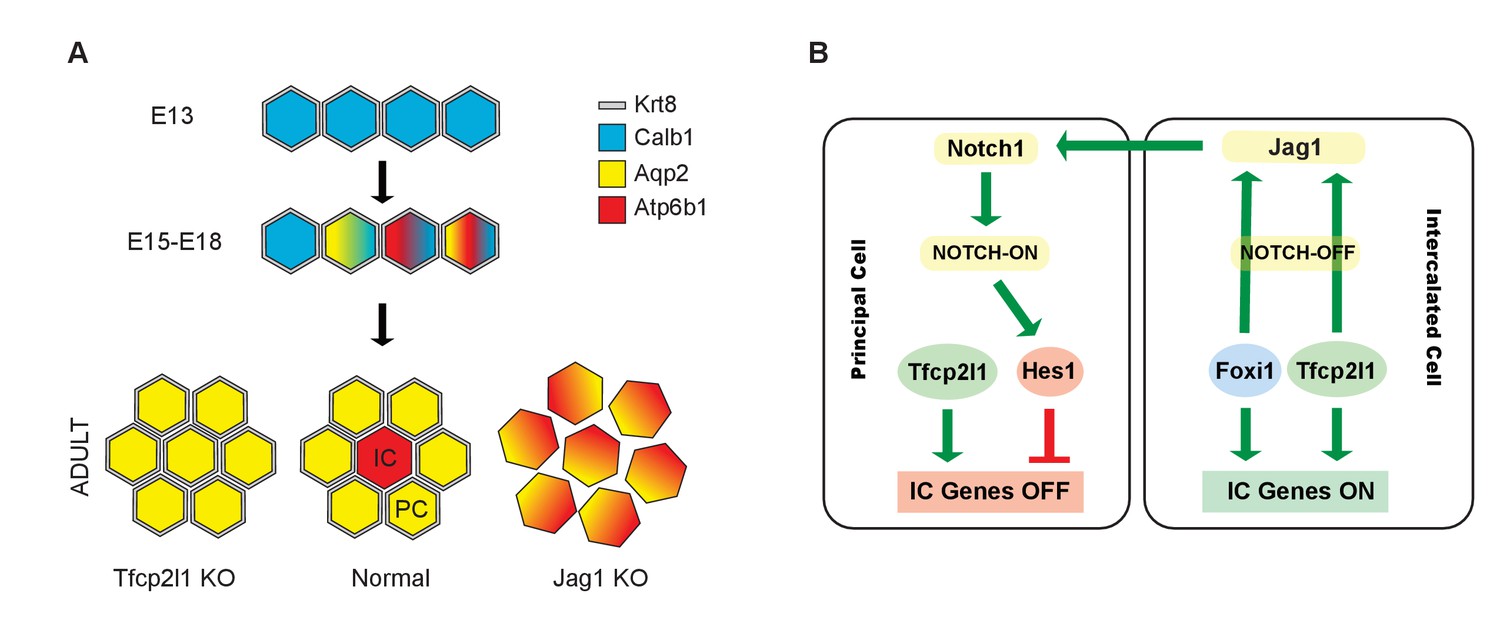
Models.
(A) Development of cellular diversity in the collecting duct. Initially, we found a monotonous expression of PC proteins at E13, and then a transitional stage (E15–E18) characterized by the appearance of ‘double-positive’ cells. After birth, these cells achieved distinct identities and assumed rosette-like patterning. Deletion of Tfcp2l1 resulted in a monotonic cell type expressing PC cell, but not IC cell markers. Inactivation of Jag1 in contrast resulted in the loss of cell identity and patterning, increasing the number of ‘double-positive’ cells typified by E18 collecting ducts. (B) Proposed model of cell-autonomous and non-cell-autonomous actions of Tfcp2l1. Tfcp2l1 induces the expression of IC genes, including Jag1. Expression of Jag1 triggers Notch signaling in adjacent PC cells. Jag1 signaling results in activation of Hes1 (Notch-ON) in PCs and conversely Foxi1 expression in ICs (Notch-OFF). We envision that the combination of Tfcp2l1 with either Foxi1 or Hes1 drives cell identity. Maintenance of this circuit may depend on an excess of Tfcp2l1 in ICs (Figure 1) as well as the expression of Foxi1 which is known to induce Jag1. Conversely, Jag1 suppression of Foxi1 (Figures 8 and 9) demonstrates a negative feedback loop in neighboring PCs.
Author response image 1
Additional files
-
Supplementary file 1
Limma analysis of Affymetrix microarrays demonstrating differentially expressed genes in EIIA-Cre;Tfcp2l1f/f vs Tfcp2l1f/f kidneys (P1).
- https://doi.org/10.7554/eLife.24265.025
-
Supplementary file 2
Identification of Tfcp2l1 binding sites in P1 kidney using ChIP-seq (compared to IgG ChIP).
Analysis by MACS.
- https://doi.org/10.7554/eLife.24265.026
-
Supplementary file 3
GREAT analysis of Tfcp2l1 binding sites from Supplementary file 2 demonstrating significantly enriched pathways.
- https://doi.org/10.7554/eLife.24265.027
-
Supplementary file 4
Motif analysis of top 1000 Tfcp2l1 binding sites from P1 kidney (data from Supplementary file 2).
- https://doi.org/10.7554/eLife.24265.028
-
Supplementary file 5
PCR primers and antibodies.
- https://doi.org/10.7554/eLife.24265.029
Download links
A two-part list of links to download the article, or parts of the article, in various formats.
Downloads (link to download the article as PDF)
Open citations (links to open the citations from this article in various online reference manager services)
Cite this article (links to download the citations from this article in formats compatible with various reference manager tools)
Transcription factor TFCP2L1 patterns cells in the mouse kidney collecting ducts
eLife 6:e24265.
https://doi.org/10.7554/eLife.24265


