Host-selected mutations converging on a global regulator drive an adaptive leap towards symbiosis in bacteria
- University of New Hampshire, United States
Figures
Figure 1
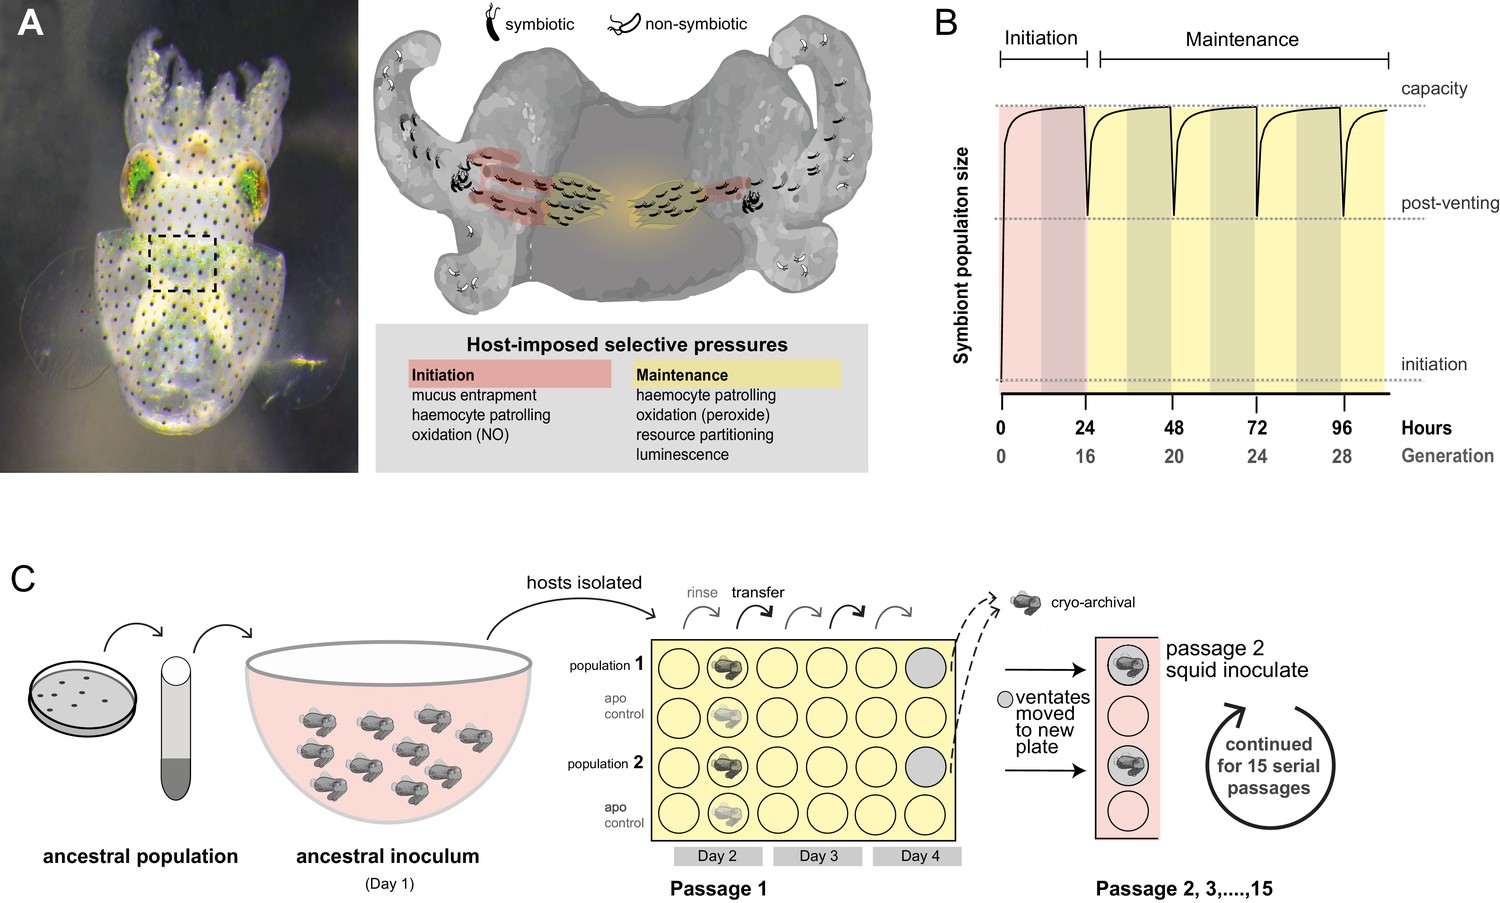
Host selection mechanisms that shape adaptive evolution by V. fischeri.
(A) Dorsal view of juvenile host E. scolopes (left) with box indicating the relative position of the ventrally situated symbiotic light organ. On the right, a schematic illustrating the stages at which host-imposed selection occurs during squid–V. fischeri symbiosis: host recruitment (mucus entrapment, aggregation at light organ pores), initiation of symbiosis (host defenses, including hemocyte engulfment and oxidative stress), and colonization and maintenance (nutrient provisioning, sanctioning of non-luminous cheaters, continued hemocyte patrolling, and daily purging). (B) Symbiont population growth modeled for a single passage on the basis of growth dynamics of V. fischeri ES114. Light-organ populations are initiated with as few as ~10 cells (Wollenberg and Ruby, 2009; Altura et al., 2013) or as much as 1% of the inoculum, but are reduced by 95% following venting of the light organ at dawn (every 24 hr) (Boettcher et al., 1996). Shaded areas represent night periods whereas light areas represent daylight, which induces the venting behavior. (C) Experimental evolution of V. fischeri under host selection as described in Schuster et al. (2010). Each ancestral V. fischeri population was prepared by recovering cells from five colonies, growing them to mid-log phase, and sub-culturing them into 100 mL filtered seawater at a concentration sufficient to colonize squid (≤20,000 CFU/mL). On day 1, ten un-colonized (non-luminous) juvenile squid were communally inoculated by overnight incubation, during which bacteria were subjected to the first host-selective bottleneck. Following venting of ~95% of the light organ population, the squid were separated into isolated lineages in individual wells of a 24-well polystyrene plate containing filtered sea water with intervening rows of squid from an un-inoculated control cohort, the aposymbiotc control (‘apo control’). Note that only two of the ten passage squid populations are shown. On days 2, 3, and 4, after venting, squid were rinsed and transferred into 2 mL fresh filtered seawater. Luminescence was measured at various intervals for each squid to monitor colonization and the absence of contamination in aposymbiotic control squid. On the fourth day, the squid and half of the ventate were frozen at −80°C to preserve bacteria, and the remaining 1 mL ventate was combined with 1 mL of fresh filtered seawater, and used to inoculate a new uncolonized 24-hr-old juvenile squid. The process continued for 15 squid only for those lineages in which squid were detectably luminous at 48 hr post inoculation.
Figure 2 with 1 supplement

Experimental evolution of Vibrio fischeri produced multiple alleles in the sensor kinase BinK.
(A). Phylogenetic relationship, symbiotic capacity, and mutations accrued during squid experimental evolution of ecologically diverse Vibrio fischeri strains. Strain relationships were inferred under maximum likelihood using whole genomes with RealPhy (Bertels et al., 2014) and with node supports calculated from 1,000 bootstraps. Graphic symbols for ecological niches represent the source of isolation. Intrinsic squid symbiotic capacities of the five experimentally evolved strains, as determined by the minimum inoculum concentration required for successful colonization of 90% of squid with a 3 hr (ES114, EM17, and WH1) or over-night (H905 and MJ11) inoculum, are represented by color spectrum. Consensus genomes for each of the parallel V. fischeri populations evolved through E. scolopes are shown on the right, with variants indicated by circles. Mutation details are shown in Table 2. The mutations that were selected in host-passaged populations improved symbiotic capacity rather than general vigor. (B) BinK mutations arising in squid-evolved populations of MJ11 occurred in the HAMP and HATPaseC domains. A homo-dimer structural model for BinK using TMPRed and hybrid histidine kinase domain modelling (Anantharaman and Aravind, 2000; Stewart and Chen, 2010) predicts that the accessory sensory Cache1 domain localizes to the periplasm whereas the remaining four functional domains (accessory HAMP, and conserved HisKA, HATPaseC, and REC phosphorelay domains) are cytoplasmic (shown as gray band). A position-specific scoring matrix (PSSM) analysis for each of the squid-evolved BinK positions indicates whether a given amino acid is more (positive) or less (negative) likely to be functionally neutral. Scores for the substitutions incurred at these sites are shown in bold. Please refer to Figure 2—figure supplement 1 for a phylogenetic assessment of BinK orthology across Aliivibrio and V. fischeri strains.
Figure 2—figure supplement 1
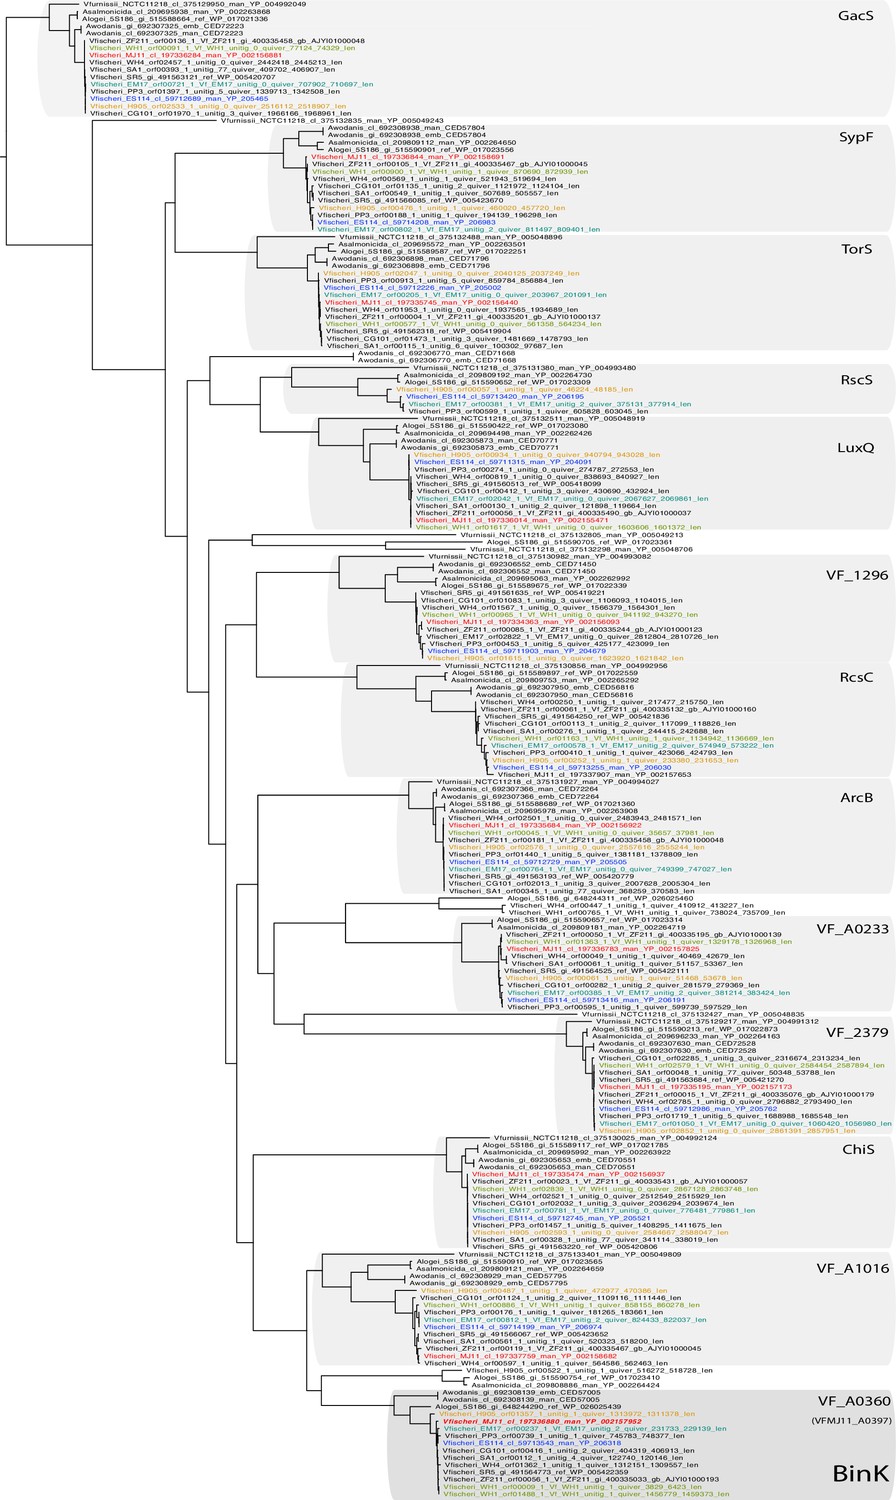
BinK orthology, conserved domains and squid-adapted binK alleles.
(A) Unrooted maximum-likelihood (ML) phylogeny of all of the hybrid histidine kinases identified in V. fischeri genomes. Gene families were phylogenetically annotated using Escherichia coli references where possible (not shown), otherwise using the ES114 locus tag.
Figure 3 with 2 supplements
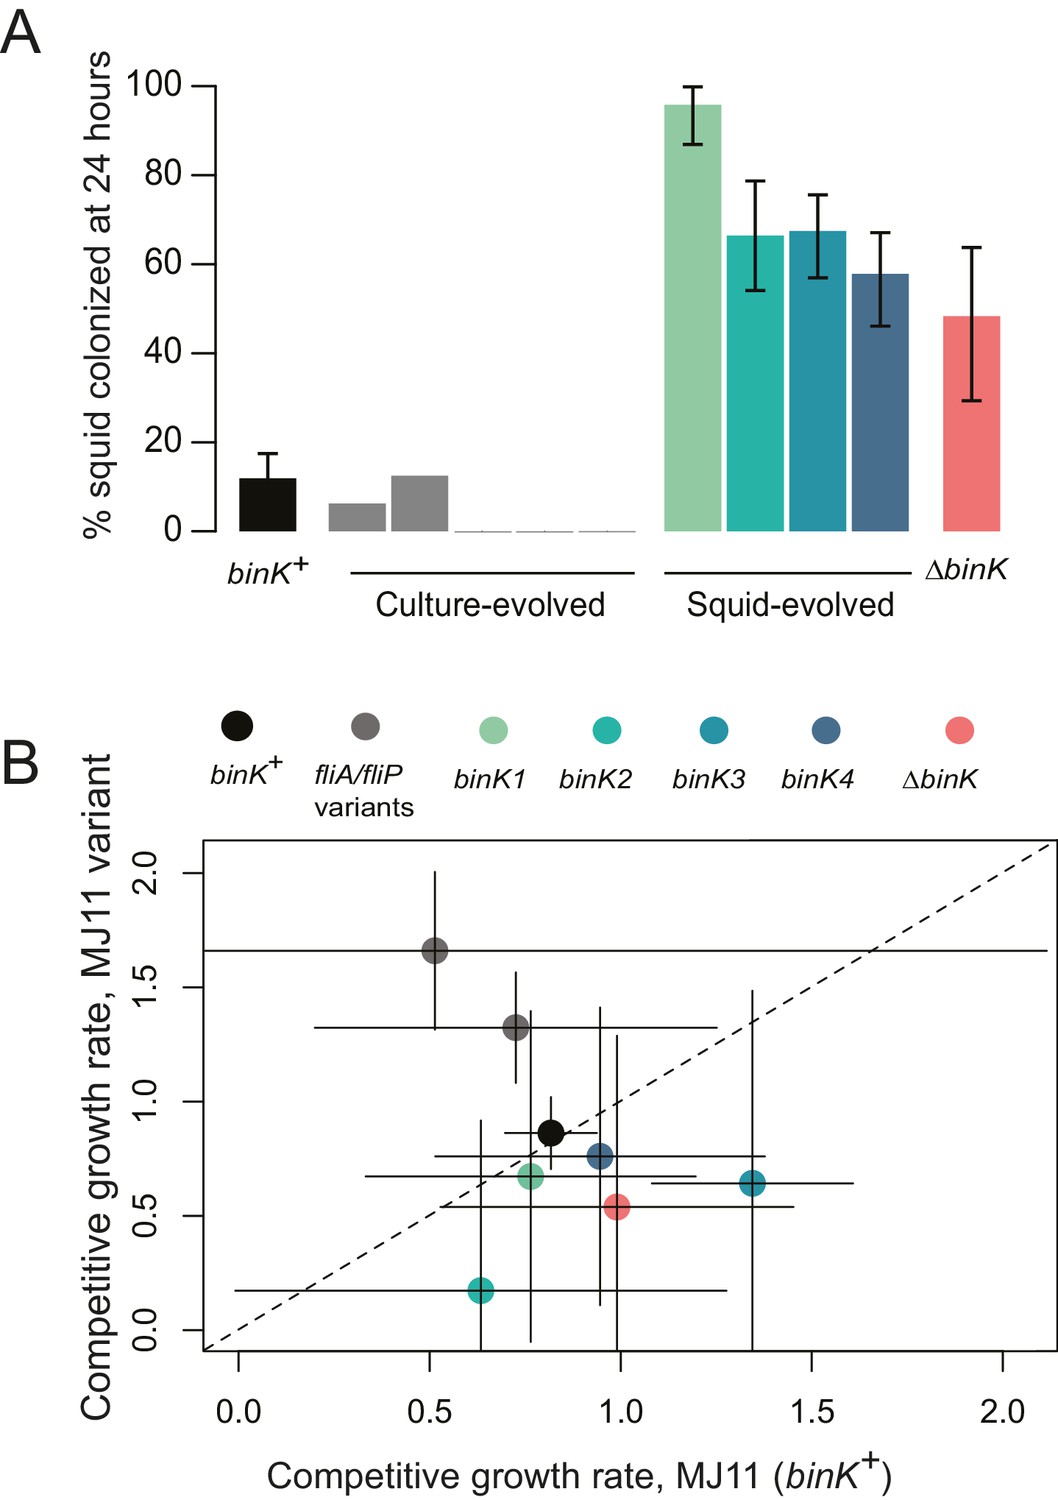
Evolved binK alleles enhanced host colonization and conferred a fitness tradeoff in non-host environments.
(A) Symbiotic colonization efficiency of MJ11 and derivatives in squid. Percentage of squid colonized by culture-evolved (c1–c5) and squid-evolved (binK1- binK4, bolded isolates in Table 2) derivatives of MJ11. Three hours after a cohort of 10–20 squid were inoculated with 3000 CFU/mL of each MJ11 strain, the squid were separated into individual vials, and colonization percentages determined by detectable luminescence at 24 hr. Bars: 95% CI. (B) Growth rates of MJ11 and evolved strains during competition in laboratory culture. Average growth rates (realized Malthusian parameters) of ΔbinK, squid-evolved binK and culture-evolved flagellar mutants (fliA and fliP variants, see Table 2) following in vitro culture competition in minimal media with ancestral binK+ MJ11, estimated using CFU yields of each competitor recovered at regular intervals. Bars: 95% CI. The diagonal line indicates 1:1 growth. Please refer to Figure 3—figure supplement 1 for data on the competitive abilities of binK1 and binK3 during colonization. Please refer to Figure 3—figure supplement 2 for symbiotic yields (CFU) of ES114 and MJ11 strains after 24 and 48 hr.
Figure 3—figure supplement 1
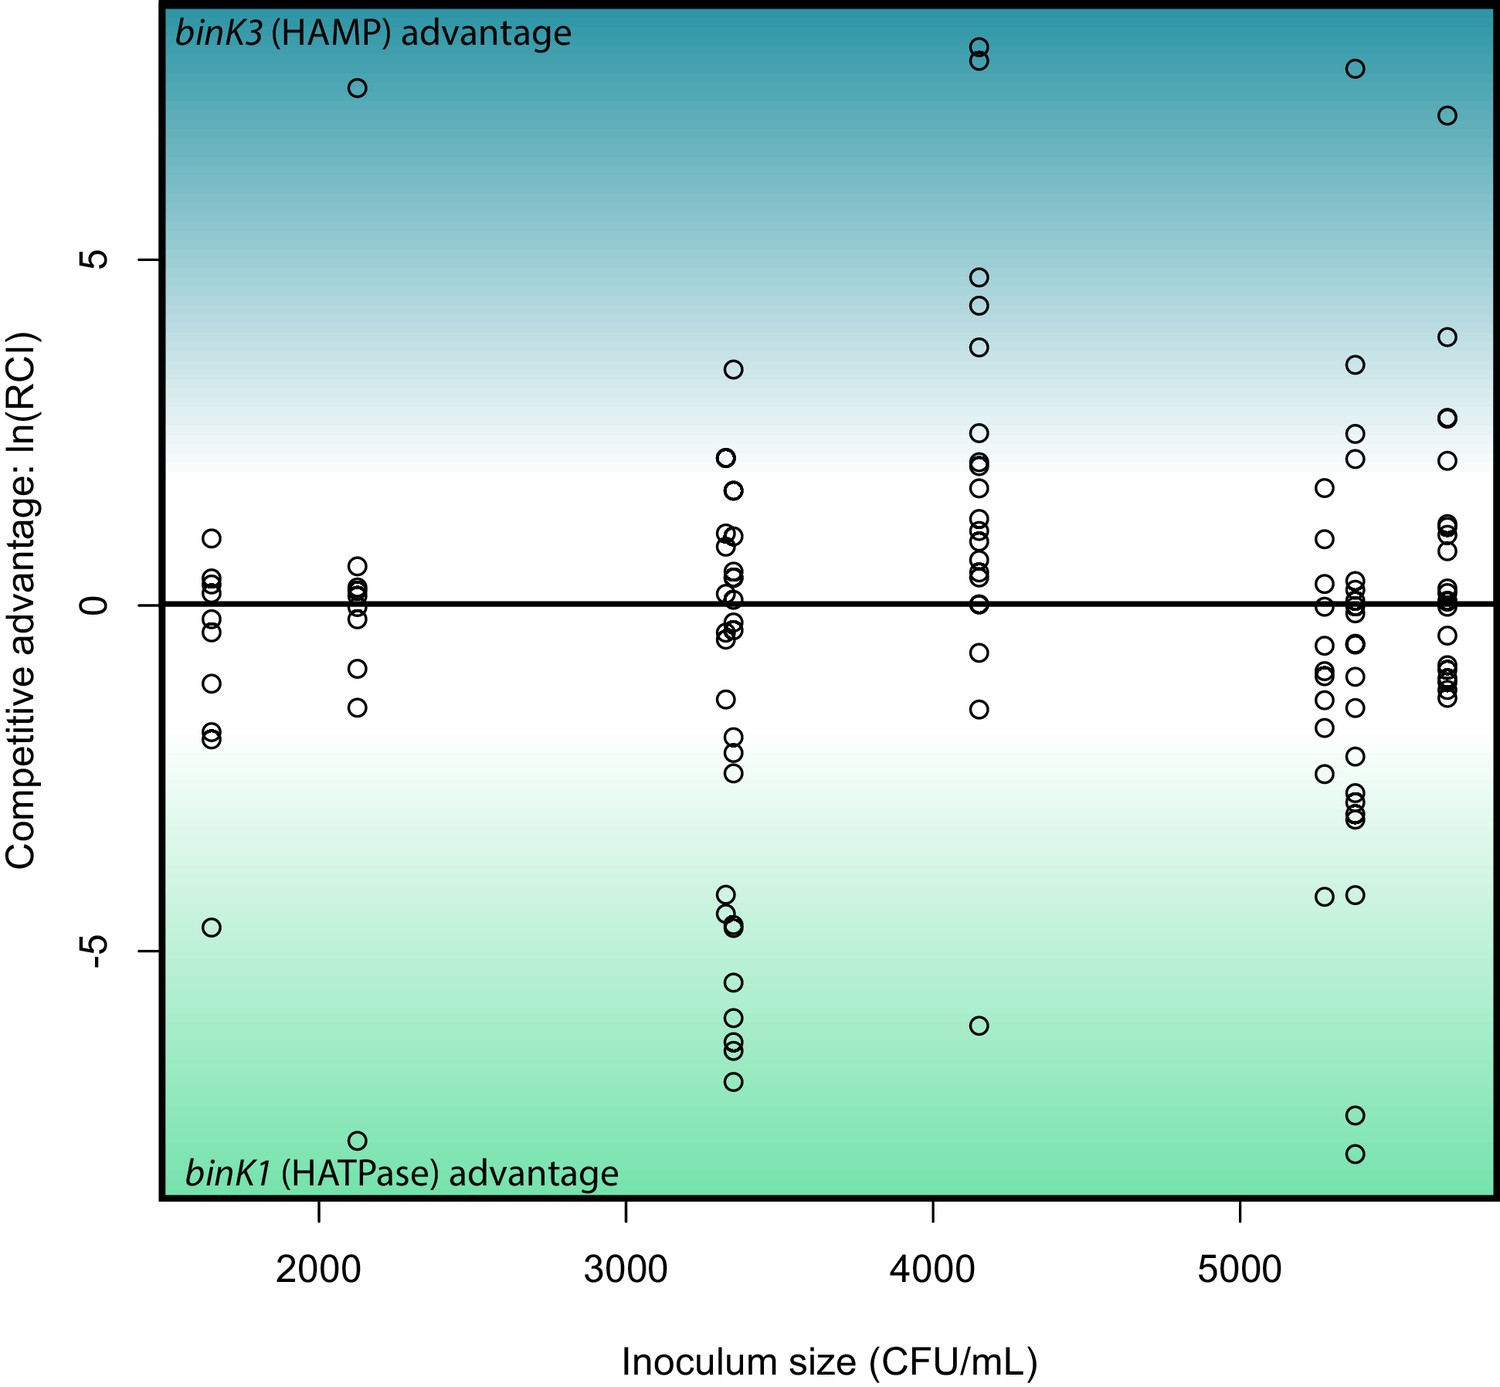
Relative competitive ability of binK1 and binK3 variants to colonize squid.
In vivo competitions suggest no competitive advantage in squid colonization between evolved V. fischeri MJ11 variants carrying either HAMP or HATPaseC domain mutations. Relative competitive indices for binK1 and binK3 MJ11 variants (carrying HATPaseC and HAMP domain mutations, respectively) used to co-inoculate squid across a range of inoculum densities. Points above or below zero represent squid light organs that are dominated by bink3 or bink1, respectively.
Figure 3—figure supplement 2
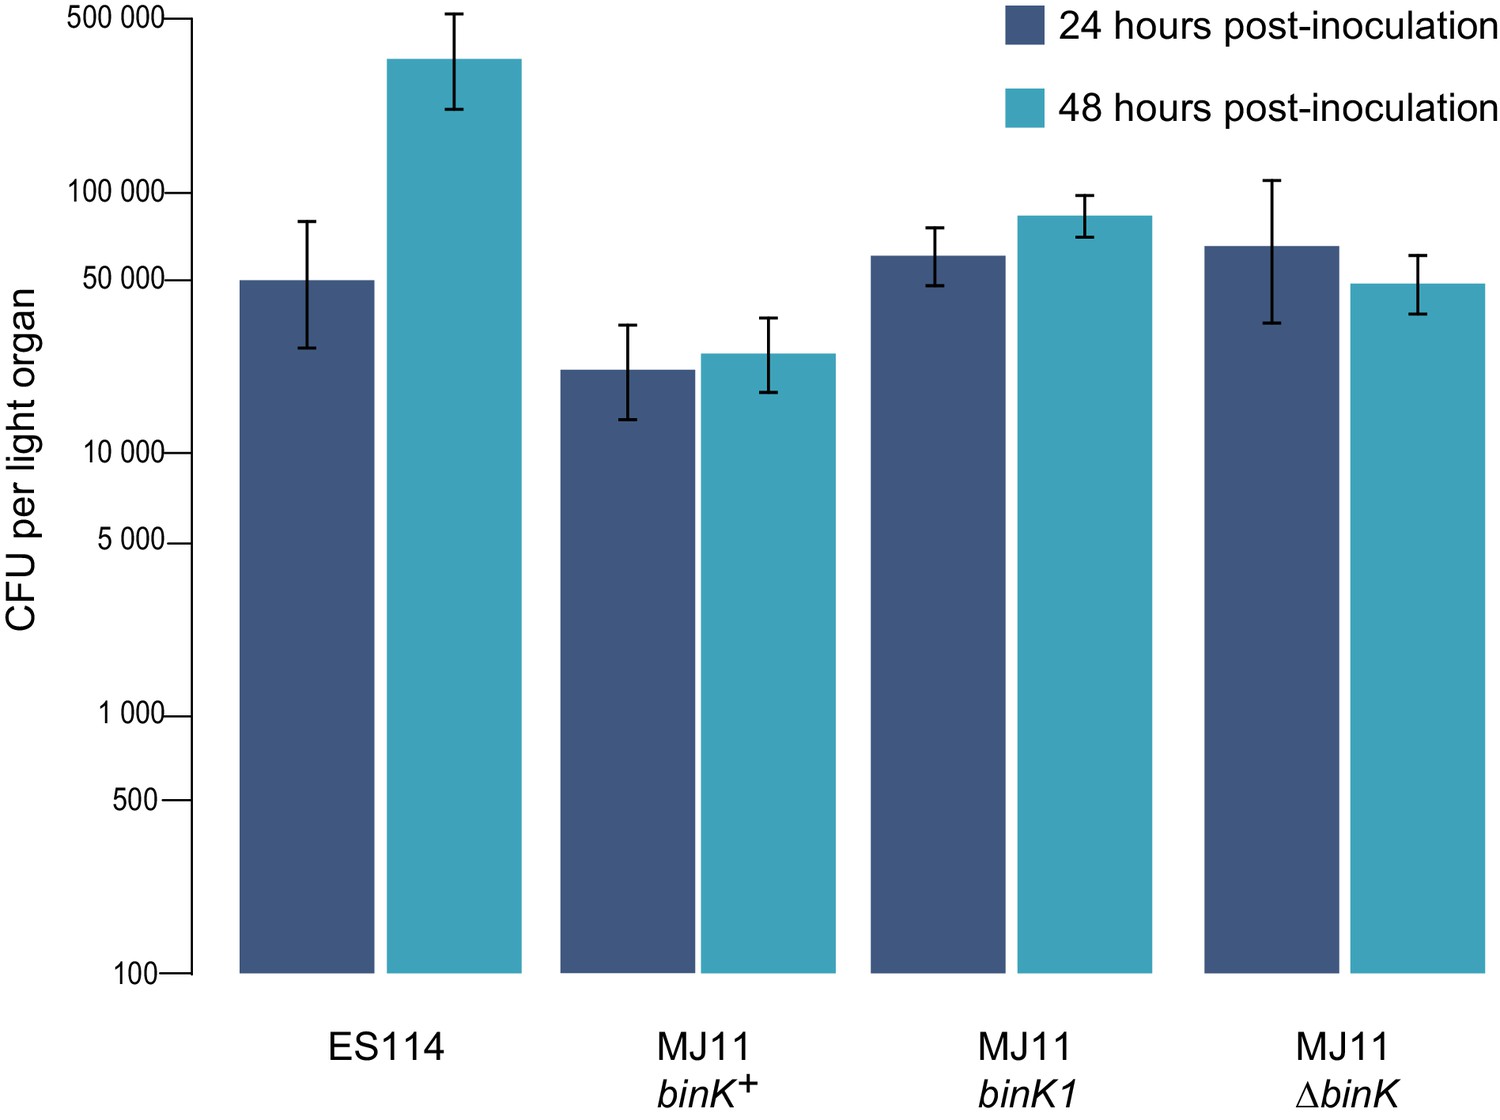
Growth of strain ES114 and strain MJ11 and its binK variants in squid light organs 24 or 48 hr after inoculation.
Yields of symbionts determined by plating serial dilutions of squid homogenate as described previously (Whistler and Ruby, 2003). Note: the Y-axis is log-scaled. Bars: 95% CI.
Figure 4 with 1 supplement
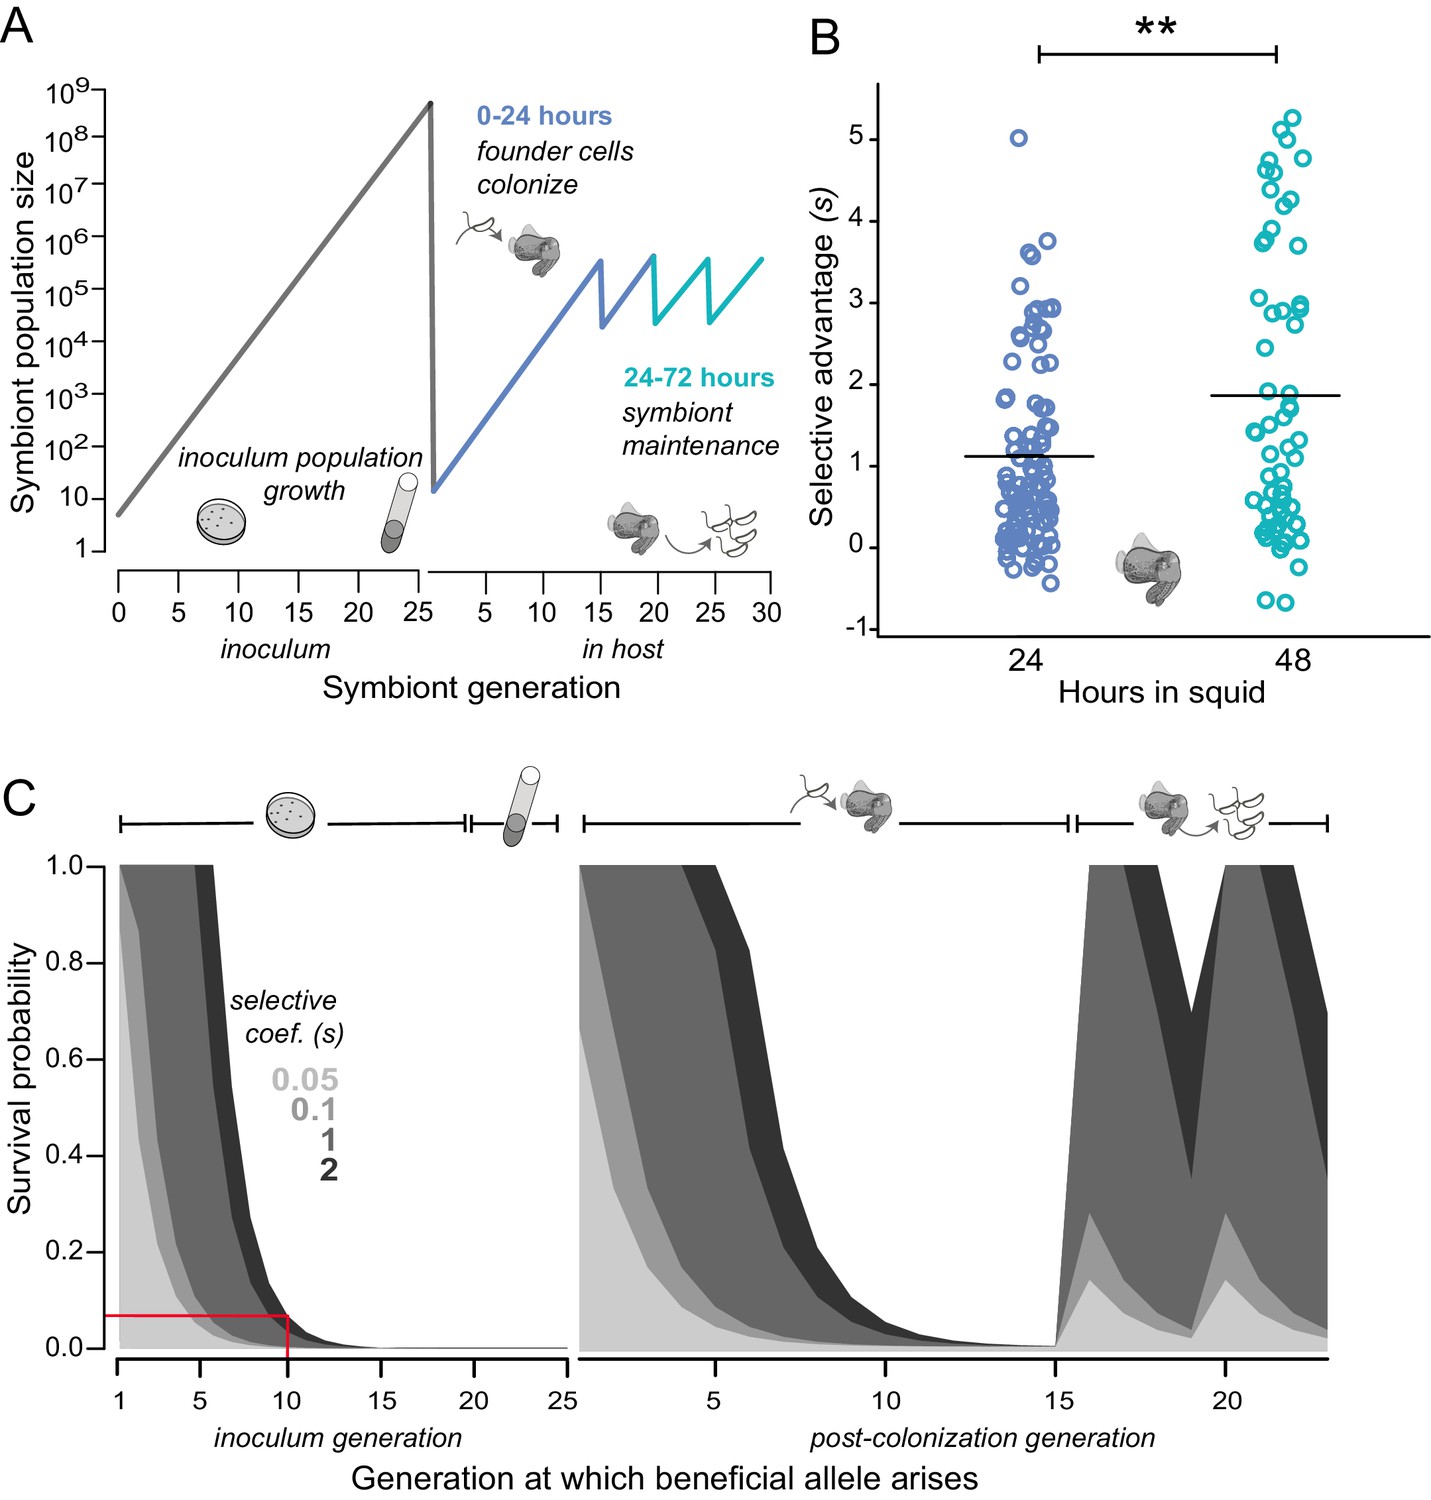
Empirical and modeled estimates of selective advantage in evolving V. fischeri symbiont populations.
(A) Conceptual overview of symbiont population dynamics during growth in inoculum and following host colonization (black line), including daily host-imposed bottlenecks. (B) Comparison of the selection coefficients conferred by binK1 in strain MJ11EP2-4-1 (harboring no other mutations) relative to binK+ from co-inoculated squid light organs after 24 or 48 hr. The selective advantage (i.e., relative competitiveness) of the evolved allele increased significantly during this period from 1.1 to 1.8 (Fisher-Pitman permutation test, **p=0.0011). Each circle represents the selective advantage of each strain measured from the strain ratios recovered in an individual hatchling. Please refer to Figure 4—figure supplement 1 for the effect of starting binK1 frequencies and inoculum densities on estimates of selective advantage. (C) Modeled survival probabilities for new beneficial alleles arising in a growing symbiont population facing host-imposed bottlenecks. The gray shaded curves estimate the survival probability of new mutants following the subsequent population bottleneck, which depends on both the generation of growth in the inoculum or host in which they arise (x-axis) and the selective advantage (s) conferred by mutation (gray shading). Notably, beneficial variants that arise early in inoculum culture are likely to survive extinction at the subsequent bottleneck, and this probability of survival rapidly decreases even when conferring a large selective coefficient. On the basis of this model, for example, a mutation conferring a large selective advantage (s ~2) would have less than a 10% chance of surviving the subsequent colonization bottleneck if it arose during the tenth generation of inoculum growth (red line).
Figure 4—figure supplement 1
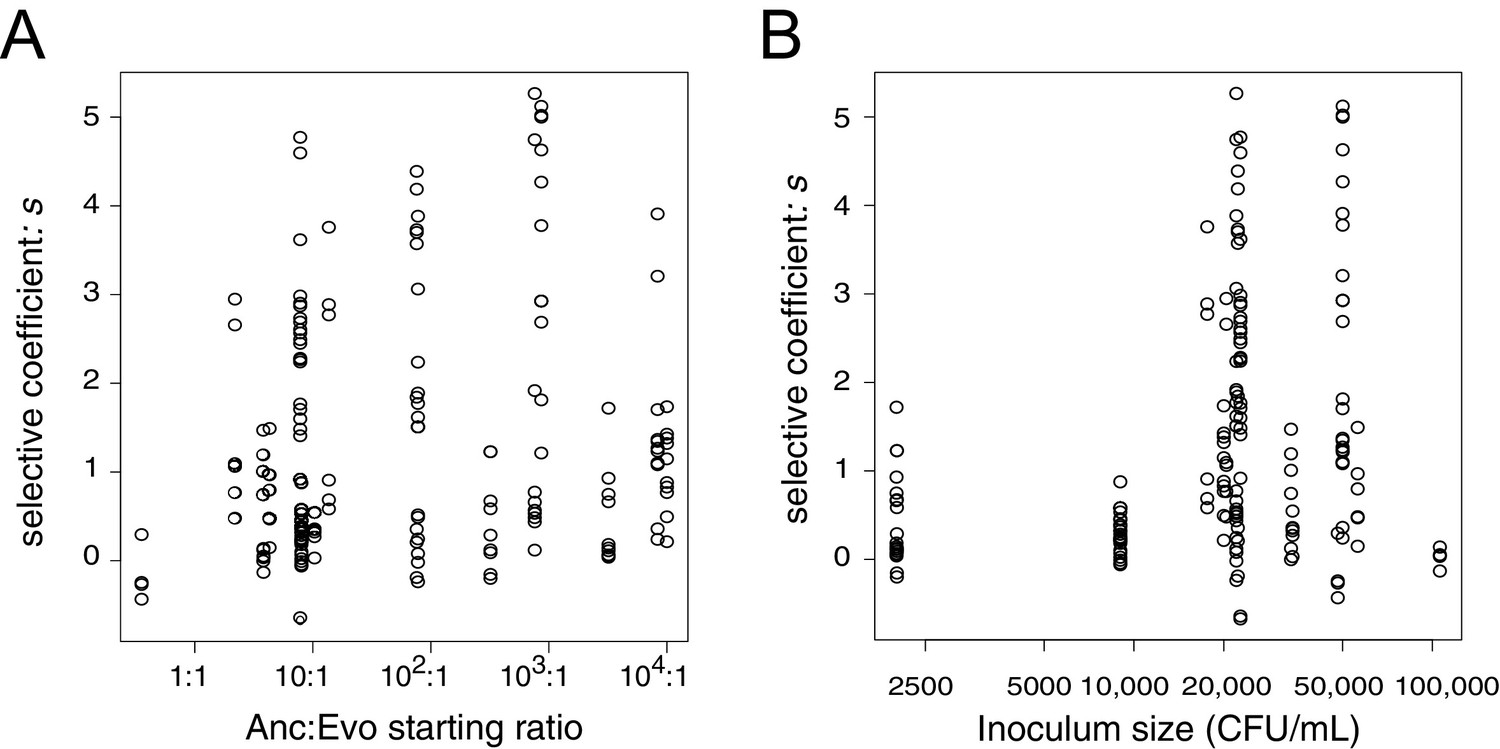
Estimates of the selective advantage of the binK1 allele during squid colonization across a range of starting frequencies and inoculum densities.
Comparison of selection coefficients conferred by binK1 in strain MJ11EP2-4-1 (‘Evo’) (harboring no other mutations) relative to binK+ (‘Anc’) from co-inoculated squid light organs. Each point represents the selective advantage of each strain measured from the strain ratios recovered in an individual hatchling. The estimated selective advantage conferred by the evolved binK1 allele was not influenced by starting frequency (A) (R2 = 0.025, pfrequency = 0.62), but it was marginally influenced by density (B) (R2 = 0.025, pdensity = 0.03), based on a multiple regression analysis.
Figure 5 with 3 supplements
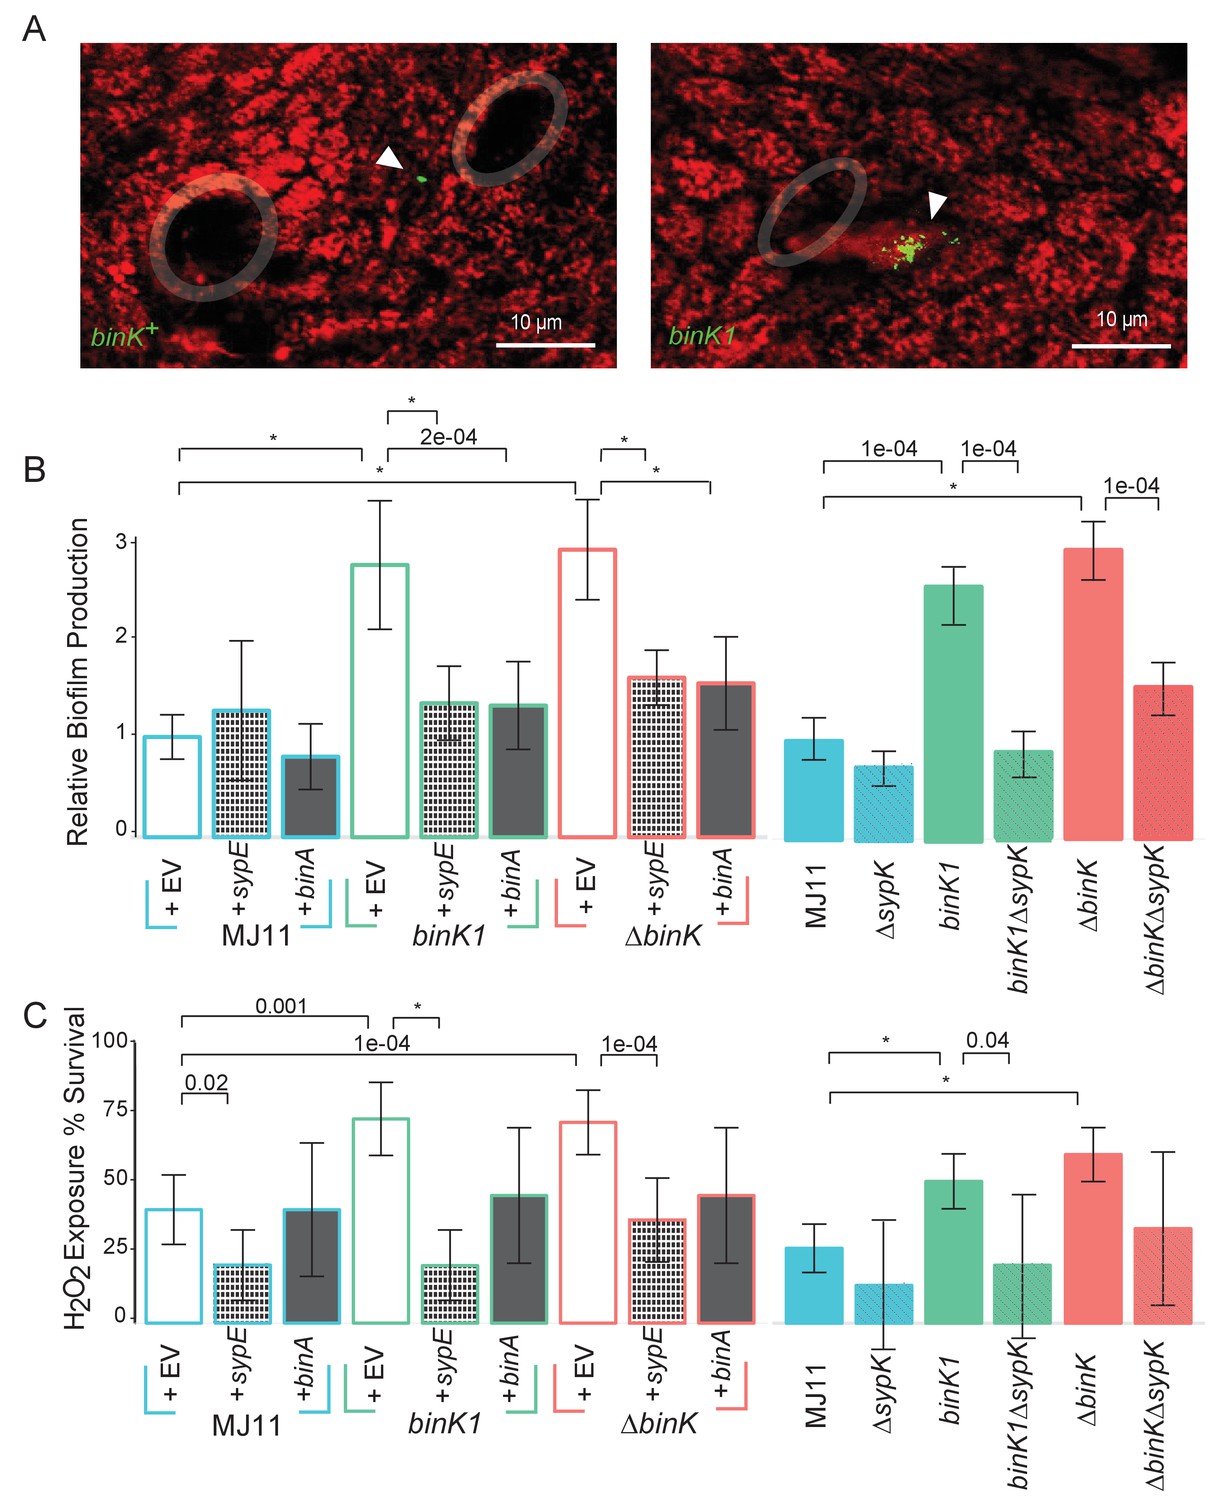
Host-adapted binK1 improved initiation phenotypes through enhanced biofilm.
(A) V. fischeri MJ11 aggregate formation near light-organ ducts. Host tissue stained with CellTracker Orange. Symbionts carry GFP plasmids (pKV111) (Nyholm et al., 2000). Micrographs show representative V. fischeri aggregates following the dissection of 30 newly hatched animals incubated with each strain. Aggregates were visualized between 2 and 3hr after of inoculation using a Zeiss LSM 510 Meta laser-scanning confocal microscope. Please refer to Figure 5—figure supplement 1 for additional views of aggregate formation. (B) Biofilm production (crystal violet staining relative to MJ11) by wild-type MJ11(binK+), squid-adaptive binK1 and ∆binK variants in the presence of either empty vector (EV, pVSV105) (white fill), Syp biofilm repressor sypE (pCLD48) (hatched fill), or cellulose repressor binA (pRF2A3) (gray fill). n = 12–16 biological replicates. See Figure 5—figure supplement 2 for evidence of increased cellulose in binK variants, and Figure 5—figure supplement 3 for biofilm repressor schematic. Followed by influence of a sypK deletion on biofilm production of MJ11 and binK variants. n = 10 biological replicates. (C) Binomial mean of survival following exposure to hydrogen peroxide of wild-type MJ11(binK+), squid-adaptive binK1 and ∆binK variants in the presence of either empty vector (EV, pVSV105) (white fill), sypE (pCLD48) (hatched fill), or binA (pRF2A3) (gray fill). n = 20–50 biological replicates. Followed by influence of a sypK deletion (diagonal line overlay) on population survival of MJ11 and binK variants (color fill). n = 15–106 biological replicates. Error bars 95% CI. Significant p values (p<0.05) are indicated above each comparison. *p<2.2e-16. Although the effects of overexpression of binA and deletion of sypK on oxidative resistance in the ∆binK variant followed the same trends as these genes in binK1, the reductions were only marginally significant (p=0.051 and 0.15, respectively). Please refer to Figure 5—figure supplement 2 for transcriptomic evidence of reduced expression of two cellulose loci in the ∆binK mutant. A schematic of the impact of the BinA and SypE repressors on biofilm substrates is available as Figure 5—figure supplement 3.
Figure 5—figure supplement 1
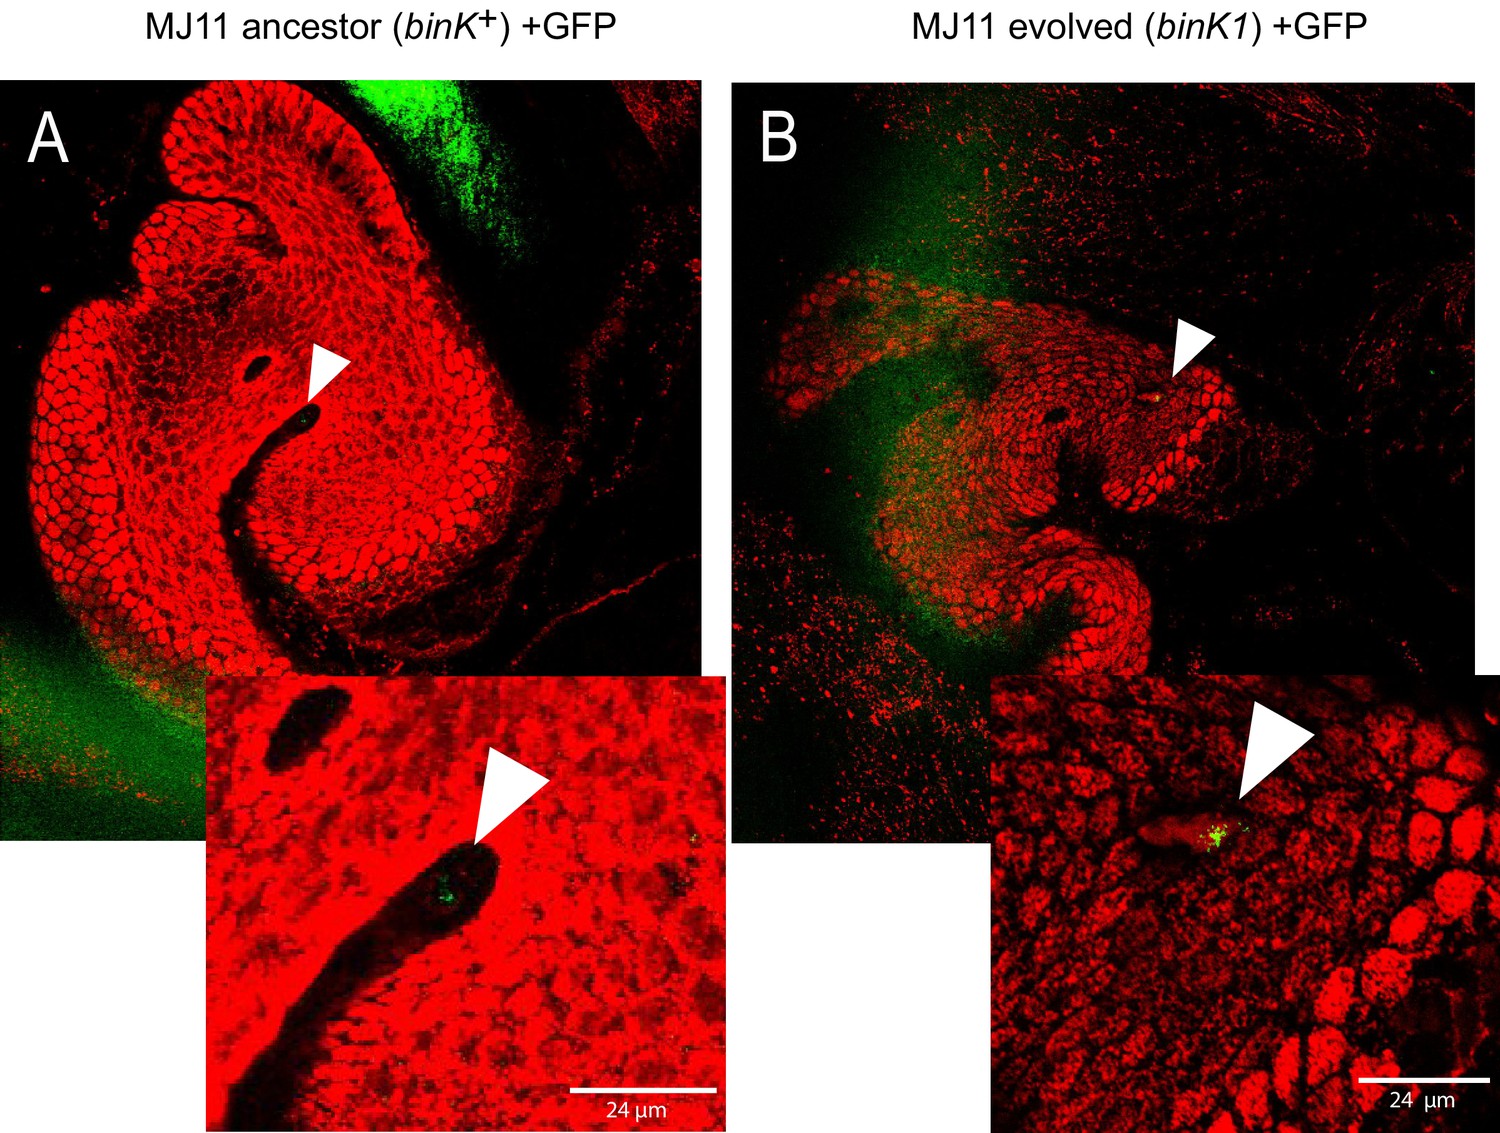
In vivo aggregation behavioral changes conferred by evolved binK1 variant.
(A–B) Aggregation of ancestral (A) and evolved (B) MJ11 on host mucosal epithelium prior to colonization. Host tissue stained with CellTracker Orange. Symbionts carry GFP plasmids (pKV111) (Nyholm et al., 2000). Micrographs show representative V. fischeri aggregates following the dissection of 30 newly hatched animals incubated with each strain. Aggregates were visualized between 2 and 3 hr after inoculation using a Zeiss LSM 510 Meta laser scanning confocal microscope. Scale bars: 24 μm.
Figure 5—figure supplement 2
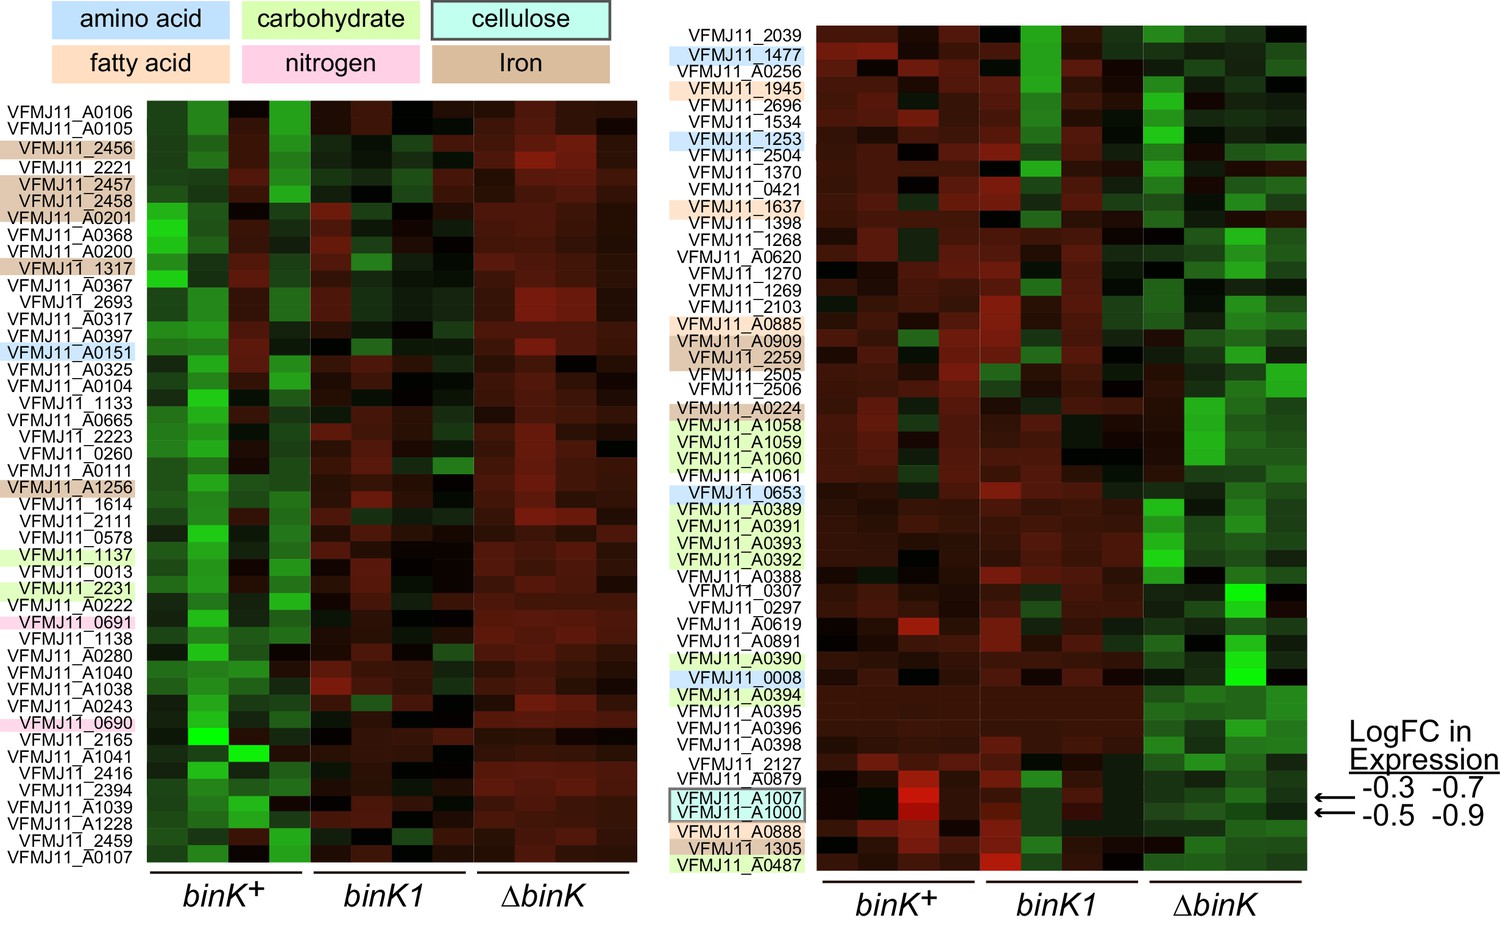
Transcriptional shifts associated with binK variants.
Transcriptomic differences between wild-type MJ11 (binK+), squid-adapted MJ11 binK1, and MJ11 ∆binK for the coding loci in the MJ11 genome as determined by RNA-Seq. Variants were sampled during early log growth (OD600 ~0.25) in rich media (SWTO) prior to detectable biofilm production from four biological replicates for each strain. Green indicates increased expression; red indicates reduced expression relative to mean expression per locus (i.e., read counts z-scaled relative to mean logCPM). The heat map only displays loci for which mean expression in a binK variant differed from that in MJ11 at a FDR significance threshold of 0.05 (Table 3). The colored labels refer to compounds whose metabolism, transport, or synthesis are affected by the expression of these genes. Genes involved in cellulose synthesis are indicated with arrows (VFMJ11_A1000- cellulose synthase operon C protein, and VFMJ11_A1007- cellulose synthase operon protein YhjU) and log fold change (logFC) relative to wild-type is indicated for binK1 and then ∆binK.
Figure 5—figure supplement 3
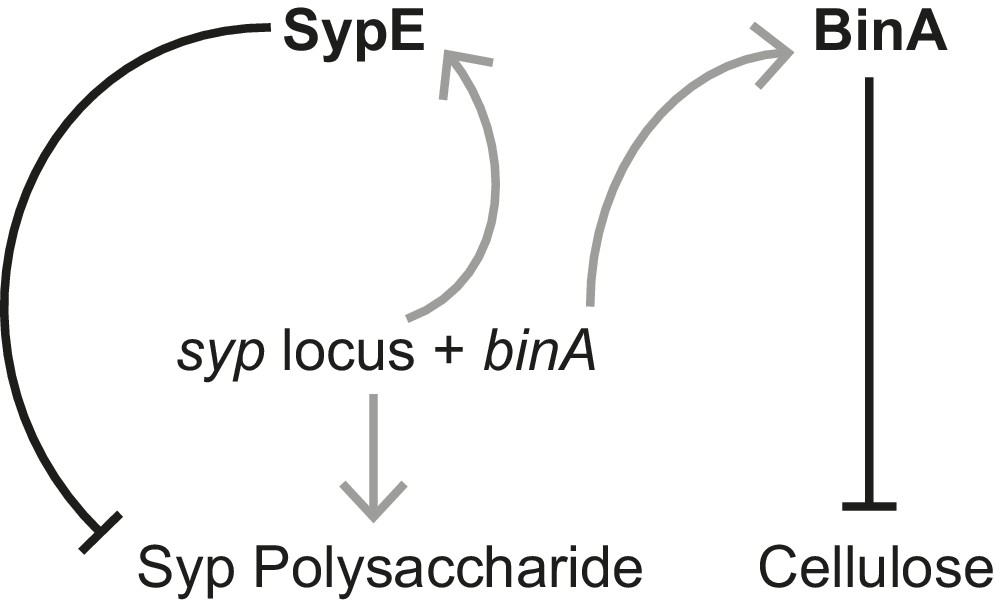
Schematic of regulation by the biofilm repressors SypE and BinA.
SypE represses Syp biofilm production post transcriptionally (Morris and Visick, 2013). BinA represses cellulose, but not Syp, biofilm formation by increasing phosphodiesterase activity (Bassis and Visick, 2010). Black-capped lines indicate negative regulation. Gray arrows indicate transcription/translation. Note that because binA is expressed from a syp locus promoter, activation of the syp locus leading to Syp production also leads to repression of cellulose.
Figure 6 with 1 supplement
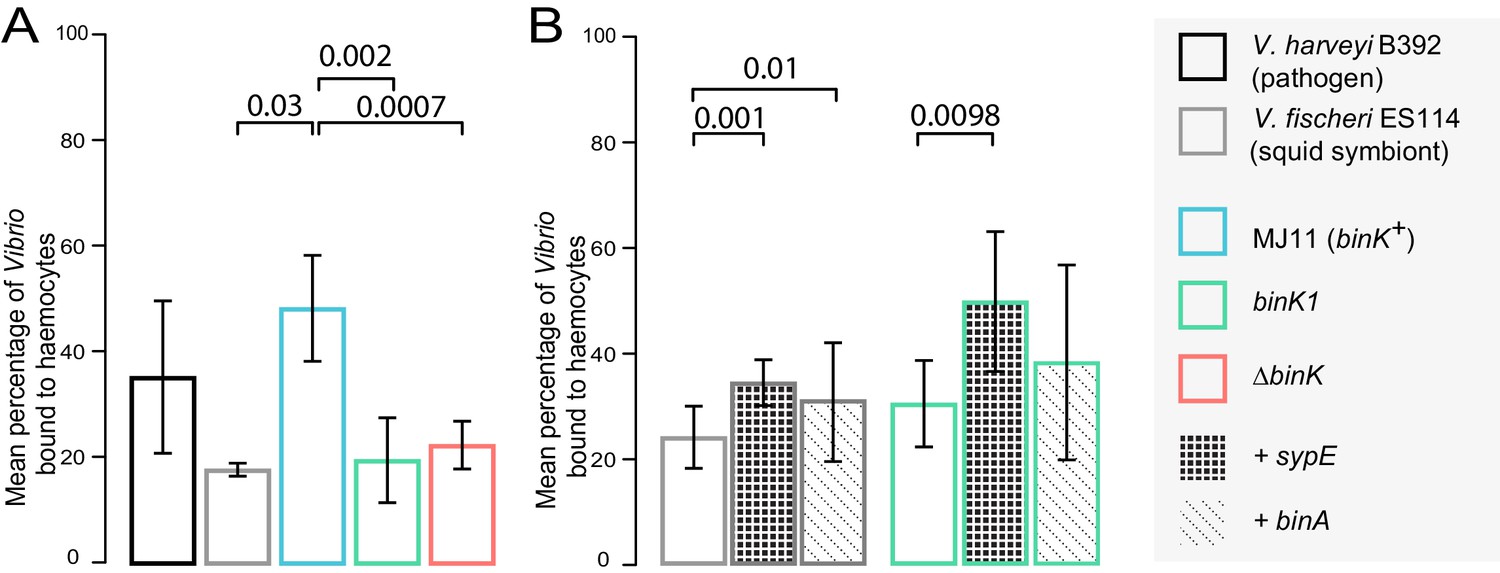
Biofilm production by squid-adaptive binK1 variants mediates hemocyte evasion.
(A) Relative efficiency of squid hemocyte binding of GFP-labelled V. fischeri strains including: squid-native symbiont ES114, binK+ MJ11, ∆binK MJ11 (RF1A4), binK1 MJ11, and shellfish pathogen V. harveyi B392. (B) Relative efficiency of squid hemocyte binding of squid-native symbiont ES114 and squid-adapted bink1 MJ11 carrying the empty vector (pVSV104), sypE (pRF2A1) or binA (pRF2A4). N = 30–52 hemocytes quantified per strain. Error bars: 95% CI. Significant p-values (p<0.05) are indicated above each comparison. Please refer to Figure 6—figure supplement 1 for micrographs of Vibrio–hemocyte interactions.
Figure 6—figure supplement 1
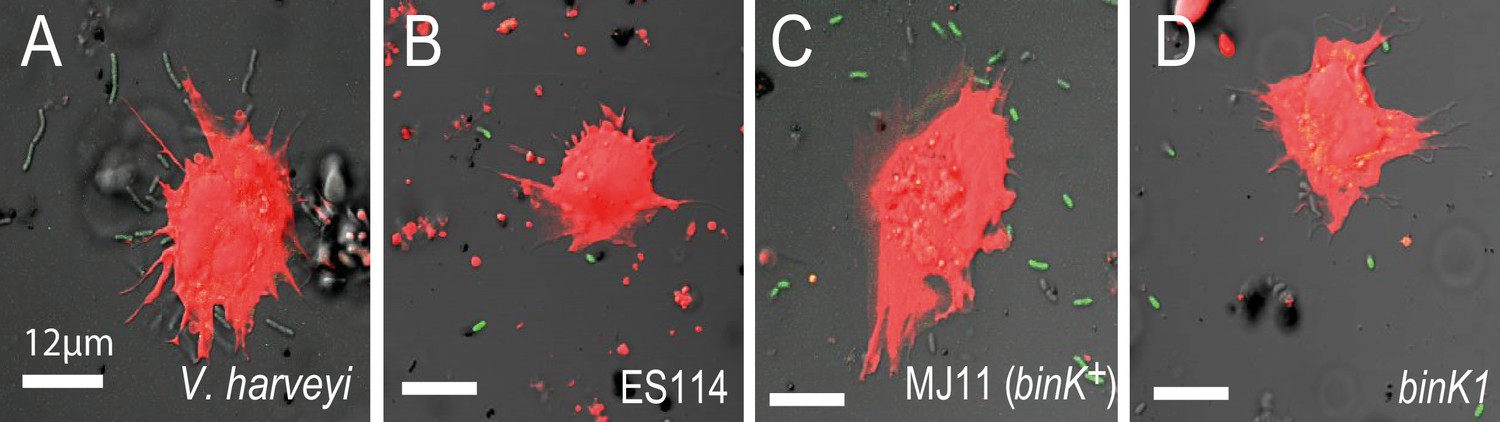
In vitro response of squid hemocytes to wild, squid-evolved and mutant Vibrio.
The micrographs show examples of hemocyte-bound non-symbiotic (A: Vibrio harveyi), squid-symbiotic (B: V. fischeri ES114), squid-naive (C: V. fischeri MJ11 binK+) and squid-adapted (D: MJ11 binK1) cells. The mean number of GFP-labelled Vibrio cells bound by hemocytes was quantified relative to total bacterial count in a 60 µm radius using confocal microscopy at 63X magnification, following one hour of bacterial exposure. Squid hemocytes in red (CellTracker Orange), Vibrio in green (GFP). Scale bars: 12 μm.
Figure 7
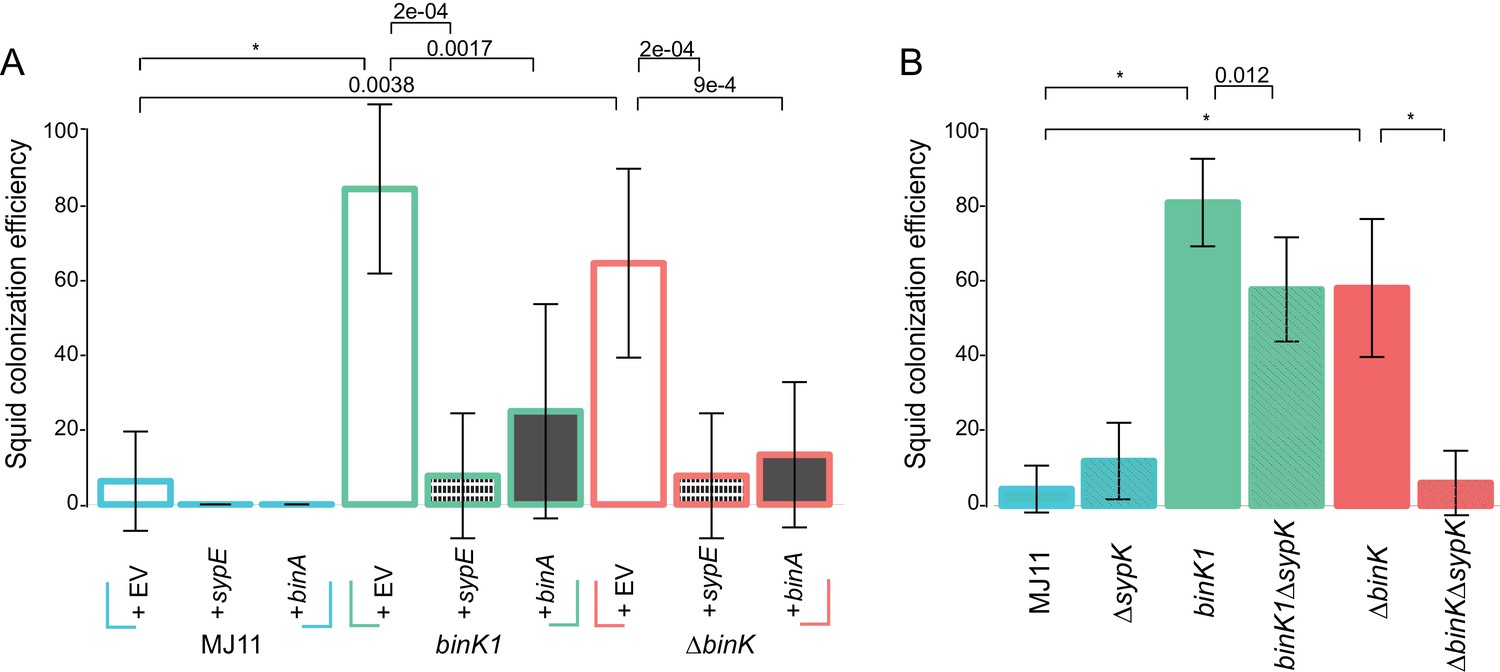
Contribution of Syp and cellulose to improved squid colonization by binK variants.
(A) Colonization efficiency (% colonized squid at 24 hr) by wild-type MJ11 (binK+), squid-adaptive binK1 and ∆binK variants in the presence of empty vector (EV, pVSV105) (white fill), the Syp repressor sypE (pCLD48) (hatched fill), or the cellulose repressor binA (pRF2A3) (gray fill). n = 15–20 biological replicates. (B) Influence of a sypK deletion on colonization efficiency of MJ11 and binK variants. n = 31–52 biological replicates. Error bars: 95% CI. Significant p-values (p<0.05) are indicated above each comparison. *p<2.2e-16.
Figure 8
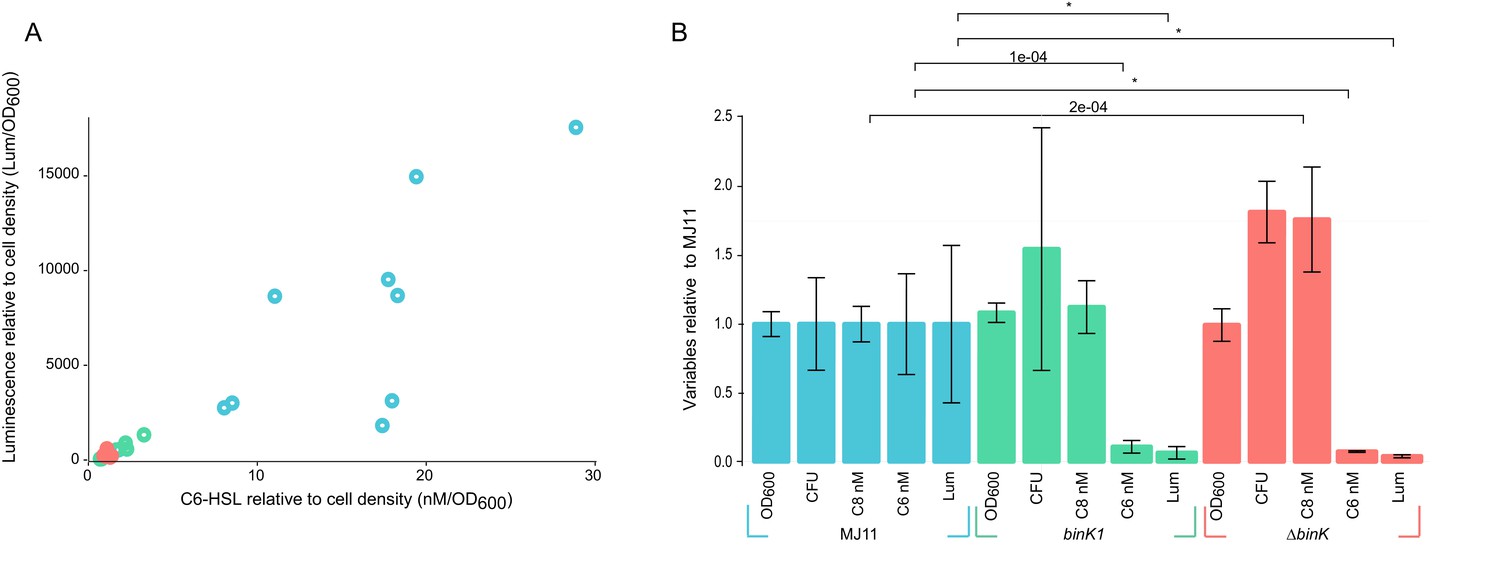
Host-adapted binK1 attenuates quorum-sensing regulation of luminescence.
(A) Supernatant concentrations (nM/OD600) of N-(3-oxohexanoyl) homoserine lactone (C6-HSL), as quantified against synthetic standards (Schaefer et al., 2000; Pearson et al., 1994; Duerkop et al., 2007) and corresponding luminescence (Lum/OD600) of 10 independent cultures each for wild-type MJ11, binK1 and ΔbinK derivatives during quorum-sensing induction of luminescence determined from cultures grown to early log (Average OD600 1.1, range 0.9–1.4,). (B) Average cell density as measured by absorbance (OD600), colony-forming units (CFU)/mL/OD600, N-(3-oxohexanoyl) homoserine lactone (C6) nM concentration, N-octanoyl homoserine lactone (C8) nM concentration, and luminescence (Lum)/1 mL culture for ten biological replicates of each variant relative to wild-type MJ11. Error bars: 95% CI. Significant p-values (p<0.05) are indicated above each comparison. *p<2.2e-16.
Figure 9
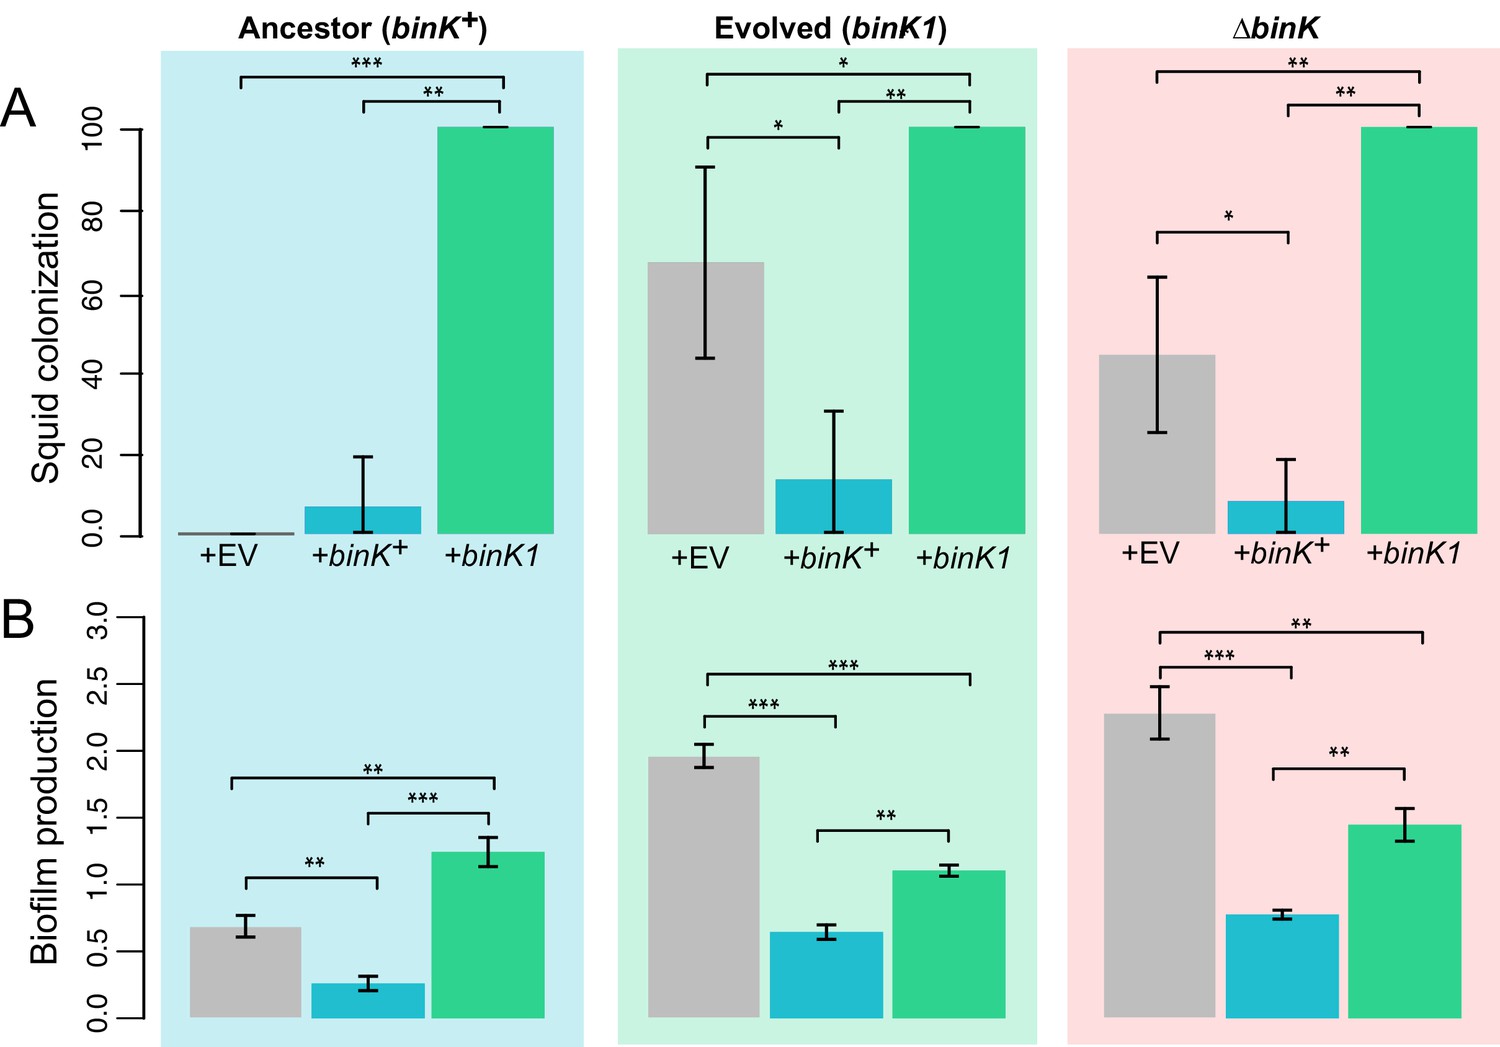
Effect of binK on squid colonization and biofilm production.
(A) Improvement in colonization by multi-copy in trans expression of the evolved binK1 allele and decreased colonization by expression of the ancestral binK+ allele. Colonization assessed by percentage of squid that are luminous after 24 hr. Error bars: 95% CI. N = 15–25. (B) Increased biofilm production resulting from in trans expression of the binK1 allele, and decreased biofilm production resulting from expression of the ancestral binK+. Comparisons of biofilm production in control-plasmids (pVSV105= EV) with that in multi-copy plasmids carrying binK suggest an inhibitory role for BinK in biofilm production, presumably alleviated by the dominance of the binK1 allele. Biofilm production was quantified by absorbance of crystal violet at A550. Background color depicts strain background in which multicopy plasmid effects were measured, mirroring those used throughout where blue is wild-type MJ11, green is the evolved binK1 variant and salmon is the ∆binK derivative. Error bars: 95% CI; non-overlap indicates significance. N = 7–8. Significant p-values (p<0.05) are indicated above each comparison. *p<0.05, **p<0.005, ***p<0.005.
Figure 10
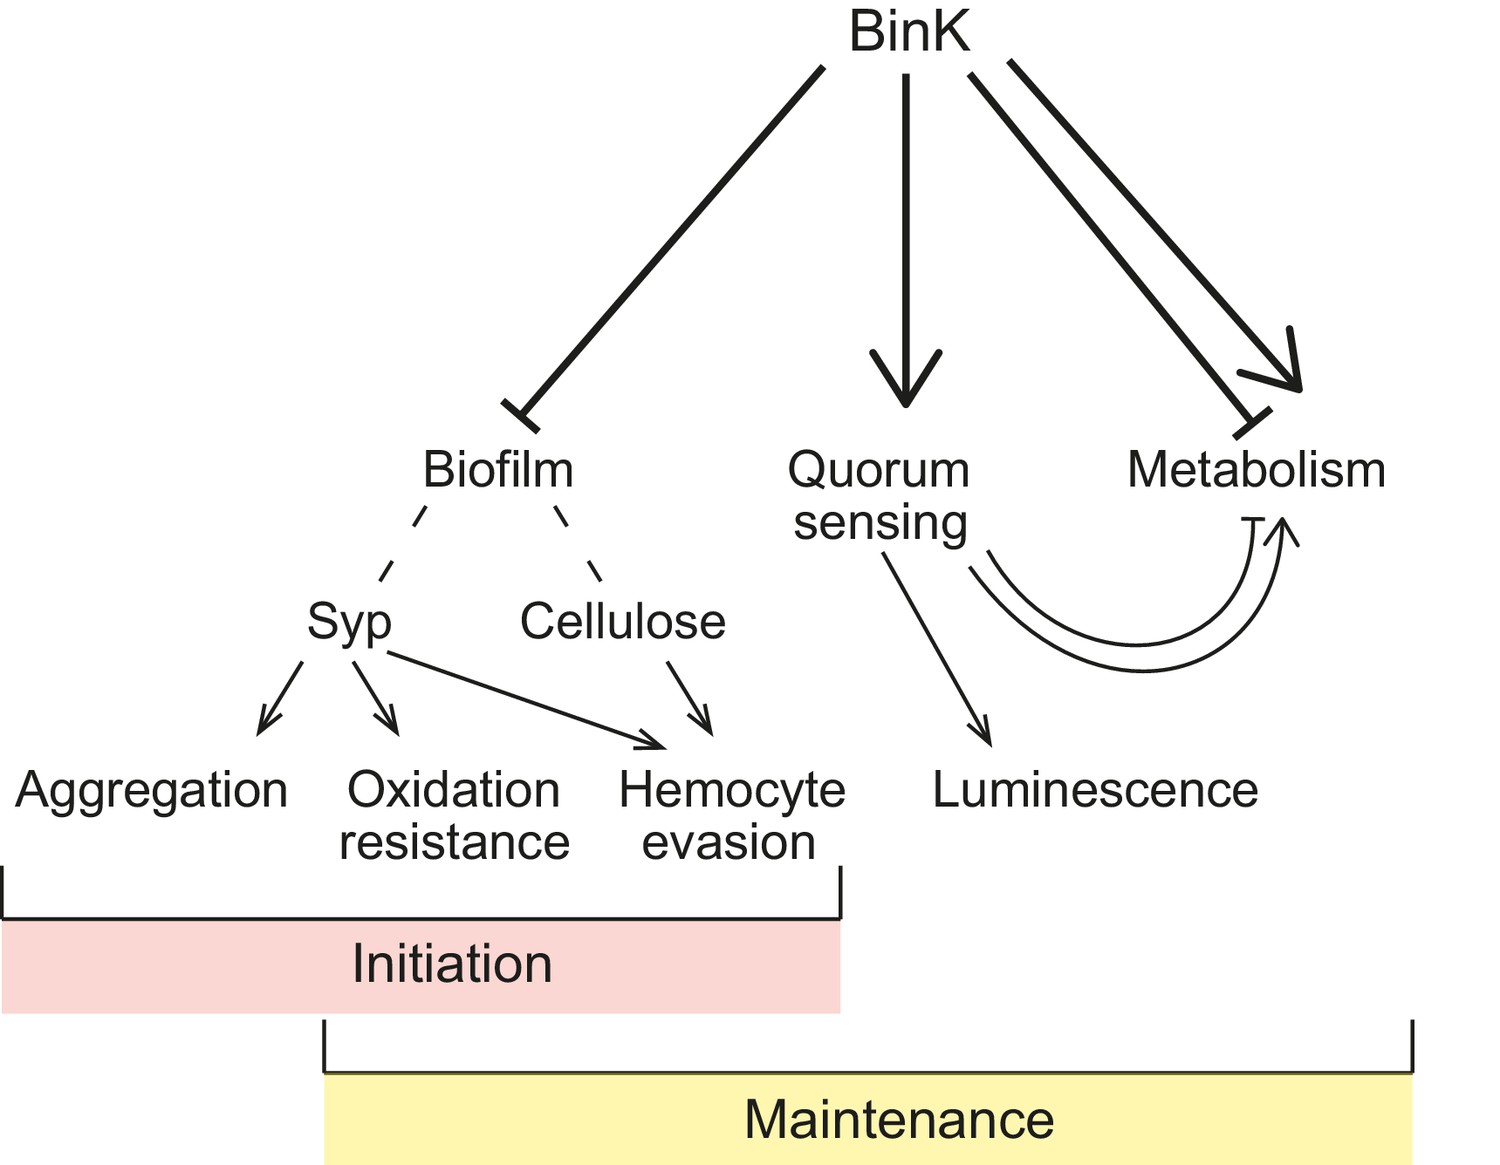
Model of BinK regulation of traits adaptive during squid symbiosis.
Arrows originating from BinK point to characteristics that are activated or enhanced, and blocked lines point to those that are repressed or blocked by BinK. Hashed lines point to polysaccharides that contribute to biofilm.
Appendix 1—figure 1
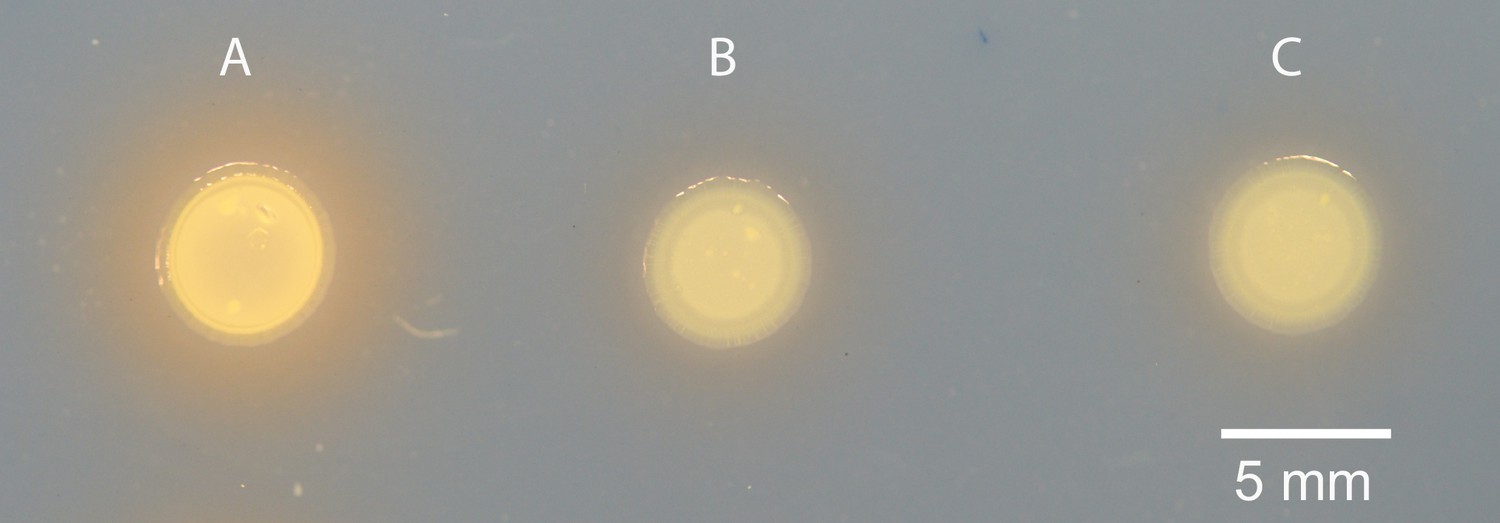
Siderophore production in MJ11 and binK variants.
(A) Squid-native ES114, (B) squid-naïve MJ11 binK+ and (c) squid-evolved binK1 plated on CAS agar.
Appendix 2—figure 1
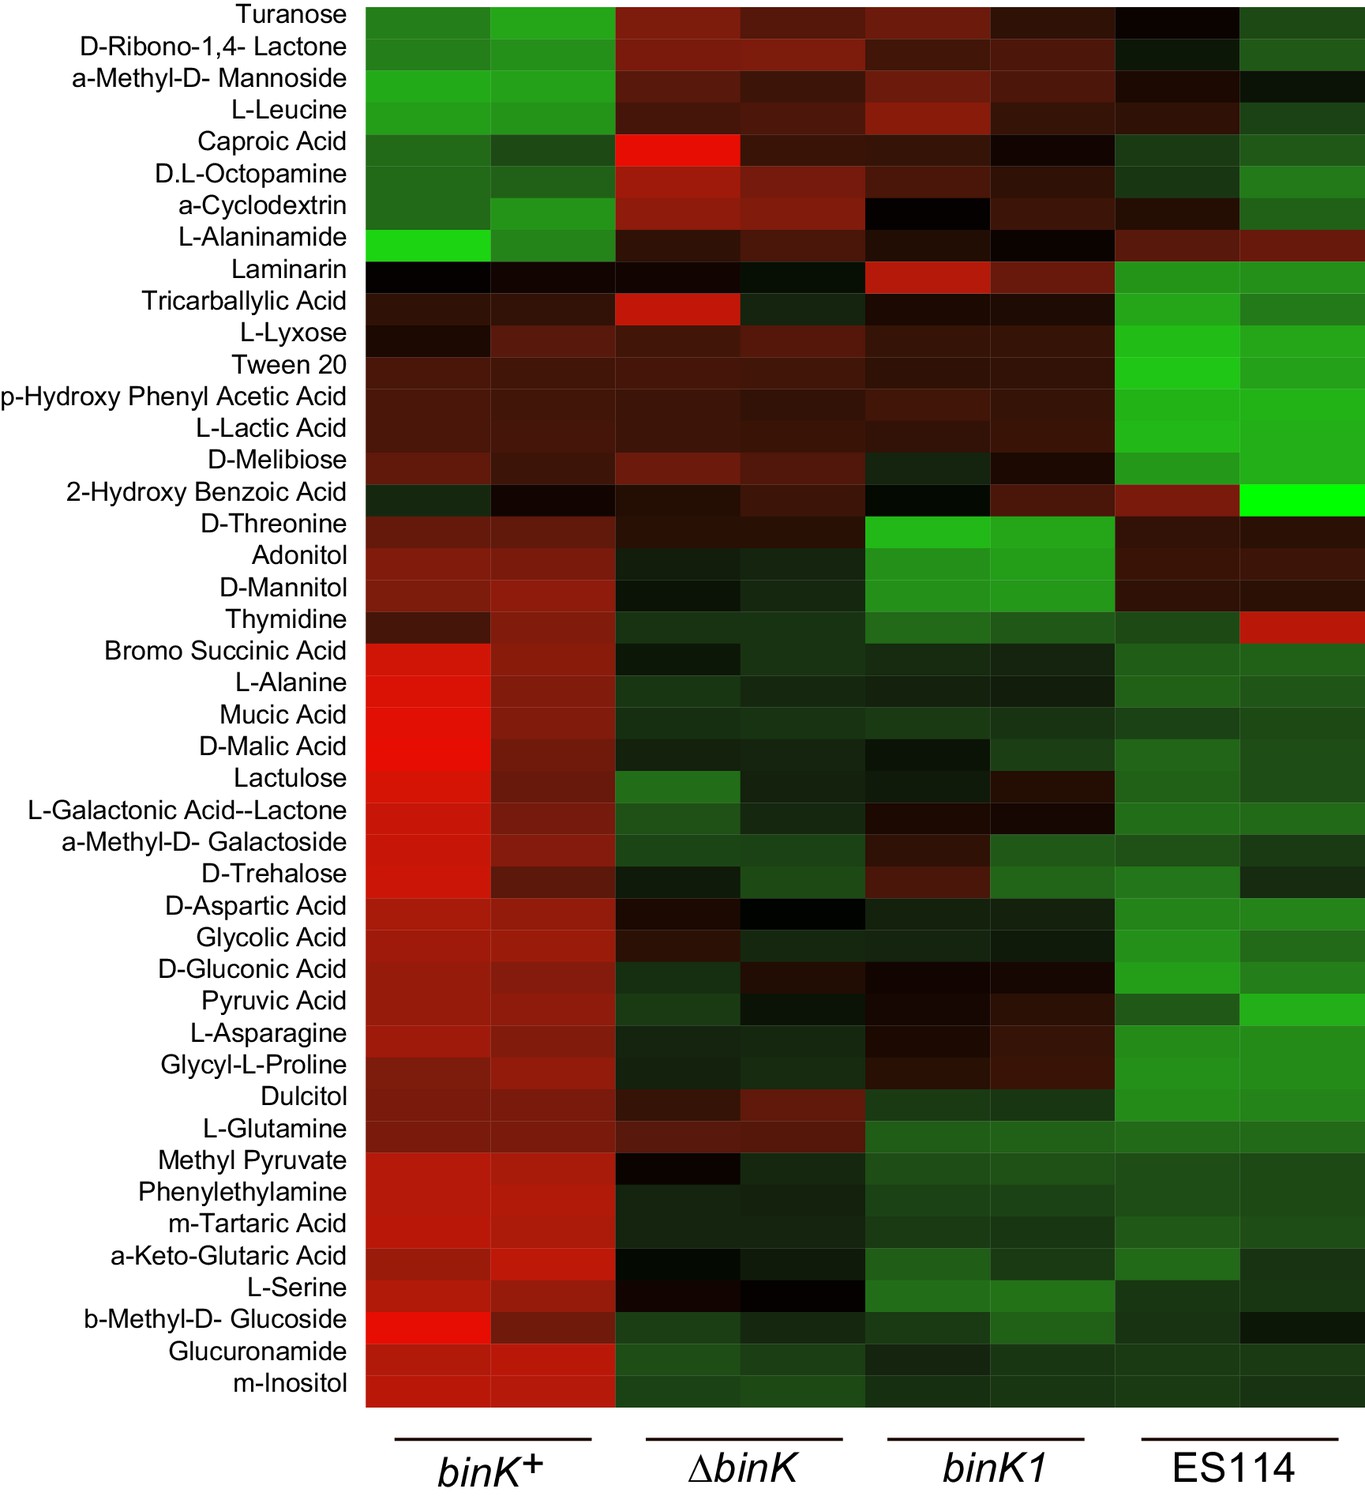
Metabolic shifts associated with binK variants.
Significantly differing metabolic responses to BIOLOG compounds for wild-type MJ11 (binK+), squid-adapted MJ11 binK1, MJ11 ∆binK and squid-native ES114. Responses to all tested compounds are reported in the Figure Supplement.
Appendix 2—figure 2
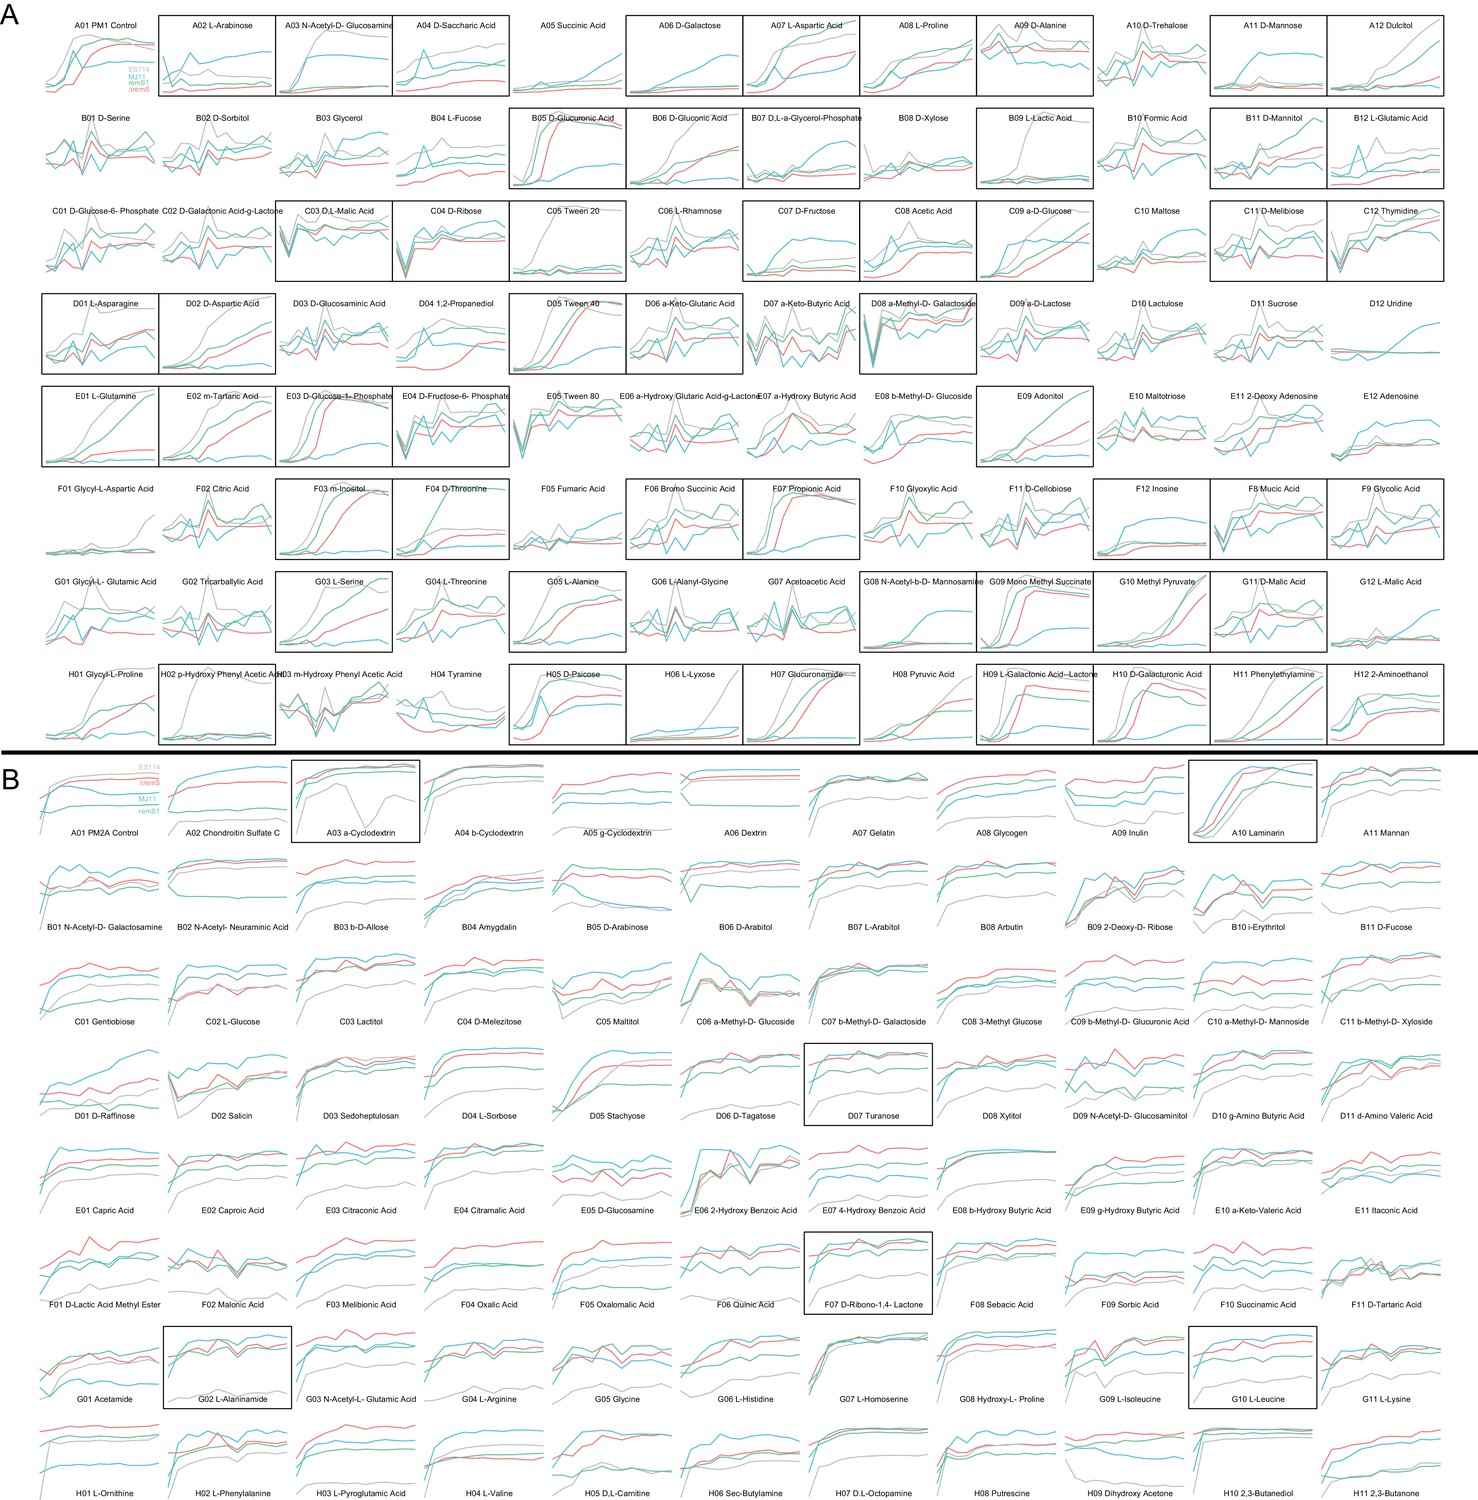
Metabolic profiles using BIOLOG phenotyping assays.
Plots enclosed by boxes indicate substrates that are significantly differentially metabolized across strains (listed in Table 2). X-axis represents time (0–48 hr); Y-axis represents metabolic activity as detected by BIOLOG redox (tetrazolium) dye absorbance (OD490).
Tables
Table 1
Strains and plasmids used in this study.
| Strain name | Description* | Reference/source |
|---|---|---|
| Vibrio fischeri strains† | ||
| ES114 | Isolated from Euprymna scolopes | (Boettcher and Ruby, 1990) |
| MJ11 | Isolated from Monocentris japonica light-organ | (Haygood et al., 1984) |
| EM17 | Isolated from Euprymna morseii light-organ | (Ruby and Lee, 1998) |
| H905 | Isolated from Hawaiian plankton | (Lee and Ruby, 1992) |
| WH1 | Isolated from Massachusetts plankton | (Lee, 1994) |
| RF1A4 | MJ11 ∆binK::ermB; EmR | This study |
| RF1A5 | MJ11 ∆sypK::aphA1; KmR | This study |
| RF1A6 | MJ11 ∆binK::ermB ∆sypK::aphA1; EmR KmR | This study |
| RF1A7 | MJ11 binK1 ∆sypK::aphA1; KmR | This study |
| MJ11EP2-3-2 | MJ11 binK4 | This study |
| MJ11EP2-3-3 | MJ11 binK4 | This study |
| MJ11EP2-3-4 | MJ11 binK4 | This study |
| MJ11EP2-3-5 | MJ11 binK4 | This study |
| MJ11EP2-3-6 | MJ11 binK4 | This study |
| MJ11EP2-3-7 | MJ11 binK4 | This study |
| MJ11EP2-3-8 | MJ11 binK4 | This study |
| MJ11EP15-3-1 | MJ11 binK4 | This study |
| MJ11EP15-3-3 | MJ11 binK4 | This study |
| MJ11EP15-3-4 | MJ11 binK4 | This study |
| MJ11EP15-3-7 | MJ11 binK4 | This study |
| MJ11EP15-3-8 | MJ11 binK4 | This study |
| MJ11EP2-4-1 | MJ11 binK1 | This study |
| MJ11EP2-4-3 | MJ11 binK1 | This study |
| MJ11EP2-4-4 | MJ11 binK1 | This study |
| MJ11EP2-4-5 | MJ11 binK1 | This study |
| MJ11EP2-4-6 | MJ11 binK1 | This study |
| MJ11EP15-4-1 | MJ11 binK1 tadC1G593T | (Schuster et al., 2010) |
| MJ11EP15-4-6 | MJ11 binK1 | This study |
| MJ11EP15-4-7 | MJ11 binK1 | This study |
| MJ11EP15-4-8 | MJ11 binK1 | This study |
| MJ11EP2-5-2 | MJ11 binK3 | This study |
| MJ11EP2-5-3 | MJ11 binK3 | This study |
| MJ11EP2-5-4 | MJ11 binK3 | This study |
| MJ11EP2-5-5 | MJ11 binK3 | This study |
| MJ11EP2-5-6 | MJ11 binK3 | This study |
| MJ11EP15-5-2 | MJ11 binK4 | This study |
| MJ11EP15-5-3 | MJ11 binK3 | This study |
| MJ11EP15-5-4 | MJ11 binK3 | This study |
| MJ11EP15-5-5 | MJ11 binK3 | This study |
| MJ11EP2-6-1 | MJ11 binK2 | This study |
| MJ11EP15-6-1 | MJ11 binK2 | (Schuster et al., 2010) |
| MJ11EP15-6-2 | MJ11 binK2 | This study |
| MJ11EP15-6-3 | MJ11 binK2 | This study |
| MJ11EP15-6-4 | MJ11 binK2 | This study |
| MJ11EP15-6-5 | MJ11 binK2 | This study |
| MJ11CE4-1 | MJ11 fliAG80D | This study |
| MJ11CE5-1 | MJ11 fliP∆476 | This study |
| Strain name | Description* | Reference/source |
| Escherichia coli strains | ||
| DH5α | F− recA1 endA1 hsdR17 supE44 thi-1 gyrA96 relA1Δ (argF-lacZYA) U169φ 80lacZΔM15λ − | Gibco-BRL |
| DH5αλpir | supE44 ΔlacU169 (ϕlacZΔM15) recA1 endA1 hsdR17 thi-1 gyrA96 relA1; λpir phage lysogen | (Kolter and Helinski, 1978) |
| CC118λpir | Δ(arg-leu) araD ΔlacX74 galE galK phoA20 thi-1 rpsE rpoB argE(Am) recA1, lysogenized with λ pir dam dcm | (Martín-Mora et al., 2016) |
| NEB 10-beta | Δ(ara-leu)7697 araD139 fhuA ΔlacX74 galK16 galE15 e14- Φ80dlacZΔM15 recA1 relA1 endA1 nupG rpsL (SmR) rph spoT1 Δ(mrr-hsdRMS-mcrBC) | New England Biolabs, Ipswich, MA |
| TOP10 | F- mcrA Δ(mrr-hsdRMS-mcrBC) Φ80lacZΔM15 ΔlacX74 recA1 araD139 Δ(ara-leu)7697 galU galK rpsL (SmR) endA1 nupG | Invitrogen, Carlsbad, CA |
| Plasmids | ||
| pCR2.1-TOPO | Commercial cloning vector; ApR KmR | Invitrogen, Carlsbad, CA |
| pVSV105 | Mobilizable vector; ChR | (Dunn et al., 2006) |
| pRAD2E1 | pVSV105 carrying wild-type binK; ChR | This study |
| pRF2A2 | pVSV105 carrying binK1; ChR | This study |
| pCLD48 | pVSV105 carrying ES114 sypE; ChR | (Hussa et al., 2008) |
| pRF2A3 | pVSV105 carrying MJ11 binA; ChR | This study |
| pVSV104 | Mobilizable vector; KmR | (Stabb and Ruby, 2002) |
| pRF2A1 | pVSV104 carrying sypE; KmR | This study |
| pRF2A4 | pVSV104 carrying binA; KmR | This study |
| pKV111 | Mobilizable vector containing gfp; ChR | (Nyholm et al., 2000) |
| pRF2B7 | pCR2.1-TOPO containing MJ11 ∆sypK::aph1 SOE fragment; KmR | This study |
| pVSV103 | Mobilizable vector containing lacZ; KmR | (Dunn et al., 2006) |
| pCAW7B1 | pVSV103 containing lacZ∆147–1080 bp; KmR | This study |
-
*ApR, ampicillin resistance; ChR, chloramphenicol resistance; EmR, erythromycin resistance; KmR, kanamycin resistance;SmR streptomycin resistance.
-
†Experimentally evolved strains are designated ‘MJ11EP#-#-#’, where the first and second numbers after the ‘P’ designates the squid passage and population from which the strain was isolated, and the third number designates isolate number; strains derived from evolution in culture are designated ‘MJ11CE’.
Table 2
Summary of mutations detected following experimental evolution of V. fischeri using Illumina genome resequencing and targeted Sanger sequencing. For culture-evolved populations of V. fischeri MJ11, five isolates from each evolved population were combined to generate five metagenomes. For squid-evolved populations of MJ11, EM17, WH1 and H905, individual isolates were sequenced from lineages that ultimately survived 15 host passages. Isolates saved from early evolutionary time-points (host passage 2) are shown along with isolate genomes from the endpoint (host passage 15). Mean read depth and genome coverage for isolates analyzed with WGS are also provided.
| Ancestor | Evolved Passage (EP) | Population | Isolate† | Detected mutations‡ | Illumina sequencing statistics | ||||||
|---|---|---|---|---|---|---|---|---|---|---|---|
| binK (VFMJ11_A0397) | tadC1 (MJ11_0520); mutation (reads) | All other mutations detectected by WGS gene (locus); mutation (reads) | Reads | % Mapped to ancestor | Coverage | ||||||
| allele/mutation | Method (reads)§ | ChI | ChII | ||||||||
| MJ11 | 2 | 1 | 1 | binK3/S311L | WGS (35) | – | – | 3753352 | 99.5 | 135.2 | 118 |
| MJ11 | 2 | 1 | 3 | binK3/S311L | WGS (32) | – | – | 3717088 | 99.6 | 134.2 | 113.5 |
| MJ11 | 15 | 1 | 4 | binK3/S311L | WGS (17) | – | – | 1716144 | 99.5 | 46.8 | 42.5 |
| MJ11 | 2 | 3 | 3 | binK4/N292T | PCR/SS | n.d. | n.d. | ||||
| MJ11 | 2 | 3 | 4 | binK4/N292T | PCR/SS | n.d. | n.d. | ||||
| MJ11 | 2 | 3 | 5 | binK4/N292T | PCR/SS | n.d. | n.d. | ||||
| MJ11 | 2 | 3 | 6 | binK4/N292T | PCR/SS | n.d. | n.d. | ||||
| MJ11 | 2 | 3 | 7 | binK4/N292T | PCR/SS | n.d. | n.d. | ||||
| MJ11 | 2 | 3 | 8 | binK4/N292T | PCR/SS | n.d. | n.d. | ||||
| MJ11 | 15 | 3 | 1 | binK4/N292T | WGS (42) | – | – | 3031149 | 98.9 | 104.3 | 93.5 |
| MJ11 | 15 | 3 | 3 | binK4/N292T | WGS (63) | – | – | 3777714 | 99.4 | 114.6 | 105.2 |
| MJ11 | 15 | 3 | 4 | binK4/N292T | WGS (42) | – | – | 3420212 | 99.5 | 106.4 | 97.1 |
| MJ11 | 15 | 3 | 7 | binK4/N292T | WGS (41) | – | – | 3304891 | 99.5 | 90.3 | 82.5 |
| MJ11 | 15 | 3 | 8 | binK4/N292T | WGS (63) | – | – | 2948743 | 99.6 | 85.5 | 81.2 |
| MJ11 | 2 | 4 | 1 | binK1/R537C | WGS (62) | – | – | 2511256 | 99 | 84 | 78 |
| MJ11 | 2 | 4 | 3 | binK1/R537C | PCR/SS | n.d. | n.d. | ||||
| MJ11 | 2 | 4 | 4 | binK1/R537C | PCR/SS | n.d. | n.d. | ||||
| MJ11 | 2 | 4 | 5 | binK1/R537C | PCR/SS | n.d. | n.d. | ||||
| MJ11 | 2 | 4 | 6 | binK1/R537C | PCR/SS | n.d. | n.d. | ||||
| MJ11 | 2 | 4 | 7 | binK1/R537C | PCR | n.d. | n.d. | ||||
| MJ11 | 2 | 4 | 8 | binK1/R537C | PCR | n.d. | n.d. | ||||
| MJ11 | 2 | 4 | 9 | binK1/R537C | PCR | n.d. | n.d. | ||||
| MJ11 | 2 | 4 | 10 | binK1/R537C | PCR | n.d. | n.d. | ||||
| MJ11 | 2 | 4 | 11 | binK1/R537C | PCR | n.d. | n.d. | ||||
| MJ11 | 2 | 4 | 12 | binK1/R537C | PCR | n.d. | n.d. | ||||
| MJ11 | 2 | 4 | 13 | binK1/R537C | PCR | n.d. | n.d. | ||||
| MJ11 | 2 | 4 | 14 | binK1/R537C | PCR/SS | n.d. | n.d. | ||||
| MJ11 | 2 | 4 | 15 | binK1/R537C | PCR/SS | n.d. | n.d. | ||||
| MJ11 | 2 | 4 | 16 | binK1/R537C | PCR/SS | n.d. | n.d. | ||||
| MJ11 | 15 | 4 | 1 | binK1/R537C | WGS (131) | G198V (85) | – | 4126149 | 99.4 | 117.8 | 106.1 |
| MJ11 | 15 | 4 | 6 | binK1/R537C | WGS (61) | G198V (55) | – | 2266821 | 99.2 | 60.8 | 52.5 |
| MJ11 | 15 | 4 | 7 | binK1/R537C | WGS (89) | G198V (93) | – | 3074437 | 99.6 | 92 | 83.6 |
| MJ11 | 15 | 4 | 8 | binK1/R537C | WGS (47) | G198V (96) | – | 2902977 | 99.5 | 84 | 77.5 |
| MJ11 | 2 | 5 | 2 | binK3/S311L | WGS (26) | – | – | 3771048 | 99.6 | 132.4 | 123.7 |
| MJ11 | 2 | 5 | 3 | binK3/S311L | WGS (46) | – | – | 2595518 | 99.6 | 84.2 | 83.7 |
| MJ11 | 2 | 5 | 4 | binK3/S311L | WGS (20) | – | – | 1785713 | 99.5 | 60.6 | 57.2 |
| MJ11 | 2 | 5 | 5 | binK3/S311L | WGS (62) | – | – | 3641346 | 99.6 | 117.4 | 113.1 |
| MJ11 | 2 | 5 | 6 | binK3/S311L | WGS (81) | – | – | 4128751 | 99.6 | 141.1 | 134.8 |
| MJ11 | 15 | 5 | 2 | binK4/N292T | WGS (89) | – | – | 4430823 | 99.1 | 152.3 | 138.4 |
| MJ11 | 15 | 5 | 3 | binK3/S311L | WGS (10) | – | – | 3248580 | 99.3 | 88 | 81.1 |
| MJ11 | 15 | 5 | 4 | binK3/S311L | WGS (59) | – | – | 3609382 | 99.5 | 106.8 | 97.1 |
| MJ11 | 15 | 5 | 5 | binK3/S311L | WGS (28) | – | – | 2915570 | 99.5 | 87.4 | 82.6 |
| MJ11 | 2 | 6 | 1 | binK2/K482N | WGS (104) | – | – | 4748569 | 99.1 | 164.6 | 147 |
| MJ11 | 2 | 6 | 2 | binK2/K482N | PCR/SS | n.d. | n.d. | ||||
| MJ11 | 15 | 6 | 1 | binK2/K482N | WGS (75) | – | – | 2764910 | 99.4 | 83.2 | 75.5 |
| MJ11 | 15 | 6 | 2 | binK2/K482N | WGS (63) | – | – | 3240968 | 99.2 | 88 | 72.6 |
| MJ11 | 15 | 6 | 3 | binK2/K482N | WGS (93) | – | – | 3814367 | 99.5 | 108.1 | 101.7 |
| MJ11 | 15 | 6 | 4 | binK2/K482N | WGS (108) | – | – | 3714638 | 99.5 | 121.4 | 85.7 |
| MJ11 | 15 | 6 | 5 | binK2/K482N | WGS (90) | – | – | 3006362 | 99.4 | 85.5 | 72 |
| MJ11 | 15 | Culture1 | mg | – | – | – | 10319291 | 98 | 272.8 | 237.8 | |
| MJ11 | 15 | Culture3 | mg | – | – | – | 7496847 | 98.2 | 196.7 | 195 | |
| MJ11 | 15 | Culture4 | mg | – | – | fliA (VF_1834); G80D (63) | 2894160 | 98.3 | 76.6 | 67.4 | |
| MJ11 | 15 | Culture5 | mg | – | – | fliP (VF_1842); ∆1 @ 476/870nt (110) | 5571439 | 97.9 | 148.5 | 132.1 | |
| MJ11 | 15 | Culture2 | mg | – | – | – | 5411032 | 98 | 144.2 | 129.4 | |
| WH1 | 15 | 4 | 1 | – | – | – | 7273244 | 98.6 | 257.8 | 251.1 | |
| WH1 | 15 | 4 | 2 | – | – | – | 2144381 | 99.6 | 61.4 | 65.1 | |
| WH1 | 15 | 4 | 3 | – | – | – | 2260232 | 99.6 | 62.1 | 66.6 | |
| WH1 | 15 | 4 | 4 | – | – | – | 2341428 | 99.7 | 61.6 | 65 | |
| WH1 | 15 | 5 | 1 | – | – | NADH oxidase (VF_A0027); A402T (62) | 1732106 | 99.5 | 60.8 | 64.7 | |
| WH1 | 15 | 5 | 2 | – | – | NADH oxidase (VF_A0027); A402T (61) | 1737095 | 99.4 | 61.9 | 64.9 | |
| WH1 | 15 | 5 | 3 | – | – | NADH oxidase (VF_A0027); A402T (80) | 2194847 | 96 | 60.8 | 63.4 | |
| WH1 | 15 | 5 | 4 | – | – | – | 2191986 | 99.8 | 61.9 | 64.9 | |
| WH1 | 15 | 6 | 1 | – | – | – | 9256547 | 99.3 | 212.6 | 220.3 | |
| WH1 | 15 | 6 | 2 | – | – | – | 2131144 | 99.6 | 62 | 64.7 | |
| WH1 | 15 | 6 | 3 | – | – | – | 1908857 | 99.5 | 62.4 | 60.5 | |
| EM17 | 15 | 6 | 2 | – | – | – | 2611609 | 99.6 | 93.3 | 89.3 | |
| EM17 | 15 | 7 | 1 | – | – | – | 6690137 | 98.6 | 225.8 | 227.1 | |
| EM17 | 15 | 7 | 4 | – | – | – | 2977429 | 99.5 | 83.4 | 82.1 | |
| EM17 | 15 | 7 | 5 | – | – | icmF (VF_0992);S171N, (72) | 2414288 | 99.5 | 71.6 | 71.5 | |
| EM17 | 15 | 8 | 1 | – | – | – | 3177981 | 99.5 | 97.5 | 94.6 | |
| EM17 | 15 | 8 | 2 | – | – | – | 3138175 | 99.5 | 92.4 | 92.3 | |
| EM17 | 15 | 8 | 3 | – | – | – | 2810099 | 99.5 | 81.2 | 80 | |
| EM17 | 15 | 8 | 5 | – | – | – | 5230411 | 99.6 | 144.9 | 143.2 | |
| EM17 | 15 | 9 | 1 | – | – | – | 8022935 | 99.4 | 184.2 | 173.5 | |
| EM17 | 15 | 9 | 2 | – | – | – | 3346216 | 99.6 | 113.7 | 106.9 | |
| EM17 | 15 | 9 | 3 | – | – | gdh2 (VF_1284); E732D (72) | 3484188 | 99.5 | 95.7 | 93.2 | |
| EM17 | 15 | 9 | 5 | – | – | – | 2445758 | 99.5 | 72.8 | 72.6 | |
| H905 | 15 | 1 | 1 | (∆37168 bp/25 genes) | WGS (230) | – | IlvY (VF_2529); M25I (233) | 7645508 | 94.2 | 250.4 | 222.1 |
| H905 | 15 | 1 | 2 | (∆37168 bp/25 genes) | WGS (167) | – | IlvY (VF_2529); M25I (112) | 3531114 | 96.8 | 117.5 | 104.4 |
| H905 | 15 | 1 | 3 | (∆37168 bp/25 genes) | WGS (175) | – | IlvY (VF_2529); M25I (97) | 3596689 | 97 | 122.3 | 109.1 |
| H905 | 15 | 2 | 2 | ∆16 bp@ 498/2595 | WGS (75) | – | purR (VF_1572); N71T (60) | 2819387 | 97.6 | 91.4 | 79.6 |
| H905 | 15 | 2 | 4 | ∆16 bp@ 498/2595 | WGS (94) | – | purR (VF_1572); N71T (52) | 2992978 | 96.9 | 103.3 | 91.4 |
| H905 | 15 | 2 | 5 | ∆16 bp@ 498/2595 | WGS (90) | – | purR (VF_1572); N71T (95) | 3844830 | 96.3 | 123.6 | 109 |
| H905 | 2 | 3 | 1 | – | – | tadF2 (VF_A0228); G21D (68) | 3393611 | 90.7 | 99.5 | 92.2 | |
| H905 | 15 | 3 | 1 | – | – | tadF2 (VF_A0228); G21D (140) | 7974773 | 91.5 | 147.9 | 143.9 | |
| H905 | 15 | 3 | 2 | T195I | WGS (65) | – | tadF2 (VF_A0228); G21D (28) | 1989875 | 95.5 | 65.4 | 58.2 |
| H905 | 15 | 3 | 3 | – | – | tadF2 (VF_A0228); G21D (77) | 3253899 | 96.7 | 103.8 | 94.4 | |
| H905 | 15 | 3 | 4 | – | – | tadF2 (VF_A0228); G21D (58) | 3242749 | 97.1 | 103.3 | 94.7 | |
| H905 | 15 | 3 | 5 | – | – | tadF2 (VF_A0228); G21D (25) | 2190771 | 95.9 | 67.5 | 59 | |
| H905 | 15 | 4 | 1 | E43* | WGS (102) | – | – | 6651385 | 92 | 125.1 | 130 |
| H905 | 15 | 4 | 3 | E43* | WGS (111) | – | – | 4032373 | 96.4 | 135.9 | 120.4 |
| H905 | 15 | 4 | 4 | E43* | WGS (187) | – | – | 6122168 | 95.8 | 203.4 | 179.4 |
| H905 | 15 | 4 | 5 | E43* | WGS (90) | – | – | 3177817 | 96.7 | 100.8 | 90.6 |
| H905 | 15 | 5 | 1 | ∆1 bp @ 2325/2595nt | WGS (113) | – | – | 7166870 | 90.4 | 134.5 | 130.9 |
| H905 | 15 | 5 | 2 | ∆1 bp @ 2325/2595nt | WGS (94) | – | – | 3703946 | 96.7 | 118.6 | 108.3 |
| H905 | 15 | 5 | 3 | ∆1 bp @ 2325/2595nt | WGS (66) | – | – | 2828102 | 97.4 | 98.6 | 90.4 |
| H905 | 15 | 5 | 4 | ∆1 bp @ 2325/2595nt | WGS (109) | – | – | 4721575 | 97 | 158.9 | 143.8 |
| H905 | 2 | 6 | 1 | T195I | WGS (105) | – | tadF2 (VF_A0228); G21D (28) | 2743693 | 94 | 83.3 | 73.6 |
| H905 | 15 | 6 | 3 | T195I | WGS (142) | – | tadF2 (VF_A0228); G21D (49) | 5594771 | 97.5 | 191.7 | 175.3 |
| H905 | 15 | 6 | 4 | T195I | WGS (105) | – | tadF2 (VF_A0228); G21D (37) | 3361206 | 96 | 115.9 | 101.4 |
-
†Individual characterized strain collection names assigned to isolates were derived from their ancestral lineage (e.g. MJ11), evolved passage (e.g. EP2), the population (e.g. 1), and isolate number (e.g. 1), which in the preceding example would give rise to strain collection name of MJ11EP2-1-1. Isolates in bold served as allelic binK representatives for further assays. mg: metagenome sequencing by pooling five isolates from a population.
-
‡The presence of mutations was determined from Illumina short read (100PE) whole genome sequencing (WGS), by allele-specific PCR (PCR), and/or by locus PCR-amplification, followed by Sanger sequencing (SS). ‘–' indicates that no mutations were identified at this locus by breseq (Deatherage and Barrick, 2014) in this isolate using WGS. ‘n.d.’ indicates that the presence of mutations at this locus was not determined.
-
§The number of reads supporting the mutation call from WGS data is provided. Mutations were called for sites with minimum coverage of 20 mappable reads. Mutations identified by Sanger sequencing (SS) of PCR-generated amplicons were confirmed from alignments of both forward and reverse reads. Coding genes reference V. fischeri ES114 locus tags.
Table 3
Genomes used in phylogenetic analyses. This table lists GenBank accessions for nucleotide genomes used in strain phylogeny and source for gene models used in hybrid histidine kinase phylogeny.
| Strain | NCBI accession/de novo | Prokka/NCBI gene models |
|---|---|---|
| Escherichia coli | NC_000913 | NCBI |
| Aliivibrio wodanis | LN554846-51 | NCBI |
| A. salmonicida | NC_011311–6 | NCBI |
| A. logei | NZ_AJYJ00000000 | Prokka |
| Vibrio furnissii | NC_016602, NC_016628 | NCBI |
| Vibrio parahaemolyticus | NC_004603–5 | NCBI |
| Vibrio fischeri SR5 | NZ_AHIH00000000 | Prokka |
| Vibrio fischeri ES114 | NC_006840–2 | NCBI |
| Vibrio fischeri MJ11 | NC_011184–6 | NCBI |
| Vibrio fischeri EM17 | De novo | Prokka |
| Vibrio fischeri WH1 | De novo | Prokka |
| Vibrio fischeri ZF211 | AJYI01 | Prokka |
| Vibrio fischeri WH4 | De novo | Prokka |
| Vibrio fischeri SA1 | De novo | Prokka |
| Vibrio fischeri CG101 | De novo | Prokka |
| Vibrio fischeri H905 | De novo | Prokka |
| Vibrio fischeri PP3 | De novo | Prokka |
| Vibrio fischeri VLS2 | De novo | Prokka |
Table 4
DNA oligonucleotide primers used in this study.
| Primer name | Primer DNA sequence (5’−3’) | Annealing temperature | Source |
|---|---|---|---|
| A0397 F5 | AAGAGTCATGGTATACATCGG | 51°C | This study |
| A0397 F5* | TGTAGCTGATGAGACTTTGCG | 56°C | This study |
| A0397 F8 | TCATTGAAAGGTTTAATCGGTGT | 57°C | This study |
| A0397 R11 | CACTTTATGGATGATCTTCGCT | 56°C | This study |
| A0397 F3 | GCTGATGAGACTTTCGCTC | 52°C | This study |
| A0397 R4 | GGCTGATTAGATCATCCTGC | 54°C | This study |
| A0397 F12 | CAGAAGCACTAAATCATGTGAG | 52°C | This study |
| A0397 R9 | TCTGACATGCCAATAATGCCAT | 59°C | This study |
| MJ11A0397 R KpnI | GGTACCCCGAAATTAACGACCAT | 50°C | This study |
| MJ11A0397 F SalI | GTCGACAAATAGAAACACTAACCAC | 50°C | This study |
| HKSoeA F (SalI) | GTCGACAATGTAGAAGTGGTAGAACGC | 50°C | This study |
| HKSoeA2 R | GTTTCCGCCATTCTTTGTGGTTAGTGTTTCT3 | 50°C | This study |
| HKSoeB2 F | AGAAACACTAACCACAAAGAATGGCGGAAAC | 50°C | This study |
| HKSoeB2 R | GCACCGACACTCATCAATTCGATATCAAGCT | 50°C | This study |
| HKSoeC2 F | AGCTTGATATCGAATTGATGAGTGTCGGTGC | 50°C | This study |
| HKSoeC R (KpnI) | GGTACCAGCGGCAATAGAATCAGTC | 50°C | This study |
| TnErm4 | AATGCCCTTTACCTGTTCC | 53°C | This study |
| TnErm5 | CATGCGTCTGACATCTATCTGA | 55°C | This study |
| A0397 R13 | GTACACCCGAAATTAACGACCA | 59°C | This study |
| A0397 F10 | CAGAGTTATGGGGTTGCTGAGT | 58°C | This study |
| A0397 WT+ R | GTCCCACCAAATTGACG | 53°C | This study |
| A0397 4+ R | GTCCCACCAAATTGACA | 53°C | This study |
| sypE RF F2 | GCAGGTTATGTGCGAGG | 52°C | This study |
| gapA F1 | GCCGTAGTGTACTTCGAGCG | 55°C | 31 |
| gapA R1 | CCCATTACTCACCCTTGTTTG | 55°C | 31 |
| PrRF9 | AAGCTTATTGGGAATACGGATACCTG | 53°C | This study |
| PrRF10 | CATATGCACATCTTCTAACCATTGCTG | 53°C | This study |
| PrRF19 | TGTCAGTATCACTCCCCTTCAC | 55°C | This study |
| PrRF20 | AGCAGACAGTTTTATTGTTCATTGTTTCACCTCATTTAA | 50°C | This study |
| PrRF21 | TTAAATGAGGTGAAACAATGAACAATAAAACTGTCTGCT | 50°C | This study |
| PrRF22 | TTTCCTGTTTGTTCTTTTTTAGAAAAACTCATCGAGCA | 50°C | This study |
| PrRF23 | TGCTCGATGAGTTTTTCTAAAAAAGAACAAACAGGAAA | 50°C | This study |
| PrRF24 | GTTCCTTCTACAAGTCCTATTCC | 53°C | This study |
| PrRF36 | ATCCATTGTAATAGTGCTGC | 53°C | This study |
| PrRF52 | AATAAGTCCATTTCGTTCTGC | 54°C | This study |
| PrRF53 | AAGCGGAAGTAGCGAAAAC | 54°C | This study |
| VSV105InF | GCCTGGGGTGCCTAATG | 56°C | This study |
| KanINF | ATACAAGGGGTGTTATGAGCC | 55°C | This study |
| KanINR | CAAGTCAGCGTAATGCTCTGC | 56°C | This study |
Appendix 1—table 1
Transcript expression differences between wild-type binK+ (ancestral MJ11) and binK mutants (∆binK and binK1) as detected by RNAseq under Fisher’s Exact test in edgeR. Positive fold-changes (logFC) indicate elevated expression in the wild-type relative to the indicated mutant; negative values indicate reduced expression in the wild-type relative to mutants. Loci with similar and significant expression changes in both ∆binK and binK1 relative to the wild-type are listed in bold. Only loci showing significant differences in transcript abundance compared with ancestral MJ11 are listed (FDR < 0.05).
| Wildtype vs mutant ∆binK | Wildtype vs evolved binK1 | ||||||
|---|---|---|---|---|---|---|---|
| Fold-change in expression | Average transcript abundance | Corr. P | Fold-change in expression | Average transcript abundance | Corr. P | ||
| Locus Tag | logFC | logCPM | FDR | logFC | logCPM | FDR | Gene description |
| VFMJ11_0008 | −1.4 | 6.79 | 0.0027 | −0.3 | 5.94 | 0.6192 | Cystine-binding protein |
| VFMJ11_0013 | 2.7 | 7.87 | 0.0000 | 1.3 | 8.14 | 0.3143 | Small heat shock protein |
| VFMJ11_0195 | 1.0 | 7.43 | 0.0015 | 0.4 | 7.58 | 0.6346 | Co-chaperonin GroES |
| VFMJ11_0260 | 1.2 | 4.86 | 0.0003 | 0.7 | 4.98 | 0.2770 | Universal stress protein family protein |
| VFMJ11_0297 | −1.4 | 5.51 | 0.0063 | −0.6 | 4.81 | 0.4928 | Sulfite reductase NADPH flavoprotein alpha-component |
| VFMJ11_0307 | −1.4 | 5.27 | 0.0058 | −0.5 | 4.46 | 0.5758 | Sulfate adenylyltransferase subunit 2 |
| VFMJ11_0421 | −0.8 | 6.96 | 0.0011 | −0.6 | 6.68 | 0.2201 | mutY AG-specific adenine glycosylase |
| VFMJ11_0578 | 1.1 | 9.32 | 0.0005 | 0.7 | 9.37 | 0.2725 | ATP-dependent chaperone ClpB |
| VFMJ11_0628 | −1.0 | 9.16 | 0.0009 | −1.0 | 9.03 | 0.0887 | Inositol-1-monophosphatase |
| VFMJ11_0653 | −1.1 | 6.70 | 0.0000 | −0.2 | 5.95 | 0.8114 | Aminobenzoyl-glutamate transport protein |
| VFMJ11_0690 | 1.5 | 3.25 | 0.0001 | 0.6 | 3.53 | 0.5043 | urease accessory protein UreE |
| VFMJ11_0691 | 1.6 | 5.18 | 0.0000 | 0.4 | 5.55 | 0.5650 | Urease subunit alpha UreC |
| VFMJ11_1133 | 1.8 | 3.60 | 0.0000 | 0.6 | 3.94 | 0.3689 | Peptidase T pepT_1 |
| VFMJ11_1137 | 1.1 | 8.56 | 0.0000 | 0.6 | 8.69 | 0.2725 | Glutamate decarboxylase |
| VFMJ11_1138 | 1.5 | 7.03 | 0.0000 | 0.4 | 7.34 | 0.4196 | TrkA domain integral membrane protein |
| VFMJ11_1253 | −0.8 | 9.48 | 0.0100 | −0.6 | 9.21 | 0.3013 | Serine transporter |
| VFMJ11_1268 | −1.5 | 8.45 | 0.0000 | −0.5 | 7.57 | 0.3861 | Insulin-cleaving metalloproteinase outer membrane protein |
| VFMJ11_1269 | −1.2 | 6.24 | 0.0007 | −0.6 | 5.65 | 0.3122 | Thiol oxidoreductase |
| VFMJ11_1270 | −1.0 | 6.40 | 0.0062 | −0.4 | 5.87 | 0.4916 | Imelysin superfamily protein |
| VFMJ11_1305 | −1.4 | 3.64 | 0.0082 | −0.9 | 3.14 | 0.5490 | TonB protein |
| VFMJ11_1317 | 1.2 | 8.36 | 0.0000 | 0.1 | 8.77 | 0.9186 | Hemin receptor |
| VFMJ11_1370 | −1.2 | 7.83 | 0.0055 | −1.4 | 7.82 | 0.0530 | 3-hydroxydecanoyl-ACP dehydratase fabA |
| VFMJ11_1398 | −0.6 | 6.43 | 0.0634 | −1.0 | 6.50 | 0.0335 | Na-dependent nucleoside transporter family protein |
| VFMJ11_1464 | −0.8 | 7.74 | 0.0088 | −0.3 | 7.27 | 0.6058 | Peptidase U32 |
| VFMJ11_1477 | −0.9 | 8.48 | 0.0065 | −1.0 | 8.43 | 0.1214 | Glycine betaine transporter |
| VFMJ11_1534 | −0.8 | 6.27 | 0.0098 | −0.8 | 6.10 | 0.1776 | ATP-dependent RNA helicase RhlE |
| VFMJ11_1579 | −0.8 | 5.34 | 0.0094 | −0.7 | 5.09 | 0.2410 | Amidase |
| VFMJ11_1614 | 1.2 | 6.67 | 0.0000 | 0.8 | 6.74 | 0.2128 | |
| VFMJ11_1637 | −1.6 | 6.35 | 0.0000 | −1.1 | 5.79 | 0.1727 | Long-chain fatty acid transport protein |
| VFMJ11_1853 | −0.9 | 8.47 | 0.0050 | −0.6 | 8.14 | 0.2725 | |
| VFMJ11_1945 | −1.1 | 10.99 | 0.0001 | −1.0 | 10.79 | 0.1727 | Long-chain fatty acid transport protein |
| VFMJ11_2039 | −0.6 | 10.70 | 0.0678 | −1.0 | 10.90 | 0.0335 | Nitrate reductase catalytic subunit NapA |
| VFMJ11_2045 | 1.1 | 5.71 | 0.0078 | 0.5 | 5.85 | 0.4159 | |
| VFMJ11_2103 | −0.9 | 9.12 | 0.0017 | −0.6 | 8.78 | 0.2201 | Queuine tRNA-ribosyltransferase tgt |
| VFMJ11_2111 | 1.5 | 3.60 | 0.0002 | 1.0 | 3.74 | 0.2591 | Protein YgiW |
| VFMJ11_2127 | −1.0 | 9.24 | 0.0018 | −0.7 | 8.93 | 0.1727 | Peptidase U32 |
| VFMJ11_2165 | 1.2 | 4.76 | 0.0062 | 0.5 | 4.97 | 0.4470 | DNA-binding transcriptional activator CadC |
| VFMJ11_2221 | 1.5 | 9.28 | 0.0000 | 0.1 | 9.80 | 0.9638 | Autonomous glycyl radical cofactor GrcA |
| VFMJ11_2223 | 0.7 | 6.55 | 0.0079 | 0.4 | 6.62 | 0.4482 | Homoserine kinase thrB |
| VFMJ11_2231 | 1.0 | 6.47 | 0.0002 | 0.5 | 6.58 | 0.3889 | Glutamate synthase subunit beta gltD |
| VFMJ11_2259 | −1.0 | 9.66 | 0.0011 | −0.7 | 9.32 | 0.2410 | IronIII ABC transporter periplasmic binding protein |
| VFMJ11_2394 | 1.1 | 5.83 | 0.0058 | 0.4 | 6.03 | 0.6194 | Succinylglutamic semialdehyde dehydrogenase astD |
| VFMJ11_2416 | 1.0 | 9.76 | 0.0032 | −0.3 | 10.32 | 0.6532 | Argininosuccinate synthase argG |
| VFMJ11_2456 | 1.3 | 10.16 | 0.0000 | 0.1 | 10.58 | 0.9472 | Fumarate reductase flavoprotein subunit frdA |
| VFMJ11_2457 | 1.4 | 8.35 | 0.0000 | 0.0 | 8.88 | 1.0000 | Fumarate reductase iron-sulfur subunit |
| VFMJ11_2458 | 1.7 | 6.08 | 0.0000 | 0.4 | 6.50 | 0.7063 | Fumarate reductase subunit C |
| VFMJ11_2459 | 1.4 | 6.68 | 0.0069 | −0.1 | 7.22 | 0.9725 | Fumarate reductase subunit D |
| VFMJ11_2504 | −0.9 | 5.36 | 0.0048 | −0.5 | 4.93 | 0.3940 | 3-dehydroquinate dehydratase aroQ |
| VFMJ11_2505 | −1.0 | 8.61 | 0.0015 | −0.9 | 8.47 | 0.1727 | Acetyl-CoA carboxylase biotin carboxyl carrier protein subunit accB |
| VFMJ11_2506 | −1.2 | 10.80 | 0.0001 | −1.0 | 10.54 | 0.1384 | Acetyl-CoA carboxylase biotin carboxylase subunit accC |
| VFMJ11_2693 | 0.9 | 5.74 | 0.0083 | 0.5 | 5.80 | 0.3940 | Branched-chain amino acid aminotransferase ilvE |
| VFMJ11_2696 | −1.6 | 9.00 | 0.0000 | −1.2 | 8.52 | 0.1793 | Cold-shock DNA-binding domain |
| VFMJ11_A0104 | 2.0 | 4.85 | 0.0000 | 1.1 | 5.07 | 0.1727 | dmsC |
| VFMJ11_A0105 | 2.0 | 5.16 | 0.0000 | −0.1 | 5.83 | 0.9797 | dmsB |
| VFMJ11_A0106 | 1.7 | 7.96 | 0.0000 | 0.1 | 8.50 | 0.9472 | Anaerobic dimethyl sulfoxide reductase chain a |
| VFMJ11_A0107 | 1.2 | 4.47 | 0.0023 | 0.2 | 4.82 | 0.8697 | YnfI |
| VFMJ11_A0111 | 1.0 | 7.20 | 0.0000 | 0.1 | 7.49 | 0.8523 | Outer membrane protein RomA |
| VFMJ11_A0151 | 0.9 | 7.29 | 0.0001 | −0.2 | 7.72 | 0.7881 | Putative tripeptide transporter permease tppB |
| VFMJ11_A0200 | 1.5 | 6.46 | 0.0000 | 0.7 | 6.68 | 0.3479 | L-lysine 6-monooxygenase |
| VFMJ11_A0201 | 1.6 | 7.97 | 0.0000 | 0.7 | 8.18 | 0.3687 | Ferric aerobactin receptor |
| VFMJ11_A0222 | 1.3 | 6.35 | 0.0000 | 0.6 | 6.54 | 0.3940 | Trimethylamine-n-oxide reductase 2 |
| VFMJ11_A0224 | −1.8 | 6.14 | 0.0001 | −1.0 | 5.37 | 0.1748 | FhuE receptor |
| VFMJ11_A0243 | 0.9 | 5.11 | 0.0075 | 0.2 | 5.35 | 0.7820 | |
| VFMJ11_A0256 | −1.9 | 1.54 | 0.0091 | −1.6 | 1.03 | 0.3770 | Lipoprotein |
| VFMJ11_A0280 | 1.2 | 3.75 | 0.0064 | 0.2 | 4.08 | 0.8702 | Methyl-accepting chemotaxis protein |
| VFMJ11_A0317 | 1.4 | 7.28 | 0.0000 | 0.2 | 7.65 | 0.6304 | Anaerobic ribonucleoside triphosphate reductase |
| VFMJ11_A0325 | 1.8 | 3.04 | 0.0003 | 1.5 | 3.12 | 0.1801 | YgiW |
| VFMJ11_A0367 | 2.5 | 4.82 | 0.0000 | 0.6 | 5.32 | 0.3479 | |
| VFMJ11_A0368 | 2.3 | 6.02 | 0.0000 | 0.9 | 6.36 | 0.1839 | |
| VFMJ11_A0388 | −0.9 | 5.94 | 0.0049 | 0.4 | 5.09 | 0.4808 | Cyclic nucleotide binding protein |
| VFMJ11_A0389 | −2.0 | 9.66 | 0.0000 | 0.2 | 8.00 | 0.7303 | Sodium glucose cotransporter |
| VFMJ11_A0390 | −3.1 | 7.57 | 0.0000 | 0.4 | 4.86 | 0.5426 | UDP-glucose 4-epimerase |
| VFMJ11_A0391 | −2.4 | 7.09 | 0.0000 | 0.2 | 5.11 | 0.8033 | Galactose-1-phosphate uridylyltransferase |
| VFMJ11_A0392 | −1.8 | 6.97 | 0.0000 | 0.1 | 5.52 | 1.0000 | Galactokinase |
| VFMJ11_A0393 | −1.5 | 6.89 | 0.0000 | 0.0 | 5.76 | 1.0000 | Aldose 1-epimerase |
| VFMJ11_A0394 | −6.3 | 9.93 | 0.0000 | 0.3 | 4.23 | 0.7720 | Transporter AcrB-D-F |
| VFMJ11_A0395 | −7.0 | 9.15 | 0.0000 | 0.1 | 2.80 | 0.9802 | Acriflavin resistance periplasmic protein |
| VFMJ11_A0396 | −5.2 | 6.94 | 0.0000 | 0.0 | 2.50 | 0.9472 | Transcriptional regulator TetR family |
| VFMJ11_A0397 | 5.1 | 4.38 | 0.0000 | 0.6 | 5.10 | 0.2727 | |
| VFMJ11_A0398 | −1.4 | 7.07 | 0.0000 | 0.0 | 6.06 | 0.9926 | HTH-type transcriptional regulator GalR |
| VFMJ11_A0408 | 1.5 | 3.36 | 0.0010 | 0.6 | 3.62 | 0.5359 | |
| VFMJ11_A0487 | −1.4 | 7.99 | 0.0000 | −0.2 | 7.09 | 0.7403 | Pts system N-acetylglucosamine-specific iibc component |
| VFMJ11_A0619 | −0.7 | 8.61 | 0.0099 | −0.2 | 8.16 | 0.6350 | ABC-type multidrug transport system ATPase and permease component |
| VFMJ11_A0620 | −1.7 | 7.95 | 0.0000 | −0.9 | 7.22 | 0.1497 | Oxalate-formate antiporter |
| VFMJ11_A0665 | 2.2 | 2.92 | 0.0000 | 1.2 | 3.19 | 0.3019 | |
| VFMJ11_A0671 | 1.6 | 2.35 | 0.0051 | 0.9 | 2.53 | 0.4110 | |
| VFMJ11_A0710 | 1.1 | 4.02 | 0.0082 | 1.0 | 4.01 | 0.2201 | |
| VFMJ11_A0755 | 1.2 | 3.78 | 0.0020 | 0.8 | 3.87 | 0.2319 | Restriction endonuclease |
| VFMJ11_A0768 | 1.4 | 2.57 | 0.0029 | 0.8 | 2.73 | 0.5409 | |
| VFMJ11_A0875 | −1.3 | 7.69 | 0.0000 | −0.1 | 6.77 | 0.9728 | |
| VFMJ11_A0879 | −0.9 | 6.03 | 0.0017 | −0.7 | 5.74 | 0.4159 | |
| VFMJ11_A0882 | −1.7 | 4.69 | 0.0000 | −0.7 | 3.84 | 0.3793 | Lipoprotein |
| VFMJ11_A0885 | −1.4 | 7.51 | 0.0000 | −0.6 | 6.79 | 0.3687 | Cyclopropane-fatty-acyl-phospholipid synthase |
| VFMJ11_A0887 | −1.3 | 5.63 | 0.0000 | −0.4 | 4.89 | 0.6304 | Amine oxidase |
| VFMJ11_A0888 | −1.6 | 5.22 | 0.0000 | −0.5 | 4.35 | 0.4916 | Short chain dehydrogenase |
| VFMJ11_A0890 | −1.2 | 6.07 | 0.0000 | −0.2 | 5.30 | 0.9034 | Transcriptional activator ChrR |
| VFMJ11_A0891 | −1.2 | 5.70 | 0.0013 | −0.2 | 4.94 | 0.8635 | RNA polymerase sigma factor |
| VFMJ11_A0909 | −1.5 | 5.52 | 0.0000 | −1.0 | 5.04 | 0.1727 | Ferrichrome-iron receptor |
| VFMJ11_A1000 | −0.7 | 6.90 | 0.0075 | −0.3 | 6.49 | 0.5856 | Cellulose synthase operon C protein |
| VFMJ11_A1007 | −0.9 | 4.95 | 0.0040 | −0.5 | 4.55 | 0.4061 | Cellulose synthase operon protein YhjU |
| VFMJ11_A1038 | 1.0 | 3.89 | 0.0040 | 0.7 | 3.94 | 0.2725 | Alkanal monooxygenase beta chain |
| VFMJ11_A1039 | 1.4 | 4.02 | 0.0000 | 0.7 | 4.22 | 0.4313 | Alkanal monooxygenase alpha chain |
| VFMJ11_A1040 | 1.7 | 3.16 | 0.0005 | 1.1 | 3.33 | 0.2320 | Acyl transferase |
| VFMJ11_A1041 | 1.5 | 3.80 | 0.0003 | 0.7 | 4.01 | 0.3851 | Acyl-CoA reductase |
| VFMJ11_A1048 | 1.0 | 7.25 | 0.0069 | −0.4 | 7.87 | 0.6194 | Carboxypeptidase G2 |
| VFMJ11_A1058 | −2.8 | 8.75 | 0.0000 | −1.7 | 7.69 | 0.0887 | Pts system fructose-specific eiibc component |
| VFMJ11_A1059 | −3.0 | 7.69 | 0.0000 | −1.8 | 6.50 | 0.0073 | pfkB |
| VFMJ11_A1060 | −2.9 | 7.77 | 0.0000 | −1.6 | 6.52 | 0.0335 | Bifunctional PTS system fructose-specific transporter subunit IIA Hpr protein |
| VFMJ11_A1061 | −2.1 | 4.34 | 0.0000 | −1.2 | 3.44 | 0.1793 | DNA-binding transcriptional regulator FruR |
| VFMJ11_A1228 | 0.9 | 4.60 | 0.0075 | 0.5 | 4.70 | 0.4704 | |
| VFMJ11_A1256 | 1.0 | 8.21 | 0.0000 | 0.4 | 8.38 | 0.4150 | Iron-regulated protein FrpC |
-
Appendix 1—table 1—source data 1
Read counts estimated by RSEM for chromosome I transcript abundance (Appendix 1, Figure 5—figure supplement 2).
- https://doi.org/10.7554/eLife.24414.029
-
Appendix 1—table 1—source data 2
Read counts estimated by RSEM for chromosome II transcript abundance (Appendix 1, Figure 5—figure supplement 2).
- https://doi.org/10.7554/eLife.24414.030
Appendix 2—table 1
Metabolic convergence between squid native V. fischeri ES114 and squid-evolved binK1. The net changes in metabolic activity (as indicated by change in absorption of the Biolog tetrazolium redox dye) are shown for each V. fischeri strain after 48 hr of exposure to each substrate. Only substrates which induced significant (FDR < 0.05) differences across strains are listed. Metabolic changes in each strain relative to wild-type MJ11 binK+ are colored to indicate relatively increased or decreased activity. Of the 190 substrates tested, 44 substrates yielded significant differences across strain, including 39 which indicate congruent metabolic responses by ES114 and binK1 (Exact binomial test, p=1.405e-7).
| Metabolic activity (∆A550 over 48 hr) | Metabolic activity change relative to remS+ MJ11 | |||||||||
|---|---|---|---|---|---|---|---|---|---|---|
| Well | Substrate | remS+ | remS1 | ∆remS | ES114 | remS+ | remS1 | ∆remS | ES114 | Convergence |
| H11 | Phenylethylamine | 0.012 | 0.568 | 0.458 | 0.667 | 0.000 | 46.54 | 37.33 | 54.85 | + |
| H07 | Glucuronamide | 0.017 | 0.523 | 0.564 | 0.558 | 0.000 | 30.20 | 32.69 | 32.30 | + |
| G10 | Methyl pyruvate | 0.019 | 0.677 | 0.462 | 0.639 | 0.000 | 33.70 | 22.70 | 31.78 | + |
| H08 | Pyruvic acid | 0.013 | 0.187 | 0.276 | 0.395 | 0.000 | 13.09 | 19.76 | 28.71 | + |
| E01 | L-Glutamine | 0.026 | 0.620 | 0.125 | 0.665 | 0.000 | 22.82 | 3.78 | 24.54 | + |
| F03 | m-Inositol | 0.044 | 0.724 | 0.726 | 0.671 | 0.000 | 15.50 | 15.54 | 14.28 | + |
| E02 | m-Tartaric acid | 0.026 | 0.424 | 0.338 | 0.451 | 0.000 | 15.10 | 11.84 | 16.13 | + |
| D02 | D-Aspartic acid | 0.040 | 0.459 | 0.363 | 0.735 | 0.000 | 10.56 | 8.16 | 17.55 | + |
| A12 | Dulcitol | 0.030 | 0.402 | 0.091 | 0.608 | 0.000 | 12.61 | 2.07 | 19.63 | + |
| G03 | L-Serine | 0.032 | 0.467 | 0.235 | 0.360 | 0.000 | 13.66 | 6.39 | 10.29 | + |
| H02 | p-Hydroxy phenyl acetic acid | 0.027 | 0.063 | 0.037 | 0.636 | 0.000 | 1.27 | 0.36 | 22.11 | + |
| B06 | D-Gluconic acid | 0.048 | 0.300 | 0.324 | 0.628 | 0.000 | 5.24 | 5.75 | 12.06 | + |
| B09 | L-Lactic acid | 0.029 | 0.068 | 0.040 | 0.647 | 0.000 | 1.30 | 0.37 | 20.93 | + |
| E09 | Adonitol | 0.026 | 0.358 | 0.197 | 0.085 | 0.000 | 12.88 | 6.63 | 2.28 | + |
| H01 | Glycyl-L-proline | 0.039 | 0.206 | 0.258 | 0.443 | 0.000 | 4.32 | 5.65 | 10.44 | + |
| C05 | Tween 20 | 0.025 | 0.065 | 0.001 | 0.517 | 0.000 | 1.60 | −0.95 | 19.54 | + |
| E08 | β-Methyl-D-glucoside | 0.004 | 0.024 | 0.022 | 0.021 | 0.000 | 5.66 | 5.10 | 4.85 | + |
| G05 | L-Alanine | 0.056 | 0.322 | 0.295 | 0.355 | 0.000 | 4.74 | 4.25 | 5.33 | + |
| B11 | D-Mannitol | 0.018 | 0.177 | 0.085 | 0.034 | 0.000 | 8.64 | 3.64 | 0.88 | + |
| H09 | L-Galactonic acid—Lactone | 0.089 | 0.275 | 0.379 | 0.450 | 0.000 | 2.10 | 3.27 | 4.06 | + |
| F04 | D-Threonine | 0.017 | 0.126 | 0.044 | 0.041 | 0.000 | 6.37 | 1.55 | 1.37 | + |
| D01 | L-Asparagine | 0.026 | 0.069 | 0.080 | 0.129 | 0.000 | 1.61 | 2.02 | 3.86 | + |
| H06 | L-Lyxose | 0.088 | 0.051 | 0.036 | 0.481 | 0.000 | −0.42 | −0.59 | 4.48 | - |
| F8 | Mucic acid | 0.026 | 0.072 | 0.044 | 0.035 | 0.000 | 1.78 | 0.68 | 0.36 | + |
| C12 | Thymidine | 0.071 | 0.168 | 0.116 | 0.052 | 0.000 | 1.36 | 0.63 | −0.27 | - |
| G11 | D-Malic acid | 0.028 | 0.062 | 0.036 | 0.029 | 0.000 | 1.21 | 0.31 | 0.05 | + |
| F06 | Bromo succinic acid | 0.033 | 0.061 | 0.037 | 0.035 | 0.000 | 0.82 | 0.11 | 0.04 | + |
| A10 | D-Trehalose | 0.031 | 0.045 | 0.038 | 0.034 | 0.000 | 0.45 | 0.21 | 0.08 | + |
| D06 | α-Keto-glutaric acid | 0.045 | 0.074 | 0.043 | 0.042 | 0.000 | 0.65 | −0.04 | −0.08 | - |
| F9 | Glycolic acid | 0.039 | 0.062 | 0.032 | 0.040 | 0.000 | 0.61 | −0.17 | 0.04 | + |
| C11 | D-melibiose | 0.028 | 0.043 | −0.006 | 0.053 | 0.000 | 0.53 | −1.20 | 0.90 | + |
| D10 | Lactulose | 0.045 | 0.057 | 0.046 | 0.035 | 0.000 | 0.27 | 0.02 | −0.20 | - |
| A10 | Laminarin | 0.678 | 0.546 | 0.674 | 0.798 | 0.000 | −0.20 | −0.01 | 0.18 | - |
| E06 | 2-Hydroxy benzoic acid | 0.089 | 0.070 | 0.080 | 0.093 | 0.000 | −0.21 | −0.10 | 0.04 | + |
| A03 | α-Cyclodextrin | 0.191 | 0.122 | 0.089 | 0.158 | 0.000 | −0.36 | −0.54 | −0.17 | + |
| H07 | D,L-Octopamine | 0.200 | 0.111 | 0.067 | 0.186 | 0.000 | −0.45 | −0.66 | −0.07 | + |
| F07 | D-Ribono-1,4-lactone | 0.198 | 0.085 | 0.070 | 0.162 | 0.000 | −0.57 | −0.65 | −0.18 | + |
| D07 | Turanose | 0.188 | 0.065 | 0.060 | 0.137 | 0.000 | −0.66 | −0.68 | −0.27 | + |
| E02 | Caproic acid | 0.241 | 0.101 | 0.007 | 0.215 | 0.000 | −0.58 | −0.97 | −0.11 | + |
| G10 | L-Leucine | 0.214 | 0.051 | 0.075 | 0.135 | 0.000 | −0.76 | −0.65 | −0.37 | + |
| G02 | L-Alaninamide | 0.164 | 0.065 | 0.047 | 0.045 | 0.000 | −0.60 | −0.72 | −0.72 | + |
| G02 | Tricarballylic acid | 0.029 | 0.018 | −0.008 | 0.006 | 0.000 | −0.37 | −1.27 | −0.80 | + |
| C10 | α-Methyl-D-mannoside | 0.183 | 0.004 | 0.024 | 0.075 | 0.000 | −0.98 | −0.87 | −0.59 | + |
| D08 | α-Methyl-D- Galactoside | −0.011 | 0.018 | 0.008 | 0.000 | 0.000 | −2.56 | −1.68 | −0.99 | + |
-
Appendix 2—table 1—source data 1
Raw data for redox activity over 48 hr in BIOLOG plate PM1 (Appendix 2).
- https://doi.org/10.7554/eLife.24414.032
-
Appendix 2—table 1—source data 2
Raw data for redox activity over 48 hr in BIOLOG plate PM2A (Appendix 2).
- https://doi.org/10.7554/eLife.24414.033
Additional files
-
Source code 1
Statistical analysis of transcriptome changes in R (Appendix 1, Figure 5—figure supplement 2).
- https://doi.org/10.7554/eLife.24414.025
-
Source code 2
Statistical analysis of metabolic differences in BIOLOG assays in R (Appendix 2).
- https://doi.org/10.7554/eLife.24414.026
-
Appendix 1—table 1—source data 1
Read counts estimated by RSEM for chromosome I transcript abundance (Appendix 1, Figure 5—figure supplement 2).
- https://doi.org/10.7554/eLife.24414.029
-
Appendix 1—table 1—source data 2
Read counts estimated by RSEM for chromosome II transcript abundance (Appendix 1, Figure 5—figure supplement 2).
- https://doi.org/10.7554/eLife.24414.030
-
Appendix 2—table 1—source data 1
Raw data for redox activity over 48 hr in BIOLOG plate PM1 (Appendix 2).
- https://doi.org/10.7554/eLife.24414.032
-
Appendix 2—table 1—source data 2
Raw data for redox activity over 48 hr in BIOLOG plate PM2A (Appendix 2).
- https://doi.org/10.7554/eLife.24414.033
Download links
A two-part list of links to download the article, or parts of the article, in various formats.
Downloads (link to download the article as PDF)
Open citations (links to open the citations from this article in various online reference manager services)
Cite this article (links to download the citations from this article in formats compatible with various reference manager tools)
Host-selected mutations converging on a global regulator drive an adaptive leap towards symbiosis in bacteria
eLife 6:e24414.
https://doi.org/10.7554/eLife.24414


