Mechanotransduction current is essential for stability of the transducing stereocilia in mammalian auditory hair cells
- College of Medicine, University of Kentucky, United States
Figures
Figure 1 with 3 supplements
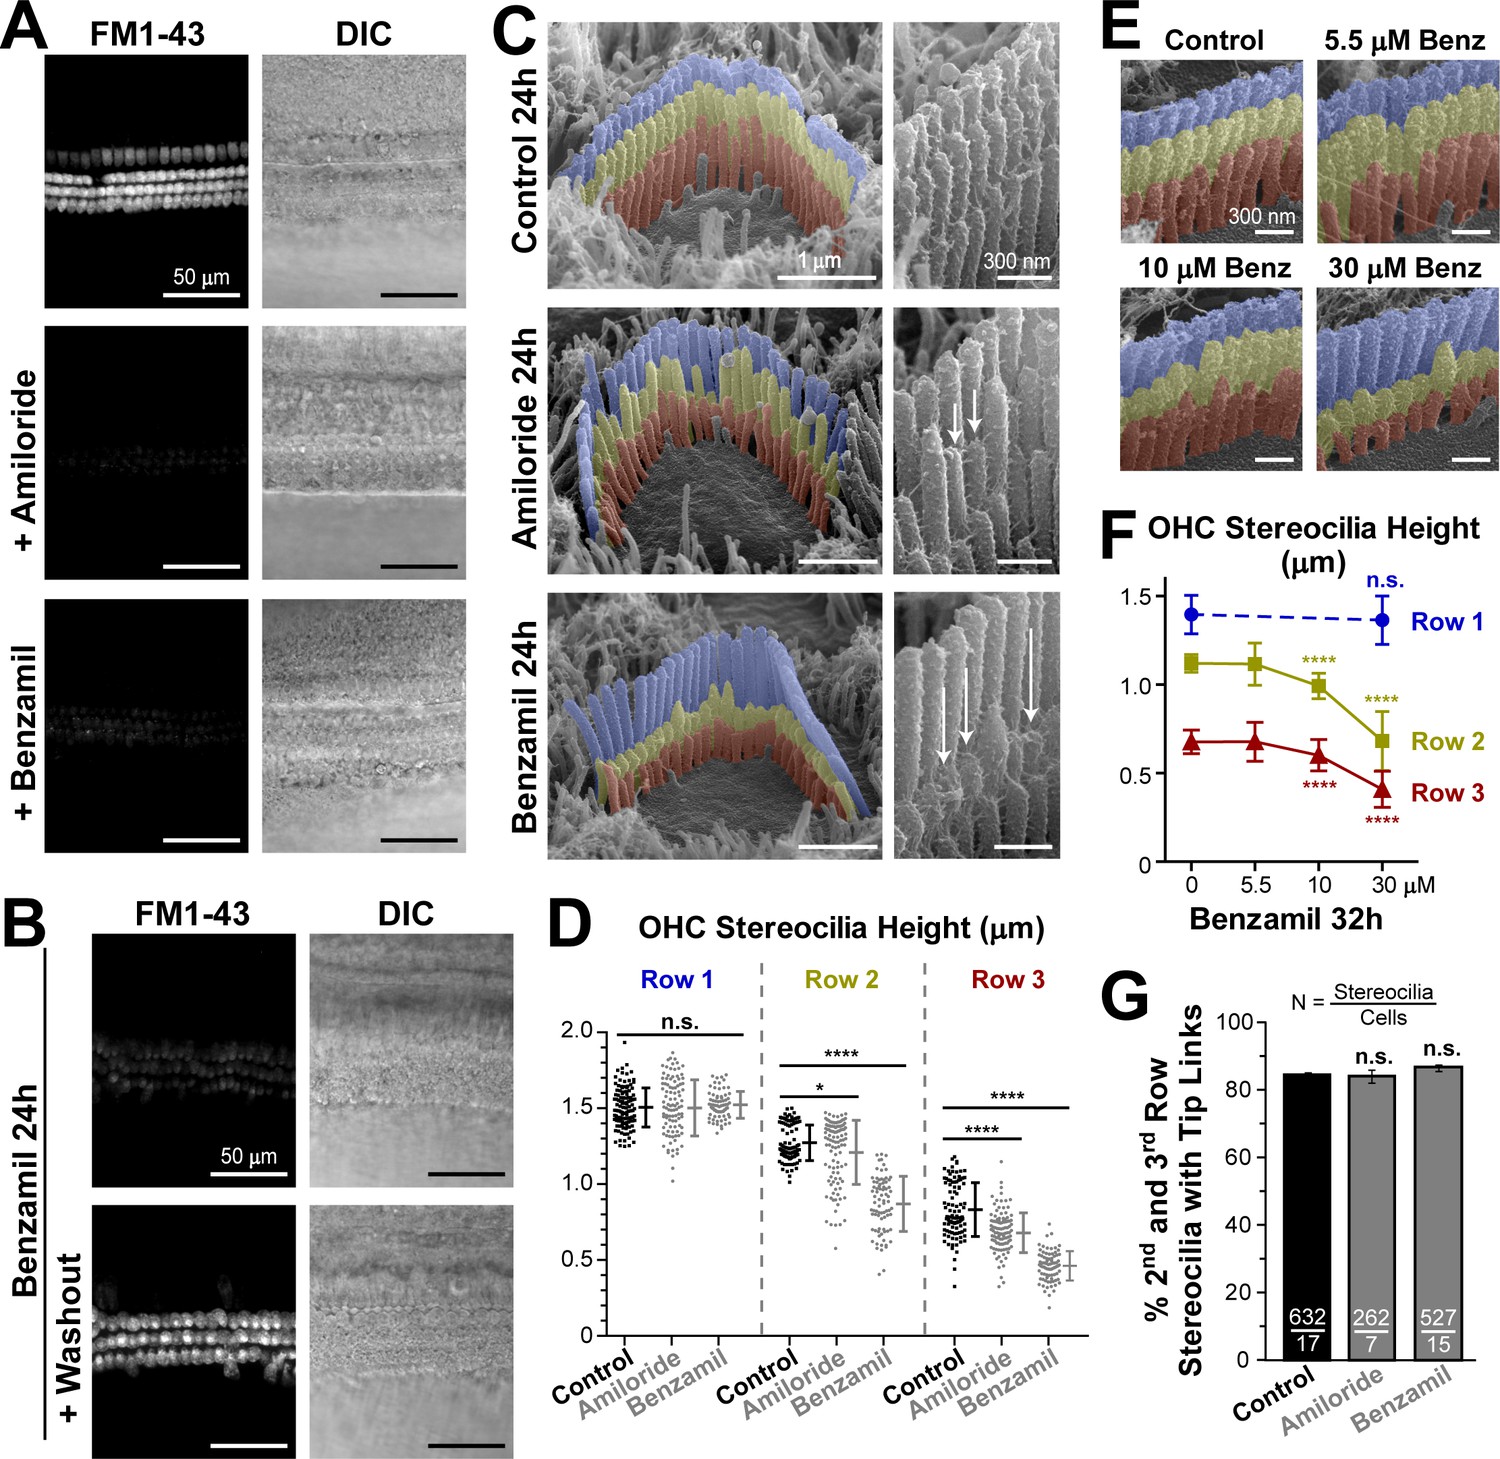
Long-term blockage of the MET channels causes selective shortening of the second and third, but not the first (tallest), rows of stereocilia in mouse outer hair cell (OHC) bundles.
(A and B) Assessment of MET blockage with MET channel-permeable dye, FM1-43. (A) Left panels show maximal projection images of FM1-43 fluorescence in mouse organ of Corti explants immediately after the tissue dissection, in control conditions (top) and in the presence of non-saturating concentrations of MET blockers: amiloride (100 μM, middle) or benzamil (30 μM, bottom). Right panels show reference bright-field images of the same cochlear explants at the focal plane of the hair cell bodies. Data are representative of two independent series. (B) Similar maximal projection FM1-43 (left) and bright-field (right) images at the end of 24 hr incubation at 37°C with 30 μM of benzamil (top) and after washout of this drug (bottom). (C) Representative scanning electron microscopy (SEM) images of OHC stereocilia bundles (false-colored) in mouse organ of Corti explants cultured for 24 hr at 37°C in vehicle control conditions (top), 100 μM of amiloride (middle), or 30 μM of benzamil (bottom). Right panels show higher magnification images of OHC stereocilia. Arrows point to examples of retracted stereocilia. (D) Heights of individual stereocilia in different rows of OHC bundles in mouse organ of Corti explants cultured for 24 hr in control conditions (black; n = 103–120 stereocilia) or in the presence of the MET blockers (gray), amiloride (100 μM, n = 99–108) or benzamil (30 μM, n = 75–80). Error bars indicate mean ± SD. The data are from a single series of experiments (8–17 cells per treatment) with control and drug-treated explants processed in parallel, representative of one (amiloride) and three (benzamil) independent series. (E and F) Representative false-colored SEM images of OHC bundles (E) and quantification of stereocilia heights (F) in the first (blue), second (yellow) and third (red) rows of the bundle (n = 40–130), indicating the dose-dependent effect of a 32 hr incubation in the presence of 0, 5.5, 10 and 30 μM of benzamil. Data (4–12 cells per treatment) are shown as mean ± SD. For D and F: *p<0.05; ****p<0.0001; n.s., non-significant (Welch’s t tests). (G) Percentage of shorter (second and third) row OHC stereocilia having tip links after 24 hr culturing in control conditions (black, n = 632) or with MET blockers (gray, n = 262–527). Combined data from two independent series (7–17 cells per treatment) are shown as mean ± SE. n.s., non-significant (Student’s t tests). Age of explants A: P5; B–G: P4 +24–32 hr incubation. Original SEM images can be found in Vélez-Ortega et al. (2017).
Figure 1—figure supplement 1
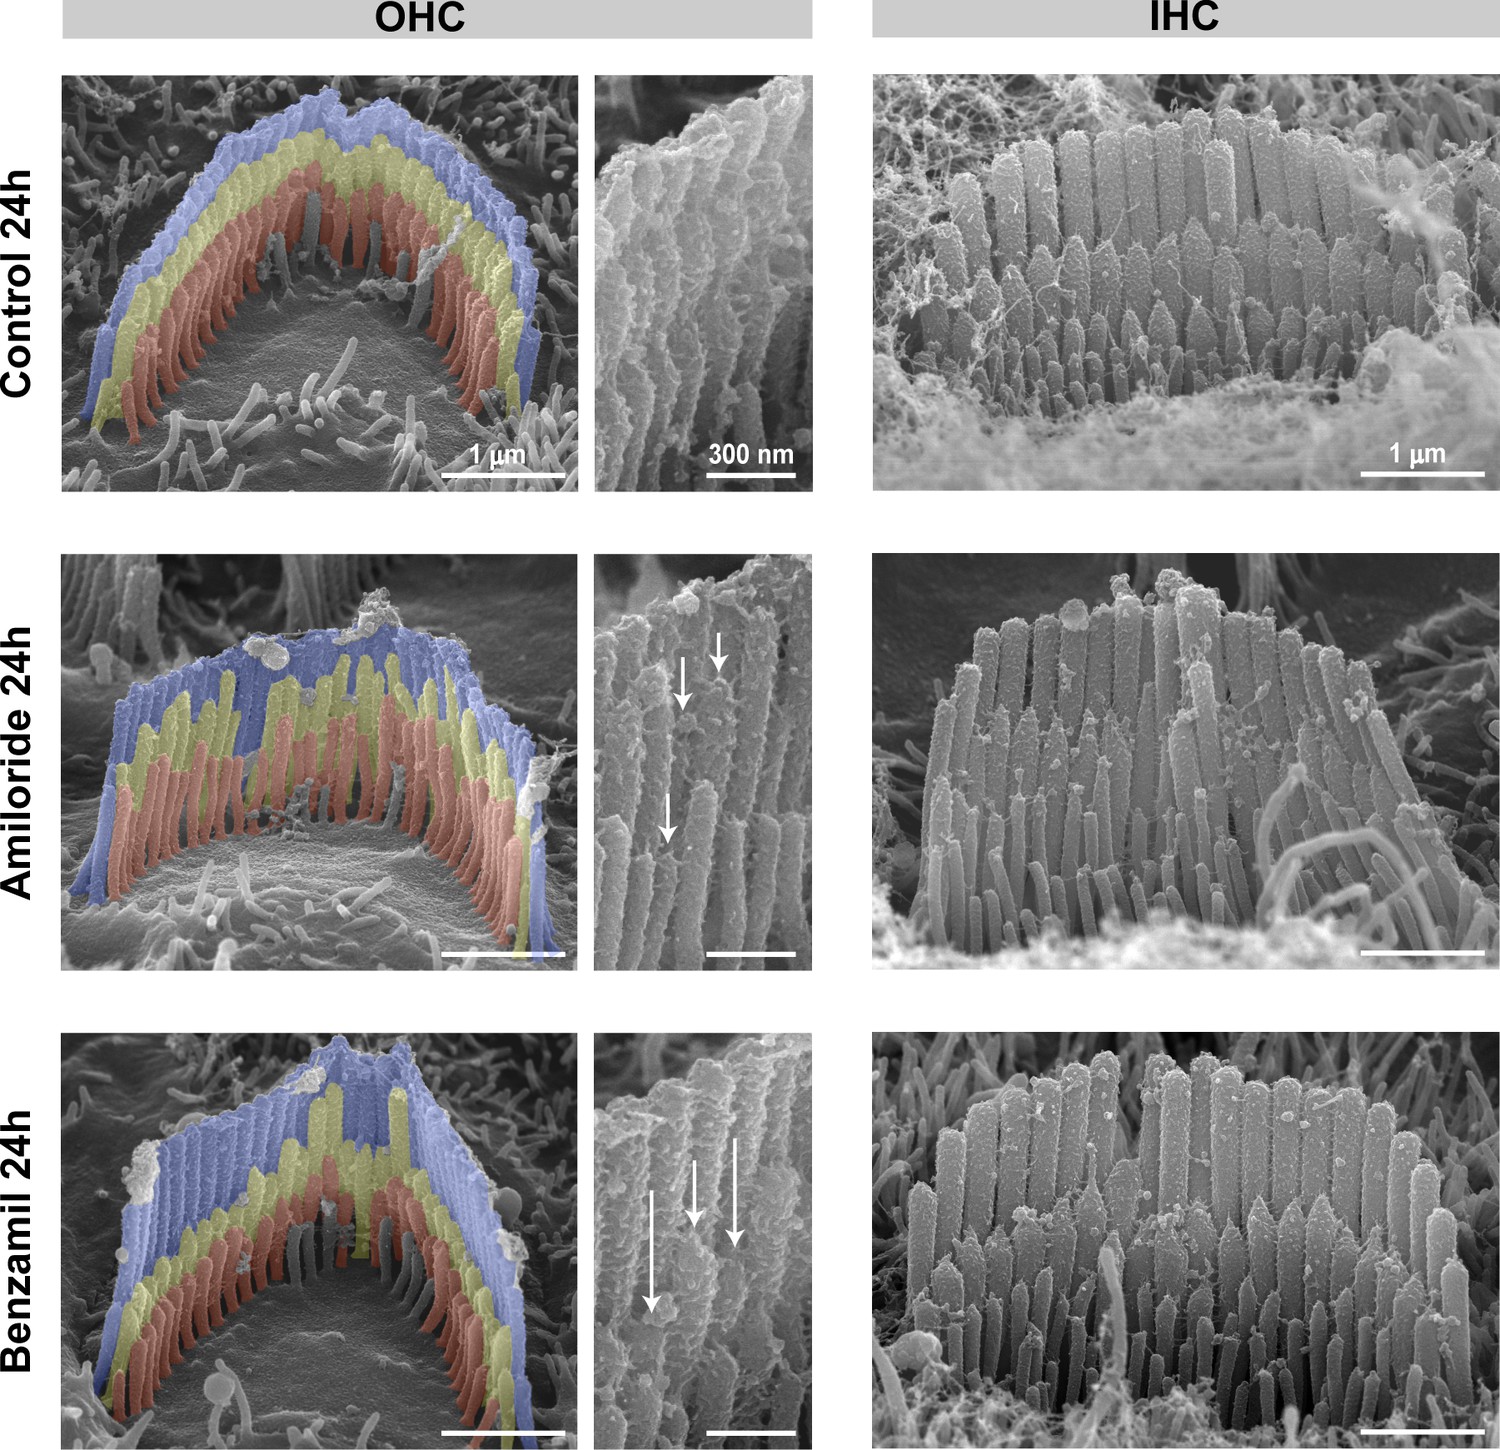
Blockage of the MET current causes selective shortening of the second- and third-row (transducing) stereocilia in rat auditory hair cells.
Representative false-colored SEM images of OHC (left and middle) and IHC (right) stereocilia bundles from rat organ of Corti explants cultured for 24 hr at 37°C in vehicle control conditions (top) or in the presence of 100 μM of amiloride (middle) or 30 μM of benzamil (bottom). Middle panels show higher magnification views of stereocilia from the OHC bundles on the left. The arrows indicate examples of shortened stereocilia. Age of explants: P6 +24 hr.
Figure 1—figure supplement 2
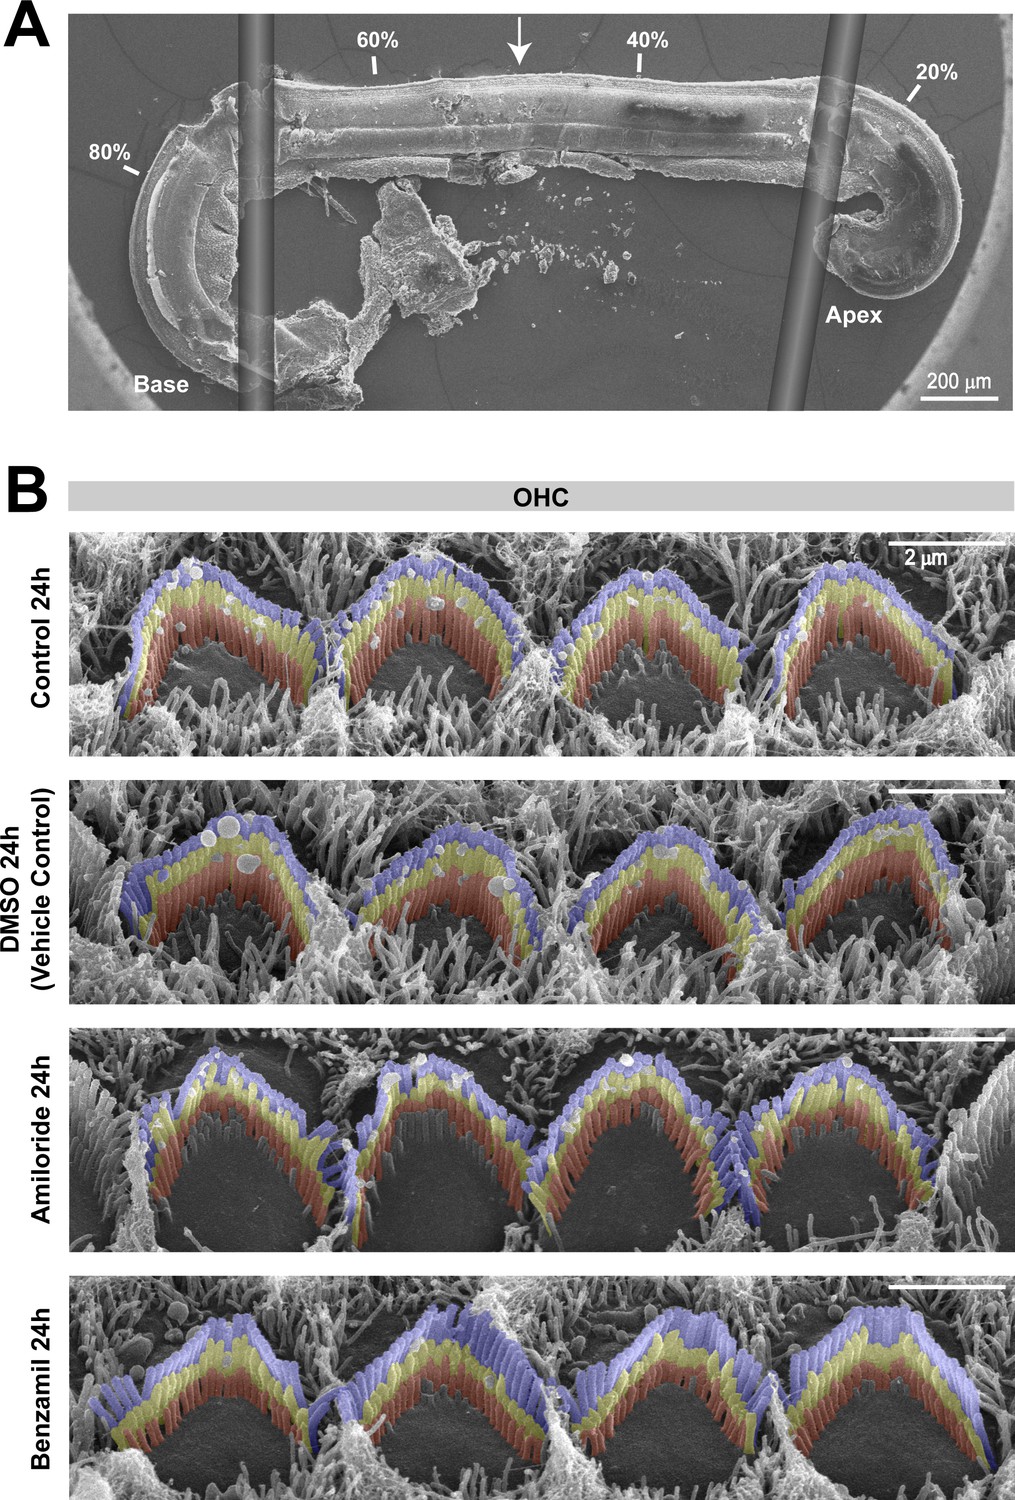
Organ of Corti examinations were limited to the middle cochlear region.
(A) Montage of a representative SEM image of an organ of Corti explant (harvested at P4 and cultured for 30 hr) and two drawings illustrating the flexible glass fibers used to hold the tissue in place during culturing. The percentage distance from the apex is indicated in four locations, and the arrow shows the region where we performed the high-resolution imaging of the hair cell bundles. (B) Representative false-colored SEM images of stereocilia bundles, from the second row of OHCs, after 24 hr incubation in culture medium alone (top) or in the presence of 0.05% of the drug vehicle DMSO (second panel), 100 μM of amiloride (third panel), or 30 μM benzamil (bottom).
Figure 1—figure supplement 3
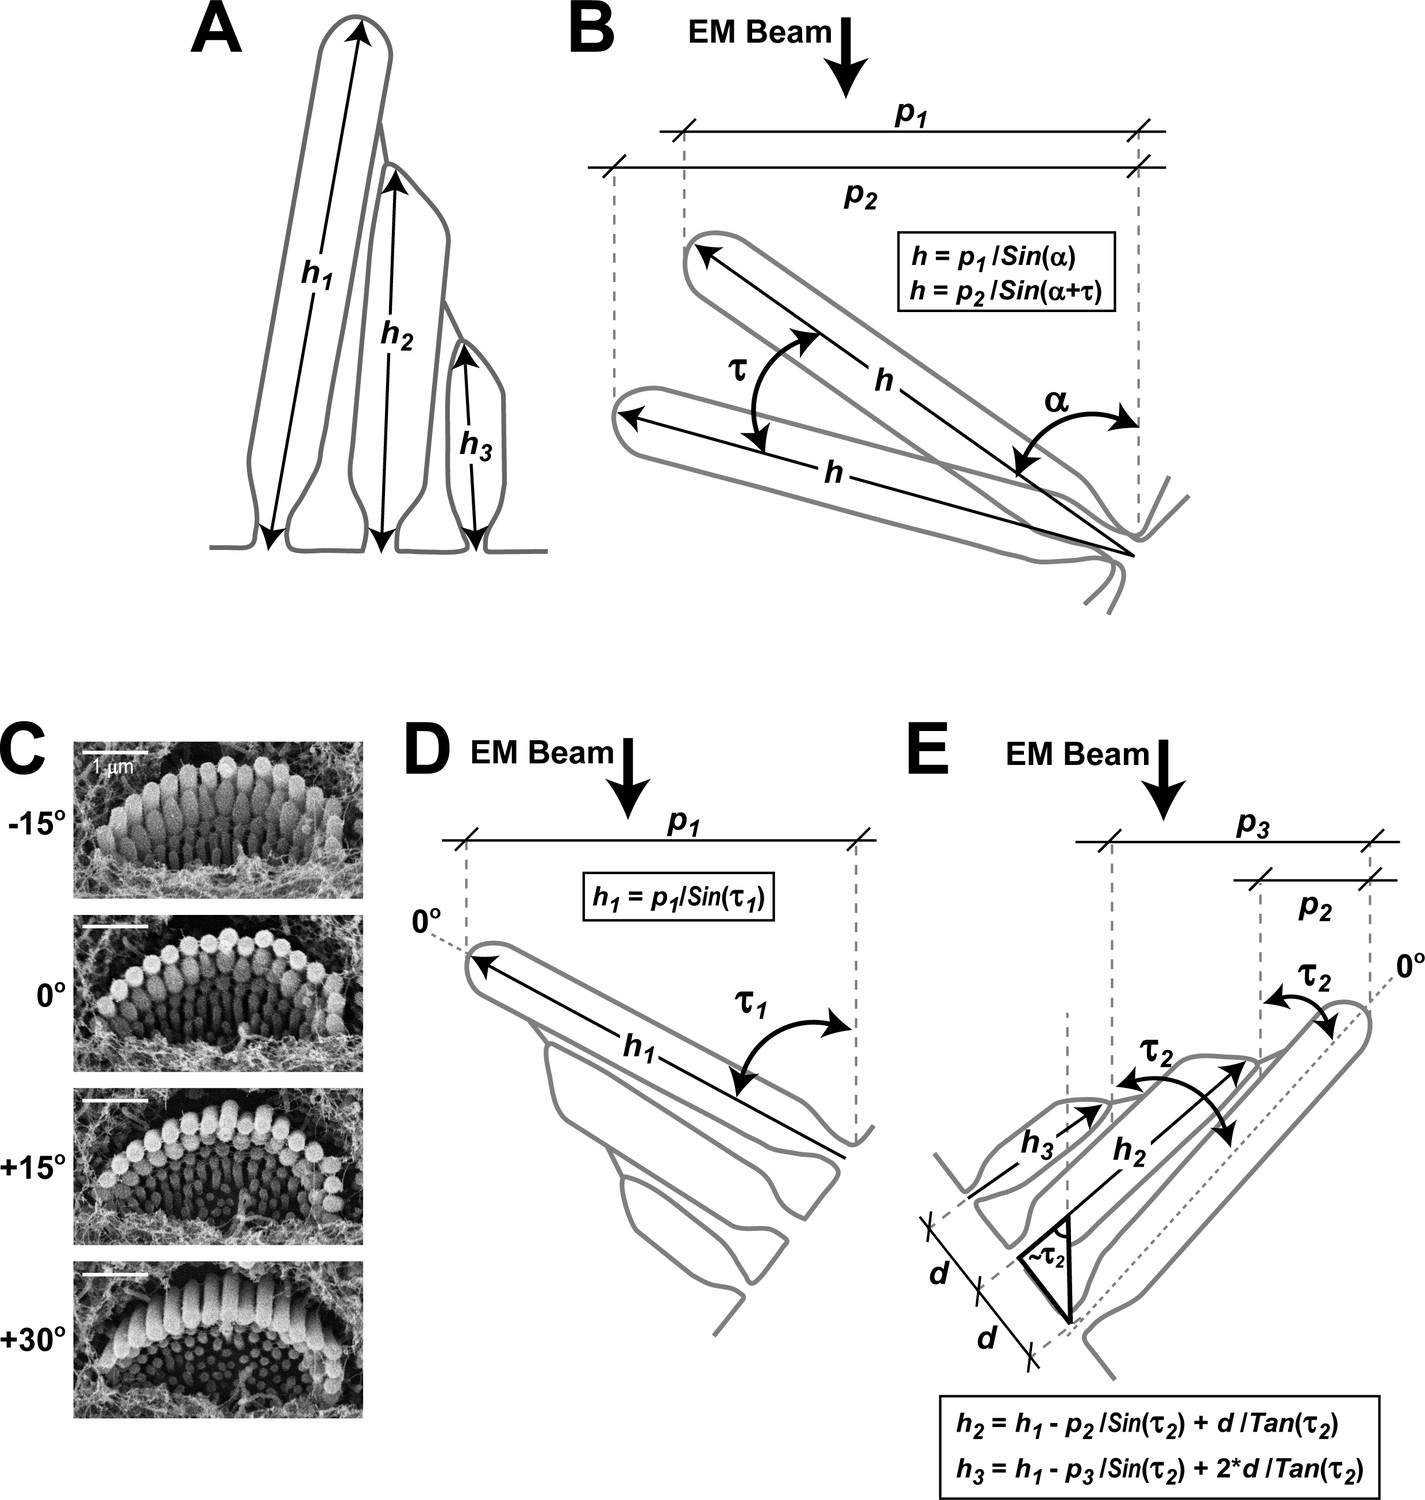
Quantification of stereocilia heights from SEM images.
(A) Schematic diagram illustrating the heights of stereocilia to be determined in the first (h1), second (h2) and third (h3) rows of the bundle. (B) Quantification of the height of a tallest row stereocilium from two projections (p1 and p2) measured in two SEM images of the lateral (‘back’) side of the same hair bundle at different tilt angles separated by τ degrees. The actual height of a stereocilium (h) is calculated by solving the system of two equations shown in the box with two unknown variables (h and α, the initial tilt angle). (C) Alternatively, we acquired several images of the same bundle at different tilt angles to determine the angle at which the tallest row stereocilia are parallel to the EM beam (0° in the illustrated example). (D) Next, we calculated the height of the tallest row stereocilia (h1) using the equation in the box, where p1 is the measured projection and τ1 is the ‘angle of view’, that is, the difference between the tilt angle of the acquired image and the angle where stereocilia are parallel to the beam. The technique illustrated in panel D is less time-consuming than the technique in panel B and, therefore, it was used throughout the study. However, the key measurements of the heights of the tallest row stereocilia in Figure 1D and Figure 2B were reproduced with both measurement techniques that gave identical results. (E) Heights of the second- (h2) and third-row (h3) stereocilia were determined from an image of the medial (‘front’) side of the hair bundle following the equations in the box, where p2 and p3 are the measured projections of height differences between first - second and first - third row stereocilia, τ2 is the known angle of view determined as in panel C, h1 is the height of the tallest stereocilium determined as in panel D, and d is the distance between stereocilia rows at the base. The average value of parameter d was determined from images taken at an angle where stereocilia were parallel to the EM beam.
Figure 2

Blockage of the MET channels causes selective shortening of transducing second- and third-row stereocilia but not the tallest first-row stereocilia in mouse inner hair cells (IHCs).
(A) Representative scanning electron microscopy (SEM) images of IHC stereocilia bundles in mouse organ of Corti explants cultured for 24 hr at 37°C in vehicle control conditions (top), 100 μM of amiloride (middle), or 30 μM of benzamil (bottom). The insets show higher magnification images of the tips of second-row stereocilia. (B) Heights of individual stereocilia in different rows of IHC bundles in mouse organ of Corti explants cultured for 24 hr in control conditions (black; n = 80–91 stereocilia) or in the presence of the MET blockers (gray), amiloride (n = 38–48) or benzamil (n = 55–62). The heights of the tallest stereocilia are similar to those reported for the hamster IHCs at the same age and mid-cochlear location (Kaltenbach et al., 1994). Error bars indicate Mean ± SD. *p<0.05; ****p<0.0001; n.s., non-significant (Welch’s t tests). The data are from a single series of experiments (8–18 cells per treatment) with control and drug-treated explants processed in parallel, representative of one (amiloride) and three (benzamil) independent series. (C) Percentage of the second-row stereocilia with tip links in IHC bundles after 24 hr incubation in control conditions (black, n = 459) or with MET blockers (gray, n = 163–325). The data from two independent series are shown (12–31 cells per treatment) as mean ± SE. n.s., non-significant (Student’s t tests). Age of explants in A-C: P4 +24 hr incubation.
Figure 3
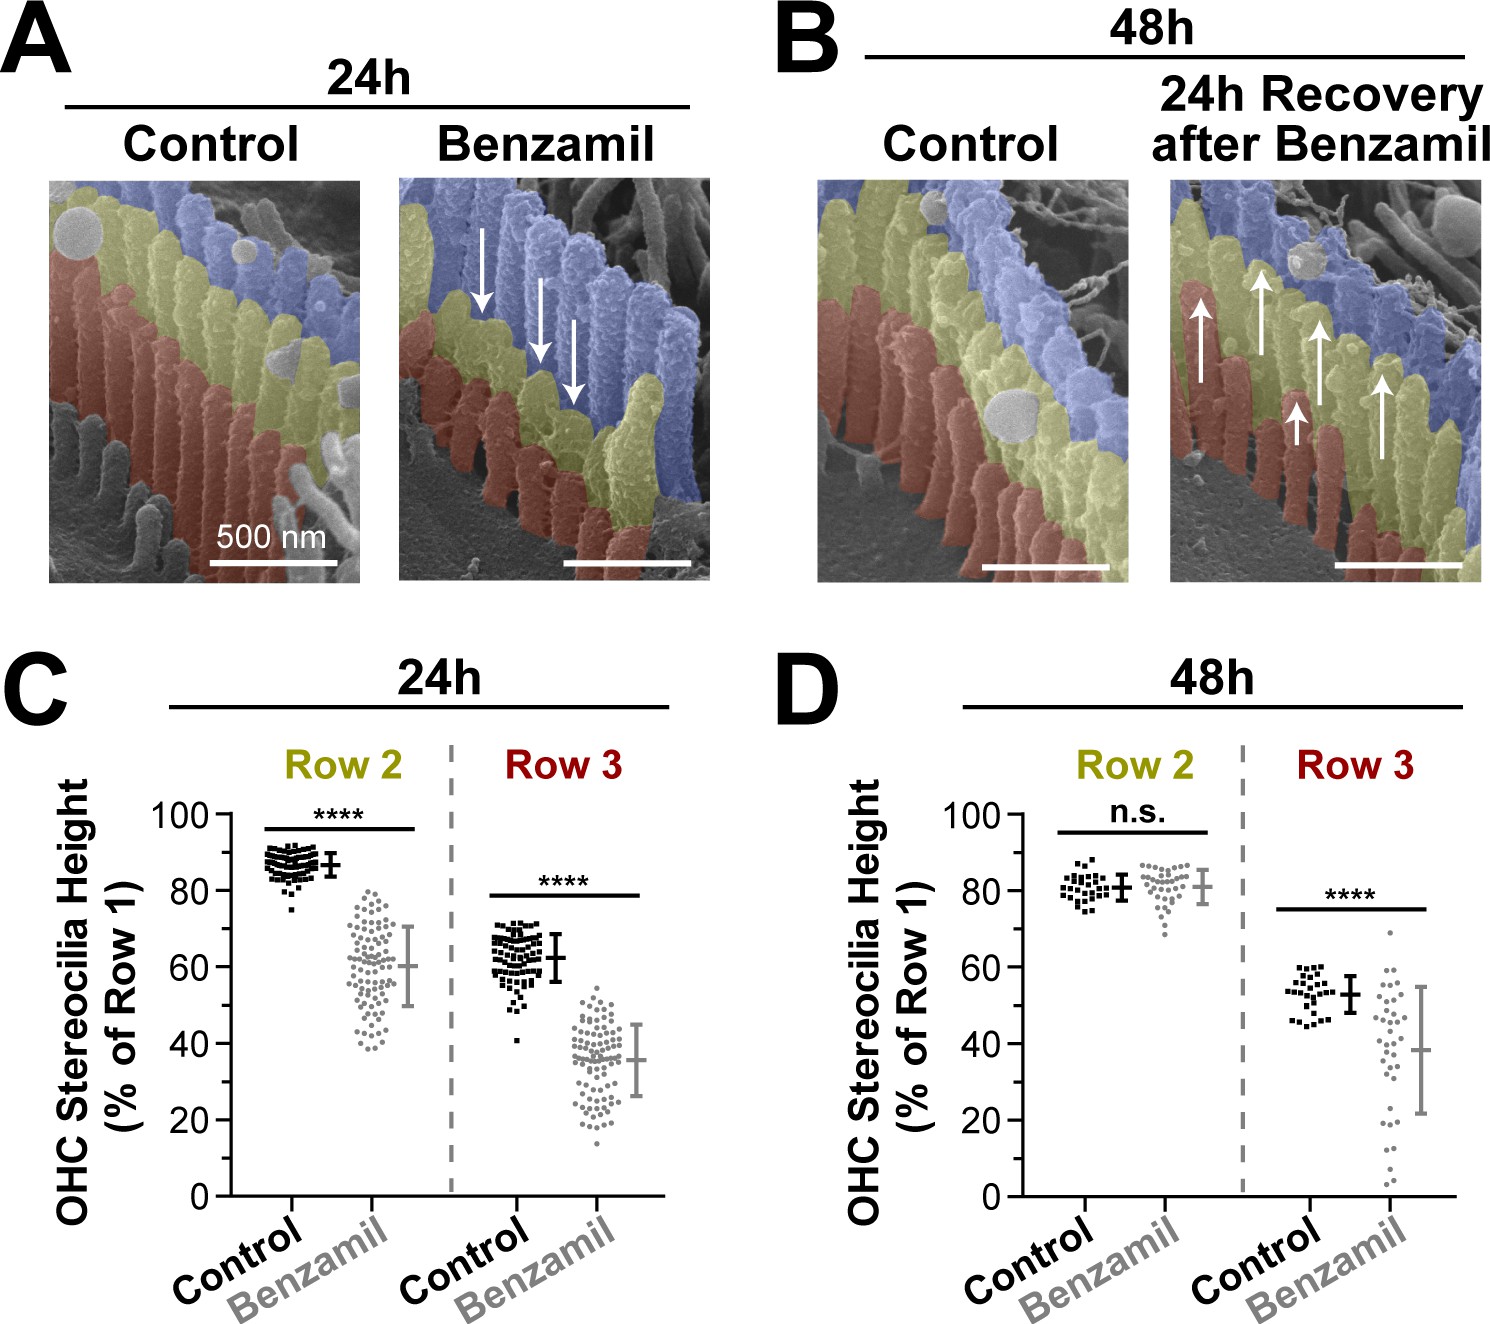
Transducing stereocilia that have retracted due to MET blockage are able to regrow after drug washout.
(A and B) Representative false-colored SEM images of mouse OHC stereocilia after (A) 24 hr incubation either in control conditions (left) or with 30 μM of benzamil (right), and after (B) 24 additional hours of recovery after washout. Arrows down point to retracted stereocilia, while arrows up indicate re-growth. (C and D) Heights of second- and third-row stereocilia after (C) 24 hr incubation in control conditions (black, n = 83) or with benzamil (gray, n = 95), and (D) 24 hr after washout (n = 30, control; n = 38, benzamil). Stereocilia heights are shown as a percent relative to the size of tallest (first) row. Data are from 7 to 16 cells per treatment. Error bars indicate mean ± SD. ****p<0.0001; n.s., non-significant (Welch’s t tests). Age of the explants: P4 +24–48 hr. All incubations were performed at 37°C.
Figure 4 with 1 supplement
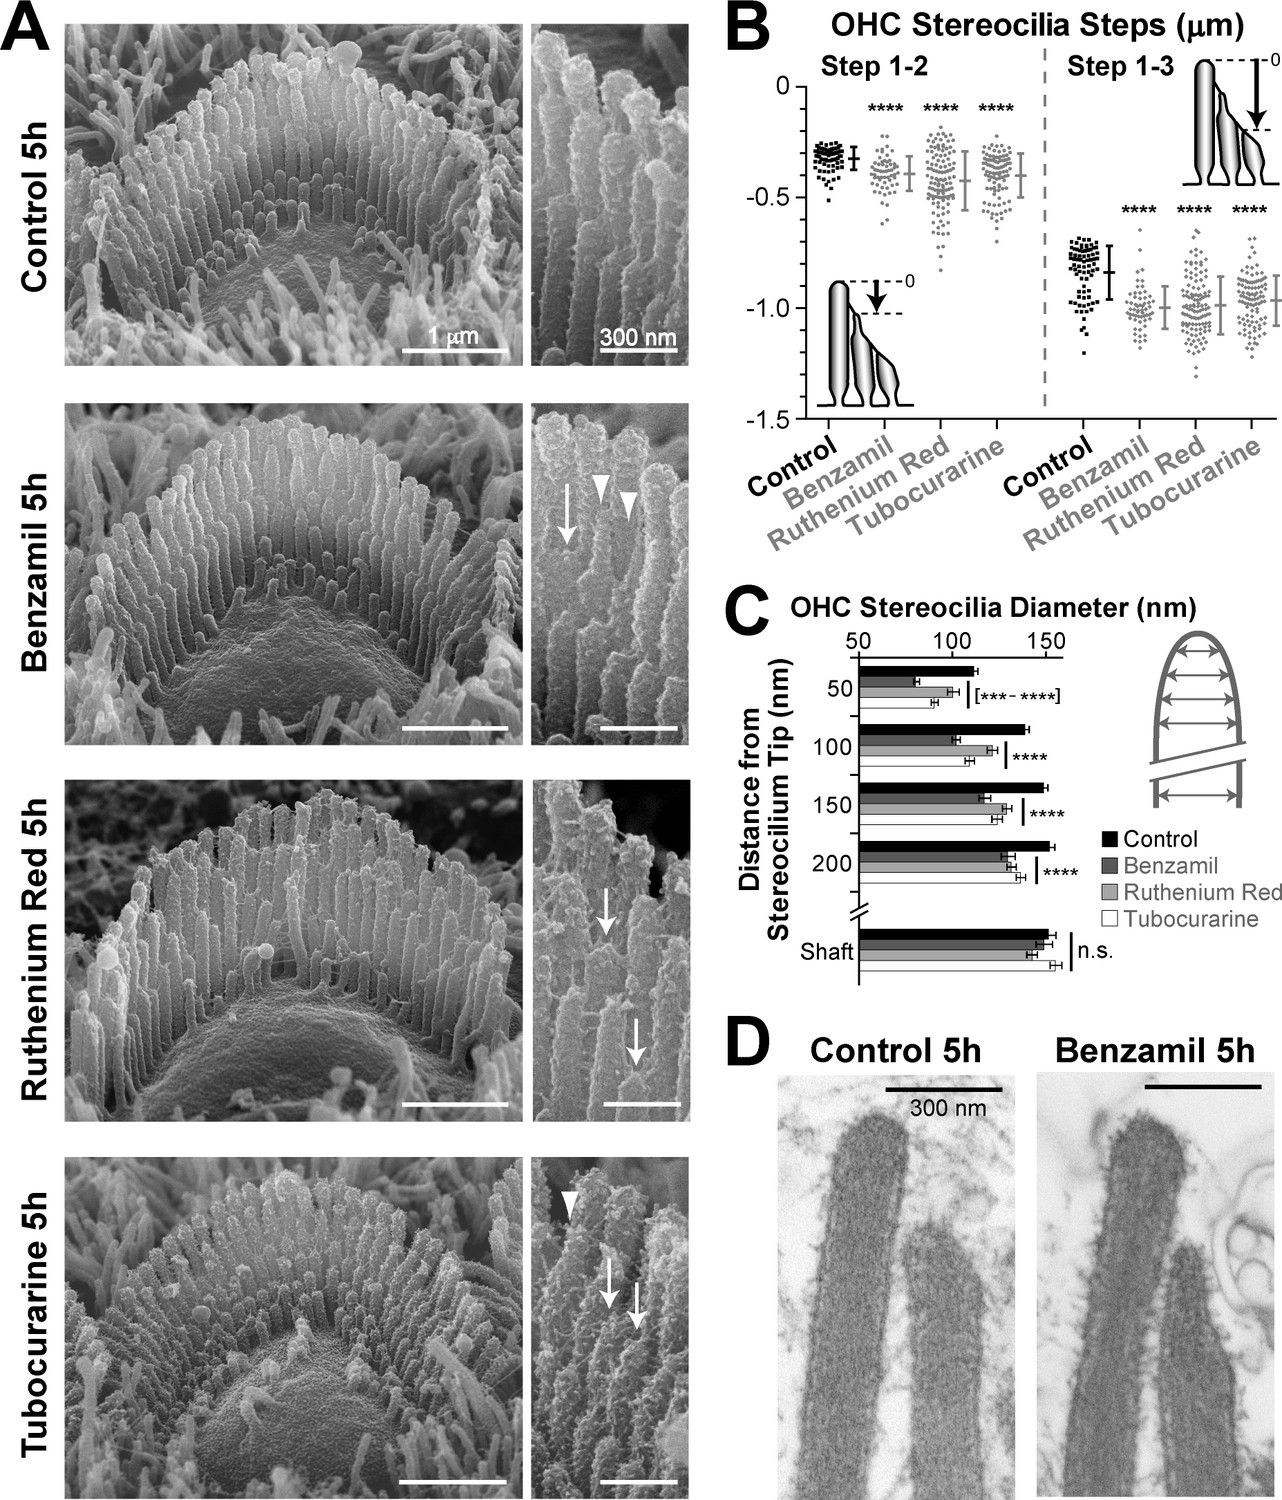
MET-dependent shortening of transducing stereocilia in OHCs initiates with thinning at the tips.
(A) SEM images of mouse OHC stereocilia bundles after incubation at 37°C for 5 hr in vehicle control conditions (top) or in the presence of the MET blockers benzamil (30 μM, second row), ruthenium red (10 μM, third row) or tubocurarine (30 μM, bottom). Right panels show stereocilia at higher magnification; arrows point to retracted stereocilia and arrowheads indicate some examples of thin stereocilia tips. (B) Height differences between first- and second-row stereocilia (Steps 1–2, left) and between first- and third-row stereocilia (Step 1–3, right) in OHC bundles after 5-hr incubation in control conditions (black; n = 76) or with MET blockers (gray, n = 58–117). The inserts show the measurement procedure, which traced each stereocilium to its highest point and did not account for the shape changes at the tips. Data are from 7 to 13 cells per treatment and representative of one (ruthenium red, tubocurarine) and two (benzamil) independent series. Error bars indicate mean ± SD. Note that the staircase ‘step’ measurement procedure requires fewer calculations than the estimation of the absolute height of the stereocilium (as in Figures 1D and 2B) and, therefore, it is more accurate for quantifying smaller changes in the staircase morphology of the bundles (see Figure 1—figure supplement 3C,E). (C) Diameter of second-row stereocilia at the shaft and at several positions near the stereocilia tip in OHCs after a 5-hr incubation in control conditions (black, n = 40) or with MET blockers: benzamil (dark grey, n = 44), ruthenium red (light grey, n = 42) or tubocurarine (white, n = 36). Data are from 3 to 5 cells per treatment and are shown as mean ± SE. For B and C: ***p<0.001; ****p<0.0001; n.s., non-significant (Welch’s t tests). (D) Representative transmission electron microscopy (TEM) images of the upper part of first- and second-row stereocilia from mouse OHCs after incubation for 5 hr in control conditions (left) or in the presence of 30 μM benzamil (right). Notice the actin filaments within the abnormally thin tips of second-row stereocilia after treatment with benzamil. Age of the explants in A–D: P4-5.
Figure 4—figure supplement 1
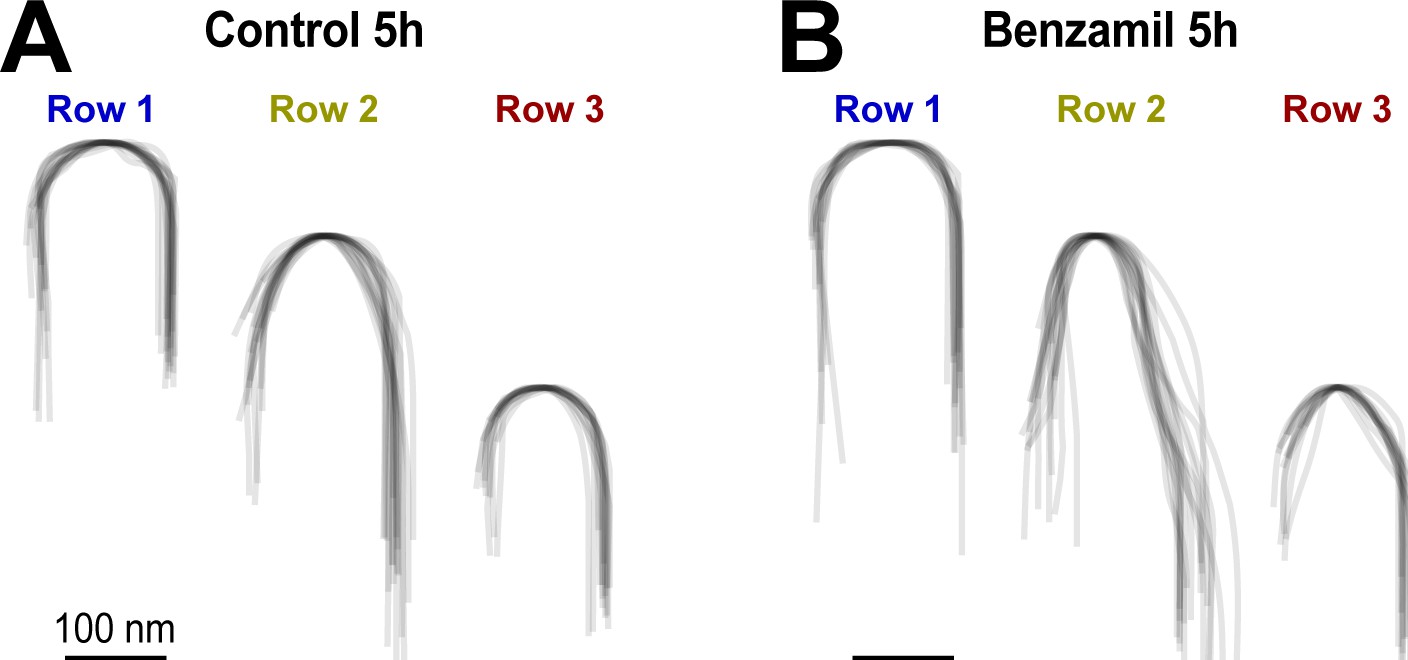
MET current regulates the shape of the tips of transducing stereocilia in OHCs.
(A and B) Superimposed contours of OHC stereocilia tips (n = 14–18 individual stereocilia per each cartoon, each represented by a thin grey line) from organ of Corti explants cultured for 5 hr in control conditions (A) or in the presence of 30 μM of benzamil (B). Notice that the blockage of MET channels by benzamil leads to changes in the tip shape of second- and third-row stereocilia (i.e transducing stereocilia), while the tip shape of the non-transducing first-row stereocilia remains unchanged. The contours were derived from SEM images of OHCs (at the same mid-cochlear location and the same angle of view) and were aligned to the point at the very tip to reveal the differences in tip shapes.
Figure 5
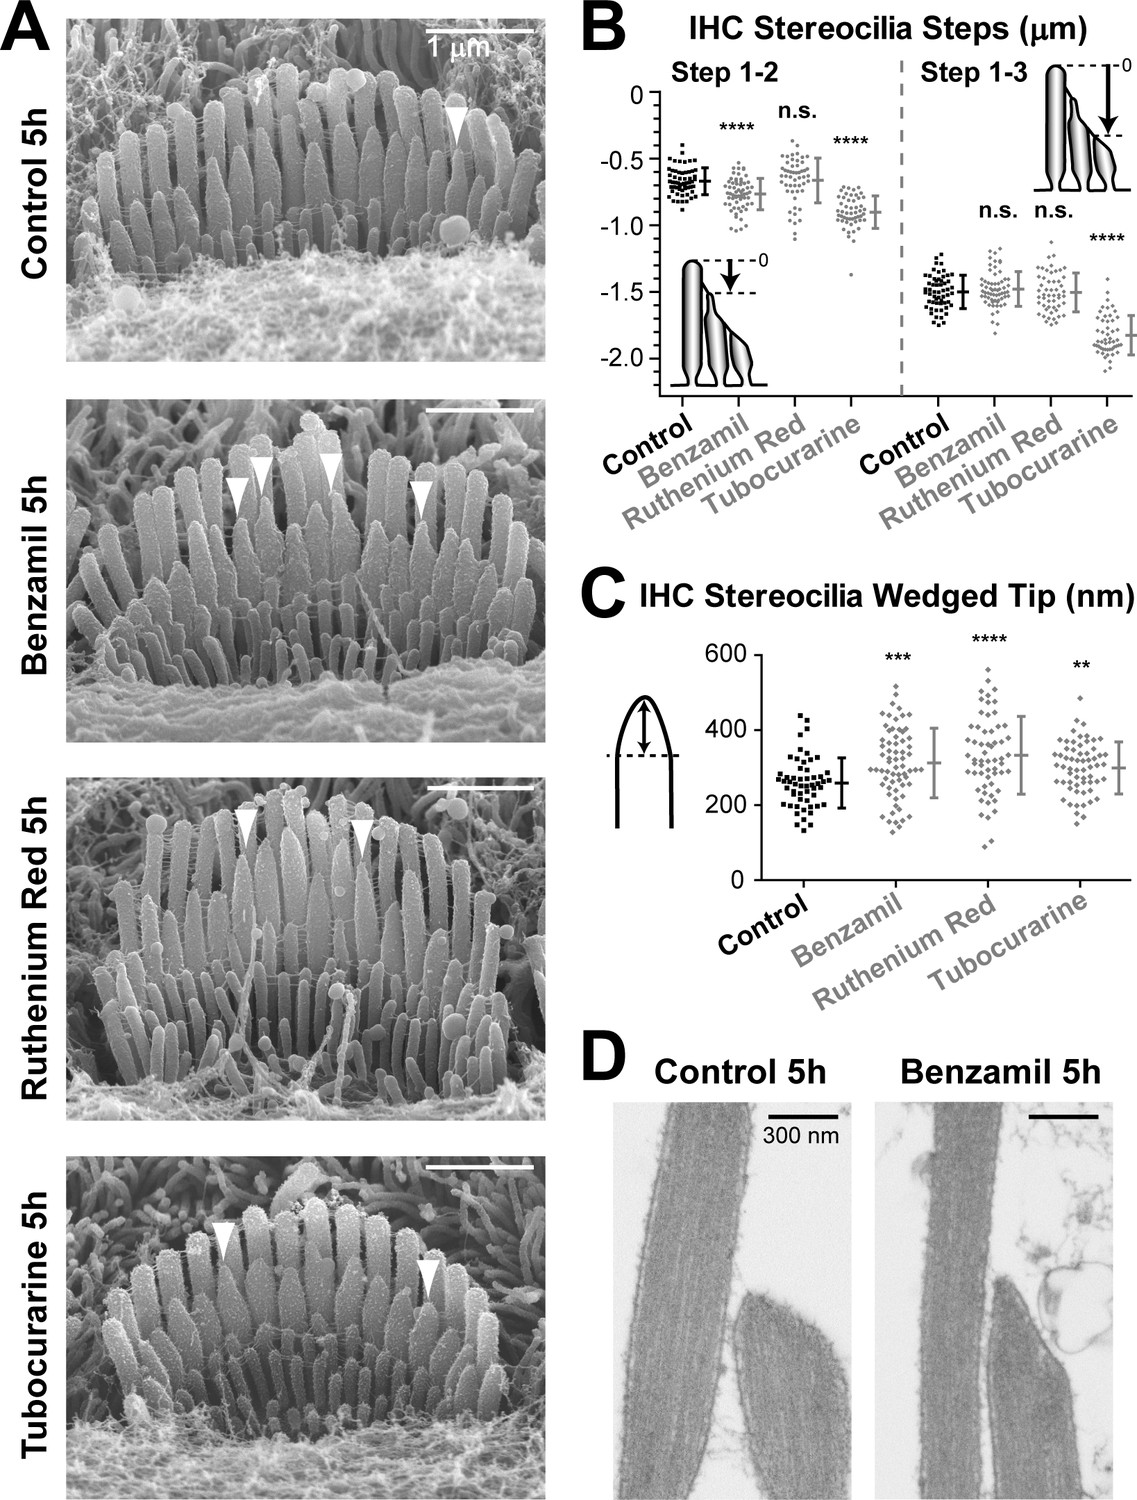
MET current regulates the shape of transducing stereocilia in IHCs.
(A, B) Representative SEM images (A) and quantification of height differences between stereocilia rows (B) of IHC stereocilia bundles after incubation at 37°C for 5 hr in vehicle control conditions or in the presence of MET blockers: benzamil (30 μM), ruthenium red (10 μM) or tubocurarine (30 μM). Panel layouts are identical to Figure 4A,B. (B) Staircase ‘step’ measurements: control (n = 57), benzamil (n = 62), ruthenium red (n = 52), and tubocurarine (n = 51). Data are from 8 to 12 cells per treatment. (C) Heights of the wedged tips (left cartoon) from individual IHC stereocilia in the second row of the bundle after incubation for 5 hr in vehicle control conditions (black, n = 54) or in the presence of MET blockers (gray, n = 59–66). Data are from 3 to 5 cells per treatment. In B and C: Error bars indicate mean ± SD. **p<0.01; ***p<0.001; ****p<0.0001; n.s., non-significant (Welch’s t tests). Age of explants in all panels: P4-5. (D) Representative TEM images of the tips of second-row stereocilia in IHCs after incubation for 5 hr in vehicle control conditions (left) or in the presence of 30 μM of benzamil (right).
Figure 6 with 1 supplement
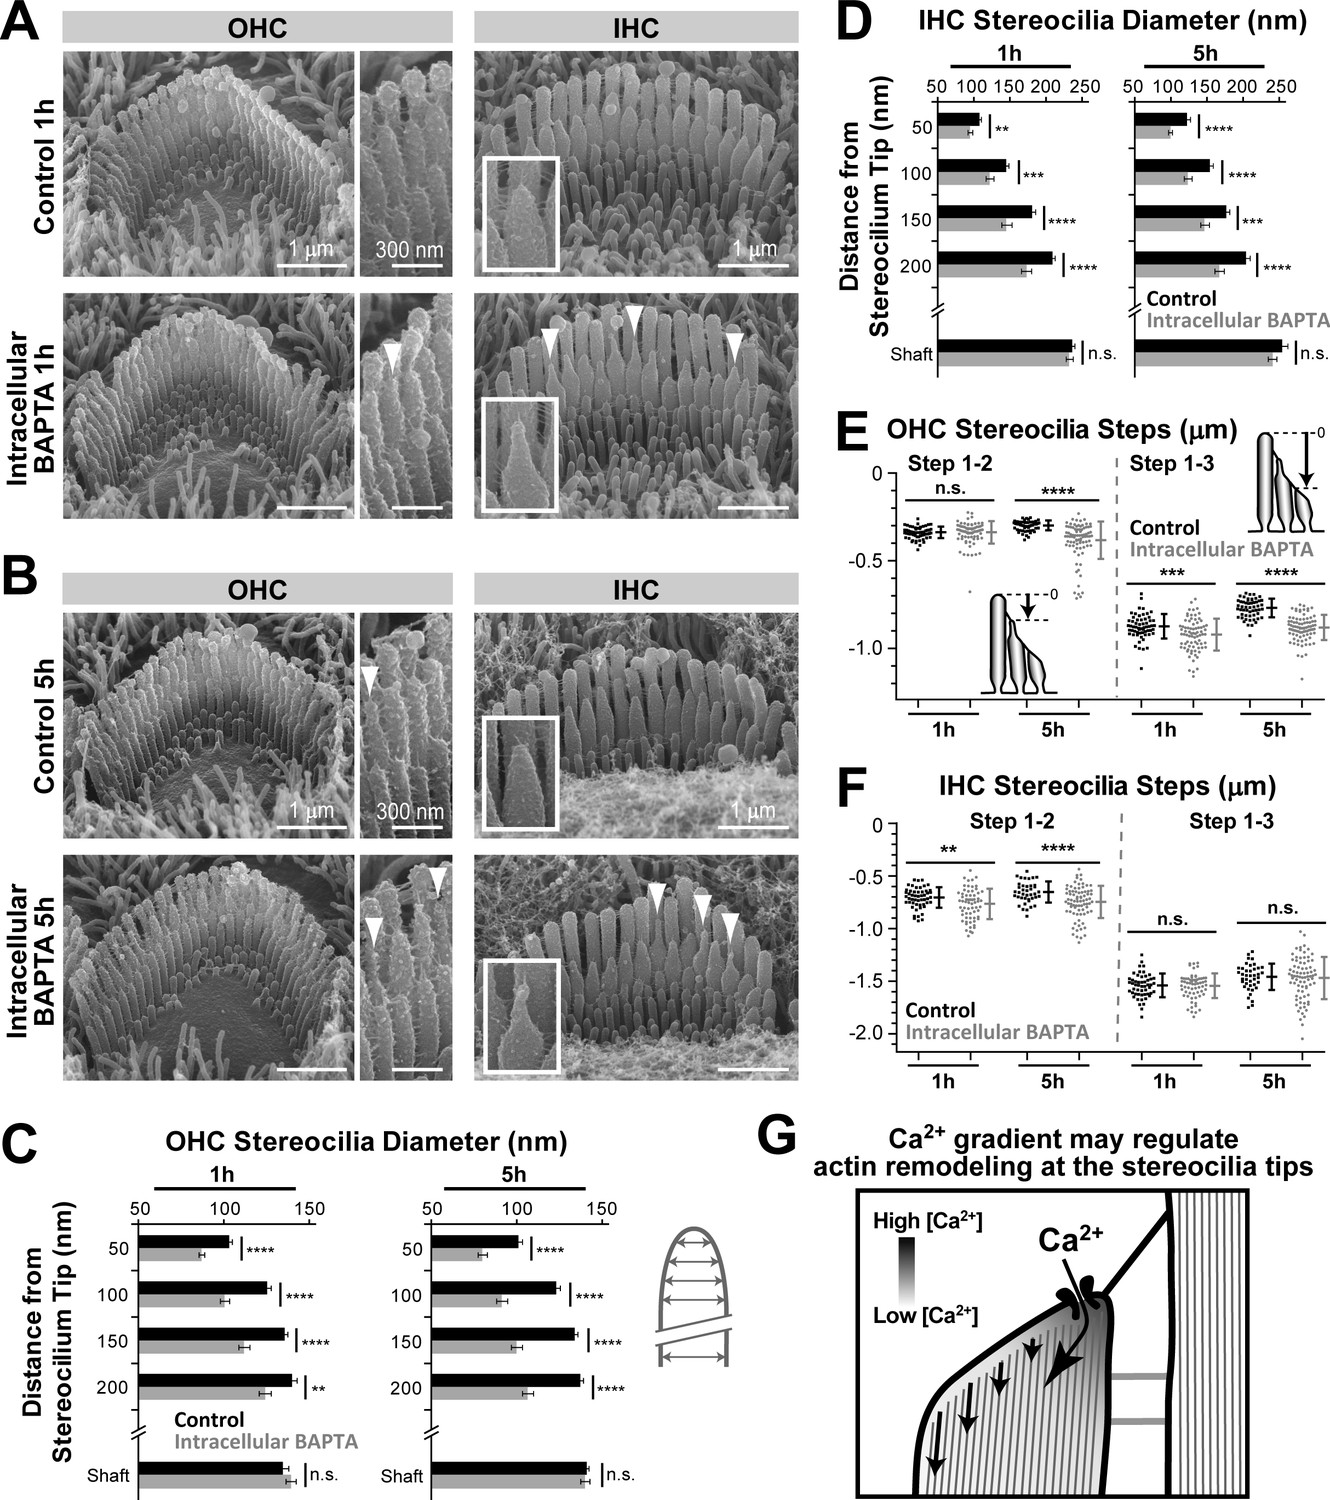
Increased intracellular Ca2+ buffering leads to thinning and shortening of transducing stereocilia in mouse auditory hair cells.
(A and B) SEM images of mouse OHC (left and middle) and IHC (right) stereocilia bundles after incubation for 1 hr (A) or 5 hr (B) at 37°C in vehicle-control conditions (top) or in the presence of 20 μM of the membrane-permeable BAPTA-AM (bottom). Middle panels and insets show higher magnification images of OHC and IHC stereocilia, respectively. Arrowheads indicate examples of stereocilia with abnormally thin tips. (C and D) Stereocilia diameter at the shaft and at several regions near the tip in second-row stereocilia from OHCs (C) and IHCs (D) cultured in vehicle-control conditions (black) or with BAPTA-AM (gray) for 1 hr or 5 hr (n = 41–47). Data are from 3 to 4 cells per treatment and are shown as mean ± SE. (E and F) Height differences between the first and second (left), and first and third (right) rows of stereocilia in OHCs (E) or IHCs (F) cultured in vehicle-control conditions (black, n = 54–60, OHCs; n = 40–52, IHCs) or with BAPTA-AM for 1 hr or 5 hr (gray; n = 78–85, OHCs; n = 64–79, IHCs). Insert cartoons in E clarify that we measured the length of a stereocilium to its highest point and did not account for the shape changes at the tips. Data are from 8 to 10 cells per treatment. Error bars indicate mean ± SD. For C–F: Data shown are from a single series of experiments, representative of three independent series. **p<0.01; ***p<0.001; ****p<0.0001; n.s., non-significant (Welch’s t tests). Age of explants in A–F: P4 plus 1 or 5 hr of culturing. (G) Schematic diagram illustrating the intracellular Ca2+ gradient at the tip of a transducing stereocilium. Higher Ca2+ concentrations near the MET channel might prevent actin remodeling, while actin filaments further away from the channel might be more susceptible to depolymerization or other types of remodeling due to low Ca2+ concentration.
Figure 6—figure supplement 1
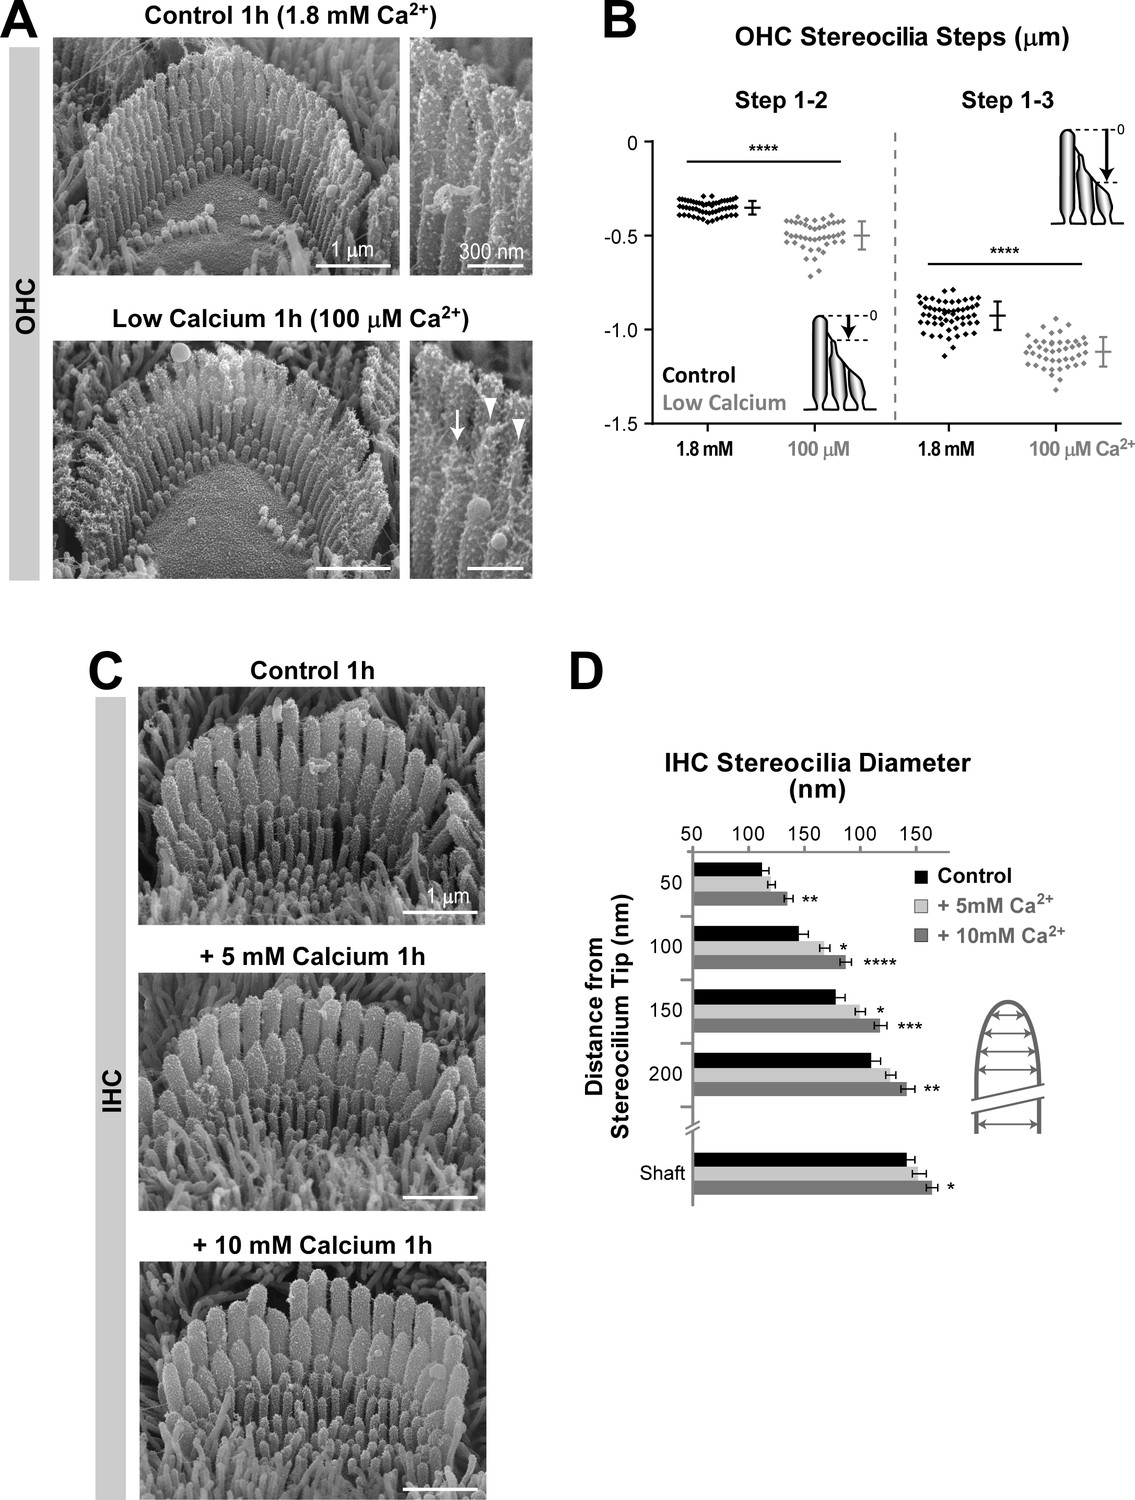
Remodeling of transducing stereocilia initiated by changes in extracellular Ca2+ concentration.
(A) SEM images of OHC stereocilia bundles after 1 hr incubations in control DMEM with 1.8 mM CaCl2 (top) or in BAPTA-buffered DMEM to lower the Ca2+ concentration to ~ 100 μM (bottom). Right panels show higher magnification images of OHC stereocilia. Arrows point to shortened stereocilia and arrowheads to stereocilia with abnormally thin tips. (B) Height differences between stereocilia rows (as indicated in the cartoons) from OHCs incubated for 1 hr in normal (black, n = 55) or low (gray, n = 44) Ca2+ conditions. Data are from 3 to 7 cells per treatment. Error bars indicate mean ± SD. (C) SEM images of IHC stereocilia bundles after incubations for 1 hr in normal cell culture medium (top) or supplemented with 5 mM (middle) and 10 mM (bottom) CaCl2. (D) Diameter of second-row stereocilia at the shaft and at several regions near the tip from IHCs cultured in control conditions (black, n = 17) or in high extracellular Ca2+ (light and dark gray, n = 19–25). Data are from 2 to 3 cells per treatment and shown as mean ± SEM. For B and D: *p<0.05; **p<0.01; ***p<0.001; ****p<0.0001 (Welch’s t tests). Age of explants: P4 + 1 hr in culture at 37°C.
Figure 7 with 1 supplement

Disruption of tip links leads to remodeling of the transducing shorter row stereocilia.
(A) Representative false-colored SEM images of OHC stereocilia bundles in mouse organ of Corti explants incubated in control conditions for 1 hr (top), immediately after treatment with BAPTA-buffered Ca2+-free solution for 15 min (second panel), and after 1 hr (third panel) and 6 hr (bottom) recovery in Ca2+-containing culture medium. Panels on the right show OHC stereocilia at higher magnification. The arrows point to shortened or regrown stereocilia. (B and C) Absolute heights of individual stereocilia in the first row (B), and relative heights of the second (left) and third (right) rows (C), in mouse OHC bundles at different times of recovery after BAPTA (gray) or in control conditions (black). Error bars indicate mean ± SD. ****p<0.0001; n.s., non-significant (Welch’s t tests). Data are from 6 to 11 cells per time point and representative of two independent series. (D) SEM images of representative mouse IHC bundles before (top left), immediately after treatment with BAPTA-buffered Ca2+-free medium for 15 min (top right), and after recovery periods of 15 min (bottom left) and 7 hr (bottom right). Insets show higher magnification views of the tips of second-row stereocilia. (E) The height of the wedged tips (left cartoon) of second-row stereocilia (green) and the percentage of tip links (magenta) before (Control) and at 0 min, 10 min and 7 hr of recovery after treatment with BAPTA. Quantifications of the wedged tip size and number of tip links were performed in the same IHCs. n = 33–105 stereocilia (from 4 to 12 cells) per time point. Pooled data from seven independent series, shown as mean ± SE. *p<0.05; ****p<0.0001 (Student’s t tests). Age of explants: P4.
Figure 7—figure supplement 1
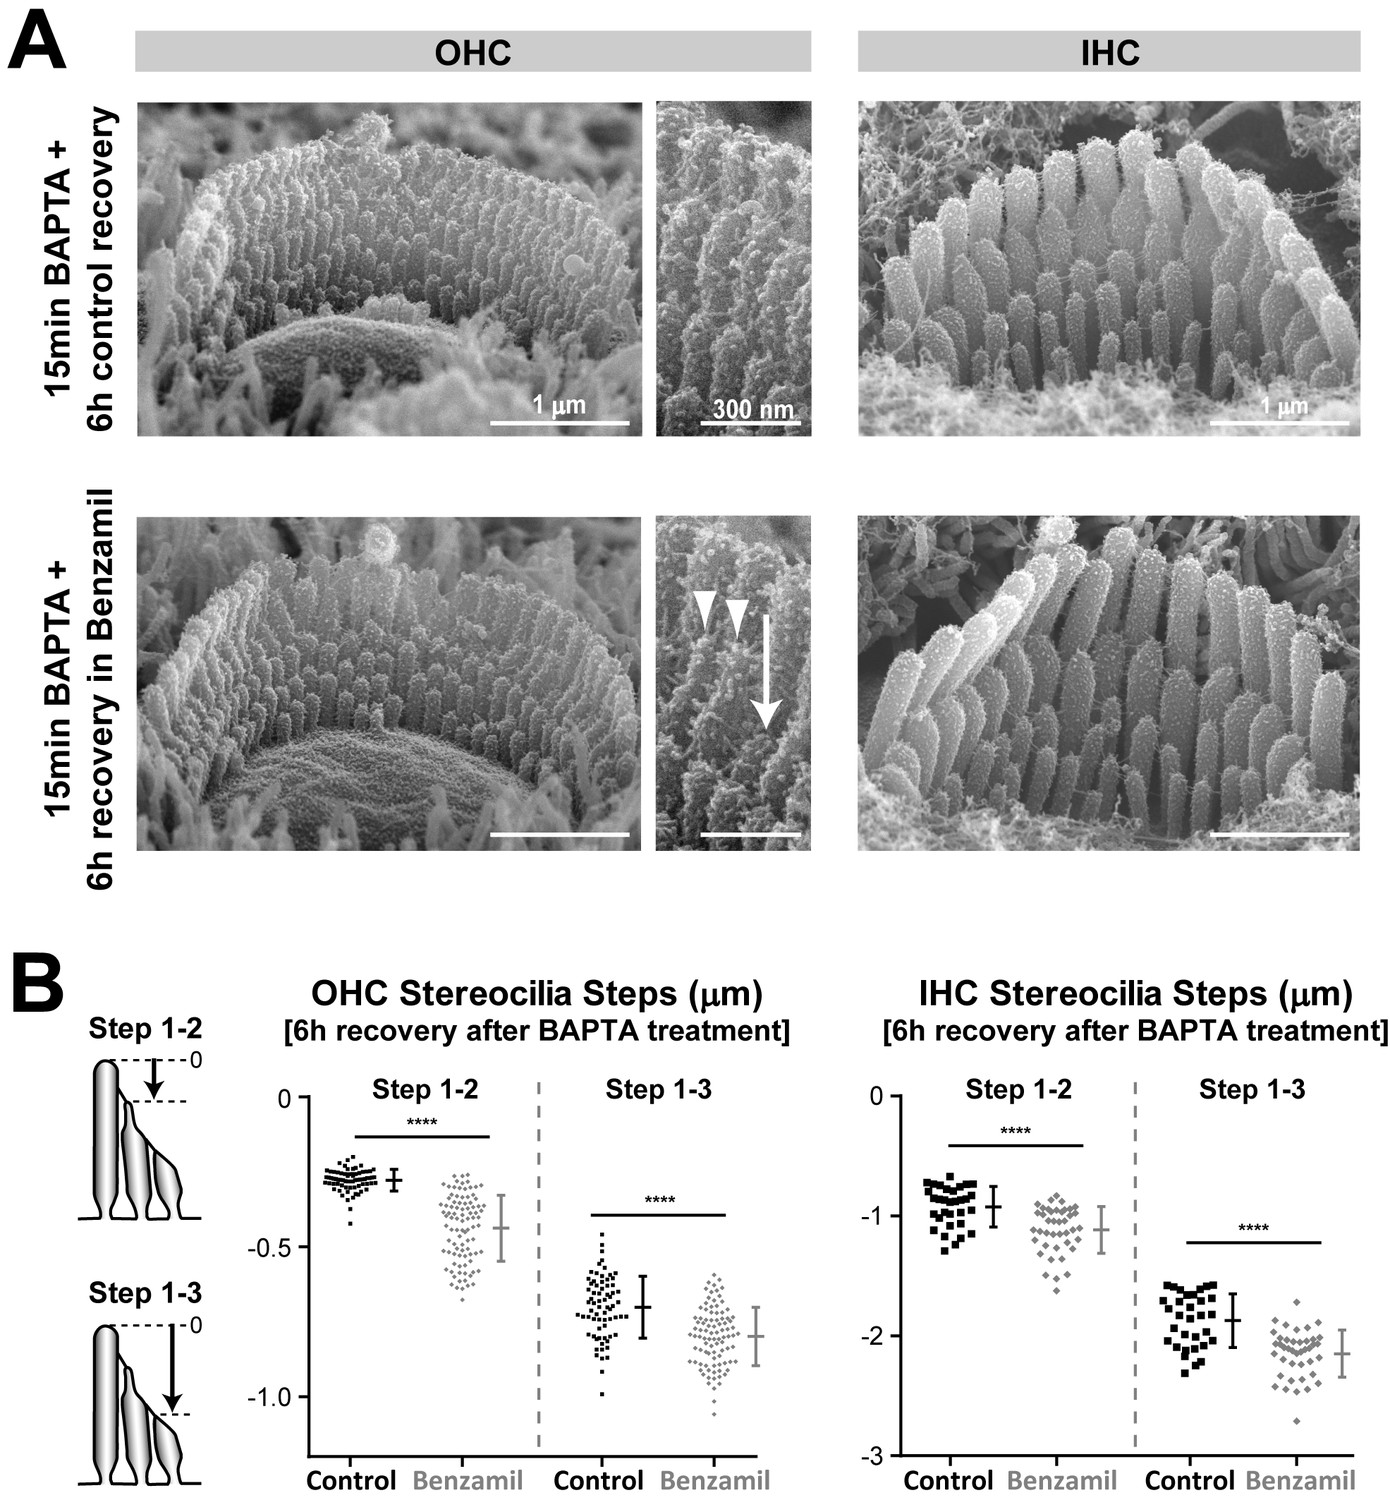
Regrowth of stereocilia after tip link regeneration is inhibited by MET current blockage.
(A) Representative SEM images of mouse OHC (left and middle) and IHC (right) bundles that were treated with BAPTA-buffered Ca2+-free extracellular solution for 15 min and allowed to recover for 6 hr in Ca2+-containing medium in the absence (top) or presence (bottom) of the MET channel blocker benzamil (30 μM). Middle panels show higher magnification views of OHC stereocilia from the bundles on the left. The arrow indicates a stereocilium that was unable to re-grow, and the arrowheads point to two stereocilia that exhibit abnormally thin ‘pointed’ tips. (B) Quantification of height differences between first- and second-row stereocilia (Steps 1–2) and between first- and third-row stereocilia (Steps 1–3) in OHC (left) and IHC (right) bundles in the absence (black, n = 32–70) or presence (grey, n = 41–93) of the MET channel blocker benzamil (30 μM). The cartoons on the left show the measurement procedure. Data are from 5 to 6 cells per treatment. Age of explants: P4.
Download links
A two-part list of links to download the article, or parts of the article, in various formats.
Downloads (link to download the article as PDF)
Open citations (links to open the citations from this article in various online reference manager services)
Cite this article (links to download the citations from this article in formats compatible with various reference manager tools)
Mechanotransduction current is essential for stability of the transducing stereocilia in mammalian auditory hair cells
eLife 6:e24661.
https://doi.org/10.7554/eLife.24661


