The interactome of the copper transporter ATP7A belongs to a network of neurodevelopmental and neurodegeneration factors
- Emory University, United States
- School of Biological Sciences, Illinois State University, United States
- Agnes Scott College, Georgia
- University of Arkansas for Medical Sciences, United States
- University of Missouri, United States
- Rollins School of Public Health, Emory University, United States
Figures
Figure 1

Isolation of ATP7A interactome.
(A) In SH-SY5Y neuroblastoma cells, the addition of increasing amounts of copper leads to an increase of ATP7A at the cell surface as measured by surface biotinylation followed by streptavidin pull-down (lanes 1’−4’), while the total levels of ATP7A remain unchanged (lanes 1–4). Transferrin receptor shows consistent surface expression regardless of copper addition (lanes 1’−4’). The cytosolic chaperone Hsp90 was used to assess the selectivity of streptavidin pulldowns (B) The monoclonal ATP7A antibody used in these studies recognizes a single band by immunoblot. This band is missing in ATP7A null human Menkes fibroblasts (lane 2). (C1–C4) Experimental designs to isolate ATP7A interactomes. ATP7A immunoaffinity chromatography was performed in two cell types, SH-SY5Y cells (C1-2) and human skin fibroblasts (C3-4). In the former, left, SH-SY5Y cells were incubated with either 400 μM BCS (C1), a copper chelator, or 200 μM CuCl2 for 2 hr (C2). Cells were crosslinked with DSP, cell extracts were immunoprecipitated with the monoclonal ATP7A antibody either in the absence or presence of 22 μM ATP7A antigenic peptide. The same peptide was used to elute samples, which were then analyzed by label free quantitative mass spectrometry or silver stain (D). C3-4, ATP7A immunoaffinity chromatography was performed in ATP7A-null human skin fibroblasts (C3) as well as the same cells recombinantly expressing ATP7A (C4). The experiment was performed as in SH-SY5Y cells, with the exception of the ATP7A antigenic peptide being omitted for outcompetition. (D) Silver stain from ATP7A immunoprecipitation depicted in (C) except that immunocomplexes were eluted with Laemmli sample buffer. Immunoprecipitations were performed for BCS-treated (lanes 1–3) and CuCl2 treated (lanes 1’−3’) SH-SY5Y cell extracts. Asterisks indicate immunoglobulin G chains, and densitometry profiles show differential protein enrichment in samples immunoprecipitated with (lanes 3 and 3’, black traces) and without (lanes 2 and 2’, blue traces) the antigenic ATP7A peptide. Below are immunoblots performed in parallel revealing positive identification of ATP7A and known interacting partner dopamine beta hydroxylase (DBH).
Figure 2
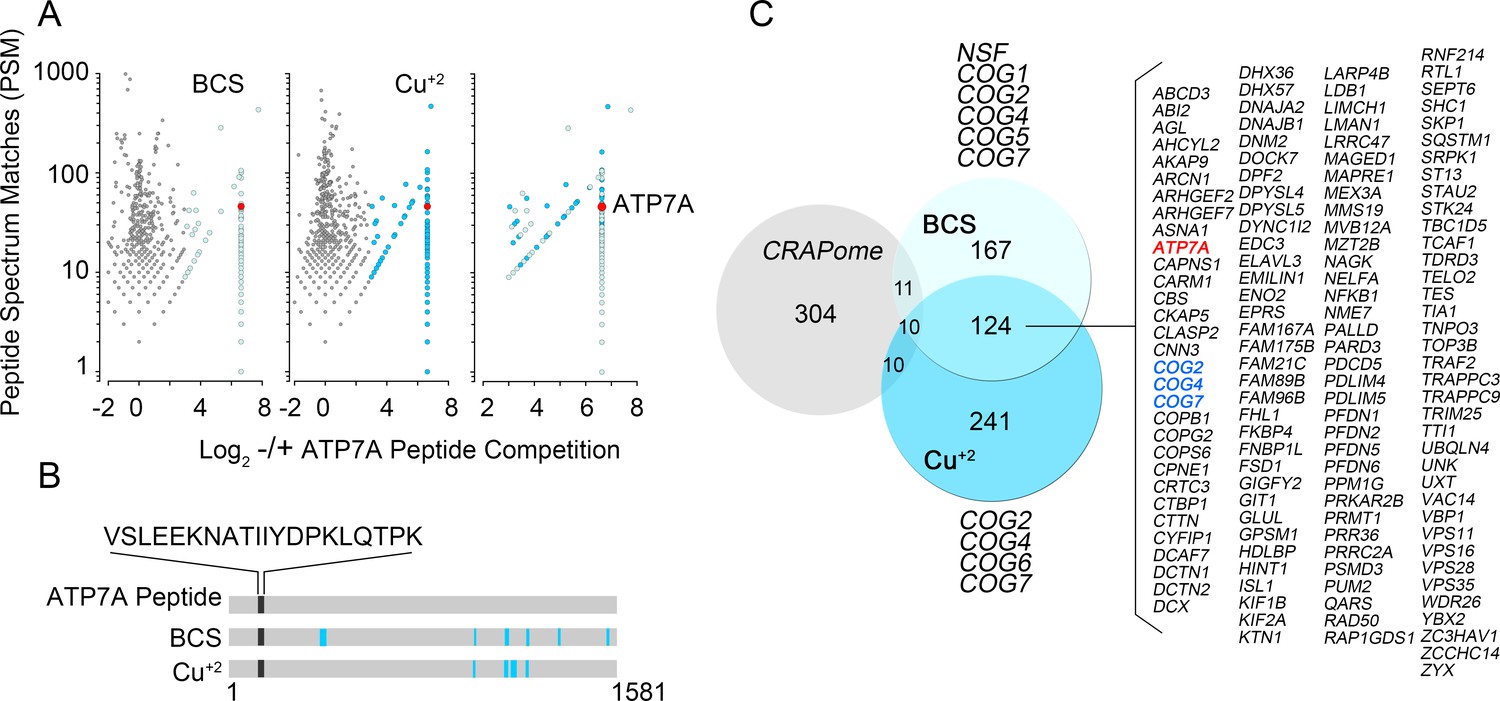
Identification of ATP7A interactome components by mass spectrometry.
(A) Peptide spectrum matches (PSM) from quantitative mass spectrometry of proteins co-isolating with ATP7A are plotted for cells incubated with copper chelator BCS (left), CuCl2 (middle), and peptides identified in both samples (right). Blue dots represent peptides that were enriched 2-fold over negative control samples incubated with an antigenic ATP7A peptide. (B) ATP7A peptides identified by mass spectrometry. Peptides corresponded to the antigenic peptide sequence shown above the black line as well as other ATP7A peptides identified via mass spectrometry (blue lines). (C) Five hundred and forty one proteins co-isolated with ATP7A, one hundred thirty four of which were present regardless of cellular copper status are listed. Three COG subunits were present in both BCS and copper-treated samples (blue text), the other three subunits were found either in BSC or copper-treated samples. Curation with a dataset from the CRAPome reveals minimal overlap.
Figure 3
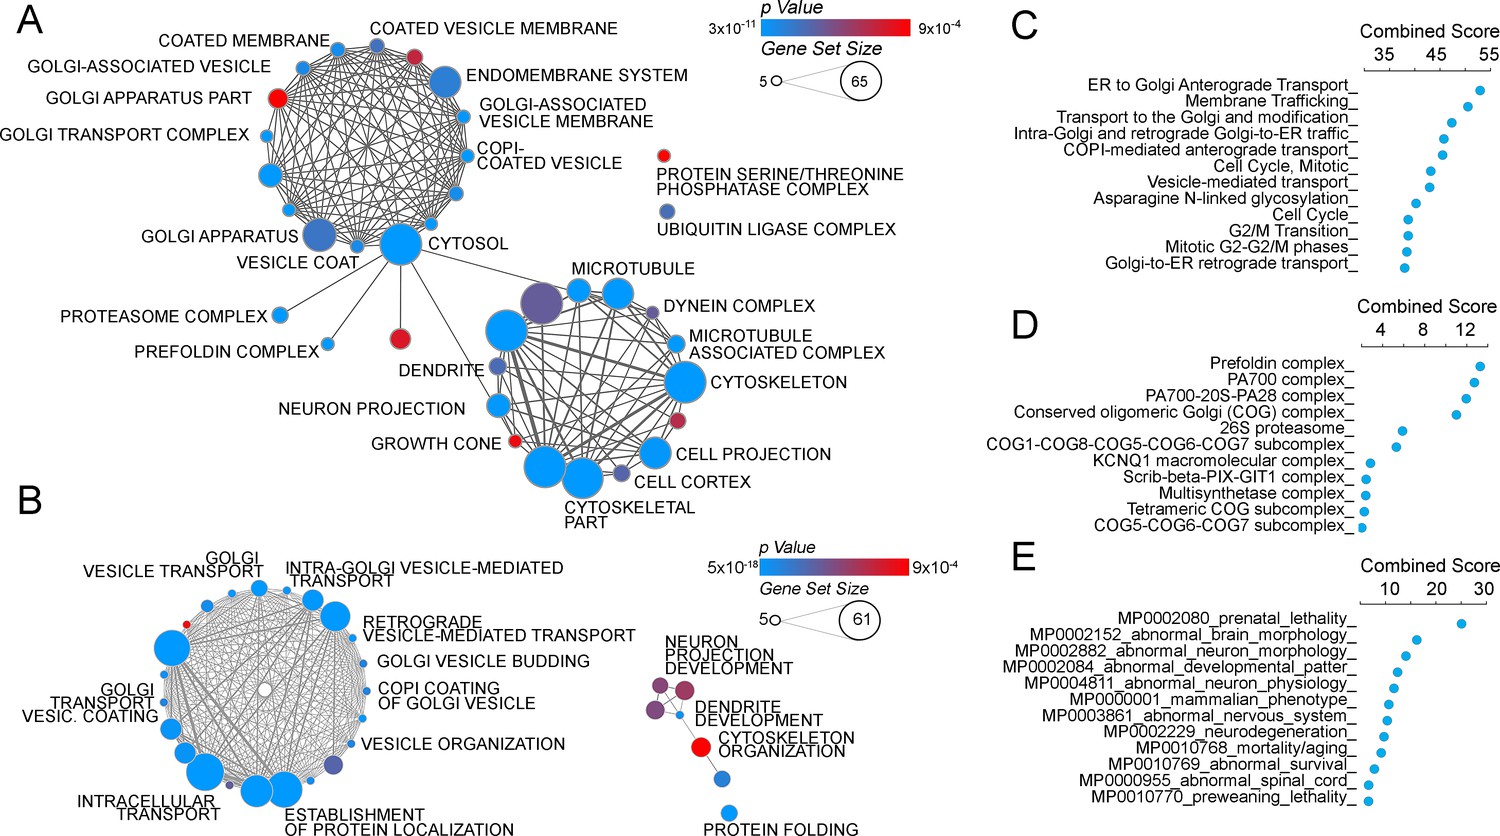
The ATP7A interactome enriches gene products implicated in Golgi function and neuropathologies.
(A–B) The gene ontology algorithm DAVID was used to analyze the ATP7A interactome using the GO Terms Cellular Component (A) and Biological Process (B). Size of the circles increases with gene set size, and p-values are represented by colors ranging from blue (p=3×10⁻¹¹) to red (p=9×10⁻⁴). Lines connecting circles depict ontology categories with shared gene products. (C–F) The ATP7A interactome was also evaluated using ENRICHR algorithm, to characterize dataset enrichment in GO Term Biological Process (C), protein complexes from the CORUM database (D), and phenotypes in mice (E). Significance is represented as a combined score (z-score x -log(p-value)).
Figure 4
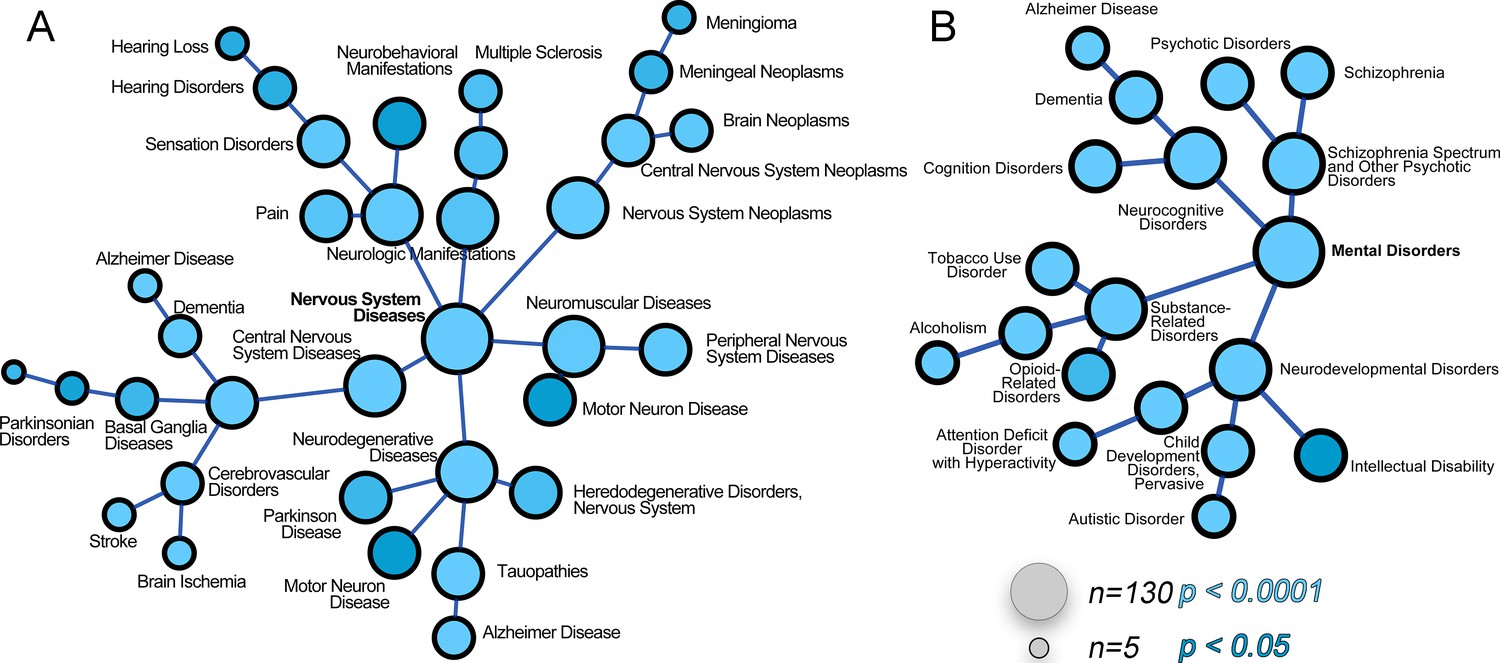
The ATP7A interactome enriches gene products associated with nervous system diseases and mental disorders.
(A–B) The ATP7A interactome was analyzed using the GDA bioinformatics tool, which derives disease-gene links from human databases OMIM and Genopedia. Nervous system diseases (A) and mental disorders (B) were both significantly enriched in the dataset (p<0.0001). Circle size represents number of gene product from the ATP7A interactome in the disease category. Shades of blue depict p values.
Figure 5
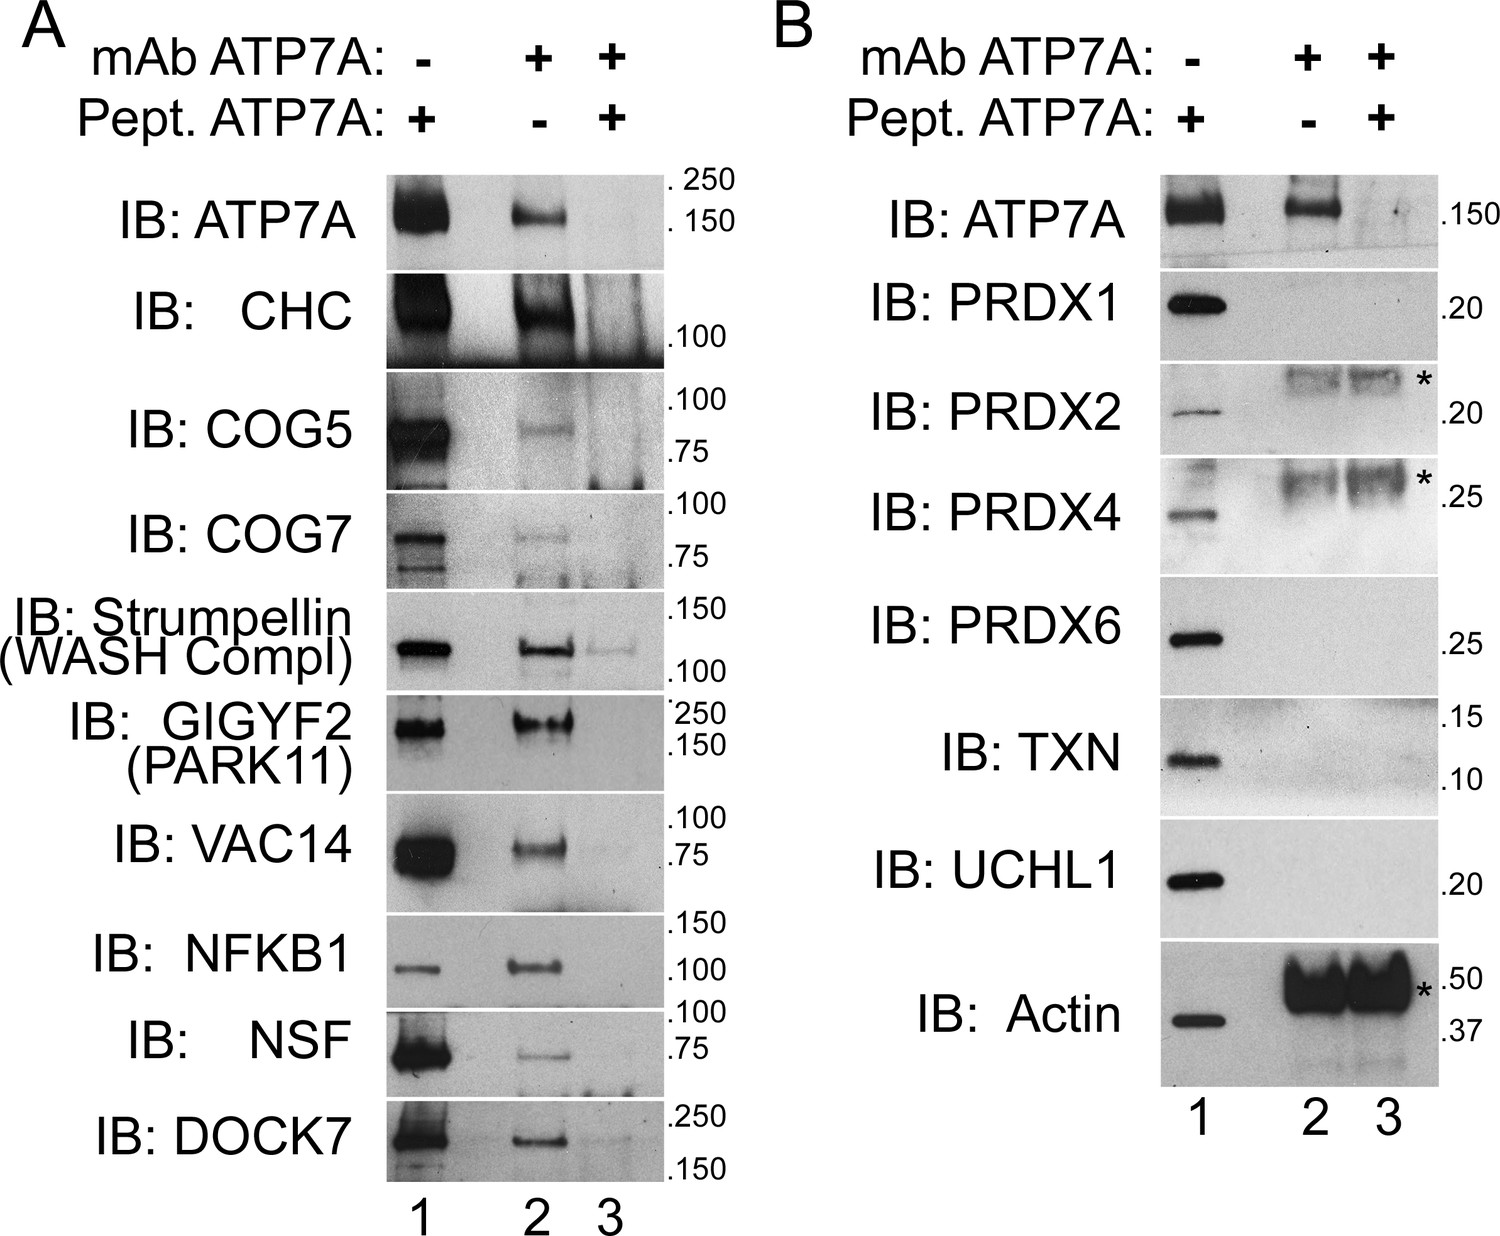
ATP7A co-immunoprecipitates with proteins implicated in neurodegeneration and neurodevelopmental disorders.
(A–B) ATP7A was immunoprecipitated from DSP-crosslinked SH-SY5Y neuroblastoma cell lysates. Whole cell extracts (lanes 1) and immunoprecipitated samples (lanes 2 and 3) were resolved by SDS-PAGE and analyzed by immunoblot. Lane 3 contains samples in which an antigenic ATP7A peptide was added during immunoprecipitation as a negative control. (A) ATP7A and previously characterized interactors, clathrin heavy chain (CHC) and strumpellin, were selectively identified, along with newly identified interactome components that were highly enriched by mass spectrometry and associated with neuropathologies. Note the presence of two COG complex subunits. (B) Abundant cytosolic proteins that fell below the significant fold of enrichment by mass spectrometry or were identified in the negative control samples failed to co-purify with ATP7A. None of these proteins coprecipitate with ATP7A demonstrating the specificity of the interactions depicted in A. Asterisks denote mouse IgG chains.
Figure 6
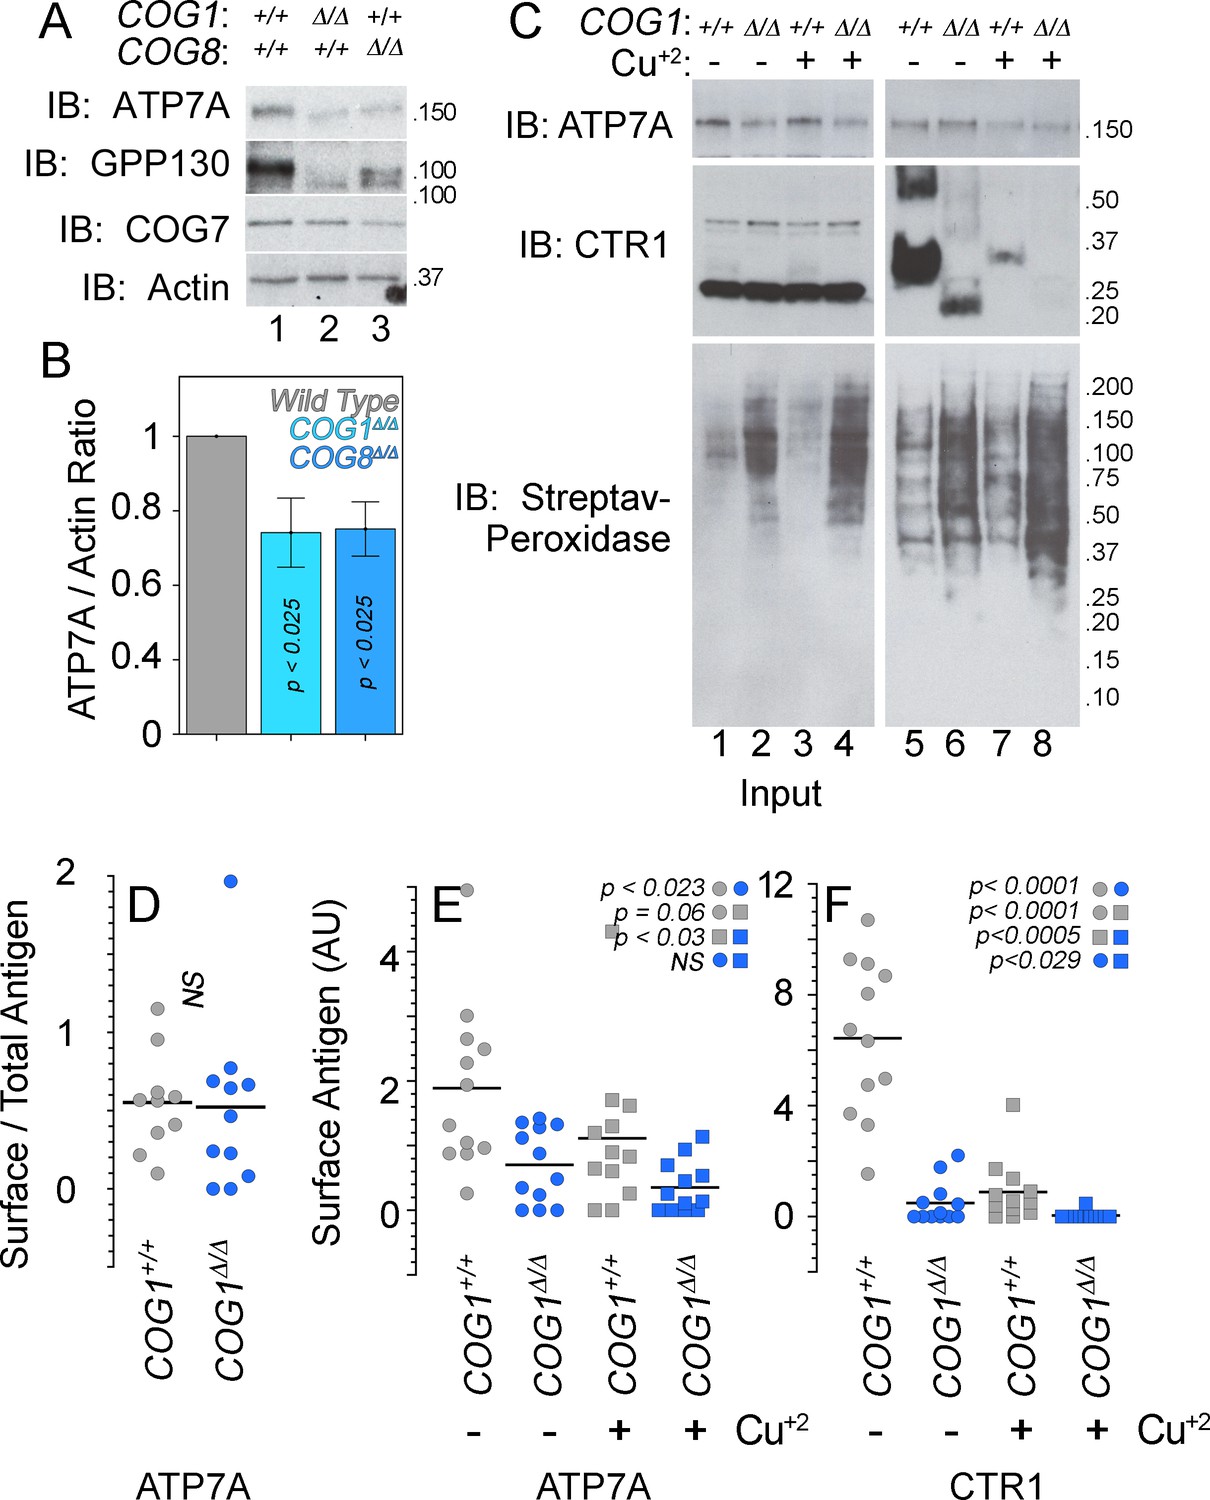
ATP7A stability and surface expression requires the COG complex.
(A–B) Immunoblots for ATP7A, known COG-dependent protein GPP130, COG seven and actin were performed in wild type HEK293 cells (6A, lane 1) and cells null for COG subunit 1 (6A, lane 2, COG1Δ/Δ) or COG subunit 8 (6A, lane 3, COG8Δ/Δ). (C) Surface biotinylation of the same cell types was performed with (6C, even lanes) and without (6C, odd lanes) the addition of 200 μM CuCl2 for two hours. Total protein extracts (6C, lanes 1–4) and surface biotinylated proteins precipitated by streptavidin beads (6C, lanes 5–8) were probed for ATP7A and CTR1, along with streptavidin-peroxidase to compare biotinylation efficiency. (D–F) ATP7A and CTR1 quantitations to measure the ratio of surface to total ATP7A (D), total surface ATP7A with and without copper (E), and total surface CTR1 with and without copper (F). D to F surface signals were corrected by the efficiency of biotinylation that was 1.84 ± 0.7 higher in COG1Δ/Δ cells (average ± SEM). Surface levels of ATP7A and CTR1 for each experimental condition were compared using non parametric Kriskal Wallis test followed by pairwise Mann-Whitney U test comparisons, n = 7.
Figure 7
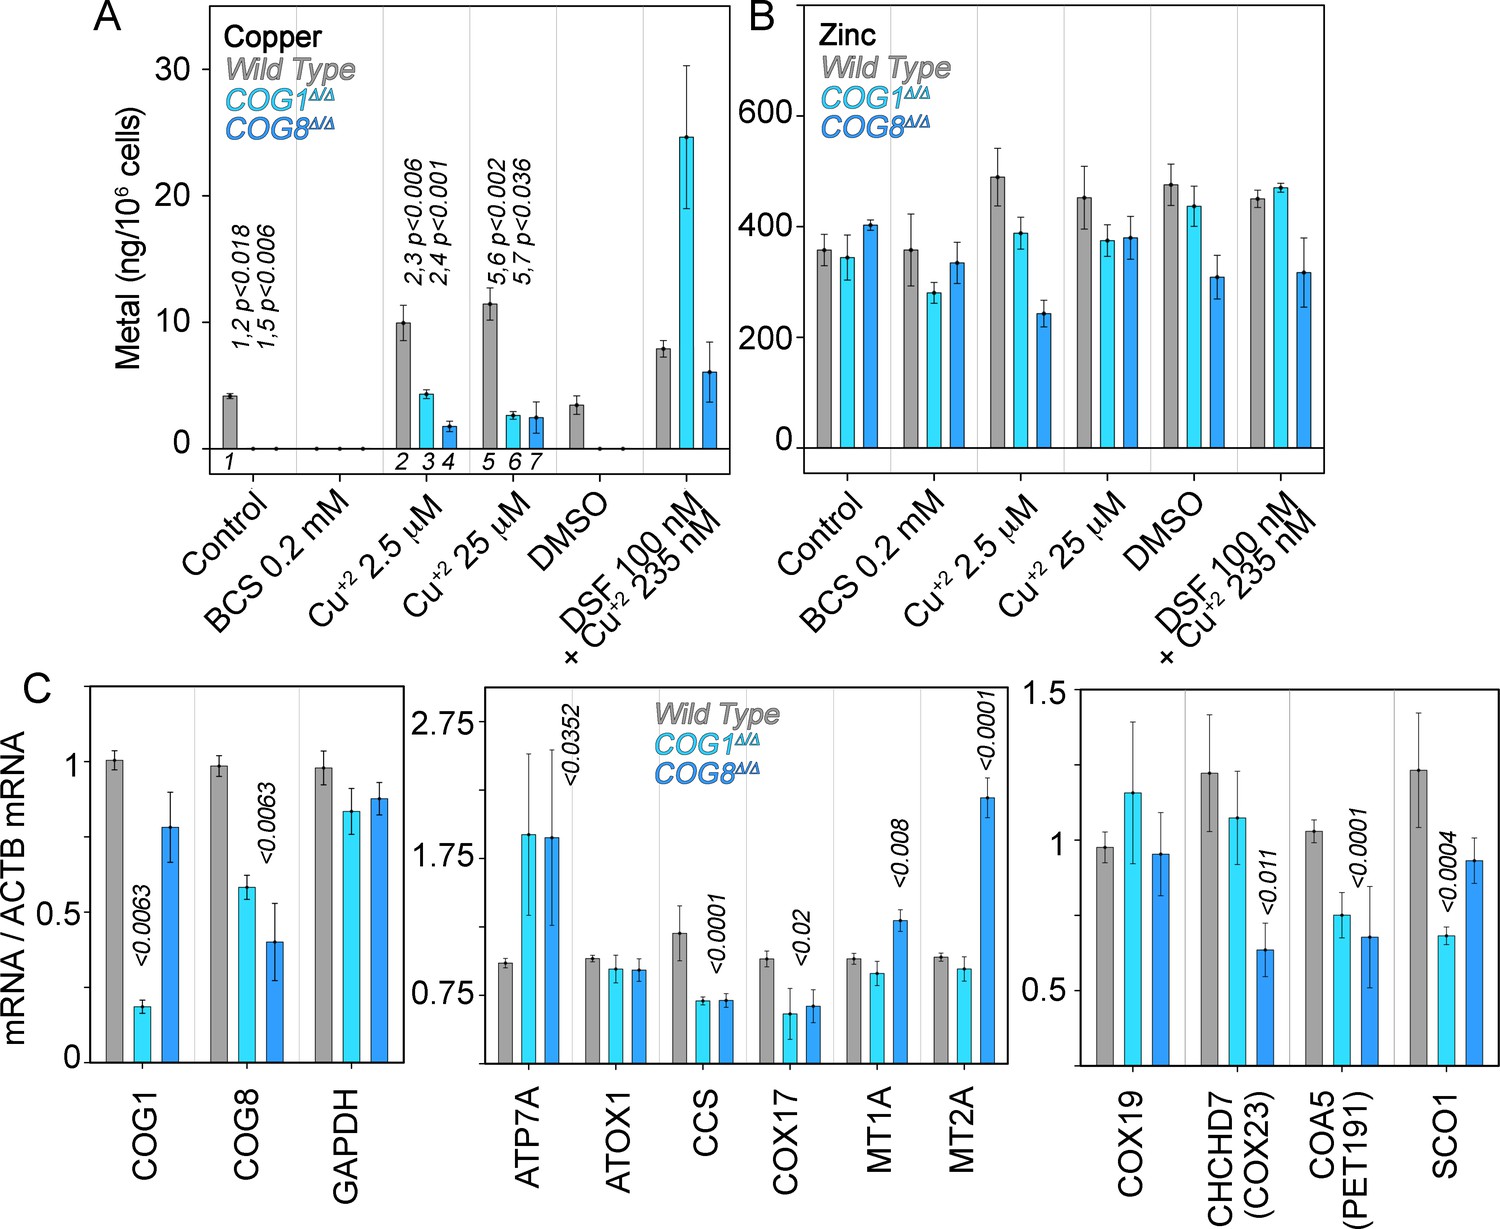
Copper content and expression of copper-sensitive transcripts is altered in COG deficient cells.
Copper (A), zinc (B), and transcript (C) levels from wild type (grey bars), COG1Δ/Δ (light blue bars), and COG8Δ/Δ (dark blue bars) HEK293 cells were measured either by inductively coupled plasma mass spectrometry (A-B) or quantitative real-time PCR (C). In A and B cells were incubated for 24 hr with the indicated drugs in complete media with 10%FBS. Transcripts were normalized to beta-actin mRNA. Inductively coupled plasma mass spectrometry was performed in two independent biological replicates where each determination was in triplicate. Five independent biological replicates were performed for each determination in triplicate for quantitative real-time PCR. For metal determinations, significant p-values were determined by ANOVA followed by Dunnett test. p-values associated with transcript changes were determined by non-parametric Kriskal Wallis test followed by pairwise Mann-Whitney U test comparisons; all unlabeled comparisons are not significant in (C).
Figure 8
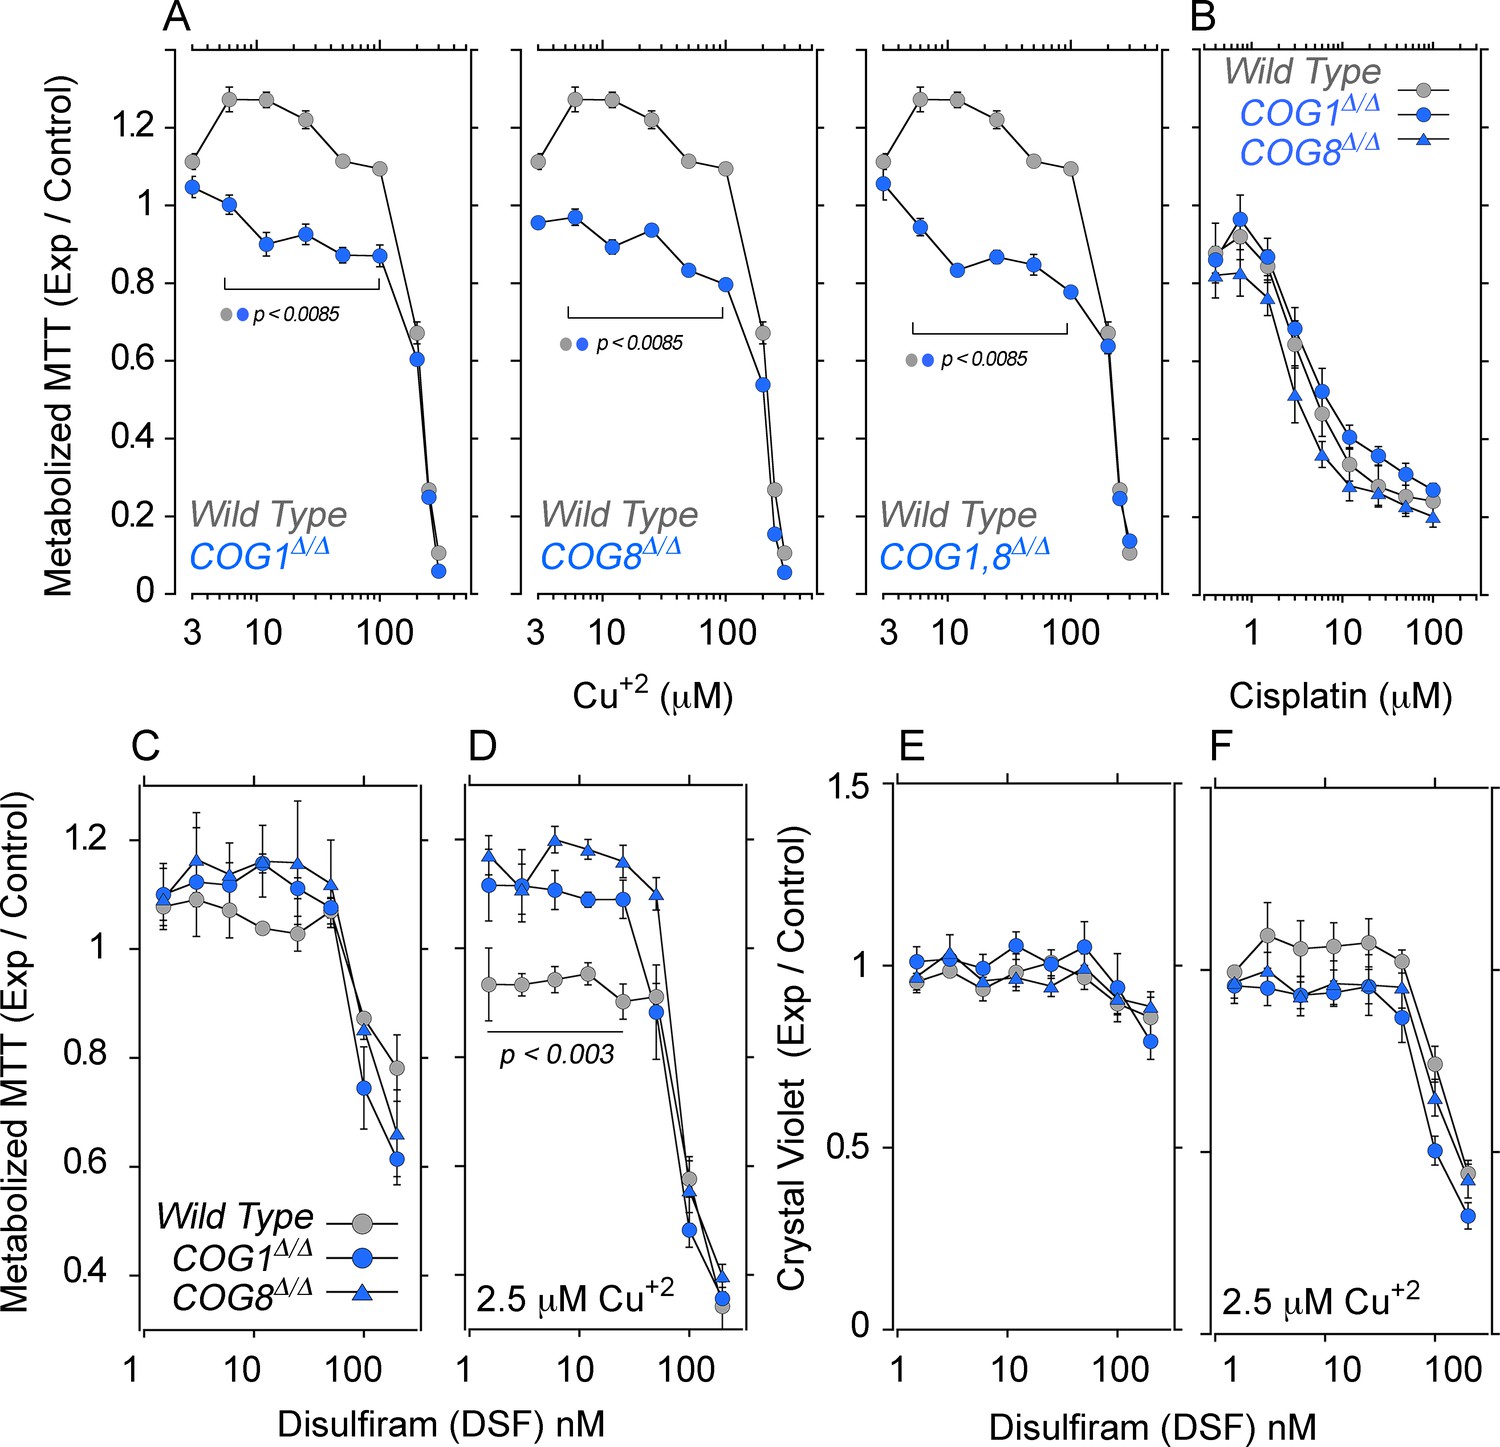
COG null cells possess copper metabolism defects.
(A) Wild type, COG1Δ/Δ, COG8Δ/Δ and COG1,8Δ/Δ HEK293 cells were incubated with CuCl2 ranging from 3–300 μM for 72 hr. Each condition was carried out in quadruplicate, and the activity of NAD(P)H-dependent oxidoreductases was measured by the reduction of MTT. Each dot represents the average absorbance at 595 nm ± SEM, normalized to a baseline reading (n = 5). One Way ANOVA followed by Bonferroni's All Pairs Comparisons (B) Wild type and COG null cells were incubated with 0.4–100 μM cisplatin for 72 hr and MTT reduction was measured as above (n = 2). (C–D) The copper ionophore disulfiram (DSF) was added to wild type, COG1Δ/Δ, and COG8Δ/Δ HEK293 cells for 24 hr either in concentrations ranging from 1.5–200 nM either in the absence (C) or presence (D) of 2.5 μM CuCl2; each condition was carried out in quadruplicate. Reduction of MTT by NAD(P)H-dependent oxidoreductases was measured and normalized to a baseline reading with no drug added. Each dot represents the average of five independent biological replicates ± SEM. Non-parametric Kriskal Wallis test followed by pairwise Mann-Whitney U test comparisons. (E–F) Crystal violet staining was performed in parallel to MTT analysis to measure changes in cell number.
Figure 9
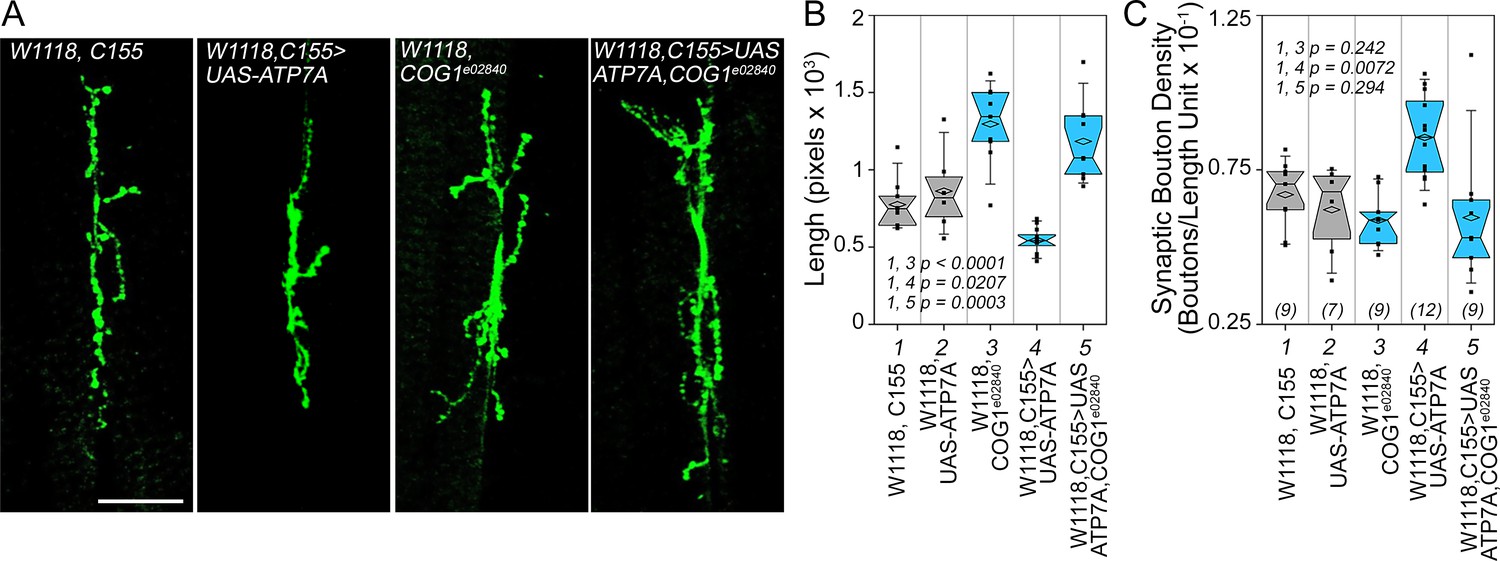
Drosophila ATP7A and COG1 genetically interact to specify Drosophila melanogaster synapse development.
Third instar larvae neuromuscular junction synapses were stained with anti HRP antibodies (A) imaged and their morphology assessed using as parameters branch length (B) and bouton density (C). Scoring was done blind to the animal genotype. Control animals (C155 outcross, column 1; or UAS-ATP7A outcross, column 2), animals carrying one copy of the null allele cog1e02840 (cog1 e02840 outcrossed, column 3), flies overexpressing ATP7A in neuronal cells (c155>UAS-ATP7A; column 4), and animals overexpressing ATP7A and mutant for cog1 (C155> UAS-ATP7A x cog1e02840, column 5) were analyzed. Numbers in parentheses and italics in C depict the number of animals. Statistical comparisons were performed with One Way ANOVA followed by Fisher’s Least Significant Difference Comparison. Box plots depict percentiles fifth and 95th. Box line represents sample median and diamonds sample mean and notches mark the half-width.
Figure 10
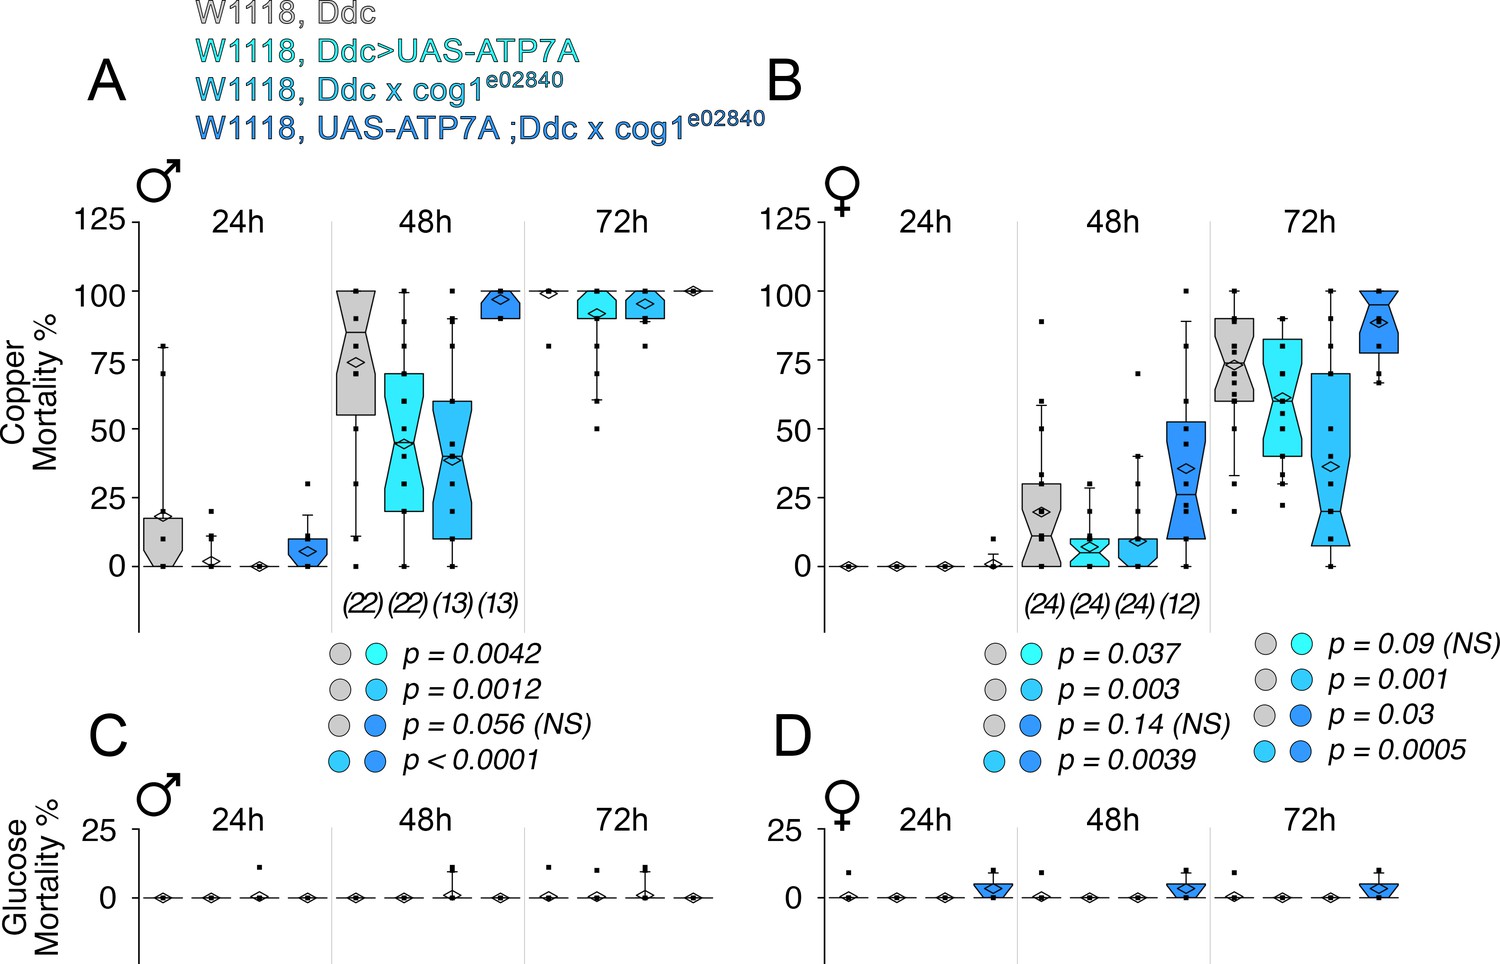
Drosophila ATP7A and COG1 genetically interact in dopaminergic neurons to specify copper-induced Drosophila melanogaster viability.
Control animals (Ddc outcross), animals carrying one copy of the null allele cog1e02840 (cog1 e02840 outcrossed), flies overexpressing ATP7A in dopaminergic neuronal cells (Ddc>UAS-ATP7A), and animals overexpressing ATP7A and mutant for cog1 (UAS-ATP7A; Ddc x cog1e02840) were fed a glucose diet (C-D) or a glucose diet supplemented with 1 mM CuCl2 for three consecutive days. Numbers in parentheses and italics depict the number of independent experiments each one performed with at least 10 animals per genotype. Statistical comparisons were performed with Non-parametric Kriskal Wallis test followed by pairwise Mann-Whitney U test comparisons. Box plots depict percentiles fifth and 95th. Box line represents sample median and diamonds sample mean and notches mark the half-width.
Additional files
-
Supplementary file 1
Reagents and proteomic findings from neuroblastoma cells.
Tabs contain table of antibodies and primers used in this study. BCS and Cu tabs include all proteome data from crosslinked ATP7A complexes isolated from BCS treated and copper treated neuroblastoma cells as indicated in Figure 1 and Material and methods. Cutoff selection criteria of hits are defined in Material and methods.
- https://doi.org/10.7554/eLife.24722.013
-
Supplementary file 2
Proteomic findings from ATP7A null and rescue cells.
Proteome data from crosslinked ATP7A complexes isolated from human ATP7A null fibroblasts and rescue cells (ATP7AR/R) as indicated in Figure 1 and Material and methods. Cutoff selection criteria of hits are defined in Material and methods. All hits below the selection cutoff were used to curate the BCS and copper treated proteomes in Supplementary file 1 to give origin to the ATP7A interactome in the Supplementary file 3 Tab (BCS+Cu Hits).
- https://doi.org/10.7554/eLife.24722.014
-
Supplementary file 3
Curated proteins defining the ATP7A interactome and their analysis by bioinformatics.
Selected hits from BCS treated cells and copper treated cell immunoisolated ATP7A complexes. Tab with the sum of these hits (BCS+Cu Hits) was used for bioinformatics (Tabs A-C). Crapome lists hits from one of the CRAPome datasets and the proteins shared by the ATP7A interactome and the CRAPome. Tabs (A), (B), and (C) contain DAVID, ENRICHR and GDA bioinformatic analyses, respectively, which are graphically depicted in Figures 2 and 3.
- https://doi.org/10.7554/eLife.24722.015
Download links
A two-part list of links to download the article, or parts of the article, in various formats.
Downloads (link to download the article as PDF)
Open citations (links to open the citations from this article in various online reference manager services)
Cite this article (links to download the citations from this article in formats compatible with various reference manager tools)
The interactome of the copper transporter ATP7A belongs to a network of neurodevelopmental and neurodegeneration factors
eLife 6:e24722.
https://doi.org/10.7554/eLife.24722


