A receptor and neuron that activate a circuit limiting sucrose consumption
- Yale University, United States
Figures
Figure 1
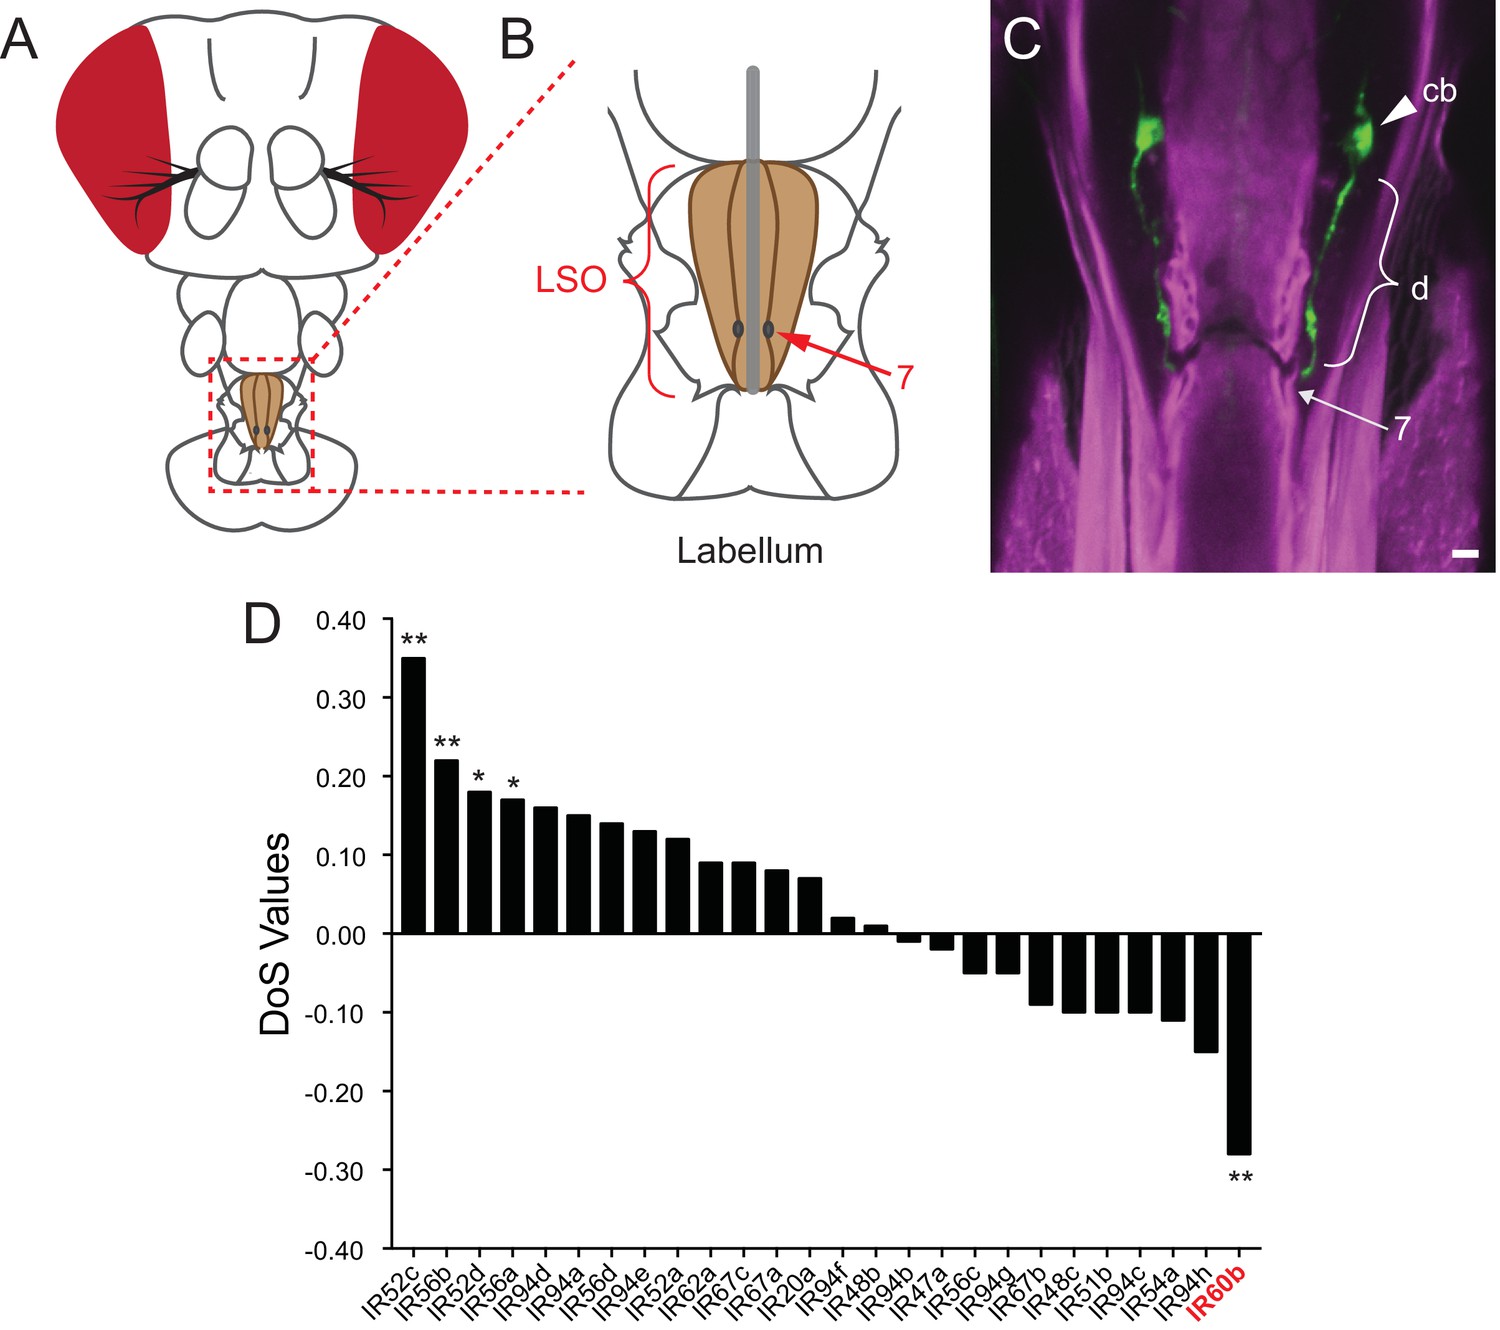
Expression of IR60b in the LSO.
(A) Drosophila head. The box indicates the region of the proboscis containing the labral sense organ (LSO, shaded) of the pharynx. (B) The pharyngeal region containing the LSO. The position of sensillum 7 is indicated. (C) IR60b-GAL4; UAS-GFP shows expression in a single pair of neurons that project dendrites (d) to the pore of sensillum 7, whose position is indicated. (cb), cell body. To maximize the fidelity of the driver, GAL4 was placed between sequences lying 5’ and 3’ to IR60b. Scale bar = 5 μm. Green color represents UAS-GFP fluorescence, visualized with a 488 nm laser. Magenta color represents cuticular autofluorescence, visualized with a 514 nm laser. (D) IR60b is the only member of the IR20a clade that shows a significantly negative Direction of Selection (DoS) signature. Values were generated by using polymorphism data from the Drosophila Genetic Reference Panel (Huang et al., 2014; Mackay et al., 2012) to perform McDonald-Kreitman Tests (Stoletzki and Eyre-Walker, 2011) for the IR20a clade genes. Values were generated using the popDrowser website (Ràmia et al., 2012). Briefly, the values are calculated by comparing sequence variation within Drosophila melanogaster to the sequence divergence between Drosophila melanogaster and its sibling species Drosophila simulans. *p<0.05; **p<0.01. Figure adapted from data displayed in Figure 6K in Koh et al. (2014).
Figure 2 with 1 supplement
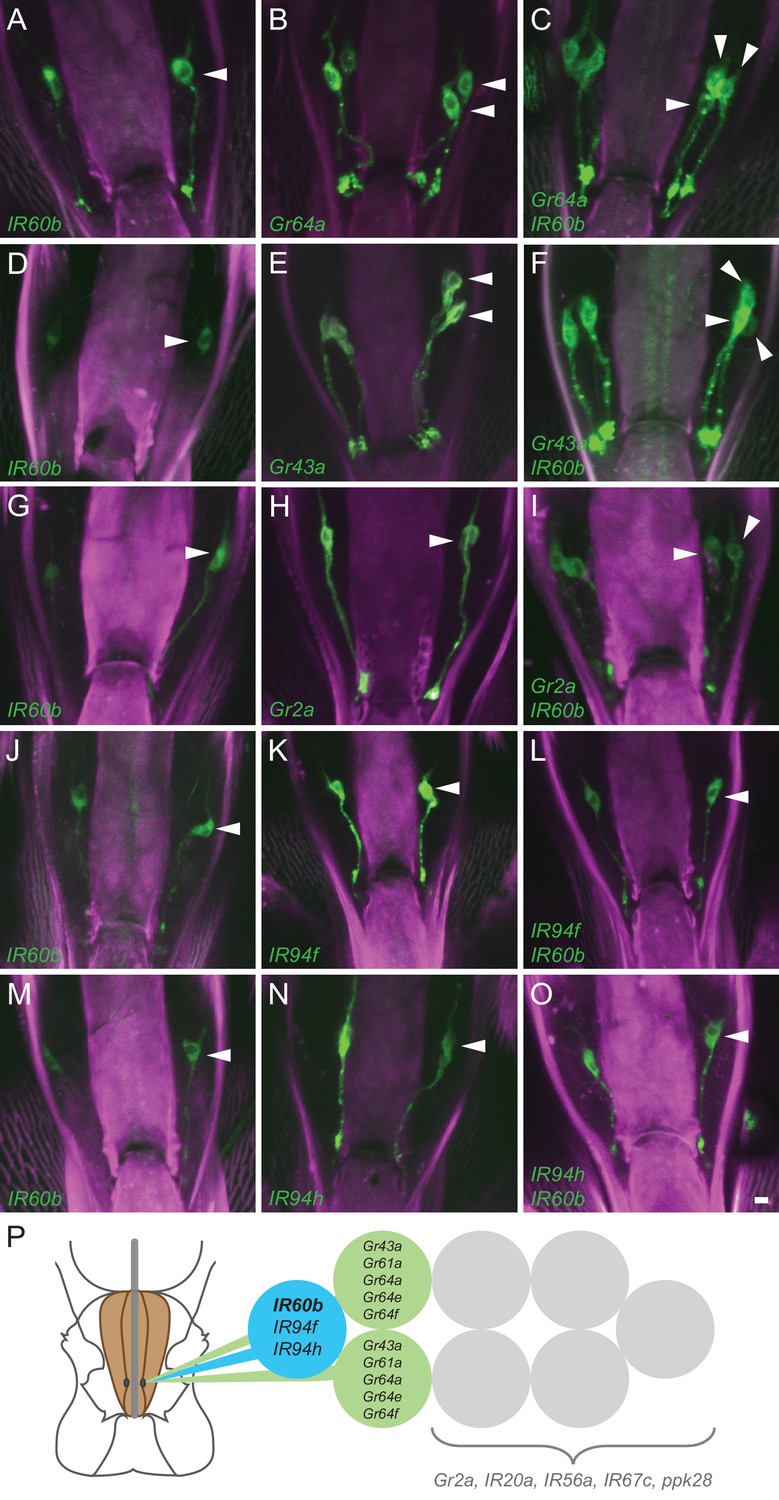
Coexpression of IR60b and other receptors.
(A–O) Maximum intensity projections of GFP expression in IR60b-GAL4/+; IR60b-GAL4/UAS-mCD8-GFP flies (A,D,G,J,M); Gr- or IR-GAL4/+; UAS-mCD8-GFP/+ flies (B,E,H,K,N); IR60b-GAL4/Gr- or IR-GAL4; IR60b-GAL4/UAS-mCD8-GFP flies (C,F,I,L,O). Two copies of IR60b-GAL4 were used to compensate for the low expression level of IR60b-GAL4. Arrowheads indicate neuronal cell bodies in the LSO. Scale bar = 5 μm. (P) Mapping of IR60b driver relative to other IR and Gr drivers in the eight gustatory neurons of LSO sensillum 7. Drivers mapped to neurons indicated in color do not co-express with drivers mapped to neurons indicated in gray, which have not been mapped at single-cell resolution in this analysis. Gr66a is not included in the diagram because the Gr66a-GAL4 driver maps to other sensilla of the LSO.
Figure 2—figure supplement 1
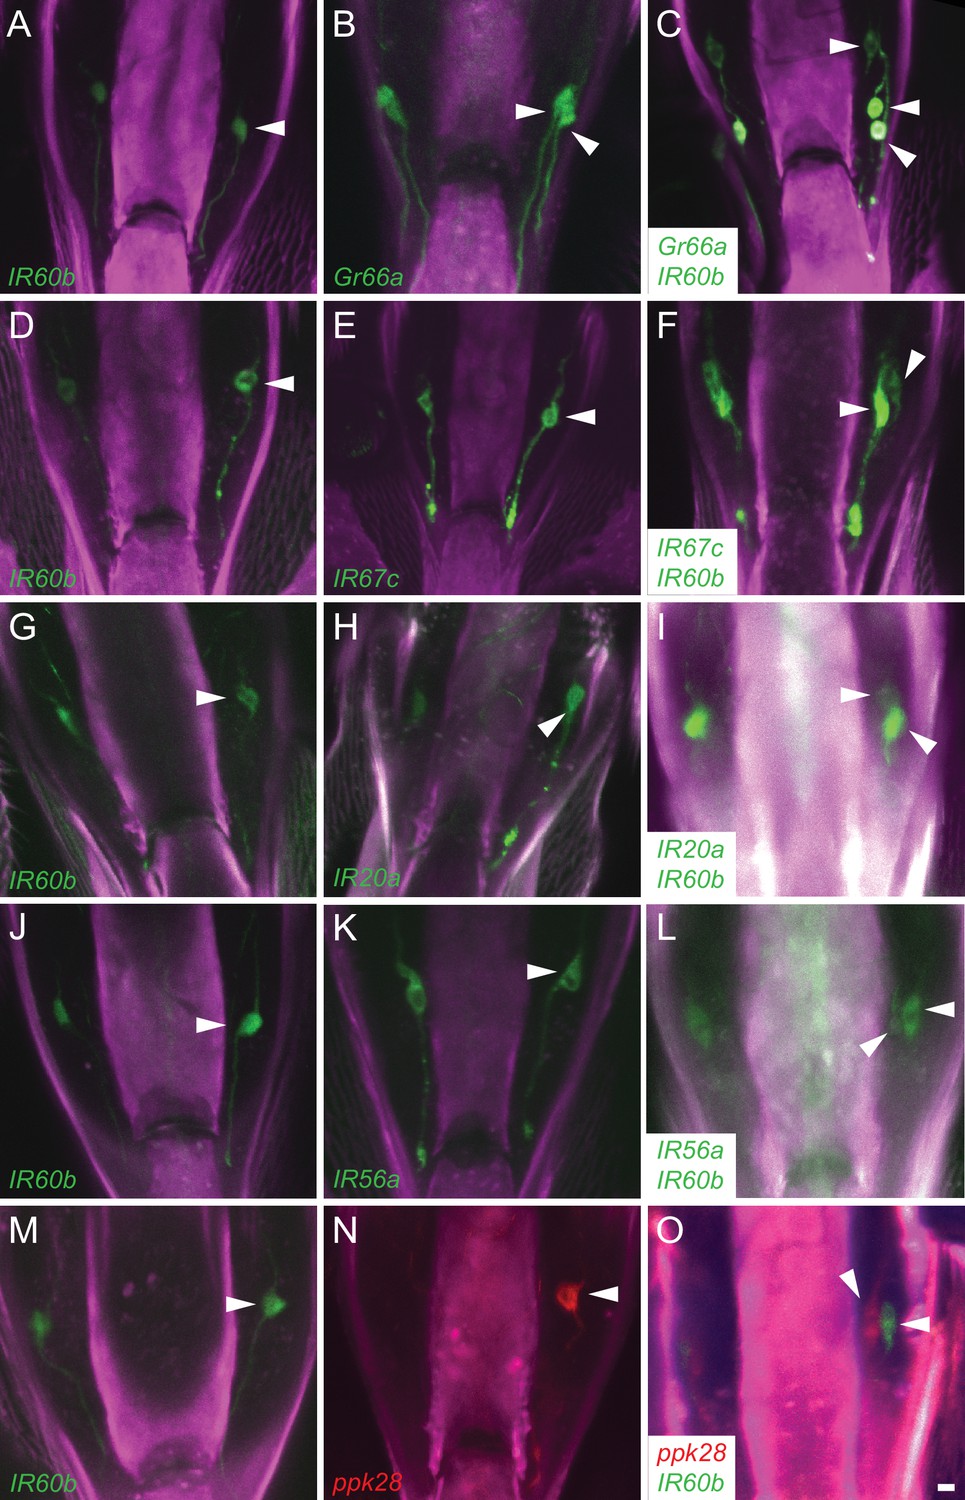
IR60b-GAL4 expresses in a neuron of the pharynx that does not express several other drivers.
Maximum intensity projections of GFP expression in IR60b-GAL4/+; IR60b-GAL4/UAS-CD8-GFP flies (A,D,G,J,M); Gr-, IR-, or ppk28-GAL4/+; UAS-CD8-GFP/+ flies (B,E,H,K,N); IR60b-GAL4/Gr- or IR-GAL4; IR60b-GAL4/UAS-CD8-GFP flies (C,F,I,L). (O) IR60b-GAL4/ppk28-LexA::VP1; IR60b-GAL4/UAS-mCD8-GFP, LexAop-mtdTomato flies. Although ppk28-GAL4 is driving UAS-cD8-GFP in panel (N), the green-channel has been false-colored red to facilitate comparison to the double-labeled IR60b-GAL4/ppk28-LexA::VP1; IR60b-GAL4/UAS-mCD8-GFP sample in (O). Arrowheads indicate distinct neuronal cell bodies in the LSO. In this analysis, some of the labeled cells are less strongly labeled than others, presumably because of differences in the strength of the GAL4 drivers. The interpretations depicted in Figure 2P are supported by examination of the preparations at different focal planes. We note that in an earlier analysis (Koh et al., 2014), the IR20a-GAL4 driver could be observed to label two cells in the LSO; however, only one cell body was consistently observed with the IR20a-GAL4 line used in this study. Scale bar = 5 μm.
Figure 3 with 1 supplement

Consumption of sucrose in a modified pharyngeal pumping assay.
(A) Diagram of assay. Figure adapted from Figure 2B of Delventhal et al. (2017). (Delventhal et al., 2017) (B) Blue dye allows visualization of filling and emptying of the cibarium (red-dashed circle). (C) Total feeding time of w Canton-S females as a function of sucrose concentration. n = 37–108. (D) Swallowing rate of flies as a function of sucrose concentration. Medians do not differ (one-way ANOVA, Bonferroni post-test, n = 22–34). Lines indicate medians; boxes indicate 25% quartiles above and below the median; whiskers indicate range of values. (E) Correlation analysis of total number of swallows per fly vs. total feeding time. Data are from all concentrations tested in (C). R2 = 0.91, ***p<0.001, Pearson’s correlation test, n = 140. (F) Correlation analysis of calculated volumes of 900 mM sucrose ingested vs. total feeding time (***p<0.001, R2 = 0.76, Pearson’s correlation test, n = 20). Flies consumed ~8 nanoliters/s, which is comparable to reported values (Qi et al., 2015; Yapici et al., 2016). Volumes were determined by extracting dye from single flies after feeding, and measuring the absorbance of each sample. Absorbance values were converted into calculated volumes using the slope of a standard absorbance curve for the concentration of the blue dye (see Materials and methods). 12 hr starved, mated females were used in this and all other assays.
Figure 3—figure supplement 1
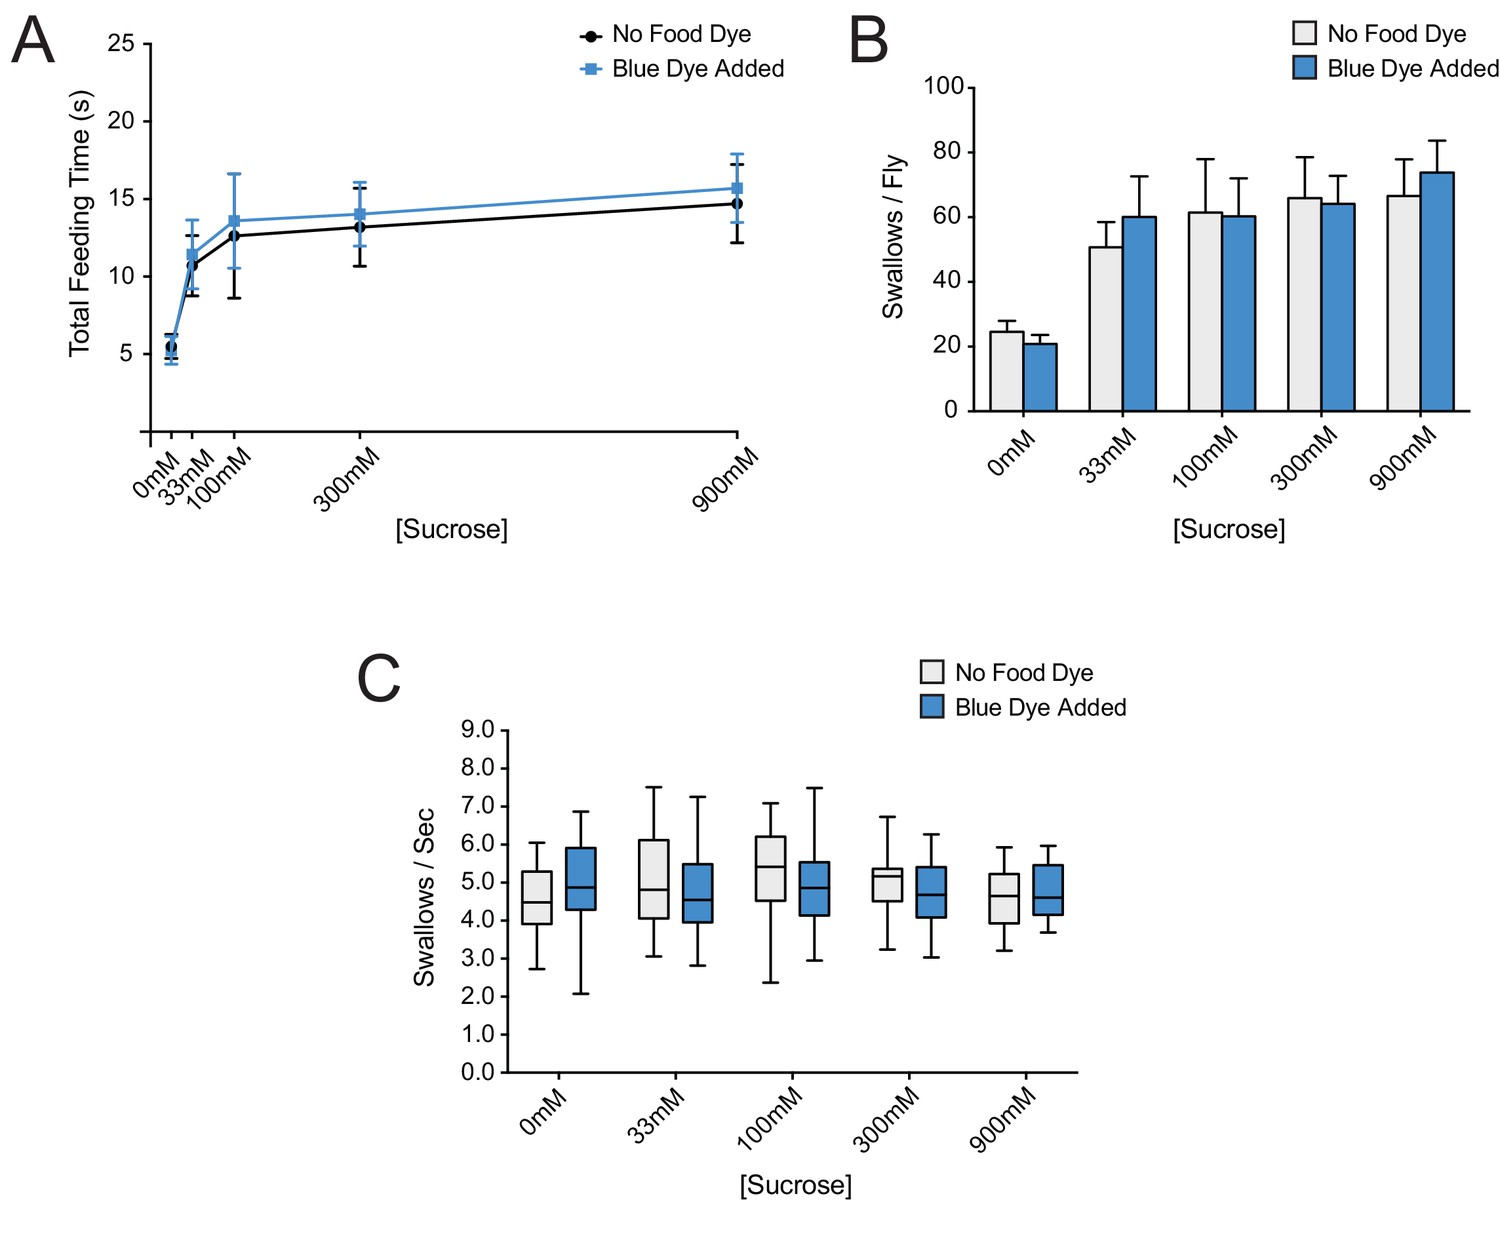
Addition of erioglaucine blue dye to sucrose food does not affect feeding behaviors.
(A) Total feeding time, (B) number of swallows/fly, and (C) pumping rate of w Canton-S (+/+) females, in response to increasing sucrose concentrations with or without 0.4 ug/μm erioglaucine blue dye. No differences were observed (two-way ANOVA, Bonferroni post-test, n = 20–34). As with all assays, females were starved for 12 hr before testing. In (A) and (B) two-way ANOVA revealed only the concentration of sucrose as a significant source of variation (**p=0.0015).
Figure 4 with 2 supplements
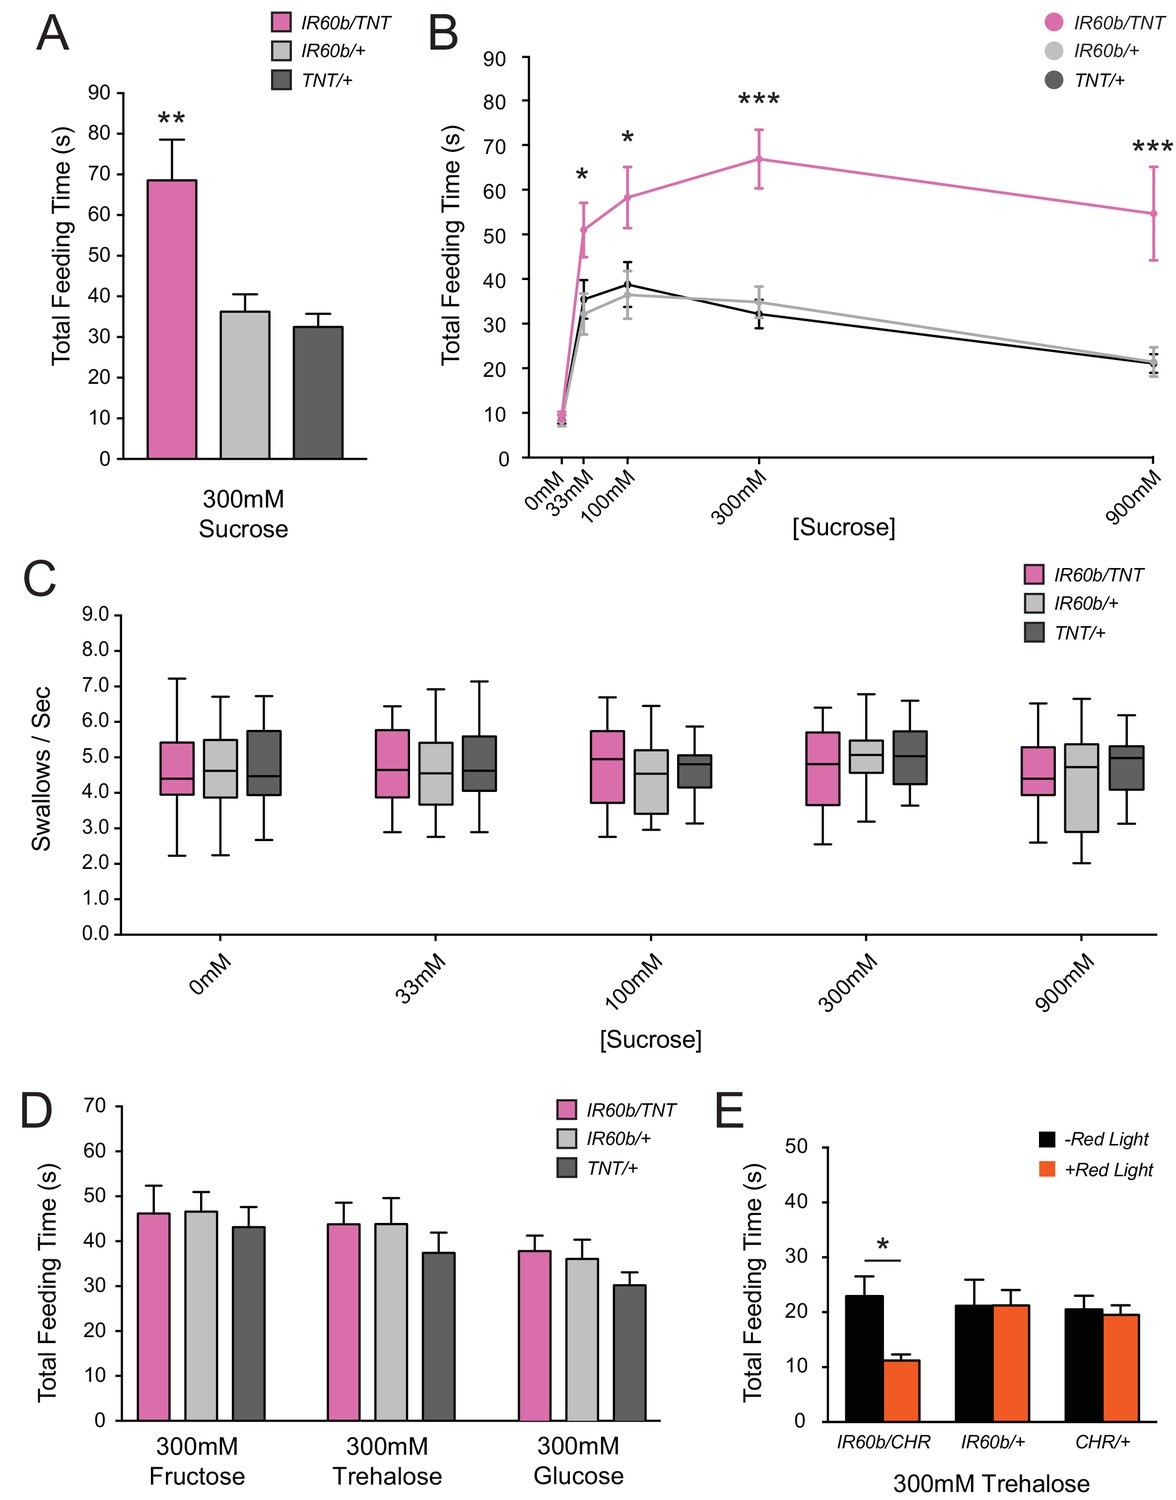
Silencing and activating the IR60b neuron alters feeding time.
(A) Initial analysis of total feeding time of IR60b-GAL4/UAS-TNT, IR60b-GAL4/+, and UAS-TNT/+ flies when 300 mM sucrose was delivered in the pharyngeal pumping assay (**p<0.01, one-way ANOVA, Bonferroni post-test, n = 16–24). (B) Total feeding time of silenced flies at a range of sucrose concentrations (*p<0.05, ***p<0.001: two-way ANOVA, Bonferroni post-test, n = 18–30). (C) Pumping rates of silenced flies at different sucrose concentrations. No differences were observed in pumping rates among different genotypes or doses (two-way ANOVA, Bonferroni post-test, n = 16–27). (D) Total feeding time of silenced flies when tested with glucose, fructose, or trehalose. No increases in sugar consumption were observed in IR60b-GAL4/UAS-TNT flies when compared to controls (one-way ANOVA, Bonferroni post-test, n = 25–38). (E) UAS-Chrimson (CHR) activation: total feeding time with 300 mM trehalose in IR60b-GAL4/UAS-Chrimson, IR60b-GAL4/+, and UAS-Chrimson/+ flies under low-light conditions, either with or without application of red light. IR60b-GAL4/UAS-Chrimson flies show a decrease in feeding when IR60b neurons are activated with red light (*p<0.05, two-way ANOVA, Bonferroni post-test, n = 12–24). Under red light, feeding time for IR60b-GAL4/UAS-Chrimson flies is lower than for IR60b-GAL4/+ and UAS-Chrimson/+ controls (*p<0.05, two-way ANOVA, Bonferroni post-test, n = 12–24).
Figure 4—figure supplement 1
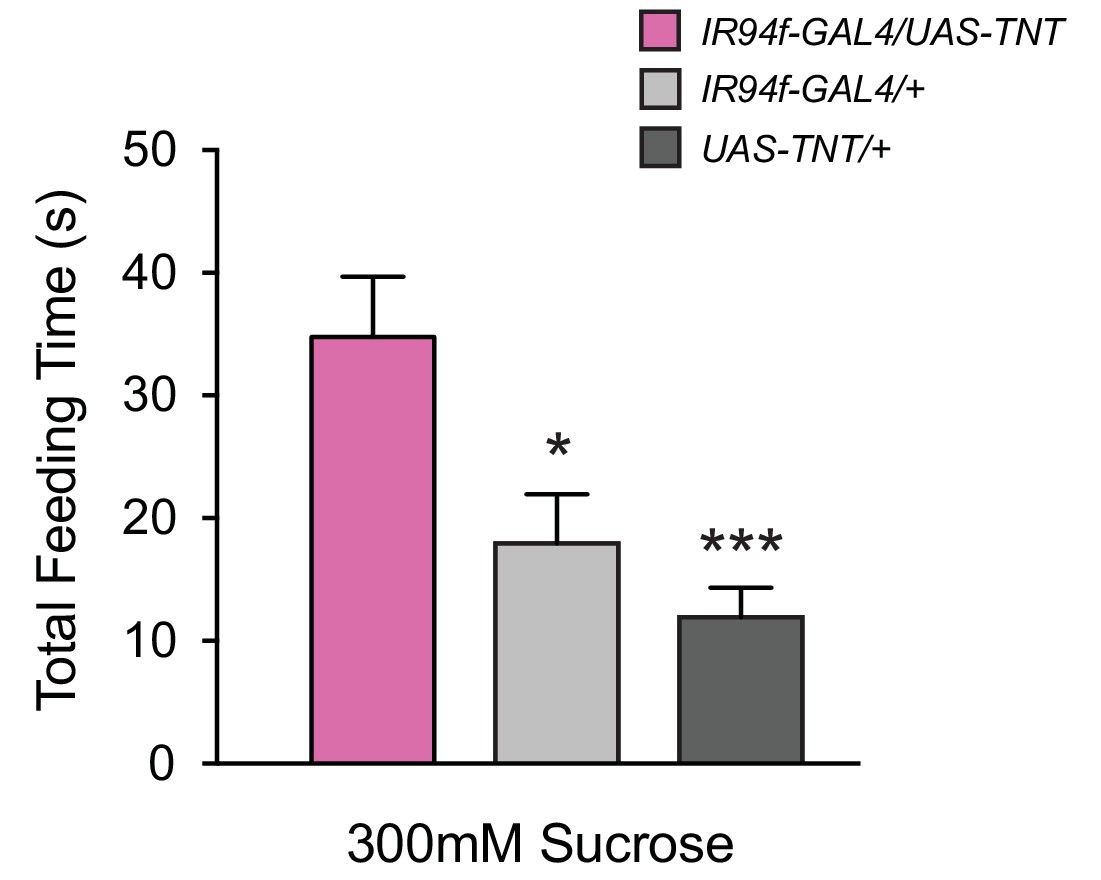
Expression of UAS-TNT driven by IR94f-GAL4 also causes overconsumption.
(A) Total feeding time of 300 mM sucrose for IR94f-GAL4/UAS-TNT, IR94f-GAL4/+, and UAS-TNT/+ flies in the pharyngeal pumping assay. IR94f-GAL4/UAS-TNT females exhibited increased total feeding time compared to heterozygote controls (*p<0.05, ***p<0.001, one-way ANOVA, Bonferroni post-test, n = 12–16). These results support the conclusion from mapping data that IR60b and IR94f co-express in the same pharyngeal neuron. The IR94f-GAL4 and UAS-TNT constructs were each backcrossed for at least five generations against our control w Canton S genetic background before the experiment.
Figure 4—figure supplement 2
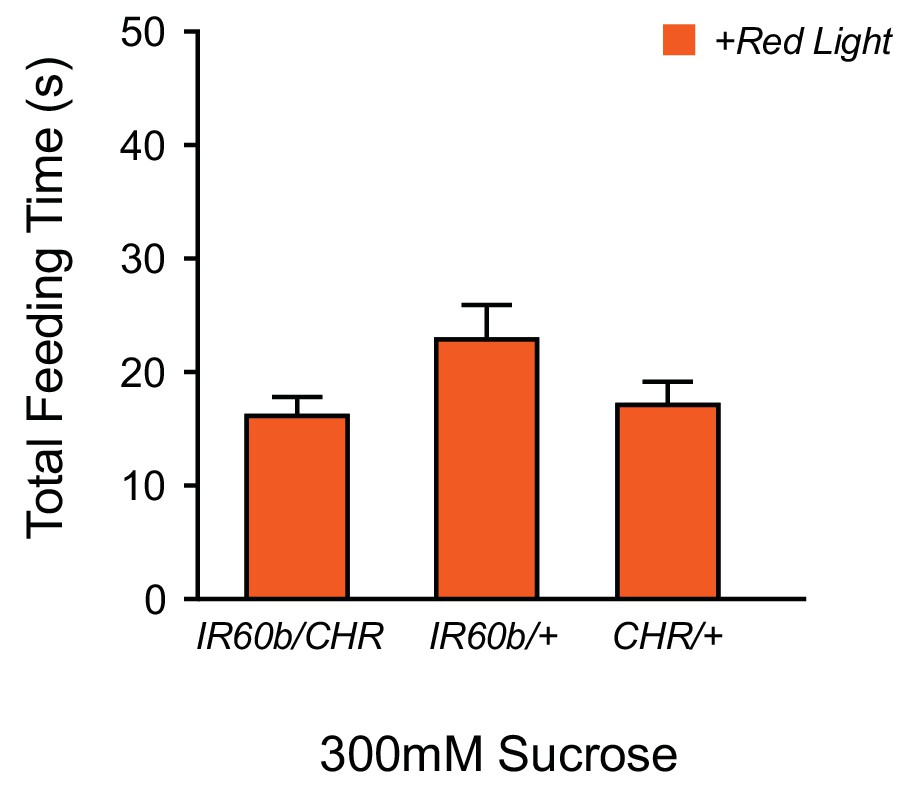
Optogenetic activation of IR60b neurons does not reduce feeding on sucrose.
The feeding time of IR60b-GAL4/UAS-Chrimson flies in red light is not lower than that of parental controls during delivery of 300 mM sucrose (one-way ANOVA, n = 36–49), suggesting that activation of IR60b neurons by sucrose is sufficiently strong that red light does not produce a demonstrable incremental effect.
Figure 5

Mutation of IR60b leads to overconsumption of sucrose .
(A) Initial analysis of feeding time for IR60b1/IR60b1, IR60b1/+, and w Canton-S (+/+) flies when 300 mM sucrose was delivered in the pharyngeal pumping assay (***p<0.001, one-way ANOVA, Bonferroni post-test, n = 13–20). (B) Sucrose dose-response curve for IR60b1 (*p<0.05, ***p<0.001, two-way ANOVA, Bonferroni post-test, n = 12–25 for 0 mM, n = 30 for other doses). We note that the feeding times in this experiment are somewhat less than those in Figure 4B, which may reflect differences in genetic background: all flies used in Figure 5B are w1118, whereas all flies in Figure 4 have a mini-white+ marker in the GAL4 and UAS constructs. (C) Initial analysis of IR60b2 (***p<0.001, one-way ANOVA, Bonferroni post-test, n = 20–21. (D) Sucrose dose-response curve for IR60b2 (**p<0.01, ***p<0.001, two-way ANOVA, Bonferroni post-test, n = 12–25). (E) The total time feeding and (F) calculated volume ingested for IR60b1/IR60b1 and +/+ flies when offered 900 mM sucrose, a concentration selected to elicit robust feeding. (G) Volume consumed versus total feeding time for individual flies. Volumes ingested were calculated as described in Figure 3F. Data for +/+ shown here are from Figure 3F and are presented for comparison. The volume consumed correlated with total feeding time for both IR60b1/IR60b1 and +/+ flies (***p<0.001, R2 = 0.94 and 0.76, respectively, Pearson’s correlation test, n = 20). Slopes of regression lines for IR60b1/IR60b1 and +/+ were very similar (7.8 and 7.5 nl/s, respectively), showing that both mutant and control flies swallowed the same amount of food per unit time, and arguing that the increased feeding times observed in the mutant translate directly to increased volumes ingested.
Figure 6
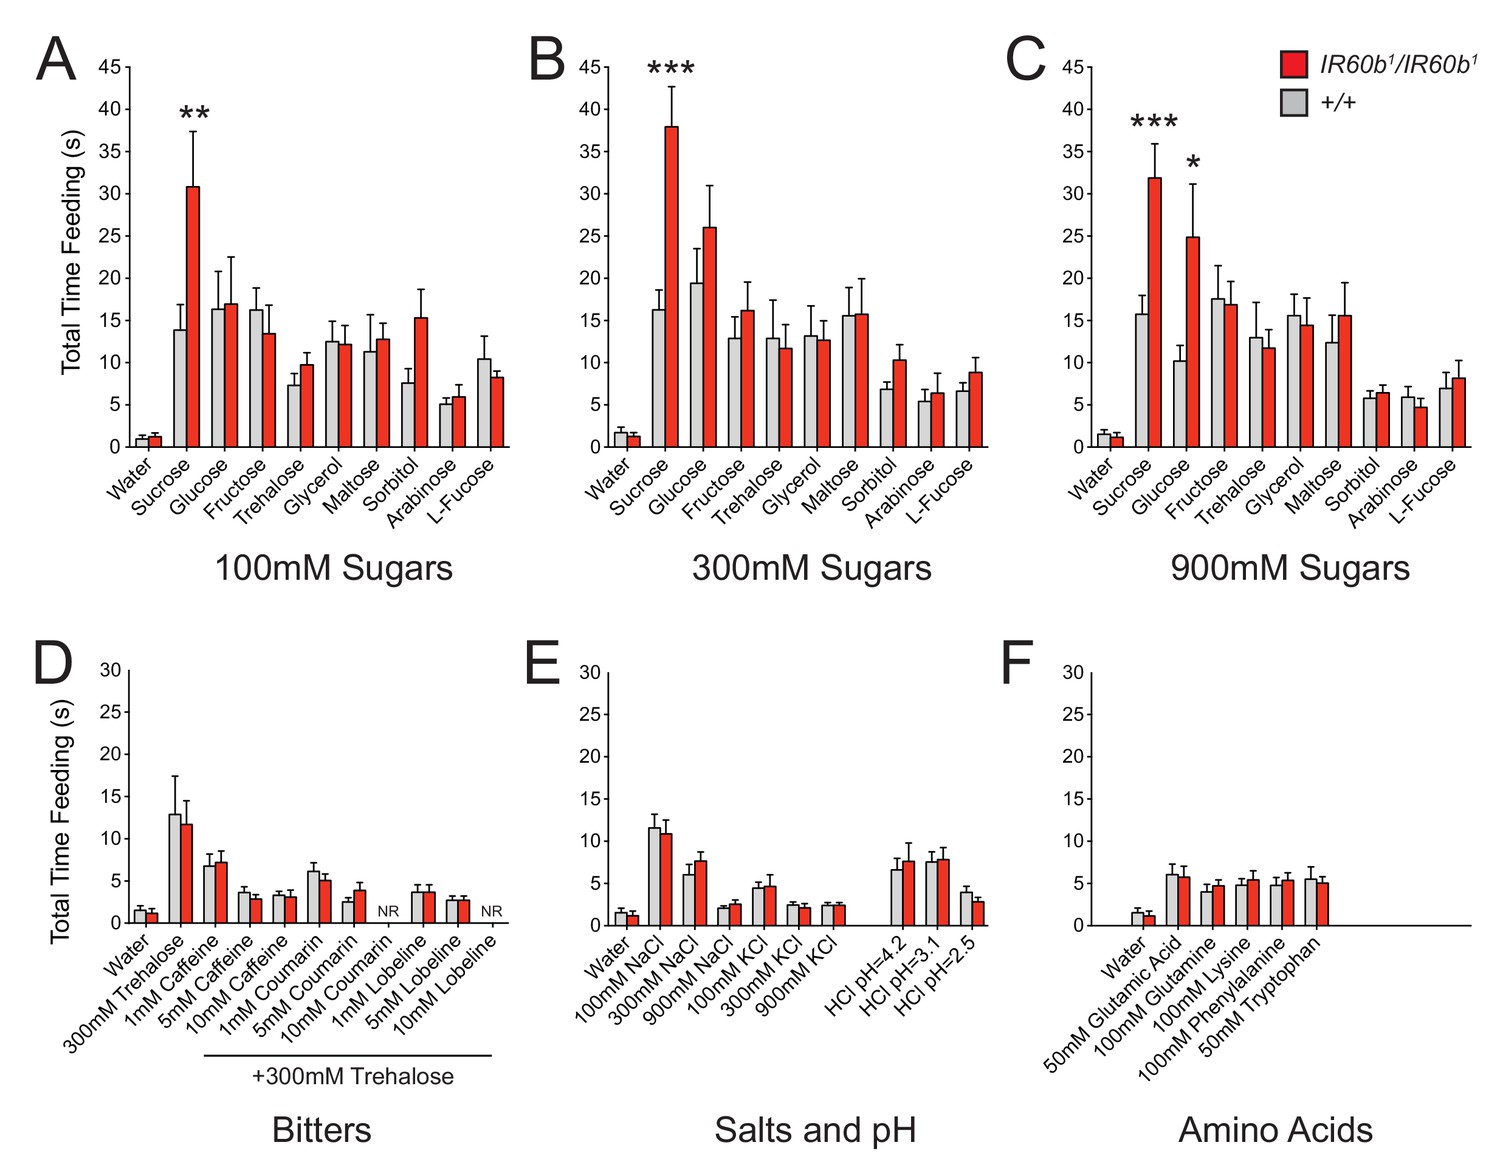
The IR60b receptor regulates feeding of a highly specific set of taste stimuli .
(A–F) Total feeding times of IR60b1/IR60b1and w Canton-S (+/+) females with sugars, bitter compounds, salts, acids, and amino acids. Bitter stimuli, including all doses of caffeine, were delivered in a 300 mM trehalose background to stimulate baseline consumption to a level where decreases in feeding could be observed. All other compounds were dissolved in water. NR indicates flies for 10 mM coumarin and 10 mM lobeline groups did not accept these tastants. Differences between the mutant and +/+ were observed only for 100, 300, and 900 mM sucrose, and 900 mM glucose (*p<0.05, **p<0.01, ***p<0.001, Student’s two-tailed t-test, n = 10–32).
Figure 7 with 1 supplement
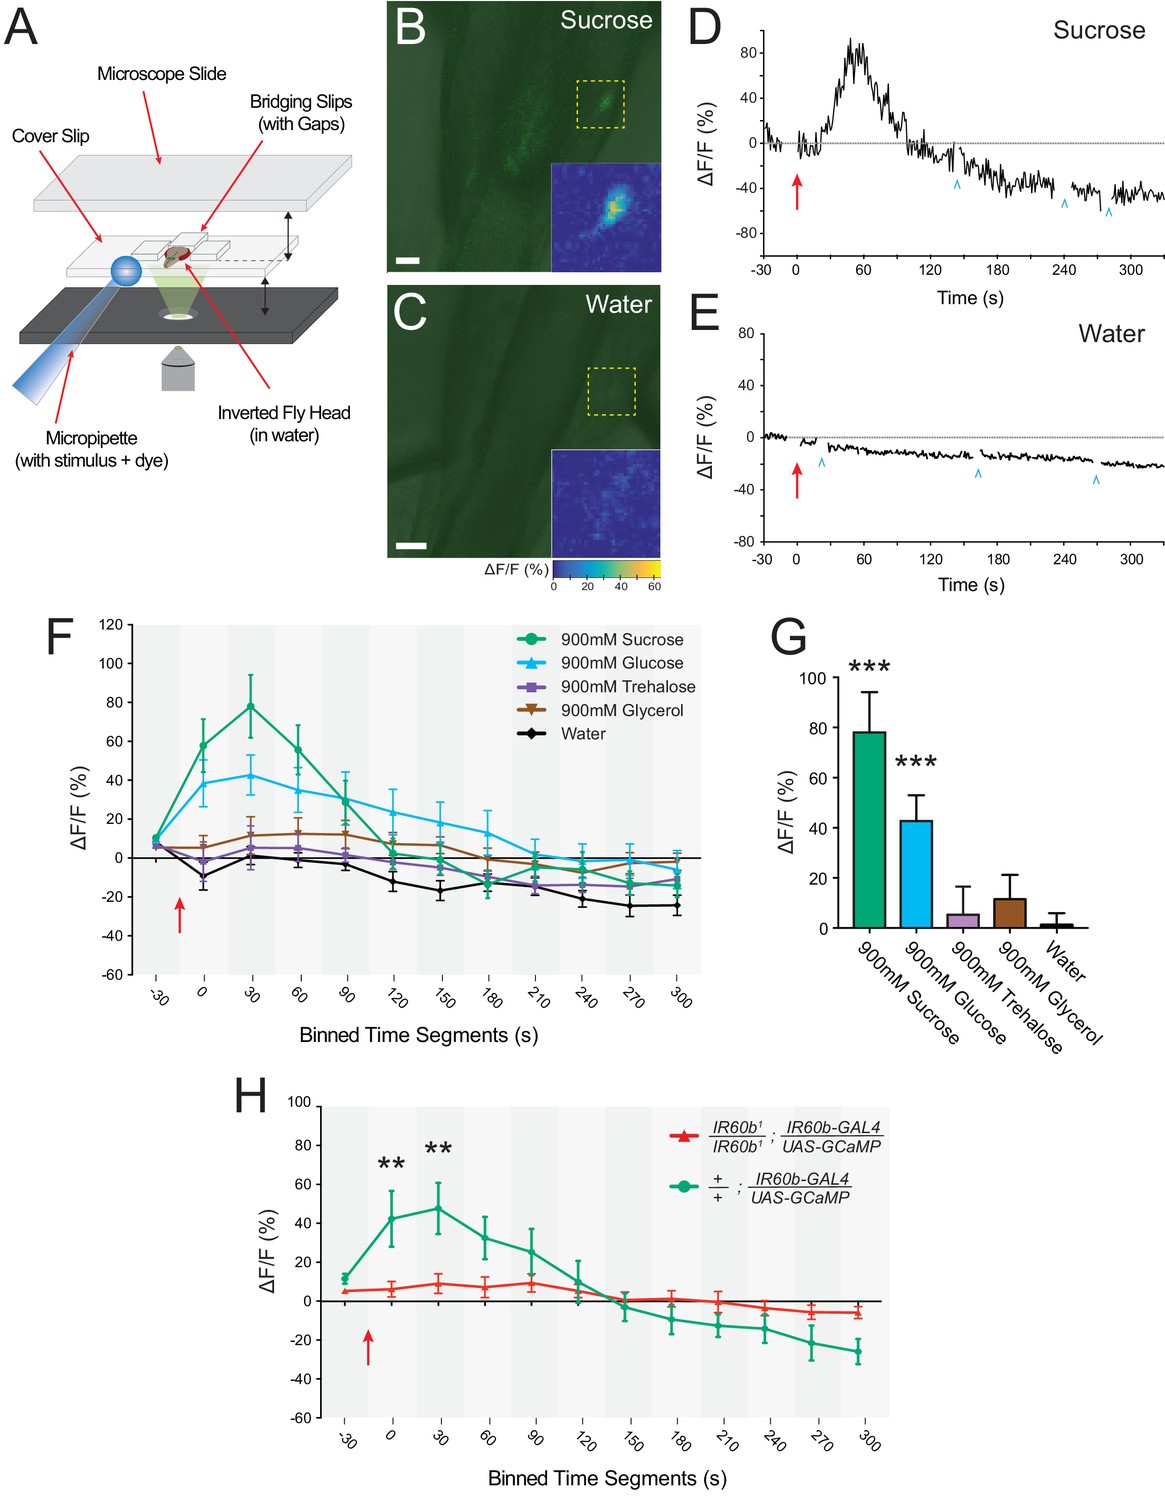
The IR60b neuron responds to sucrose and the response depends on IR60b .
(A) The preparation used for imaging of cell bodies of the IR60b neurons. (B–C) Confocal images of merged green fluorescence and DIC channels showing IR60b-GAL4/+; IR60b-GAL4/UAS-GCaMP6s preparations during the delivery of (B) 900 mM sucrose or (C) water. Inset heat maps show the change in fluorescence at 60 s, after the addition of the stimulus. Yellow dashed boxes outline the regions shown in heat maps. Scale bars = 10 um. (D–E) Representative traces showing changes in fluorescence for (D) the 900mM sucrose stimulus or (E) water. Blue arrowheads indicate frames excluded because the sample was being re-focused to the appropriate plane of focus. Red arrows indicate time of stimulus application. (F) Time course of change in fluorescence (∆F/F) for flies that received the indicated stimuli. Values on x-axis represent binned, 30 s intervals, for example, “0” indicates the 0-29 s bin; “30” indicates the 30-59 s bin. The 900mM sucrose response differed from the water response between 0 and 120 s (p***<0.001 for 0-29 s, 30-59 s, and 60-89 s bins; *p<0.05 for the 90-119 s bin, two-way ANOVA, Bonferroni post-test, n=7-12). The response to the 900 mM glucose stimulus differed from the water response between 0 and 180 s (p***<0.001 for 0-29 s and 30-59 s bins, and **p<0.01 for 60-89 s, 90-119 s, 120-149 s, and 150-179 s bins, n=7-12). (G) Bar graph of ∆F/F values from the 30-59 s bin in (F), illustrating differences during the bin of maximal fluorescence. (H) Time course of fluorescence in IR60b1/IR60b1; IR60b-GAL4/UAS-GCaMP6s flies and control flies in response to 900mM sucrose. Values on x-axis are binned in 30 s intervals as in (F). ∆F/F values differed between 0 and 60 s (**p<0.01 for 0-29 s and 30-59 s bins, two-way ANOVA, Bonferroni post-test, n=7-12).
Figure 7—figure supplement 1
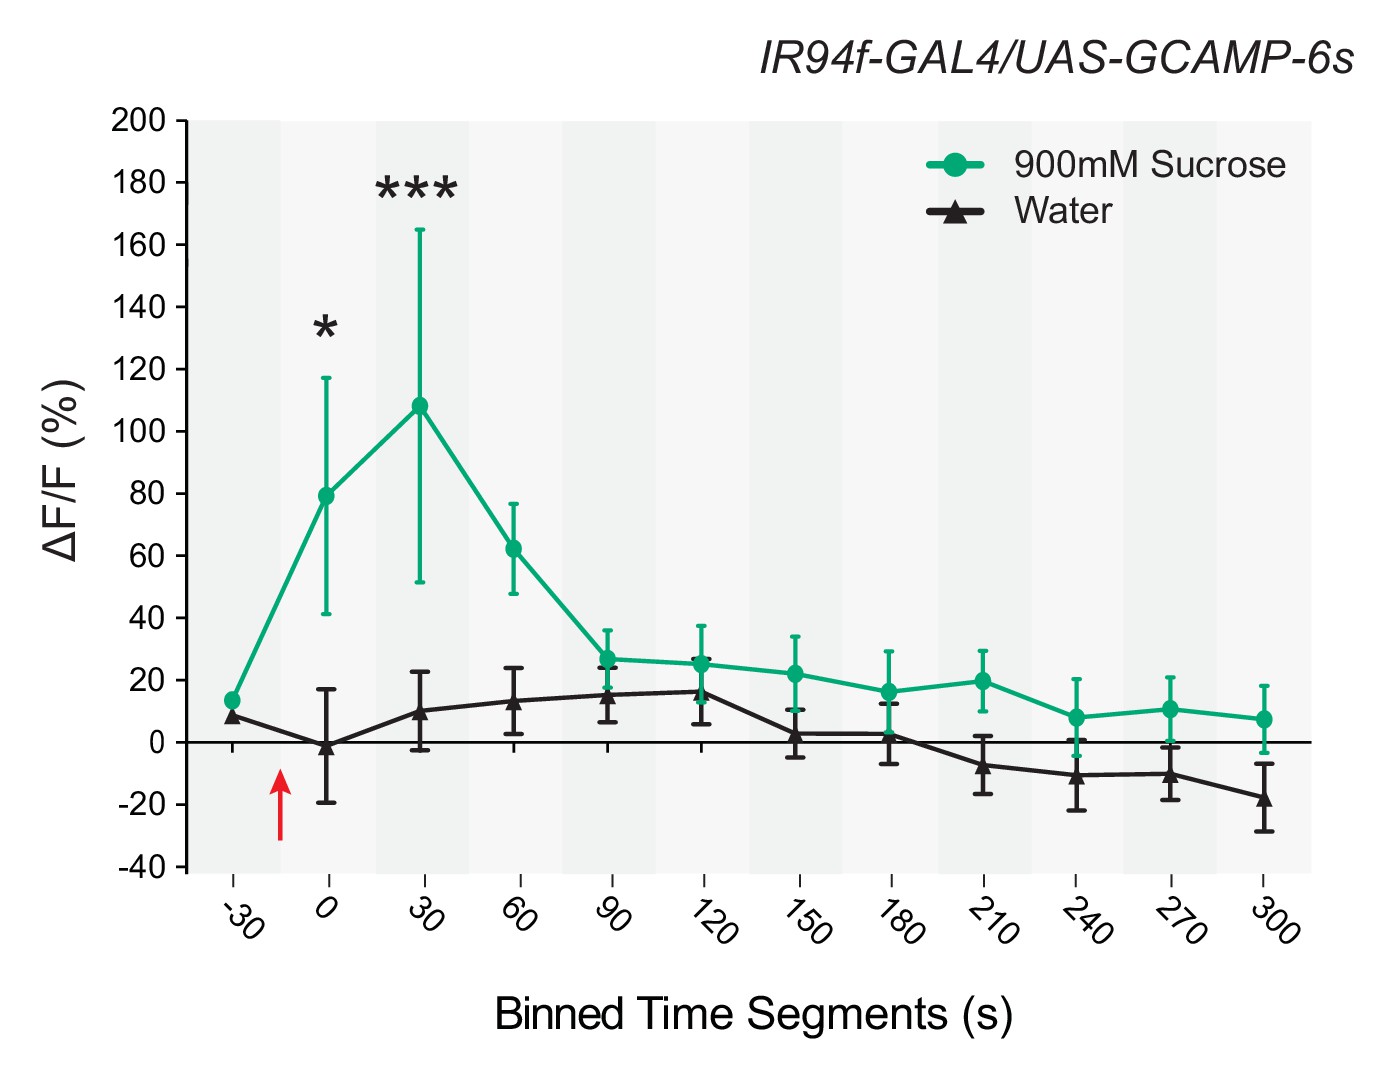
Response to sucrose in a neuron in which UAS-GCaMP6s is driven by IR94f-GAL4 .
Time course of ∆F/F values for binned, 30 s intervals of responses to 900 mM sucrose or water in IR94f-GAL4/UAS-GCaMP6s flies. Values on x-axis represent binned, 30 s intervals, for example, 0 indicates the 0–29 s bin, and 30 indicates the 30–59 s bin, etc. ∆F/F values between the groups were different between 0 and 60 s (p* < 0.05 for the 0–29 s bin, ***p<0.001 for the 30–59 s bin, two-way ANOVA, Bonferroni post-test, n = 6–9). These data are consistent with mapping results indicating that IR94f and IR60b are co-expressed and further confirm that the IR60b neuron is responsive to sucrose.
Figure 8
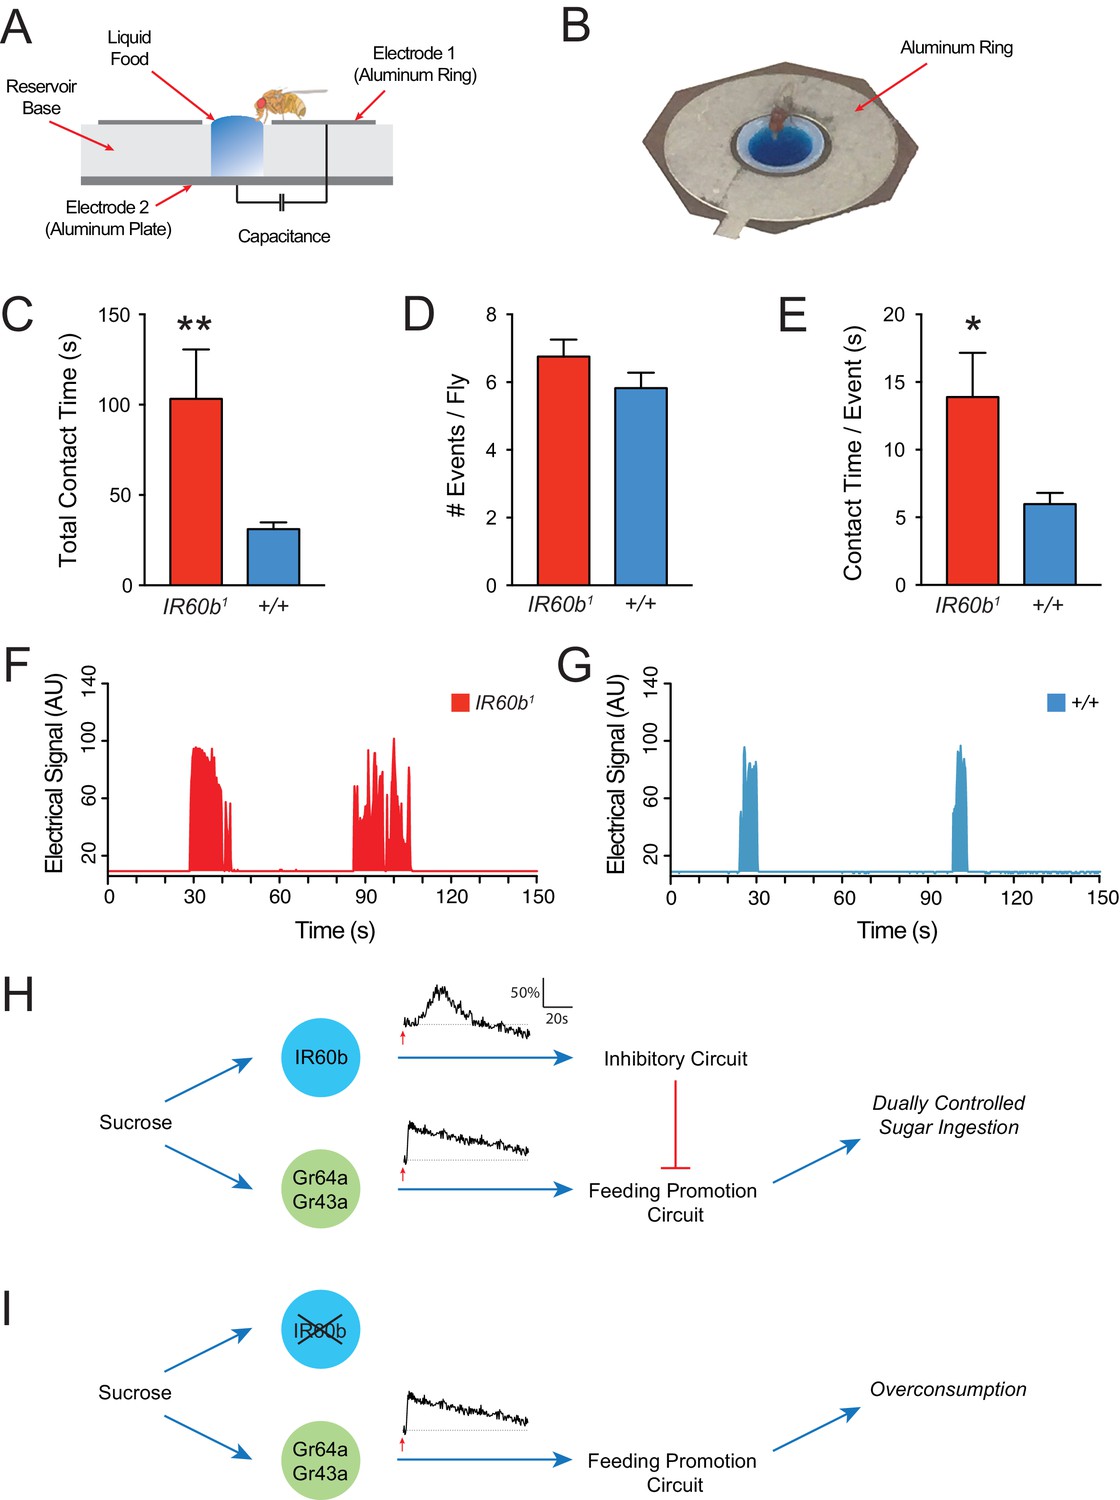
The IR60b receptor limits sucrose consumption in freely moving animals.
(A) The FLIC assay. Diagram has been adapted from the illustration depicted in Figure 1B from Itskov et al. (2014). (B) Fly contacting sucrose solution in a chamber of the FLIC apparatus. (C) Total contact time, (D) number of contacts with liquid food per fly, (E) contact time per contact event, for IR60b1/IR60b1 and control w Canton S (+/+). **p<0.01, *p<0.05, Student’s two-tailed t-test, n = 44–46. (F,G) Examples of contact events of mutant and control flies. The durations of contact events are longer in the mutant. Mated females in (A–G) were starved for 12 hr using the same protocol as in the pharyngeal pumping assays. Results were analyzed using custom software code (Tam, 2017). (H) A dual-control model for regulation of short-term sucrose consumption by pharyngeal neurons. After the fly encounters an acceptable food source, the Gr64a/Gr43a neuron would be activated and promote a feeding response. The IR60b neuron would be activated subsequently and activate a circuit that inhibits the Gr64a/Gr43a neuron, thereby limiting feeding. The absence of IR60b would lead to overconsumption (I).
Additional files
-
Supplementary file 1
Sequences for various primers used in CRISPR generation of IR60b mutant.
(A) cloning primers generated for the CRISPR guide chiRNA, (B) CRISPR donor plasmid, and (C) screening to verify the removal of IR60b coding regions. In (A), lowercase nucleotides denote primer sequences homologous to the Gibson Assembly plasmid regions.
- https://doi.org/10.7554/eLife.24992.016
Download links
A two-part list of links to download the article, or parts of the article, in various formats.
Downloads (link to download the article as PDF)
Open citations (links to open the citations from this article in various online reference manager services)
Cite this article (links to download the citations from this article in formats compatible with various reference manager tools)
A receptor and neuron that activate a circuit limiting sucrose consumption
eLife 6:e24992.
https://doi.org/10.7554/eLife.24992


