Expression of SREBP-1c Requires SREBP-2-mediated Generation of a Sterol Ligand for LXR in Livers of Mice
- University of Texas Southwestern Medical Center, United States
Figures
Figure 1
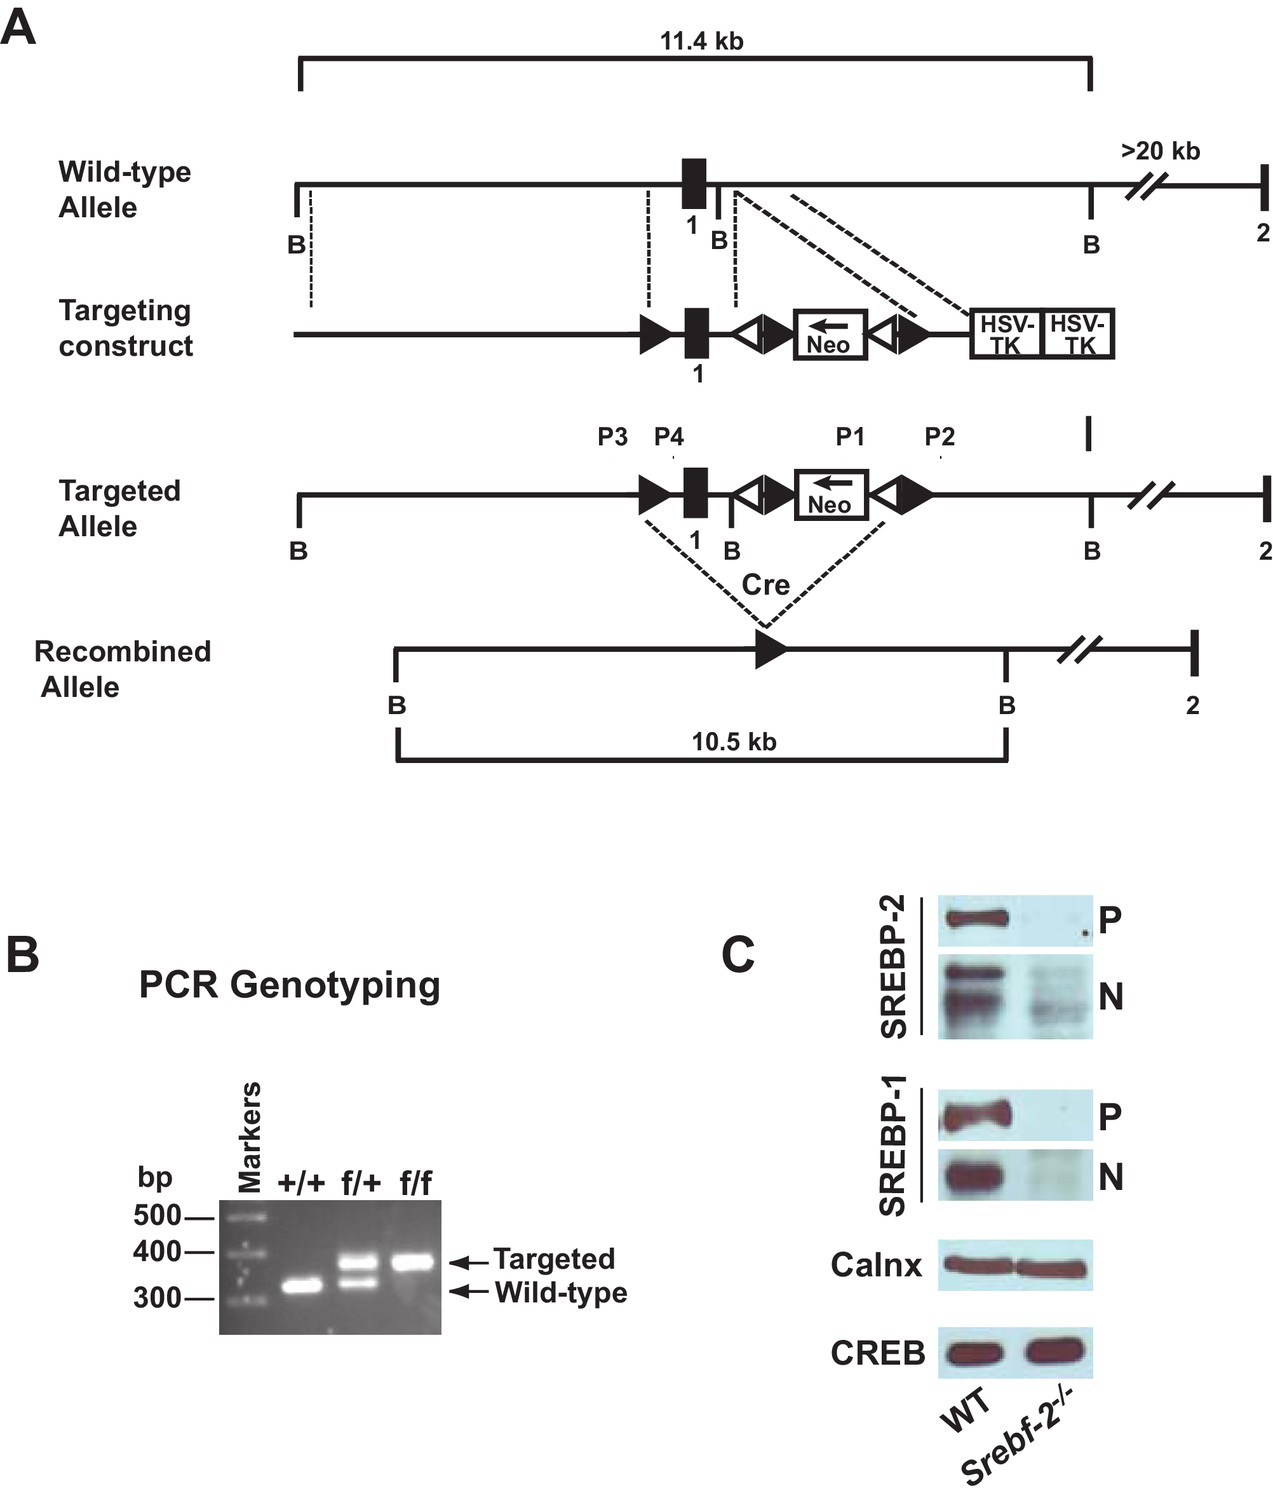
Gene-targeting strategy and characterization of the floxed Srebf-2 allele.
(A) Schematic of gene-targeting strategy. Cre-mediated excision of the sequences flanked by the loxP sites deletes 660 bp of the Srebf-2 promoter and exon 1, which includes the initiator methionine and residues encoding the NH2-terminal domain of Srebf-2. The positions of primers (P1 and P2, P3 and P4) used for PCR detection of homologous recombination are denoted by arrowheads. (B) Genotype analysis of the conditionally targeted Srebf-2 mice by PCR of tail-derived DNA. (C) Levels of proteins in the livers of WT and hepatocyte-Srebf-2-/- mice. Nuclear and membrane protein was made from each mouse liver described in Table 1 and equal aliquots from each were pooled (total, 30 µg) and subjected to SDS-PAGE and immunoblot analysis was carried out for the indicated protein as described in ‘Materials and methods.’ The precursor and nuclear form of SREBPs were denoted as P and N, respectively.
Figure 2
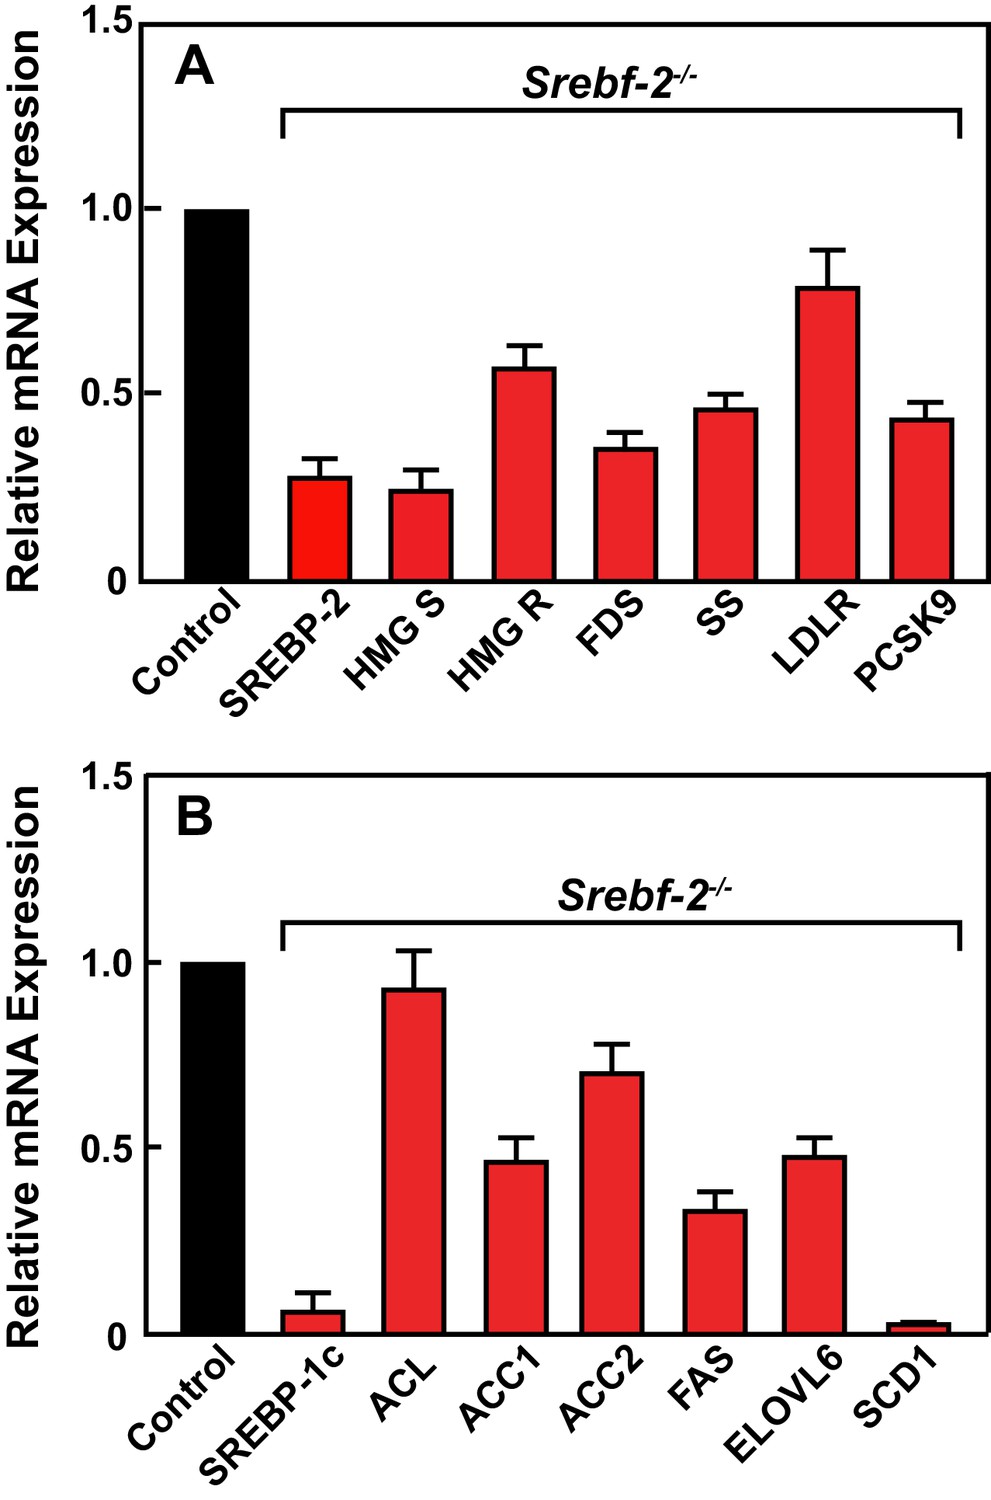
Levels of mRNAs in livers of WT and hepatocyte-Srebf-2-/- mice.
Total RNA from livers of each mouse liver described in Table 1 was subjected to real-time RT-PCR as described in ‘Materials and methods.’ Apo B was used as the invariant control. Values represent the amount of mRNA relative to those in the wild-type mice, which are arbitrarily assigned a value of 1. (A) Genes involved in cholesterol homeostasis. (B) Genes involved in FA homeostasis.
Figure 3
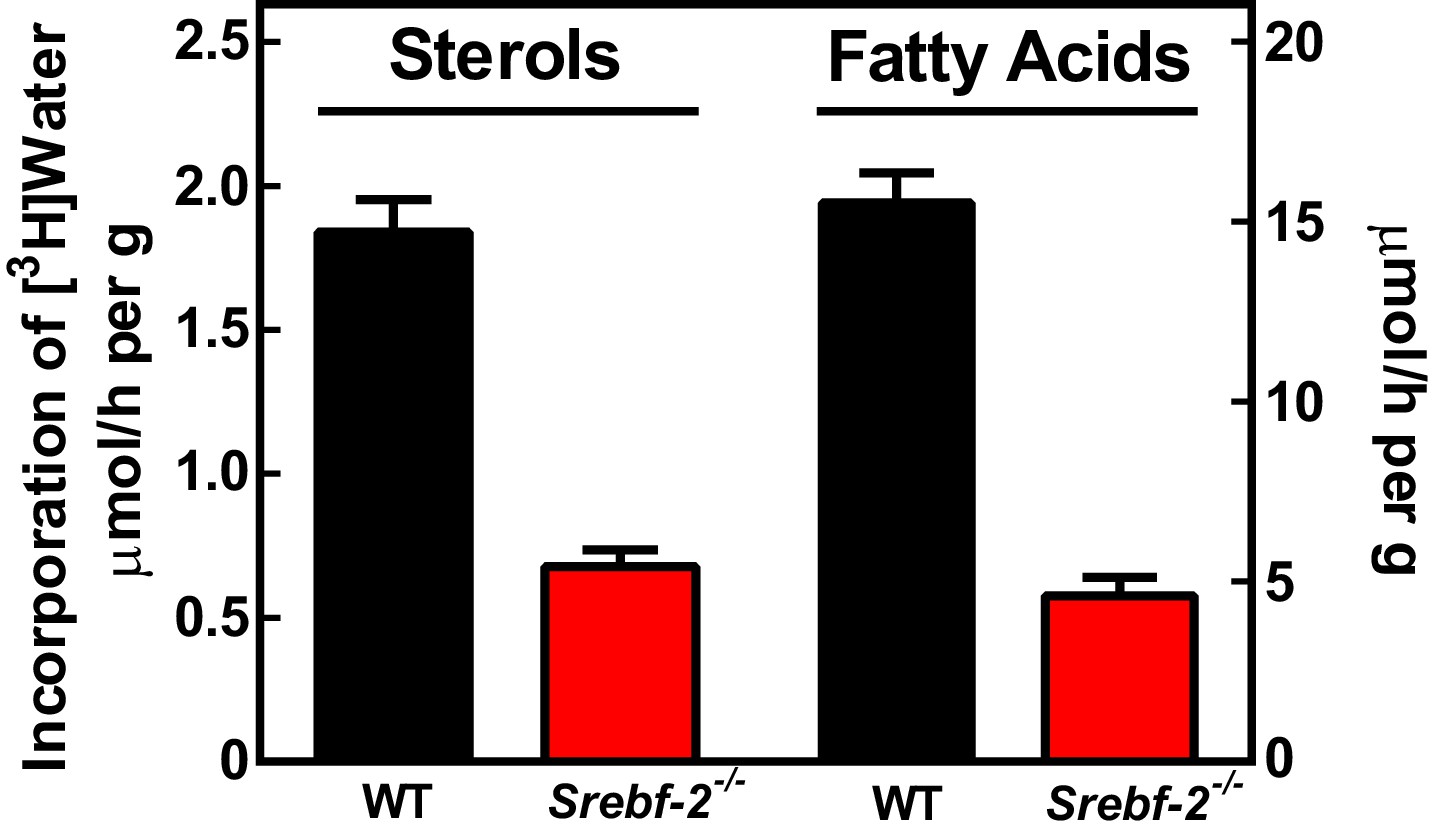
In vivo sterol and FA synthesis rates in livers of WT and hepatocyte-Srebf-2-/- mice.
Six 4-month-old male WT and hepatocyte-Srebf-2-/- mice were injected intraperitoneally with 50 mCi 3H-labeled water and rates of hepatic sterol and FA synthesis were determined as described in ‘Materials and methods'.
Figure 4 with 1 supplement

Levels of mRNAs and proteins in the livers of WT and hepatocyte-Srebf-2-/-mice fed chow diet supplemented with an LXR agonist.
Mice 7–11 weeks of age were fed ad libitum chow or chow supplemented with 25 mg/kg of a LXR agonist (T901317) for three weeks prior to study. (A) Liver membrane and nuclear extract protein was made from each mouse and equal aliquots were pooled (total, 30 µg) and subjected to SDS-PAGE and immunoblot analysis as described in ‘Materials and methods.’ The precursor and nuclear form of SREBPs are denoted as P and N, respectively. (B) Total RNA from each mouse liver was subjected to real-time RT-PCR as described in ‘Materials and methods.’ Apo B was used as the invariant control. Values represent the amount of mRNA relative to those in the WT mice, which are arbitrarily assigned a value of 1. The following figure supplements are available for Figure 4.
Figure 4 —figure supplement 1
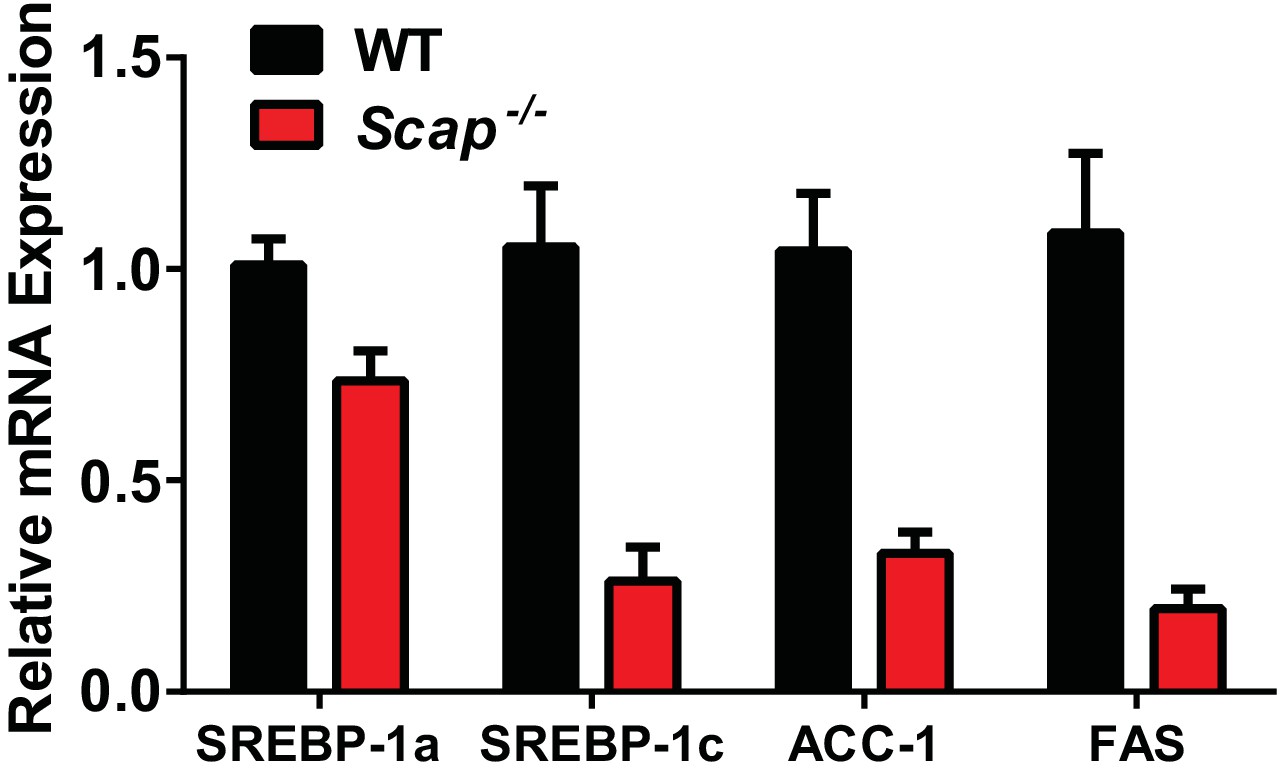
Liver mRNAs levels of WT and hepatocyte-Scap-/- mice fed chow diet supplemented with an LXR agonist.
https://doi.org/10.7554/eLife.25015.007
Figure 5
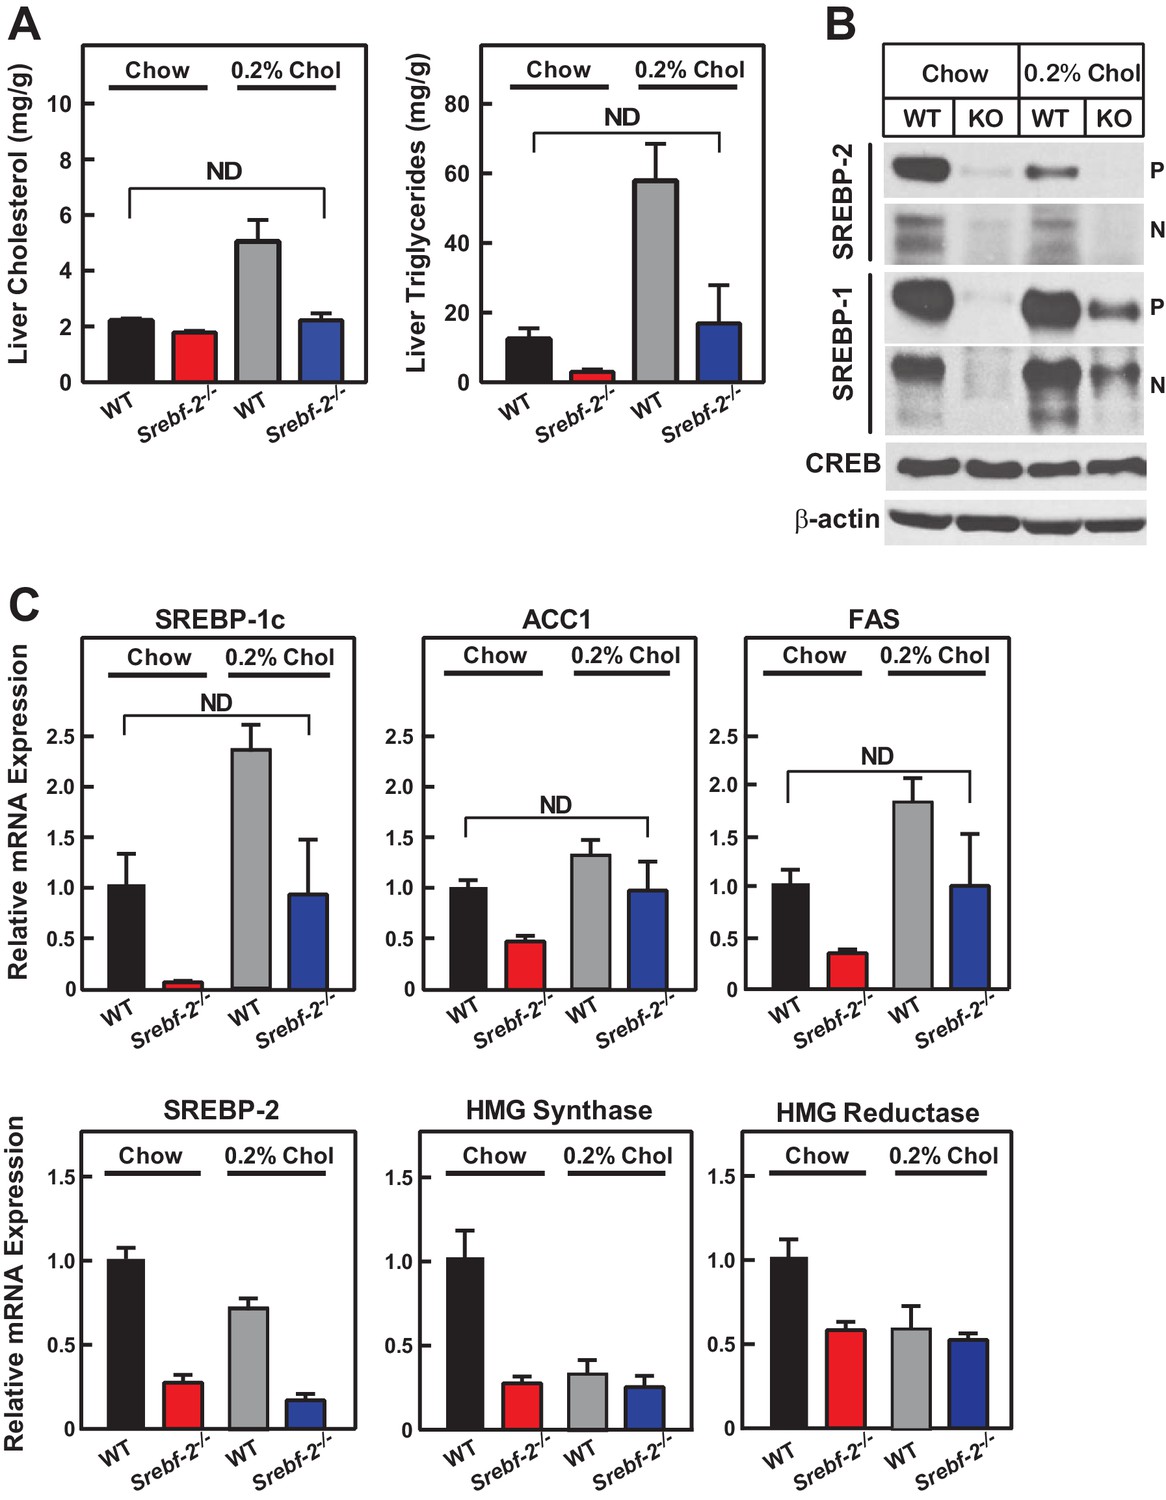
Liver lipid concentrations, mRNA, and protein levels in WT and hepatocyte-Srebf-2-/- mice fed chow or chow supplemented with cholesterol.
Mice 7–11 weeks of age were fed chow (n = 6–7) or chow supplemented with 0.2% cholesterol (n = 6–7) for six weeks prior to study. (A) Liver cholesterol and TG concentrations were measured as described in ‘Materials and methods.’ (B) Equal aliquots of nuclear and membrane protein from each mouse liver were pooled (total, 30 µg) and subjected to SDS-PAGE and immunoblot analysis for the indicated protein as described in ‘Materials and methods.’ The precursor and nuclear form of SREBPs were denoted as P and N, respectively. (C) Total RNA from the livers of each mouse was subjected to real-time RT-PCR as described in ‘Materials and methods.’ Apo B was used as the invariant control. Values represent the amount of mRNA relative to those in WT mice, which are arbitrarily assigned a value of 1. * denotes a level of statistical significance of p<0.05 (Student’s t test) between WT and hepatic-Srebf-2-/-mice, ND denotes no significant difference between the indicated groups.
Figure 6
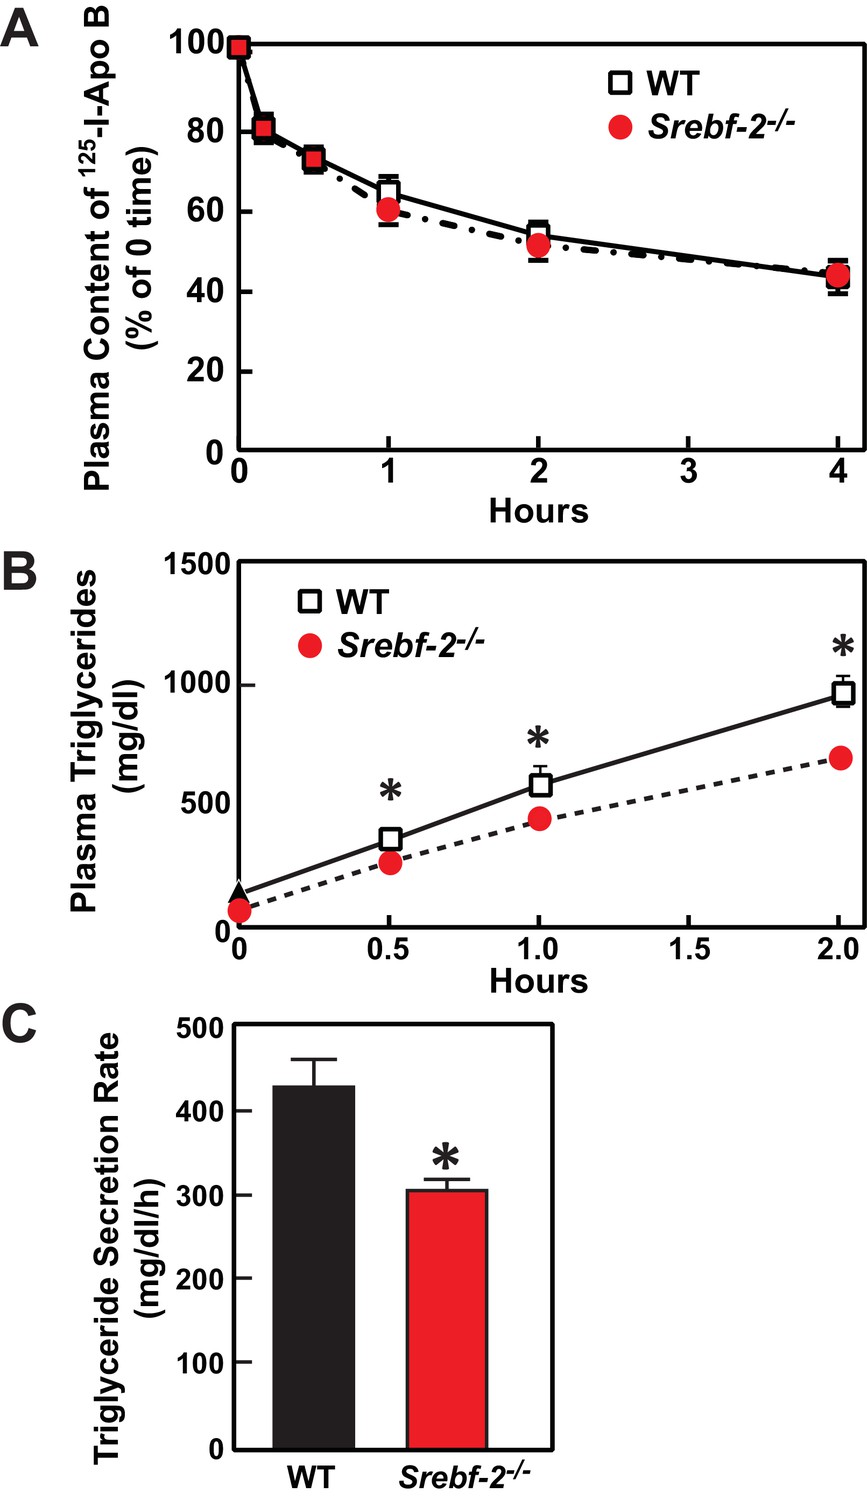
In vivo VLDL secretion and LDL clearance in WT and hepatocyte-Srebf-2-/- mice.
(A) Eleven male mice (8 weeks of age) of each genotype were subjected to i.v. injection of 125I-labeled LDL (15 µg of protein, 496 cpm/ng protein). Blood was obtained at 30 s (time 0) and 10, 30, 60, 120, and 240 min for the quantification of plasma content of 125I-labeled apoB. Data were plotted as the percentage of 0 time value. (B) Five male mice (8 wks of age) of each genotype were fasted for 4 hr prior to the study. Each mouse was injected i.v. with 10% triton-saline solution at 500 mg/kg. Plasma TG accumulation of each mouse at 0, 0.5, 1, and 2 hr after the triton injection were measured. (C) Plasma TG secretion rate during a detergent block of lipolysis was calculated for each mouse from the linear regression analysis of the time vs. TG concentration.
Tables
Table 1
Phenotypic comparison of WT and hepatocyte-Srebf-2-/- mice. Male mice 12–13 wks of age fed chow ad lib were sacrificed and blood and tissues obtained. Each value represents mean ± SEM.
| Parameters | WT | Srebf-2-/- | ||
|---|---|---|---|---|
| Number of mice | 6 | 6 | ||
| Body weight (g) | 33.1 ± 1.0 | 27.7 ± 1.0* | ||
| Liver weight (g) | 1.32 ± 0.13 | 1.28 ± 0.09 | ||
| Plasma cholesterol (mg/dl) | 104 ± 12.3 | 33.7 ± 6.6* | ||
| Plasma TGs (mg/dl) | 94.8 ± 12.5 | 47.7 ± 1. 4* | ||
| Liver cholesterol (mg/g) | 2.21 ± 0.08 | 1.78 ± 0.06* | ||
| Liver TGs (mg/g) | 12.4 ± 3.09 | 2.98 ± 0.72* | ||
-
*Denotes the level of statistical significance of p<0.05 (Student’s t test) between WT and hepatocyte-Srebf-2-/- mice.
Table 2
Phenotypic parameters in fasted and refed WT and hepatocyte-Srebf-2-/- mice. Male mice 9–12 wks of age were subjected to fasting and refeeding as described in ‘Materials and methods.’ Each value represents the mean ± SEM.
| Parameter | WT | Srebf-2-/- | |||
|---|---|---|---|---|---|
| Fasted | Refed | Fasted | Refed | ||
| Number | 6 | 6 | 6 | 6 | |
| Body weight (g) | 22.7 ± 1.4 | 25.8 ± 1.1 | 19.0 ± 1.3 | 21.7 ± 1.2* | |
| Liver weight (g) | 0.92 ± 0.07 | 1.53 ± 0.19 | 0.82 ± 0.10 | 1.23 ± 0.13 | |
| Liver cholesterol (mg/g) | 1.80 ± 0.08 | 1.02 ± 0.03 | 1.03 ± 0.05* | 0.71 ± 0.07* | |
| Liver triglycerides (mg/g) | 52.6 ± 11 | 10.3 ± 1.8 | 33.2 ± 4.8 | 3.0 ± 0.5* | |
| Plasma cholesterol (mg/dl) | 142 ± 9.0 | 90.2 ± 15 | 63.3 ± 7.3* | 43.6 ± 6.1* | |
| Plasma triglyceride (mg/dl) | 142 ± 11 | 122 ± 16 | 58.5 ± 4.6* | 28.9 ± 3.8* | |
| Plasma insulin (ng/ml) | 0.07 ± 0.01 | 1.00 ± 0.30 | 0.08 ± 0.02 | 0.48 ± 0.17 | |
| Plasma glucose (mg/dl) | 184 ± 28 | 220 ± 14 | 121 ± 14 | 182 ± 16 | |
-
* denotes a level of statistical significance of p<0.05 (Student’s t test) between WT and hepatocyte-Srebf-2 -/- mice.
Table 3
Gene expression in the livers of fasted and refed WT and hepatocyte-Srebf-2-/- mice. Total RNA from livers of each mouse liver described in Table 2 was subjected to real-time RT-PCR as described in ‘Materials and methods.’ ApoB was used as the invariant control mRNA. Each value represents the amount of mRNA relative to that in fasted WT mice, which is arbitrarily defined as 1.
| WT | Srebf-2-/- | ||||
|---|---|---|---|---|---|
| Fasted | Refed | Fasted | Refed | ||
| SREBP Pathway | |||||
| SREBP-2 | 1.0 ± 0.1 | 1.4 ± 0.1 | 0.1 ± 0.0 | 0.5 ± 0.1 | |
| SREBP-1a | 1.0 ± 0.1 | 2.6 ± 0.3 | 1.2 ± 0.1 | 4.7 ± 1.2 | |
| SREBP-1c | 1.0 ± 0.1 | 41 ± 2.0 | 0.2 ± 0.0 | 2.7 ± 1.5 | |
| Cholesterol Metabolism | |||||
| LDLR | 1.0 ± 0.0 | 3.0 ± 0.2 | 1.0 ± 0.1 | 2.3 ± 0.2 | |
| HMG-CoA synthase | 1.0 ± 0.1 | 11 ± 1.8 | 0.7 ± 0.1 | 2.7 ± 0.8 | |
| HMG-CoA reductase | 1.0 ± 0.0 | 11 ± 1.2 | 1.0 ± 0.1 | 4.1 ± 0.8 | |
| Squalene synthase | 1.0 ± 0.1 | 4.3 ± 0.5 | 0.8 ± 0.1 | 1.1 ± 0.2 | |
| Fatty Acid Metabolism | |||||
| Acetyl-CoA Carboxylase1 | 1.0 ± 0.1 | 18 ± 2.3 | 0.7 ± 0.0 | 6.9 ± 1.4 | |
| Fatty acid synthase | 1.0 ± 0.1 | 92 ± 7.6 | 0.4 ± 0.0 | 16 ± 6.0 | |
| ELOVL6 | 1.0 ± 0.1 | 55 ± 7.4 | 0.7 ± 0.1 | 10 ± 2.8 | |
| Stearoyl-CoA desaturase 1 | 1.1 ± 0.2 | 31 ± 5.4 | 0.0 ± 0.0 | 1.8 ± 1.0 | |
| PNPLA3 | 1.3 ± 0.5 | 211 ± 43 | 1.9 ± 0.3 | 29 ± 7.8 | |
| CHREBP | 1.0 ± 0.1 | 3.4 ± 0.2 | 0.7 ± 0.0 | 1.4 ± 0.2 | |
| Glucose Metabolism | |||||
| Glucokinase | 1.2 ± 0.3 | 51 ± 3.3 | 1.8 ± 0.3 | 17 ± 3.2 | |
| G6PD | 1.0 ± 0.1 | 10 ± 2.1 | 2.6 ± 0.4 | 8.4 ± 3.2 | |
| PEPCK | 1.0 ± 0.1 | 0.0 ± 0.0 | 1.1 ± 0.1 | 0.1 ± 0.0 | |
| Control | |||||
| ApoB | 1.0 ± 0.1 | 0.9 ± 0.0 | 1.0 ± 0.1 | 0.9 ± 0.1 | |
Additional files
-
Supplementary file 1
Liver sterol and oxysterol concentrations.
Male mice (12–13 wks old in study 1 and 16–18 wks old in study 2) fed chow ad lib were sacrificed and liver sterols and oxysterols were measured with mass spectrometry. Each value represents mean ± SEM. * denotes the level of statistical significance of p<0.05 (Student’s t test) between WT and hepatocyte-Srebf-2-/- mice.
- https://doi.org/10.7554/eLife.25015.012
-
Supplementary file 2
Relative mRNA expression in livers of WT and hepatocyte-Srebf-2-/- mice of Table 1.
Liver was snap frozen and mRNA prepared from the mice shown in Table 1. Each value represents mean ± SEM. * denotes the level of statistical significance of p<0.05 (Student’s t test) between WT and hepatocyte-Srebf-2-/- mice.
- https://doi.org/10.7554/eLife.25015.013
Download links
A two-part list of links to download the article, or parts of the article, in various formats.
Downloads (link to download the article as PDF)
Open citations (links to open the citations from this article in various online reference manager services)
Cite this article (links to download the citations from this article in formats compatible with various reference manager tools)
Expression of SREBP-1c Requires SREBP-2-mediated Generation of a Sterol Ligand for LXR in Livers of Mice
eLife 6:e25015.
https://doi.org/10.7554/eLife.25015


