Ribonuclease L mediates the cell-lethal phenotype of double-stranded RNA editing enzyme ADAR1 deficiency in a human cell line
- Perelman School of Medicine, University of Pennsylvania, United States
- Cleveland Clinic, United States
- Princeton University, United States
Figures
Figure 1
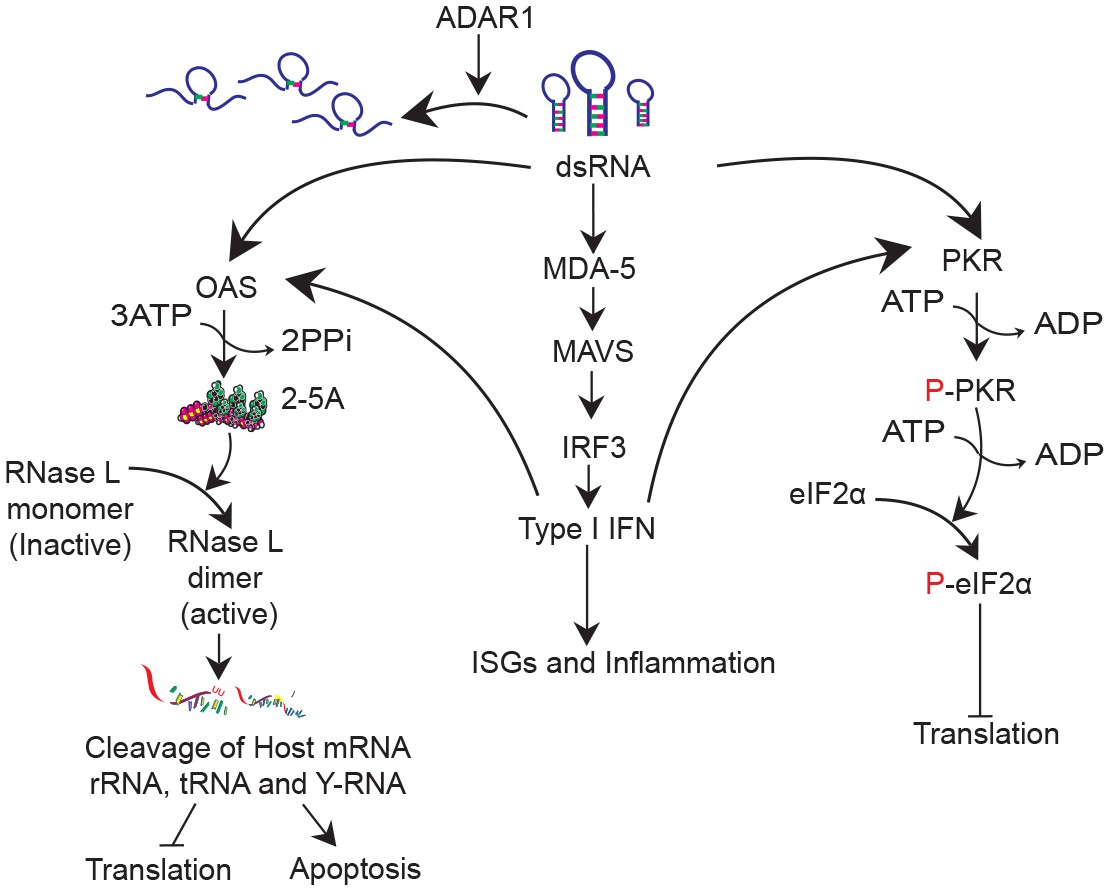
DsRNA induced antiviral pathways.
DsRNA can be destabilized by ADAR1 activity. In the absence of ADAR1 dsRNA can be recognized by (1) MDA5 leading to IFN production; (2) OAS leading to activation of RNase L and eventually translational inhibition and apoptosis and (3) PKR leading to inhibition of translation.
Figure 2 with 1 supplement
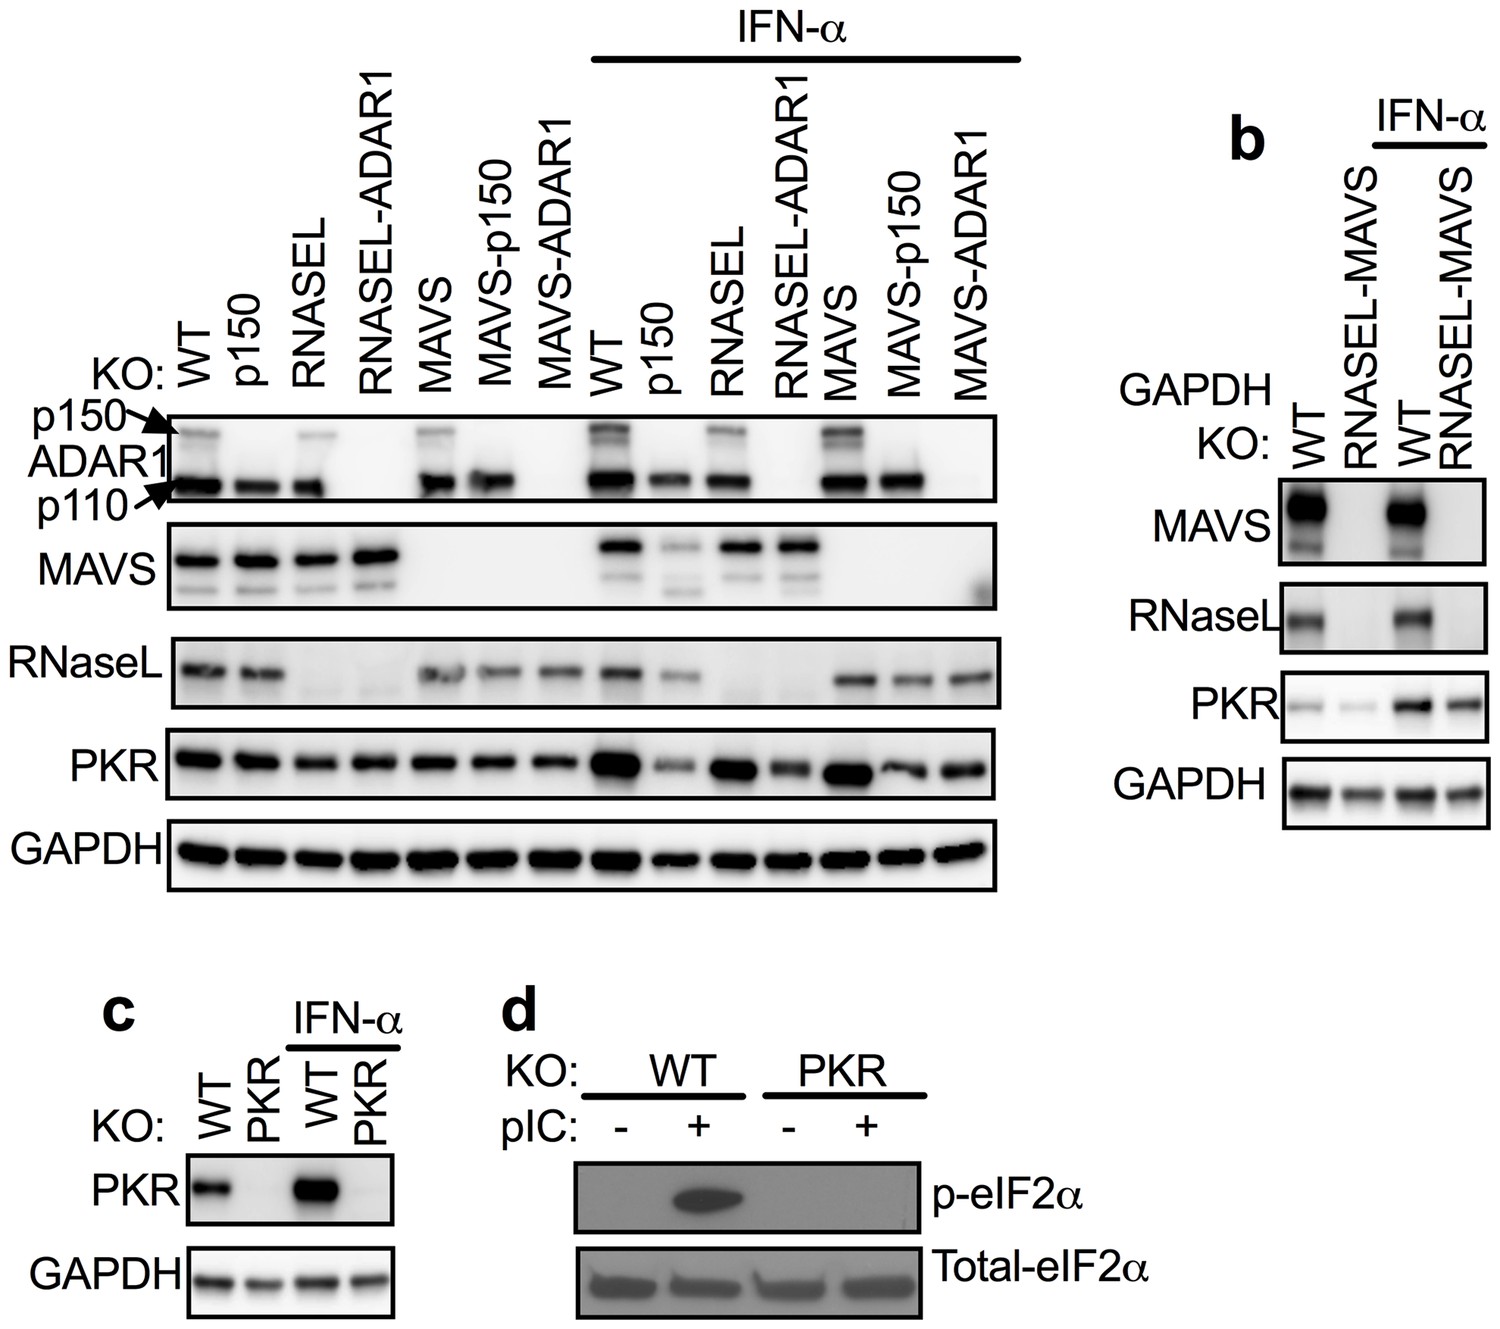
ADAR1 KO cells were rescued from RNASE L KO or MAVS KO but not from WT or PKR KO A549 cells.
(a) WT, WT-p150 KO, RNASEL KO, RNASEL-ADAR DKO, MAVS KO, MAVS-p150 DKO, MAVS-ADAR1 DKO; (PKR expression was induced 1.6–1.9 fold following IFN treatment in cells expressing ADAR1 and reduced 0.3–0.6 fold in cells deleted for ADAR1 or ADAR1 p150; Figure 2—source data 1.) (b) WT or RNASEL-MAVS DKO or (c) WT or PKR KO cells were treated or mock treated with 1000 U/ml IFN-α overnight, lysed and proteins analyzed by Western immunoblotting with antibodies as indicated. (d) WT and PKR KO cells were transfected with pIC (1 µg/ml). After 2 hr, proteins in cell lysates were separated by 12% SDS/PAGE, transferred to PVDF-membranes, and probed with antibodies to detect total eIF2α or phosphorylated eIF2α. Immunoblots (in a–c) were performed at least two times and one representative blot is shown. See Figure 2—figure supplement 1.
-
Figure 2—source data 1
Quantification of PKR induction (+/−- IFN) treatment for Figure 2a.
- https://doi.org/10.7554/eLife.25687.005
Figure 2—figure supplement 1
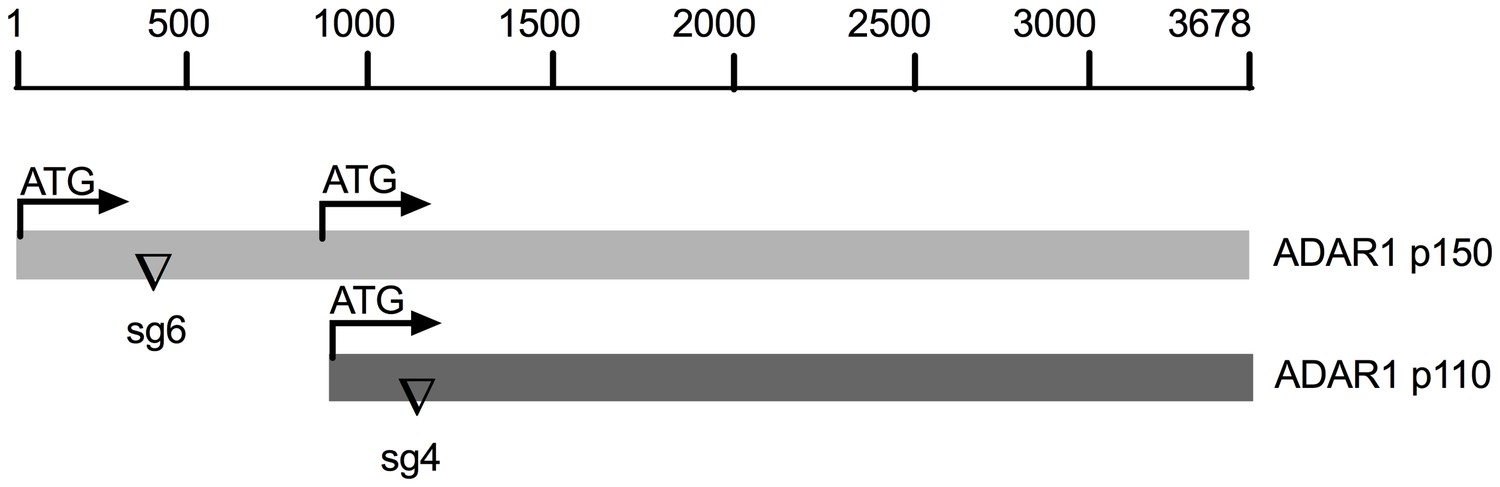
Schematic diagram of sgRNAs targeting the ADAR1 gene.
The mRNA encoding the IFN inducible p150 isoform and constitutively expressed p110 isoform are indicated. The sgRNA6 targeting exon1 of p150 and the sgRNA4 targeting exon1 of p110 were used to knockout expression of p150 or both p150 and p110 respectively.
Figure 3
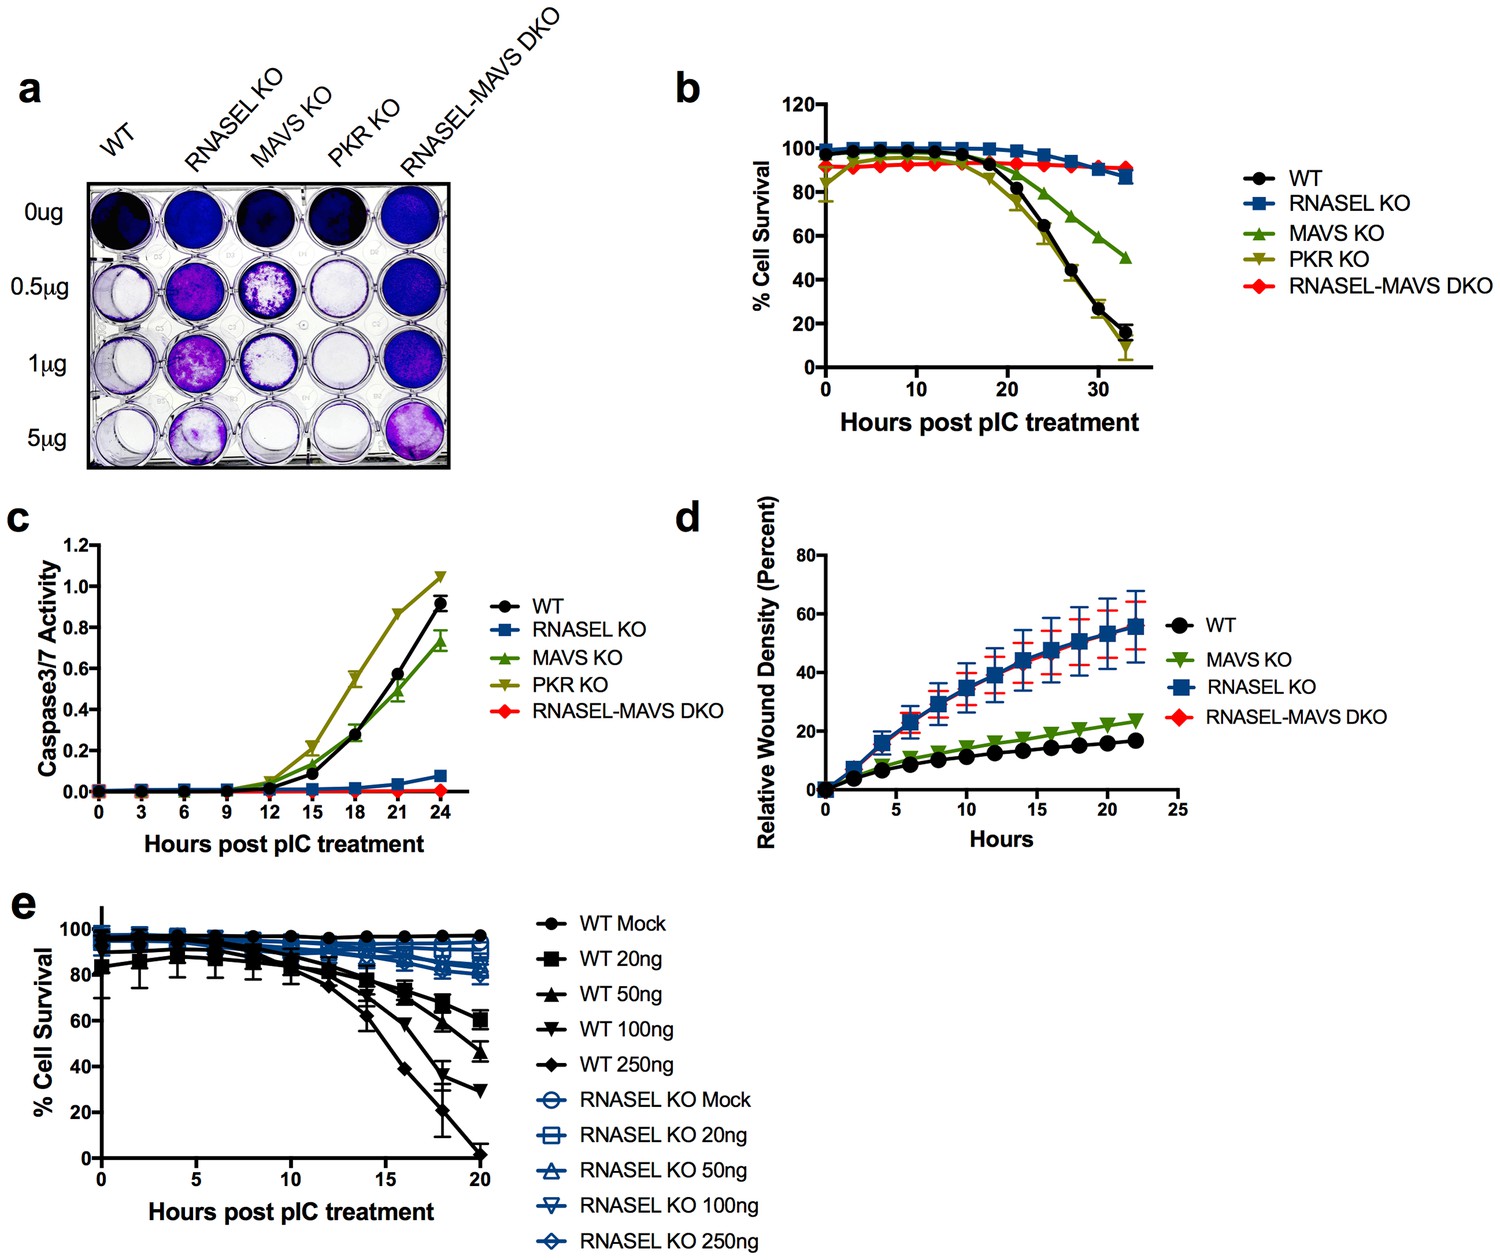
Ablation of RNase L activity attenuates pIC induced cell death and accelerates cell migration.
(a) WT and RNase L, MAVS, PKR KO and RNASEL-MAVS DKO A549 cells were treated with pIC (0 to 5 μg/ml as indicated) and 48 hr later fixed and stained with crystal violet. Data are from one representative experiment of three. (b) WT and KO A549 cells as indicated were transfected with 20 ng/ml pIC and assessed for dead cells and total cells using an IncuCyte system calculated as describe in Methods. Four separate wells were treated with each experimental condition and a minimum of 4 image fields (>10000 cells per well) were analyzed per well. (c) Cells were transfected with 20 ng/ml of pIC and caspase-3/7 activity was determined using an IncuCyte system. Four separate wells were treated with each experimental condition and a minimum of 4 image fields (>10000 cells per well) were analyzed per well. Data represent the means±SD from a minimum of four independent replicates. Similar data were obtained from two additional independent experiments. (d) Cell monolayers were scratched and wound healing was assayed in the IncuCyte system. Wound closure was observed every hour at the indicated times by comparing the mean relative wound density of at least eight technical replicates and a minimum of 2 image fields (>1000 cells per well total) were analyzed per well. Error bars represent standard deviation (SD) from the mean of a minimum of eight. Similar data were obtained from two independent experiments. (e) WT or RNASEL KO HME cells were transfected with 0(mock) or 20, 50, 100 or 250 ng/ml pIC and cell viability was quantified in the IncuCyte system. Four biological replicate wells were treated with each experimental condition and a minimum of 4 image fields (>1000 cells per well total) were analyzed per well. Data is representative of four replicates.
-
Figure 3—source data 1
Excel data for Figure 3.
- https://doi.org/10.7554/eLife.25687.009
Figure 4
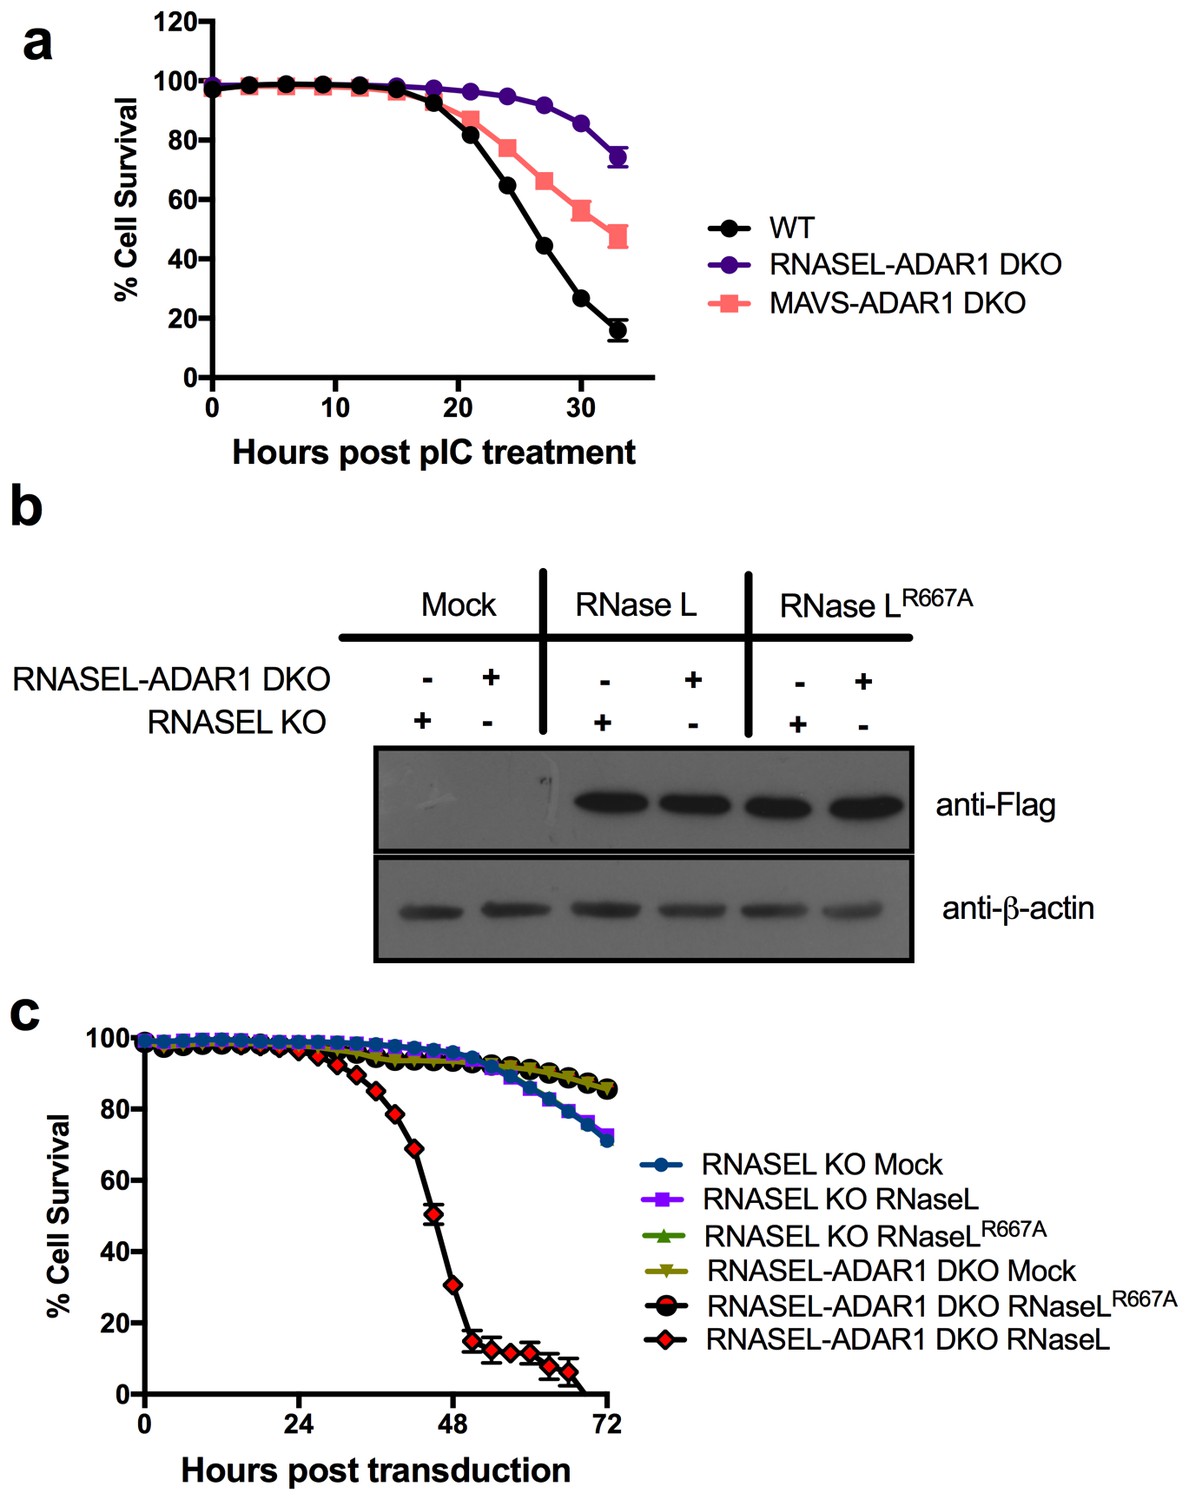
Expression of WT RNase L promotes death of RNASEL-ADAR1 KO cells.
(a) WT and KO A549 cells as indicated were transfected with 20 ng/ml of pIC and assessed for dead cells and total cells. Four separate wells were treated with each experimental condition and a minimum of 4 image fields (>10000 cells per well) were analyzed per well. Data represent the means SD from a minimum of four independent replicates. Similar data were obtained from two additional independent experiments. (The data for WT cells are the same as shown in Figure 3b). (b) RNASEL KO or RNASEL-ADAR1 DKO cells transduced with lentiviruses expressing either WT RNase L or inactive mutant (R667A) RNase L, lysed and proteins analyzed by Western immunoblotting with anti-Flag M2 monoclonal antibody (upper) or with anti-β-actin antibody (lower). (c) RNASEL KO or RNASE L-ADAR1 DKO cells were transduced with lentiviruses expressing either WT RNase L or inactive mutant (R667A) RNase L and dead and total cells assessed in the IncuCyte system. A minimum of four separate wells was treated with each experimental condition and a minimum of 9 image fields were analyzed per well. Data represent the means SD and are from one of two representative experiments. Movies showing cells from 0–72 hr post transduction are shown in Videos 1–4. See Figure 4—source data 1.
-
Figure 4—source data 1
Excel data for Figure 4.
- https://doi.org/10.7554/eLife.25687.012
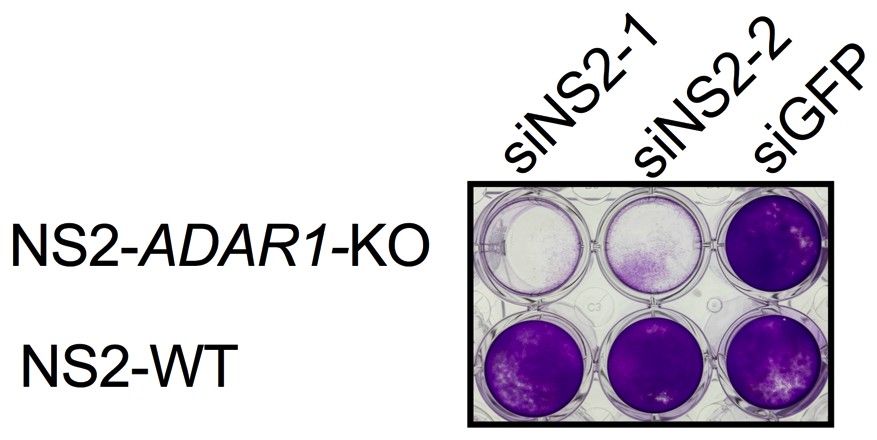
Figure 5 with 1 supplement
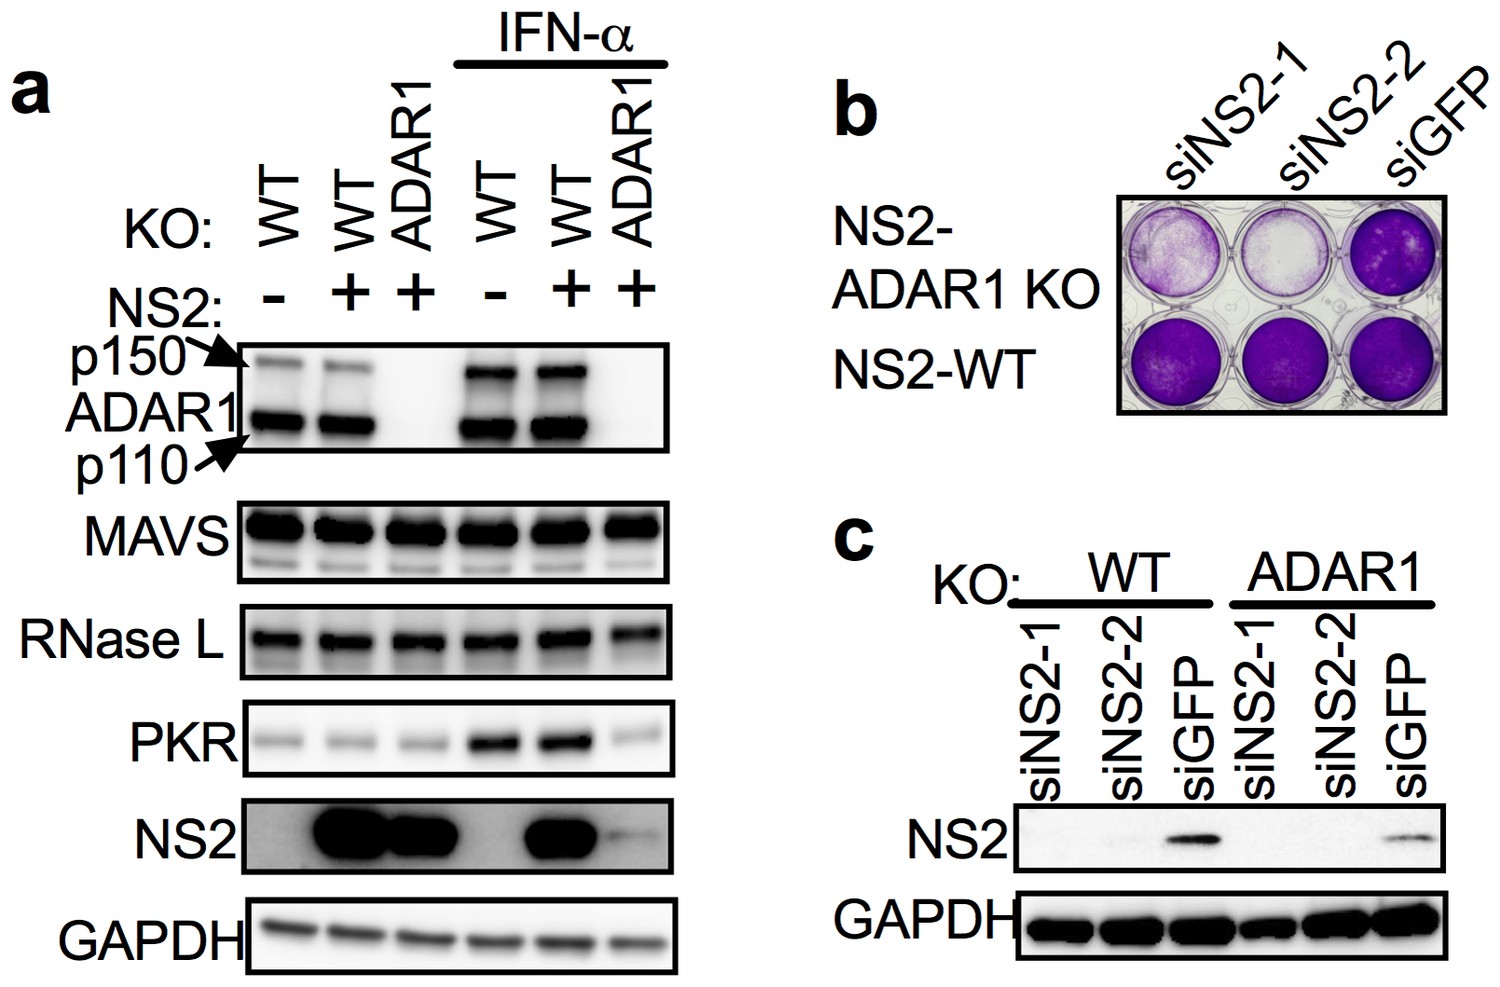
Expression of the MHV NS2 RNase L antagonist activity can rescue ADAR1 KO A549 cells.
(a) WT A549, WT A549 NS2 expressing cells or ADAR1 KO NS2 (clone C12) cells were mock treated or treated with 1000 U/ml of IFN-α overnight, lysed and proteins analyzed by Western immunoblotting with antibodies as indicated (PKR expression was induced 3.5–4.0 fold following IFN treatment in cells expressing ADAR1 and reduced 0.6 fold in cells deleted for ADAR1; Figure 5—source data 1.) (b and c) ADAR1 KO or WT A549 NS2 expressing cells were transfected with siRNAs against NS2 (siNS2-1 and siNS2-2) or siRNA against GFP (siGFP) and (b) 96 hr later cells were fixed and stained with crystal violet or (c) 72 hr later lysed and analyzed by Western immunoblotting. The siRNA knockdown data (b) is from one representative experiment of three. Similar data were obtained with another ADAR1 KO NS2 clone (C7) as shown in Figure 5—figure supplement 1.
-
Figure 5—source data 1
Quantification of PKR induction (+/− IFN) treatment for Figure 5a
- https://doi.org/10.7554/eLife.25687.018
Figure 5—figure supplement 1
Knock down of NS2 expression in an additional clone of ADAR1 KO NS2 expressing cells causes cell death.
ADAR1 KO NS2 expressing cells (clone C7) or WT NS2 expressing cells were transfected with siRNA targeting NS2 (siNS2-1, siNS2-2) or GFP(siGFP). At 48 hr post treatment cells were fixed and stained with crystal violet. Data are from one representative experiment of three.
Figure 6
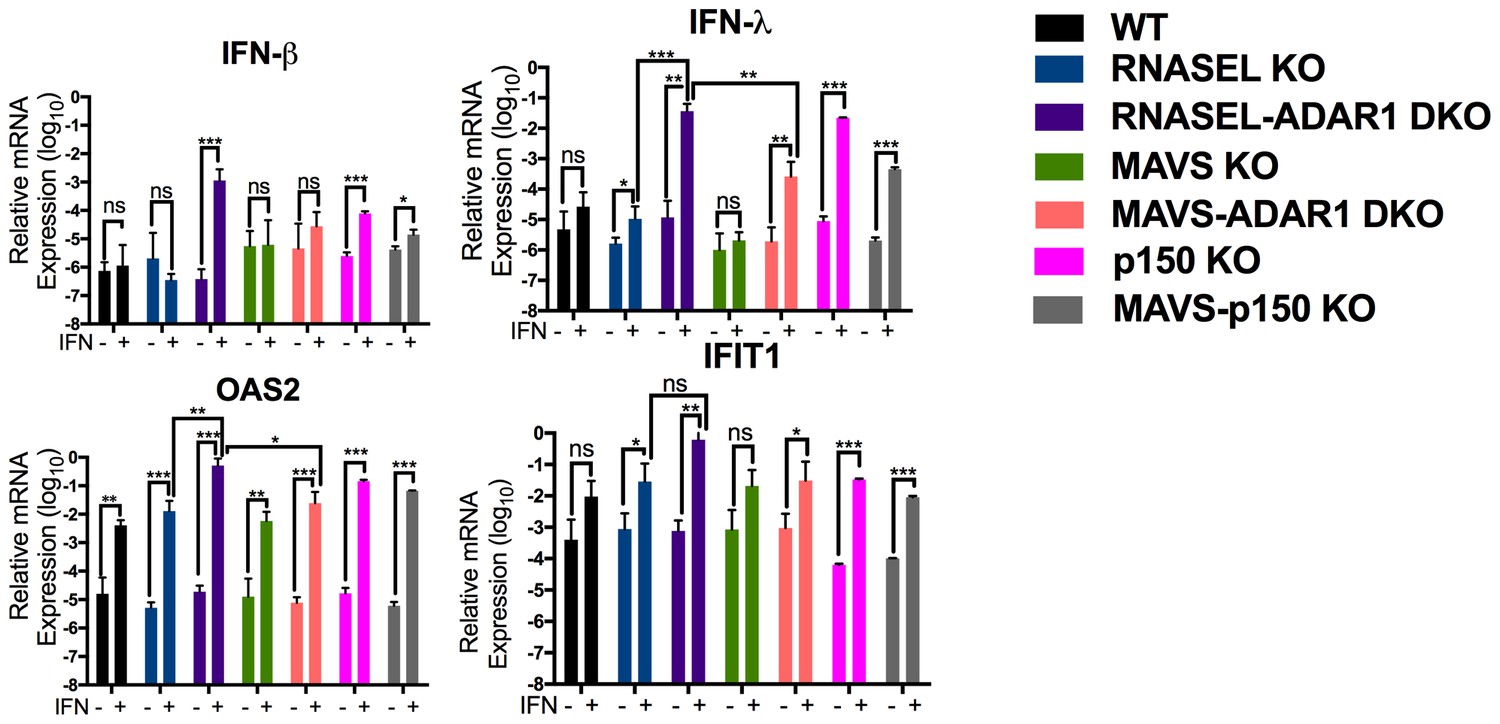
Interferon (IFN) and interferon stimulated gene (ISG) expression following IFN treatment of ADAR1 KO cells.
Cells were treated or mock treated with 10 U/ml of IFN-α and 24 hr post treatment, lysed and RNA extracted. Relative mRNA levels for (a) IFN-β, (b) IFN-λ, (c) OAS2 and (d) IFIT1 were quantified by RT-qPCR, using primers listed in Table 4, and expressed as 2−ΔCT where ΔCT = CT(gene of interest)−CT(β-actin). The data are the average of three independent biological replicates (each with three technical replicates) expressed as means ± SD; *p<0.05, **p<0.01, ***p<0.001. See Figure 6—source data 1 (includes exact P values).
-
Figure 6—source data 1
Excel data for Figure 6.
- https://doi.org/10.7554/eLife.25687.021
Figure 7
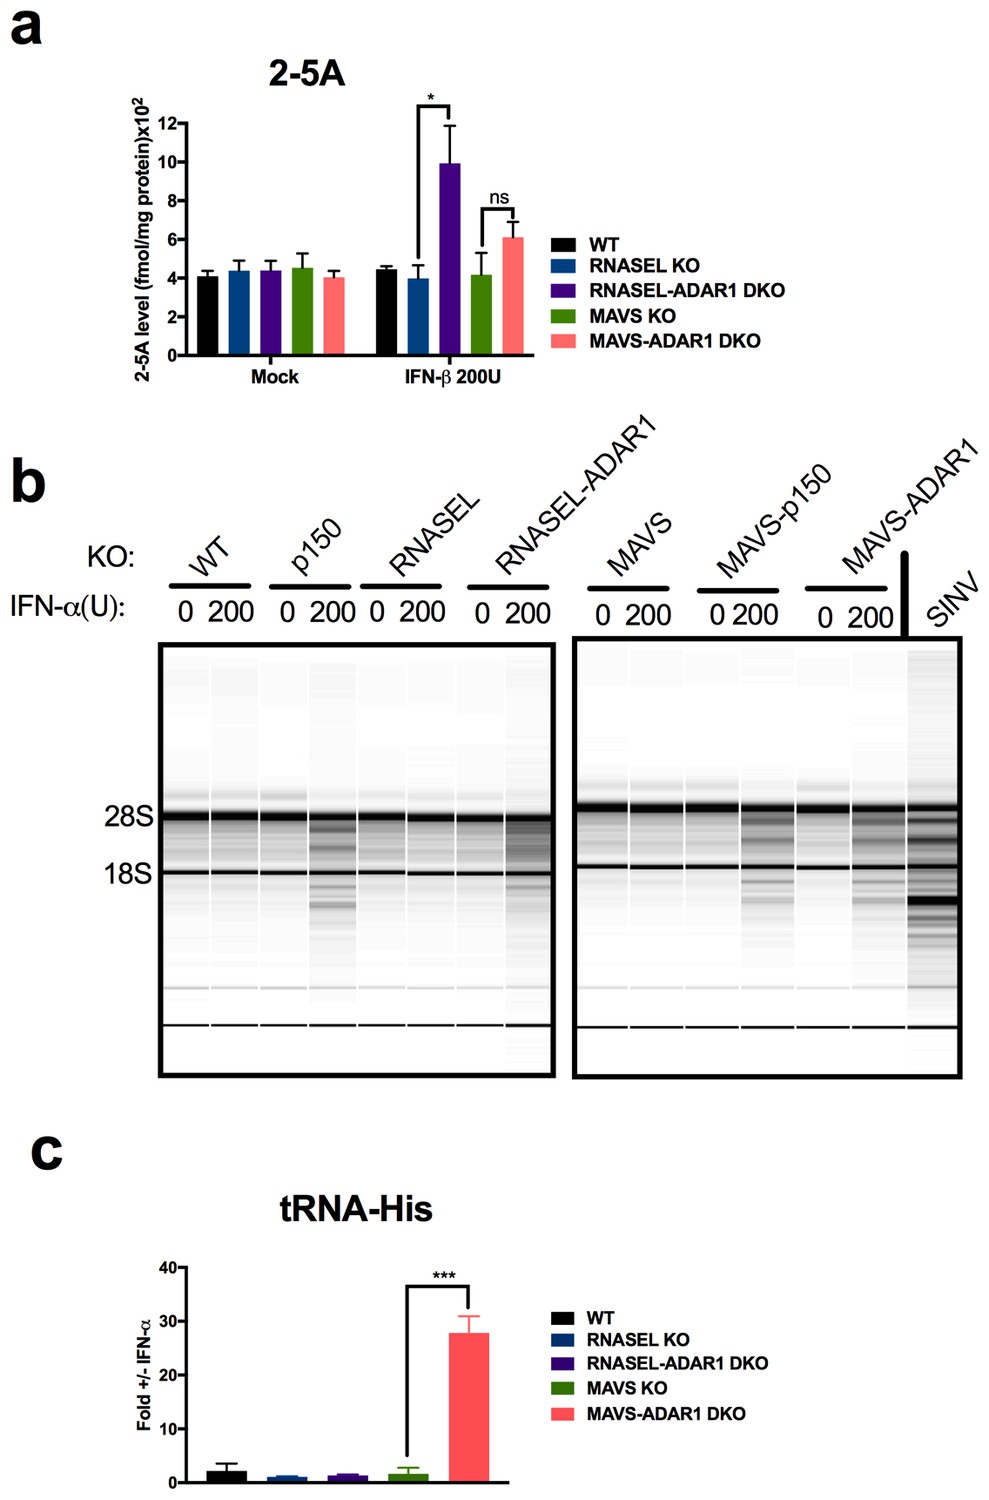
RNase L activation following IFN treatment of ADAR1 KO cells.
(a) Cells were mock treated or treated with 200 U/ml of IFN- and cells were lysed and 2-5A quantified using a FRET based assay. The data are the average of three independent biological replicates, expressed as means SD, **p=0.014; ns, p=0.1. (b) Cells were treated with 200 U/ml of IFN-α or infected with Sindbis virus (SINV) (Frolova et al., 2002) at MOI = 1, and at 48 hr post treatment or 24 hr post infection, cells were harvested, total RNA was extracted and resolved on RNA chips on a Bioanalyzer. The position of 28S and 18S rRNA and indicated. Data shown are from one representative experiment of two. (c) Cells were treated or mock treated with 10 U/ml of IFN-α and 24 hr post treatment and lysed. RNA was extracted and specific cleavages at tRNA-His-36 were quantified. The data are the average of three independent biological replicates, expressed mean SD; ***p=0.00019. See Figure 7—source data 1.
-
Figure 7—source data 1
Excel data for Figure 7.
- https://doi.org/10.7554/eLife.25687.023
Videos
Video 1
RNASEL KO cells from 0–72 hr post transduction with lenti-RNASE L (as in Figure 4c).
https://doi.org/10.7554/eLife.25687.013
Video 2
RNASEL KO cells from 0–72 hr post transduction with lenti-RNase LR667A (as in Figure 4c).
https://doi.org/10.7554/eLife.25687.014
Video 3
RNASEL-ADAR1 DKO cells from 0–72 hr post transduction with lenti-RNASE L (as in Figure 4c).
https://doi.org/10.7554/eLife.25687.015
Video 4
RNASEL-ADAR1 DKO cells from 0–72 hr post transduction with lenti-RNase LR667A (as in Figure 4c).
https://doi.org/10.7554/eLife.25687.016Tables
Table 1
Construction of the plasmids for knockout of human ADAR1, MAVS and PKR using CRISPR/Cas9.
| Genes | Primers | Nucleotide sequences (5’−3’)* | Targeting Region | |
|---|---|---|---|---|
| ADAR1 | sgADAR1-4 | Forward | CACCGTCTGTCAAATGCCATATGGG | Exon2 |
| Reverse | AAACCCCATATGGCATTTGACAGAC | |||
| sgADAR1-6 | Forward | CACCGACTCAGTTCCTGGAAATGTG | Exon2 | |
| Reverse | AAACCACATTTCCAGGAACTGAGTC | |||
| MAVS | sgMAVS-1 | Forward | CACCGGAGGGCTGCCAGGTCAGAGG | Exon4 |
| Reverse | AAACCCTCTGACCTGGCAGCCCTC | |||
| PKR | sgPKR-1 | Forward | CACCGTAATACATACCGTCAGAAGC | Exon1 |
| Reverse | AAACGCTTCTGACGGTATGTATTAC |
-
*Nucleotides sequences which were used for targeting gene are indicated as bold and italic.
Table 2
Primers for genotyping ADAR1, MAVS, and PKR knockout cells.
| Genes | Primers* | Nucleotide sequences (5’−3’) |
|---|---|---|
| ADAR1 | Forward-1 | ACCTTCCCTCCCAGGACTCCGGCC |
| Reverse-1 | CCTGAGTGGAGACCGCGATTTTCC | |
| Forward-2 | ATGGCCGAGATCAAGGAGAAAATC | |
| Reverse-2 | GTTCTGGTCTGGCCTCTTGCCTG | |
| MAVS | Forward | CTCCCCTGGCTCCTGTGCTCC |
| Reverse | AACTCCCTTTATTCCCACCTTG | |
| PKR | Forward | AGACTGAGATGAGTCCTATAAAG |
| Reverse | TCACCTATGAGTGAGAACATGC |
-
* Forward and Reverse-1 or -2 were used for sequencing of target region by sgADAR1-6 or sgADAR1-4 respectively.
Table 3
Knockout of ADAR1 or ADAR1p150 from WT, MAVS KO, RNASEL KO, PKR KO, NS2-WT or NS2H126R –WT cells.
| Genotype of parent cells | sgRNA | Resulting KO cells | ||
|---|---|---|---|---|
| Name | Number of clones screened | Number of KO clones obtained | ||
| WT | sgADAR1-6 | p150 KO | 24 | 12 |
| sgADAR1-4 | NA* | 17 | 0 | |
| MAVS KO | sgADAR1-6 | MAVS-p150 KO | 24 | 8 |
| sgADAR1-4 | MAVS-ADAR1 DKO | 23 | 8 | |
| RNASEL KO | sgADAR1-4 | RNASEL-ADAR1 DKO | 24 | 2 |
| PKR KO | sgADAR1-4 | NA | 24 | 0 |
| WT NS2 | sgADAR1-4 | NS2-ADAR1 KO | 56 | 4 |
| WT NS2H126R | sgADAR1-4 | NA | 54 | 0 |
-
*NA, Not available.
Table 4
qRT-PCR primers for human actin, IFN, OAS2 and IFIT1 genes.
| Genes | Forward (5’−3’) | Reverse (5’−3’) |
|---|---|---|
| ACTIN | ACTGGAACGGTGAAGGTGAC | GTGGACTTGGGAGAGGACTG |
| IFN-β | GTCAGAGTGGAAATCCTAAG | ACAGCATCTGCTGGTTGAAG |
| IFN-λ | CGCCTTGGAAGAGTCACTCA | GAAGCCTCAGGTCCCAATTC |
| OAS2 | TTCTGCCTGCACCACTCTTCAACGA | GCCAGTCTTCAGAGCTGTGCCTTTG |
| IFIT1 | TGGTGACCTGGGGCAACTTT | AGGCCTTGGCCCGTTCATAA |
Download links
A two-part list of links to download the article, or parts of the article, in various formats.
Downloads (link to download the article as PDF)
Open citations (links to open the citations from this article in various online reference manager services)
Cite this article (links to download the citations from this article in formats compatible with various reference manager tools)
Ribonuclease L mediates the cell-lethal phenotype of double-stranded RNA editing enzyme ADAR1 deficiency in a human cell line
eLife 6:e25687.
https://doi.org/10.7554/eLife.25687


