Structure of a AAA+ unfoldase in the process of unfolding substrate
- The Hospital for Sick Children Research Institute, Canada
- University of Toronto, Canada
Figures
Figure 1 with 1 supplement
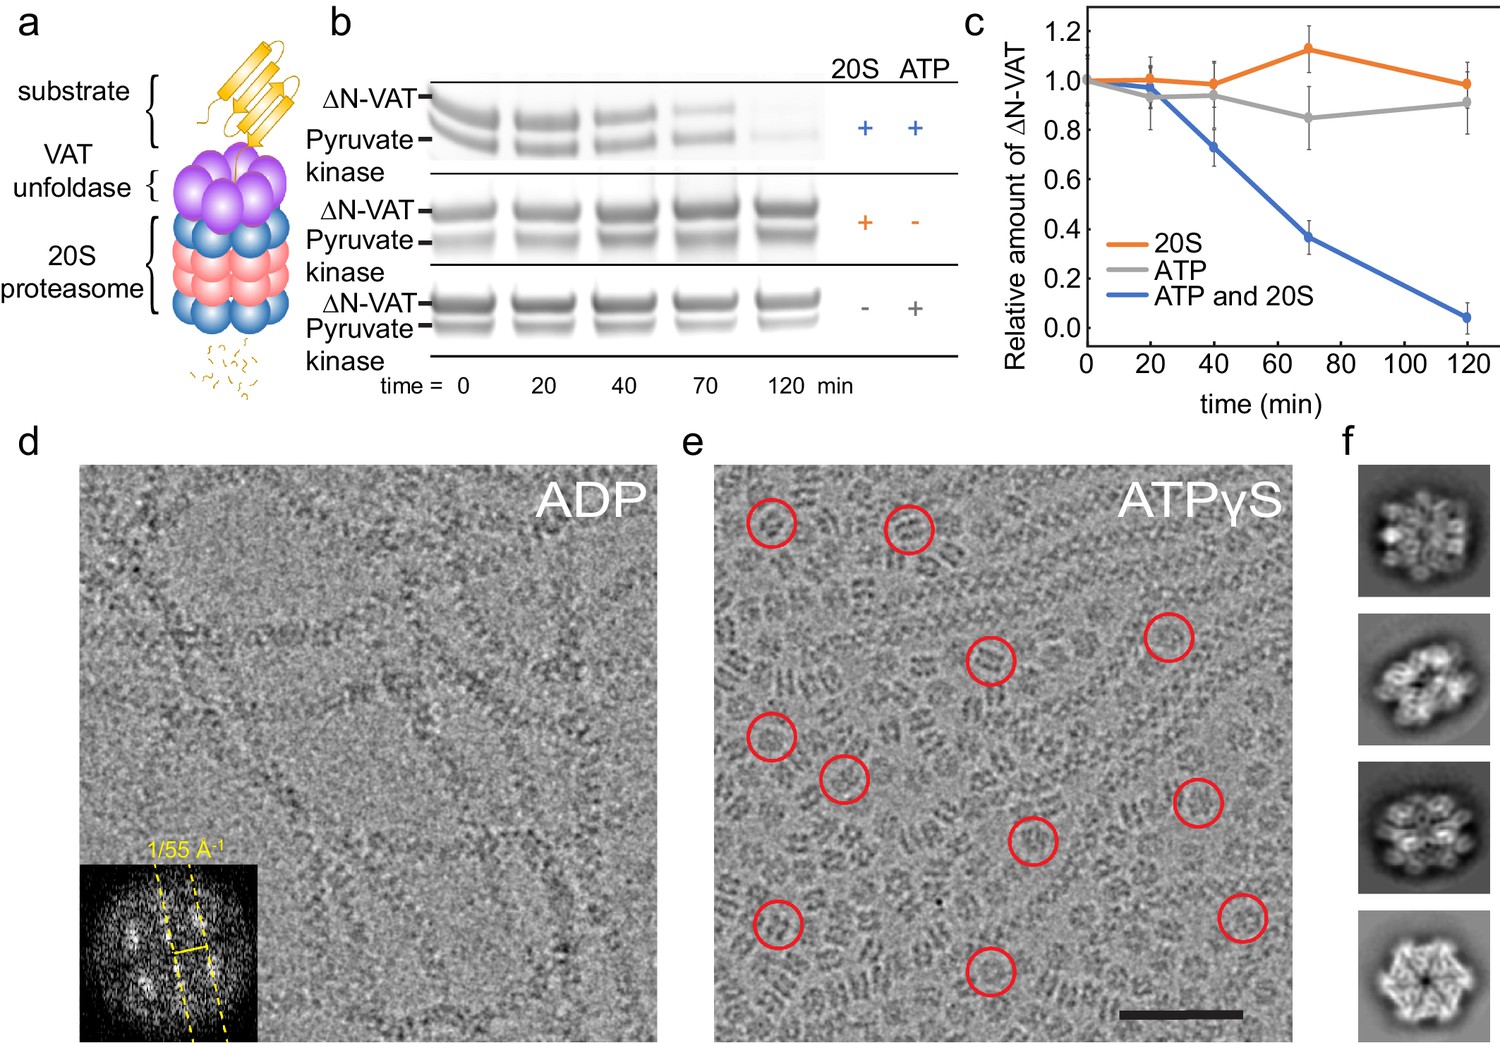
ΔN-VAT unfolds other copies of ΔN-VAT.
(a) Cartoon showing VAT (purple ring) working in concert with the 20S proteasome (blue and pink rings) to degrade protein substrates (yellow). (b) An SDS-PAGE gel showing that both ΔN-VAT and pyruvate kinase (part of the ATP regenerating system) are degraded in an ATP and 20S proteasome dependent manner. (c) Quantification of the self-unfolding reaction. All measurements done in triplicate.(d) Representative section of a micrograph of ΔN-VAT in the presence of 5 mM ADP, corresponding to ~25% of the full field-of-view. Inset shows the power spectrum from a fibril, with a characteristic layer line at ~1/55 Å−1. (e) Representative section of a micrograph of ΔN-VAT in the presence of 5 mM ATPγS. Example single particles are circled in red. Scale bar, 500 Å. (f) 2D class average images showing views of single particles of ΔN-VAT in the presence of ATPγS.
Figure 1—figure supplement 1
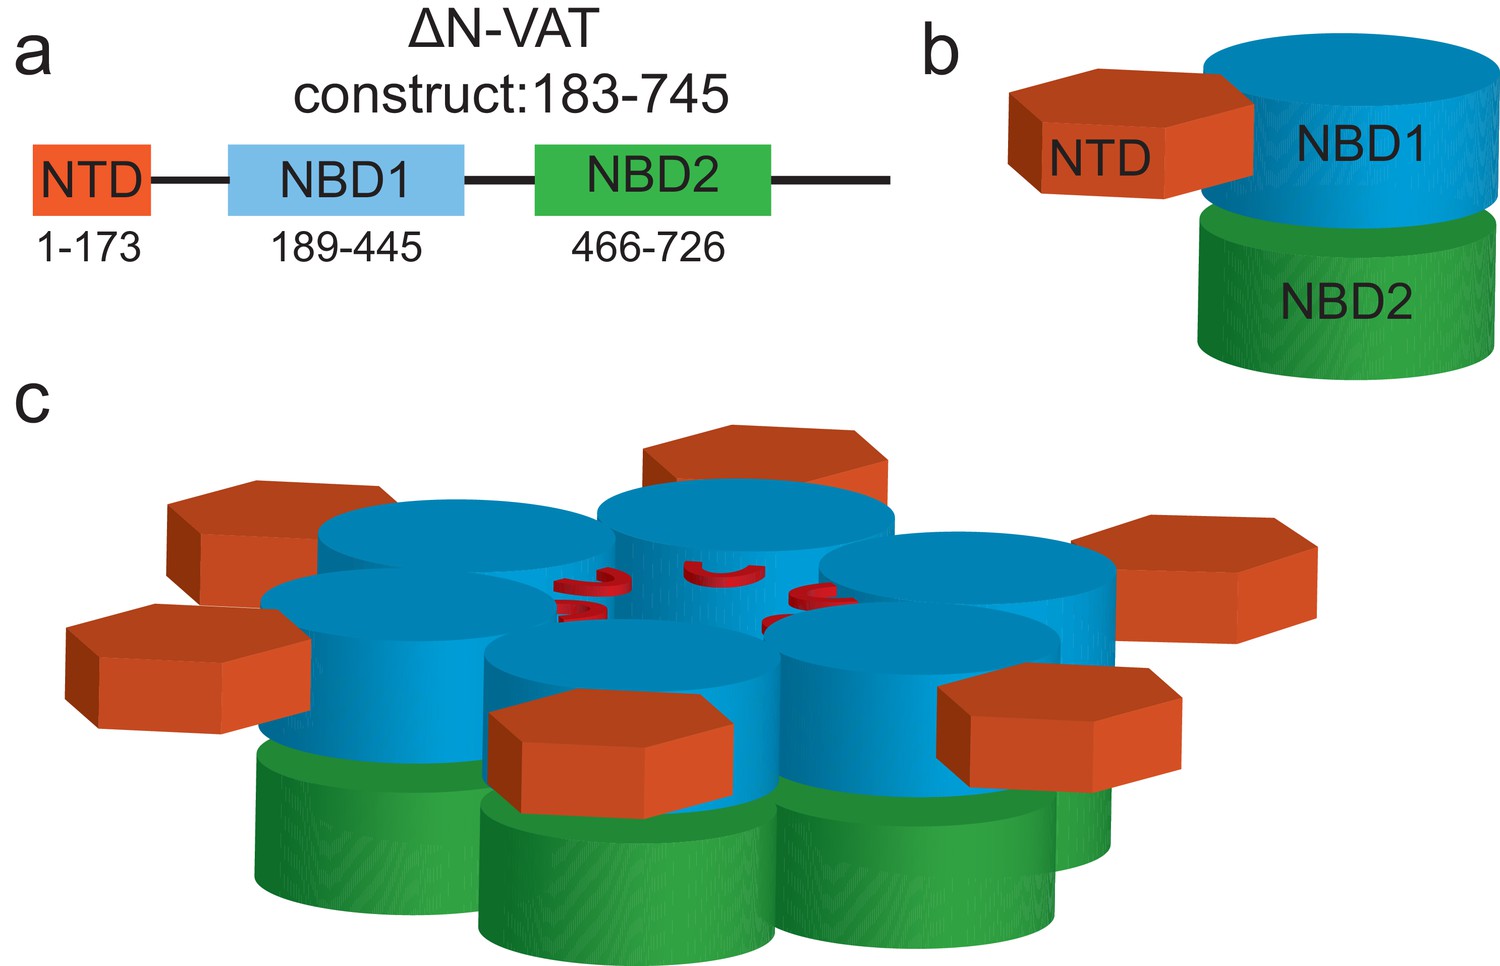
Domain arrangement and oligomeric structure of VAT.
Cartoon representation of the VAT primary structure (a) protomer structure (b) and hexamer structure (c). In (c) the stacked ring structure is shown with the AAA+ nucleotide binding domains colored in blue and green for NBD1 and NBD2, respectively, with the N-terminal domain (NTD: orange) co-planar with the NBD1 rings.
Figure 2 with 2 supplements
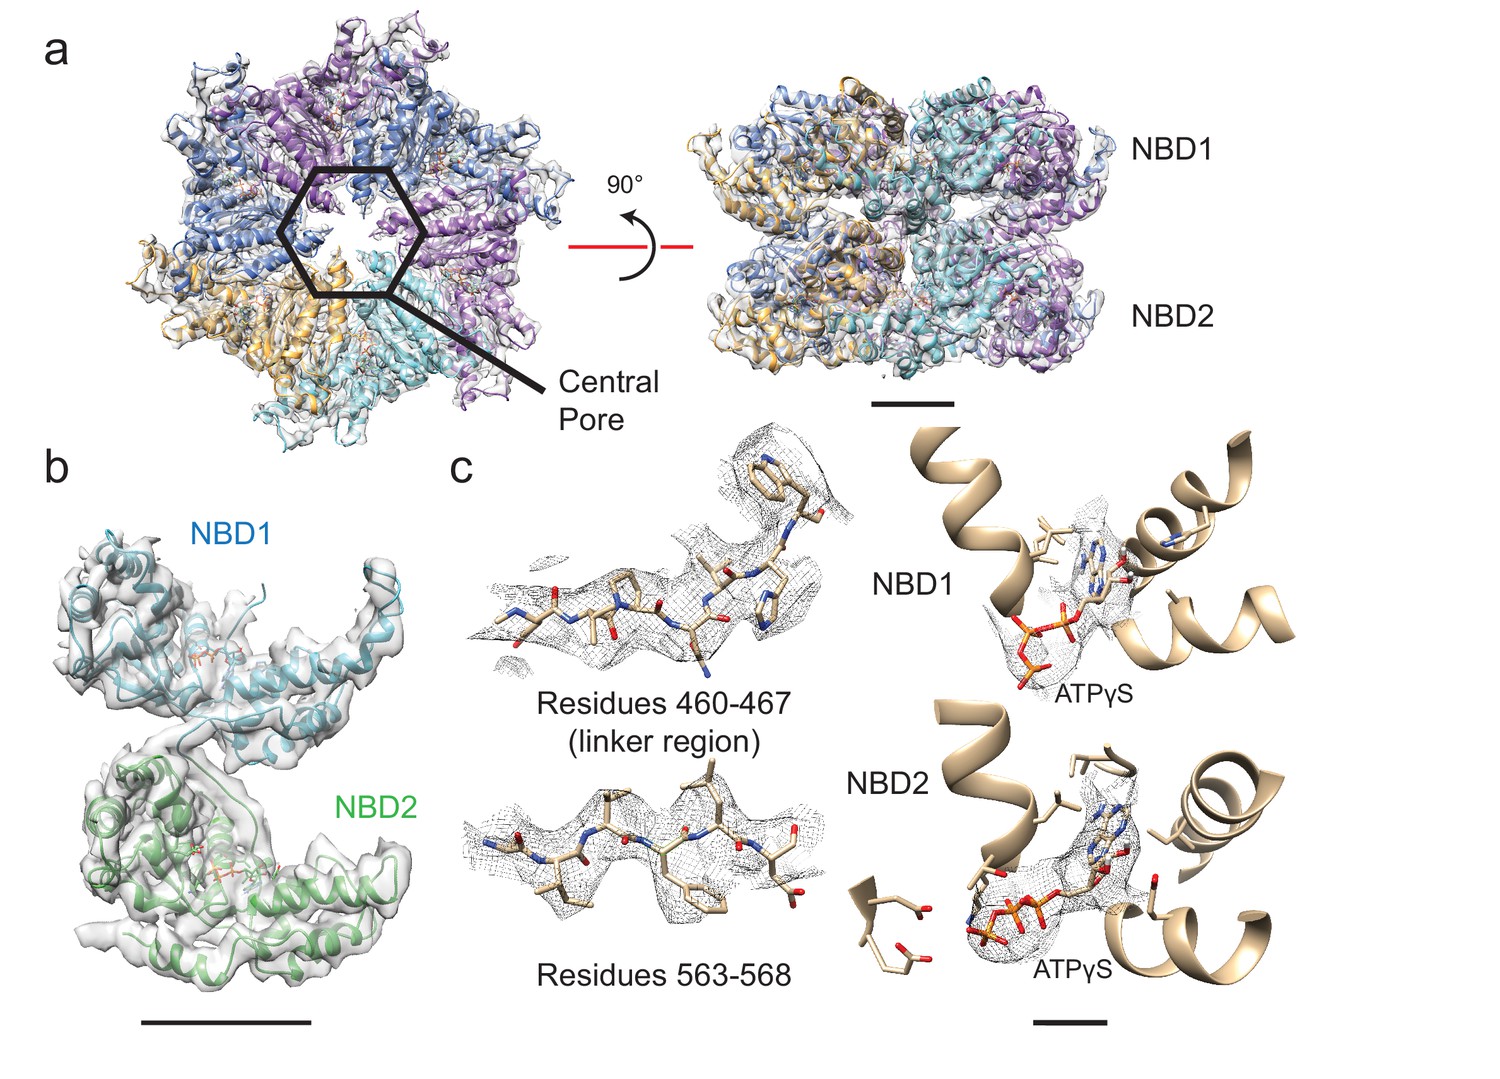
Structure of six-fold symmetric ΔN-VAT with bound ATPγS.
(a) Density map and atomic model for ATPγS-bound ΔN-VAT at 3.9 Å resolution. A central pore runs through the middle of the complex. Scale bar, 25 Å. (b) Density map and model for a single protomer of VAT shows both AAA+ domains and the linker between them. Scale bar, 25 Å. (c) The cryo-EM density allowed identification of large amino acid side chains throughout ΔN-VAT, including in the linker region. Density corresponding to ATPγS is visible in all twelve catalytic sites. Scale bar, 5 Å.
Figure 2—figure supplement 1
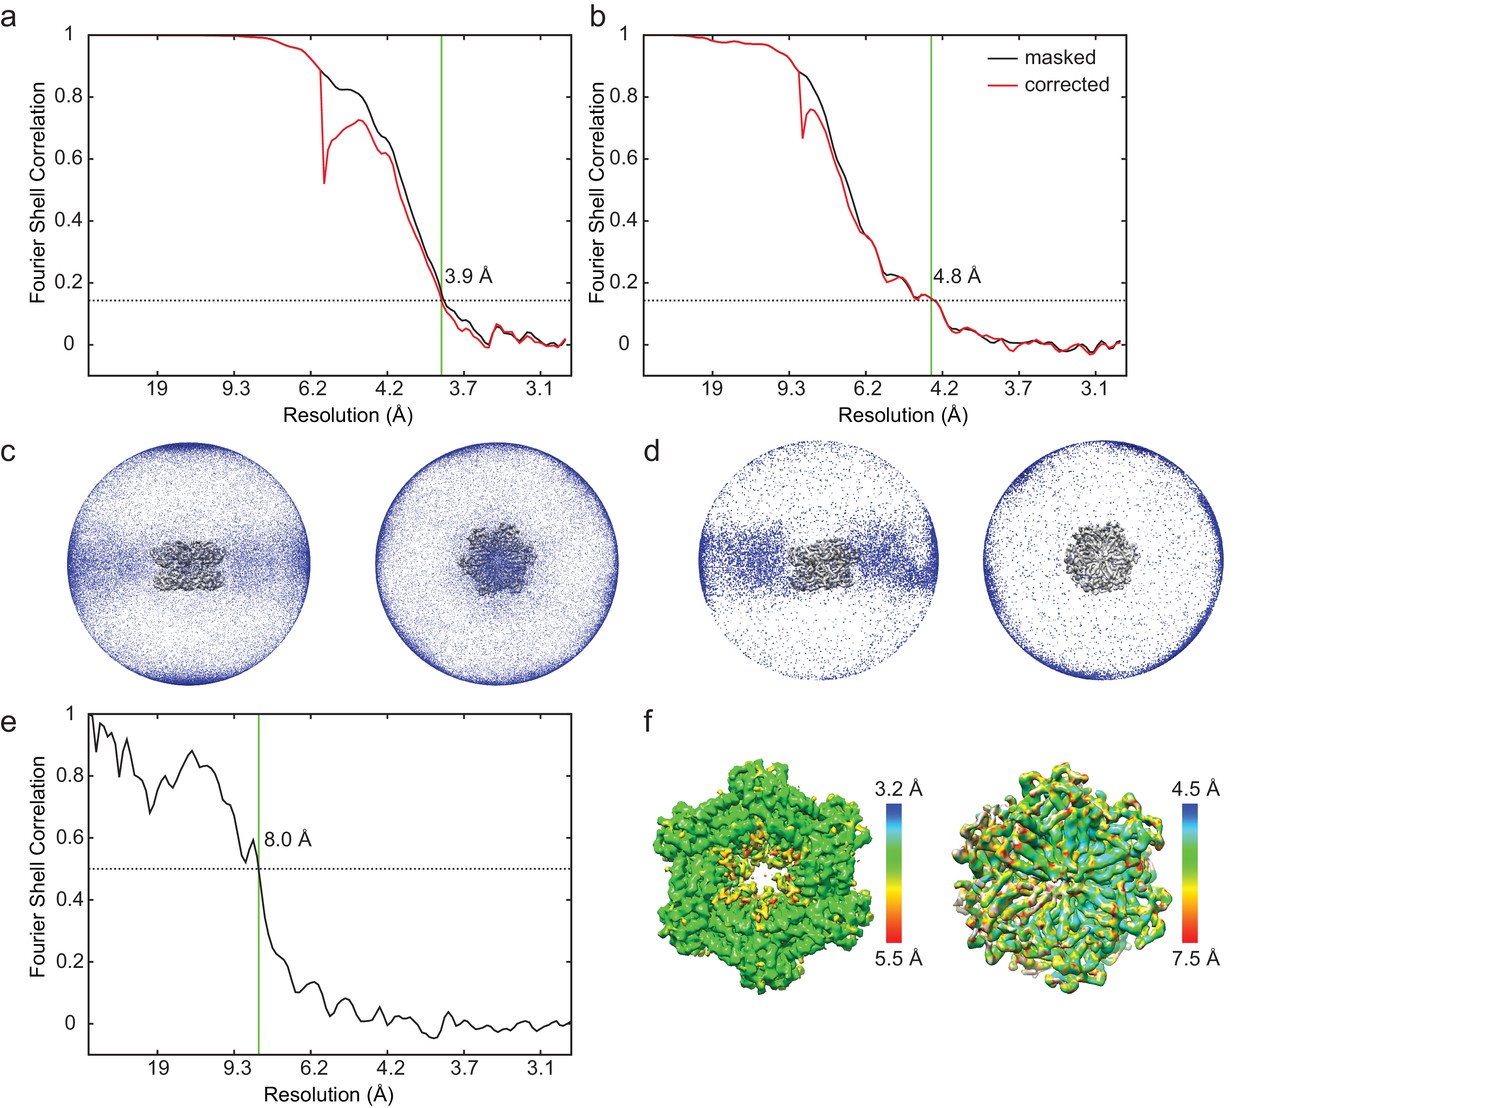
Cryo-EM map calculation and validation.
(a) Fourier shell correlation (FSC) curve for the stacked-ring conformation of ΔN-VAT after a gold-standard refinement (resolutions reported at FSC = 0.143). FSC curves were calculated after masking solvent from the background of the map (black curve) and corrected for the effects of masking (red curve) as described in the methods section. (b) FSC curve for the substrate-engaged conformation of ΔN-VAT after a gold-standard refinement (resolutions reported at FSC = 0.143). (c) Image orientation distribution for the stacked-ring conformation. (d) Image orientation distribution for the substrate-engaged conformation. (e) FSC between stacked-ring conformation reported here (3.9 Å resoluion) and stacked-ring conformation for full-length VAT (EMD-3435, 7.8 Å resolution). A loose mask generated from ΔN-VAT density was used to mask the maps. The maps are similar up to 8 Å resolution, indicating that at least to this resolution the conformations of ΔN-VAT and full-length VAT are the same. (f) Local resolution estimation with ResMap (Kucukelbir et al., 2014) for the stacked-ring (left) and substrate-bound conformations (right).
Figure 2—figure supplement 2

Pore loops of VAT.
Compared to the stacked-ring conformation (left) and the split-ring conformation determined previously (Huang et al., 2016) (right), the channel through the lumen of the substrate-engaged state of VAT (middle) formed by pore loop residues in both NBD1 (a) and NBD2 (b) is much more constrained. The pore loops of the seam protomer do not participate in forming the channel (gold). Scale bar, 25 Å.
Figure 3 with 2 supplements
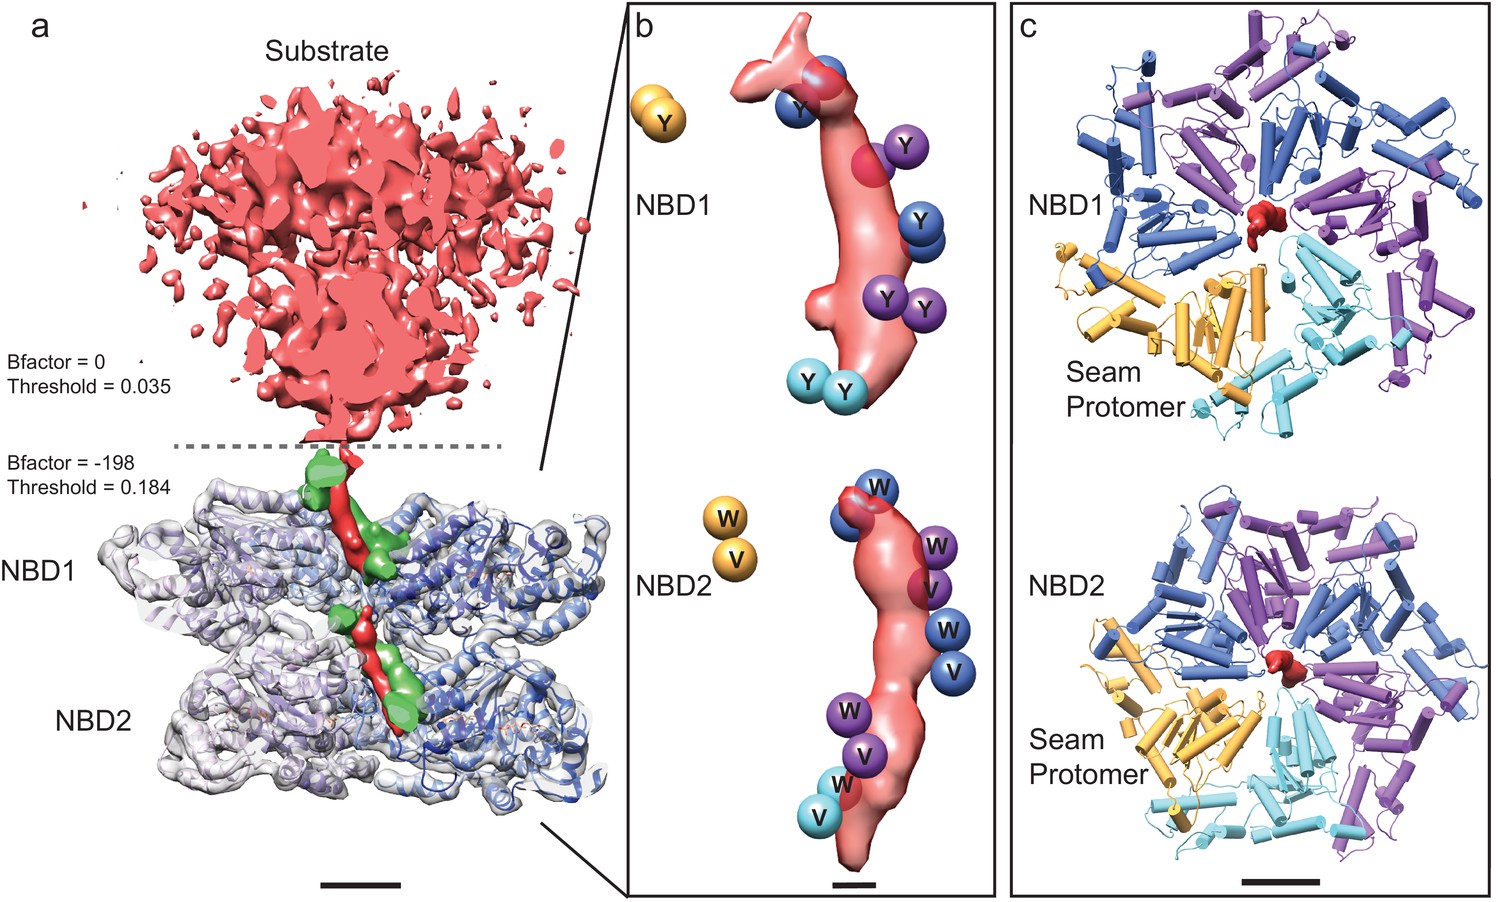
Substrate engagement by ΔN-VAT.
(a) Cut-away side view of the density map and model for ΔN-VAT with substrate bound. The substrate complex is shown unsharpened in red above the dashed line. Density for the substrate-gripping loop residues is shown in green, with the enzyme-bound portion of the substrate shown as density (red) running through the center of the complex. Scale bar, 25 Å. (b) Positions of the Cα atoms of the pore loop residues (spheres) surrounding the experimental density for substrate (red). Five of the six protomers contact the substrate. Scale bar, 5 Å. (c) NBD1 and NBD2 rings with experimental density for substrate. Both NBD rings adopt similar conformations and a helical architecture, with five of the pore loops contacting the substrate. Scale bar, 25 Å.
Figure 3—figure supplement 1

Ab initio classification to separate the six-fold symmetric and substrate-engaged states of VAT.
(a) 3D maps from the two classes throughout the ab initio classification scheme. At iteration ~500, the low-resolution shape of the substrate is apparent in the substrate-bound class (red arrows) but as the algorithm progresses, the density of this region decreases due to image alignment to the active VAT complex. The final distribution of single particle images was ~15% substrate-engaged and ~85% stacked-ring. (b) A low-pass filtered map from a 3D class corresponding to the substrate-engaged state of VAT at iteration 900 of 1311 shows the partially-folded substrate clearly.
Figure 3—figure supplement 2
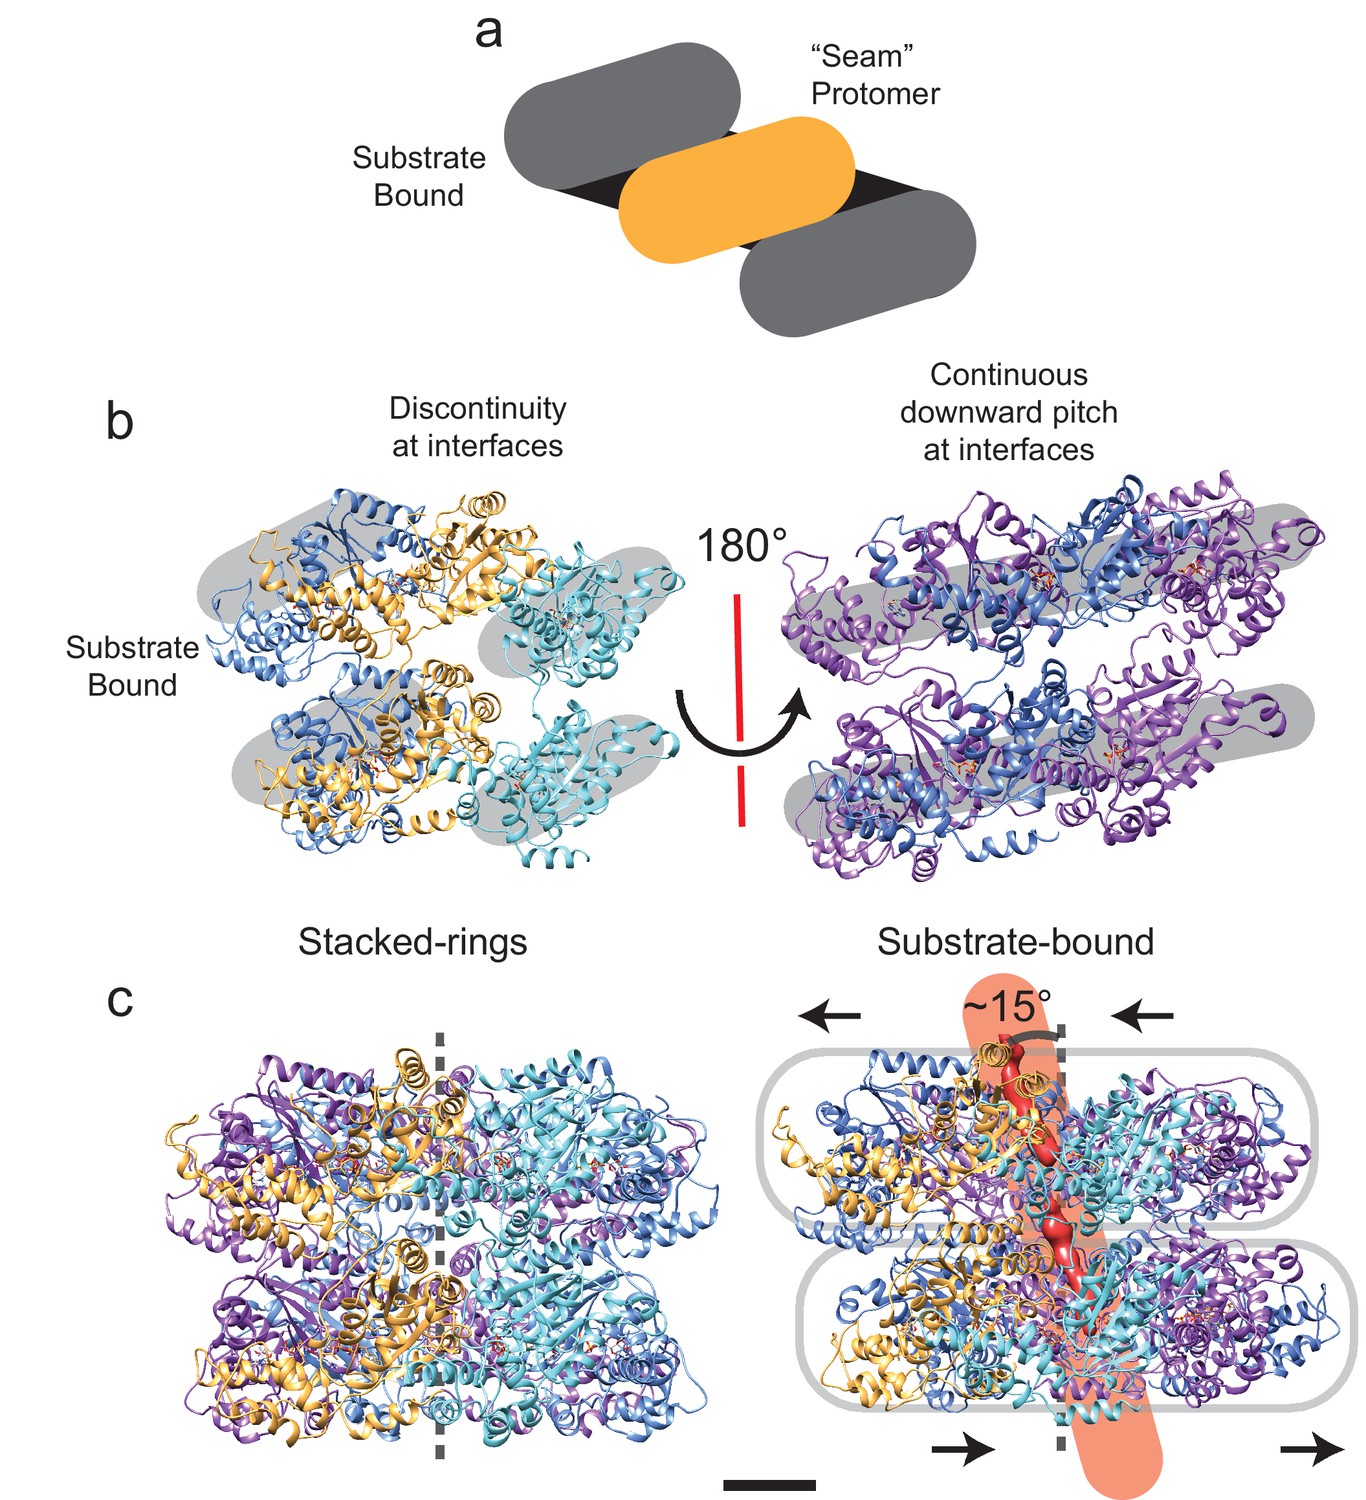
Symmetry breaking and seam formation in the AAA+ rings of substrate-engaged VAT.
(a) Cartoon showing the helical arrangement of AAA+ subunits bridged by a single subunit at the seam (gold). (b) Views of the different types of protomer-protomer interfaces at the seam (left) and opposite the seam (right). The broken helix structure creates discontinuities between the lowest protomer (cyan) and the seam protomer (gold), as well as the highest protomer (blue) and the seam protomer (gold). (c) Comparison of the central pore axis for stacked-ring (left) and substrate-engaged (right) states. Due to translation of the NBD1 and NBD2 rings relative to each other and tilting of the pore, the central pore axis passes through the complex at an angle of ~15°. Scale bars, 25 Å.
Figure 4
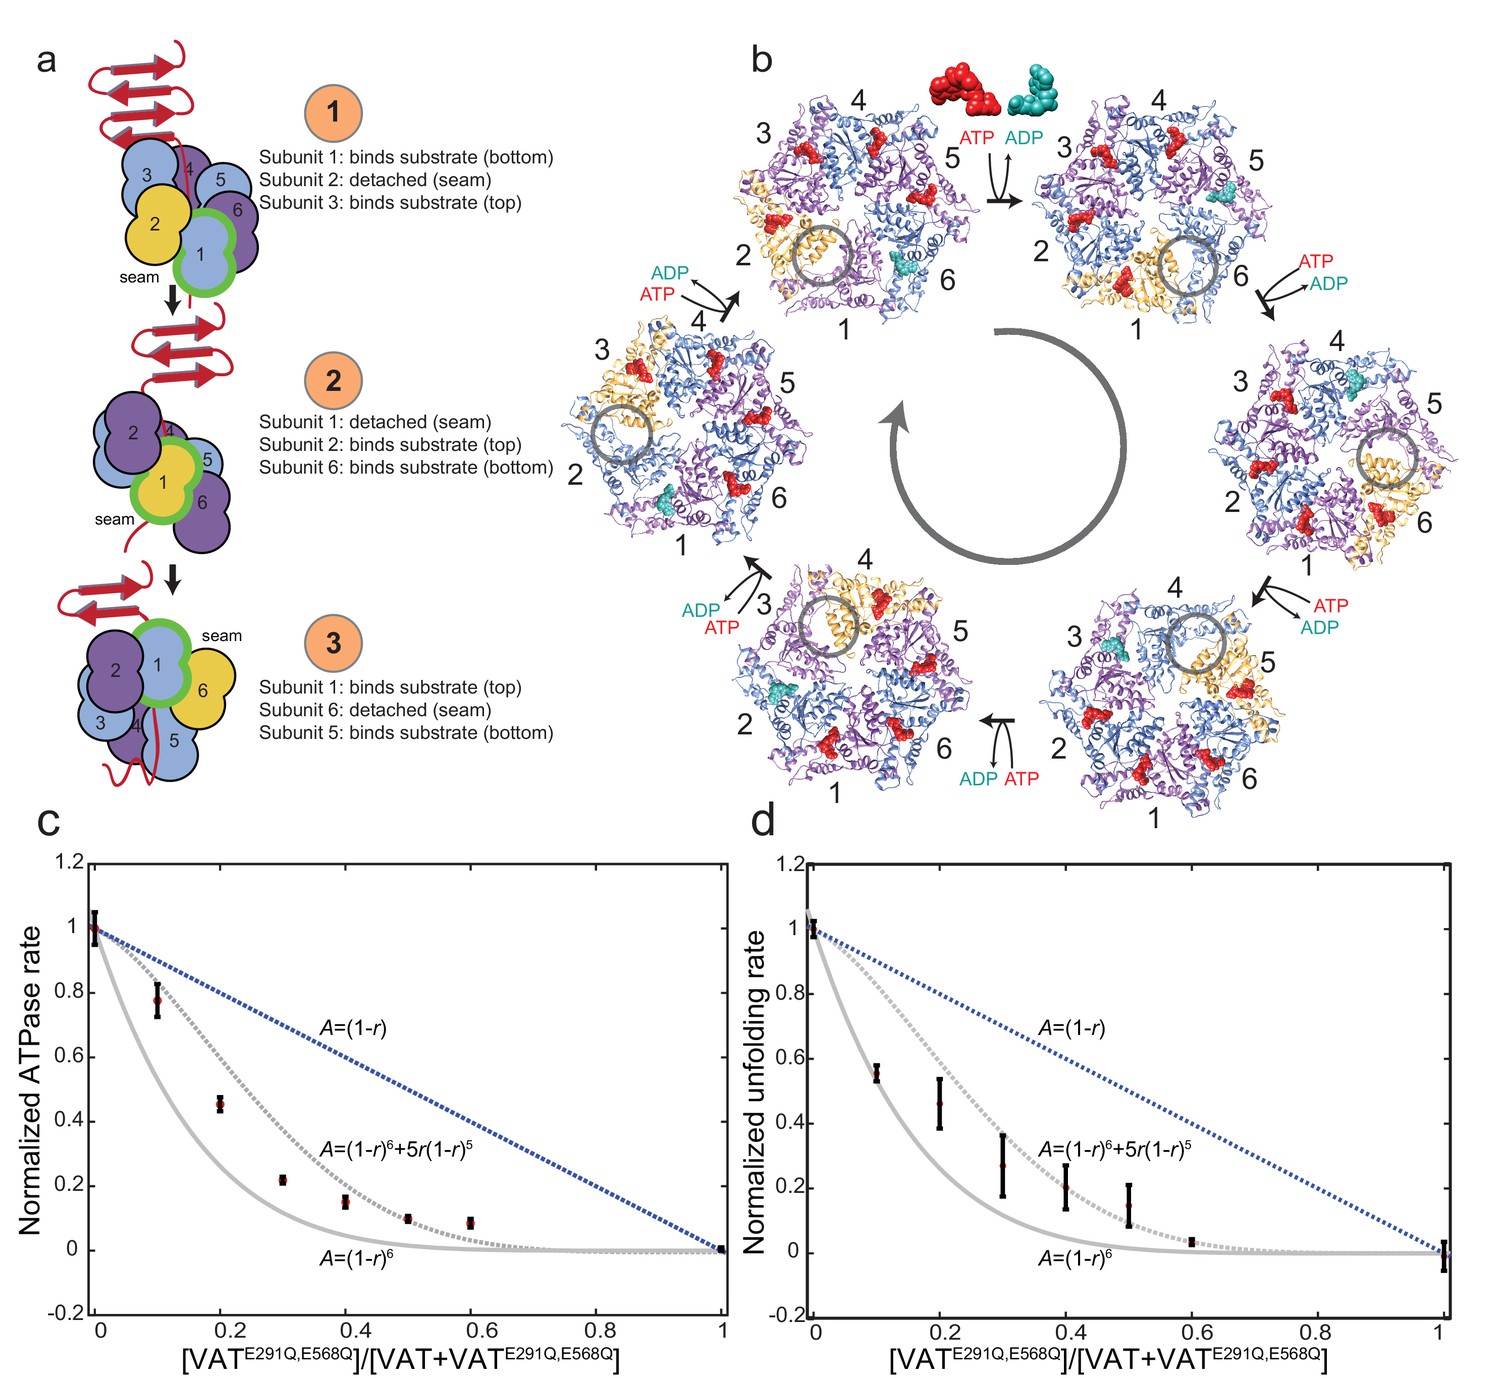
Model for substrate translocation by VAT.
(a) The substrate-bound structure of ΔN-VAT suggests that the enzyme is processive, with a single subunit (green outline) that binds substrate at the lowest position (step 1) releasing as it becomes the seam subunit (yellow) (step 2) before re-engaging further along the substrate (step 3). Subunits are numbered 1–6. (b) The different conformations of VAT cycle around the hexamer, with ATP binding and ADP release with each transition. The seam subunit is indicated in yellow, with the adjacent subunits in the clockwise and counter-clockwise positions (viewed from NBD1 to NBD2) corresponding to protomers that are closest to and furthest from the folded substrate, respectively. (c) The ATPase activity A of VAT with different ratios r of catalytically inactivated VATE291Q,E568Q mutant incorporated randomly into the enzyme hexamers. The activity decreases with increasing r faster than the A=(1-r)6+5r(1-r)5 curve expected if two inactive mutants per complex were required to stop VAT activity, instead approximating the A=(1-r)6 curve that is consistent with the proposed ‘hand-over-hand’ mechanism. Error bars, ±1 standard deviation. (d) The unfolding activity A of VAT with GFPssra substrate, monitored by the decrease in fluorescence in the presence of ATP and a GroEL trap, with different ratios r of catalytically inactivated VATE291Q,E568Q mutant incorporated randomly into the enzyme hexamers. The activity decreases as in part c. Error bars, ±1 standard deviation.
Author response image 1
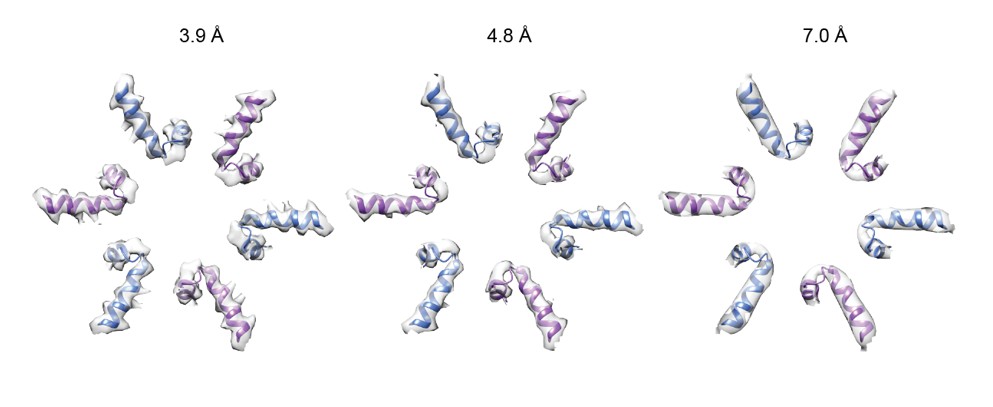
Six-fold symmetric △N-VAT map filtered to 3.9, 4.8, and 7.0 Å resolution:
https://doi.org/10.7554/eLife.25754.016Videos
Video 1
Conformational changes in VAT upon substrate binding.
Interpolation between the stacked-ring and substrate-bound states of VAT, shown as ribbon diagrams (left) and Cα positions for the pore loop residues (right). The complex is viewed ~15° from the symmetry axis so that in the substrate-bound state the complex is viewed along the substrate path. Substrate is shown in red. Scale bars 25 Å. Please view video as loop.
Video 2
Conformational changes in VAT protomers upon substrate binding.
Interpolation between the stacked-ring and substrate-bound states of VAT, shown as a ribbon diagram for two VAT protomers. Substrate is shown in red. Pore loop residues are indicated in green. Scale bar, 25 Å. Please view video as loop.
Video 3
The hand-over-hand model for substrate translocation.
Interpolation between states where each subunit sequentially goes through the different possible positions in the helix. Each promoter’s pore loop binds a section of substrate at the top of the helix and escorts that section toward the bottom of the image through five steps. On the sixth step the protomer releases the substrate and becomes the seam protomer, moving up and away from the central pore before reengaging at the top of the substrate. An arbitrary subunit is marked in green to help maintain orientation. The structures are shown as ribbon diagrams (left) and Cα positions for the pore loop residues (right). Scale bars, 25 Å. Please view video as loop.
Additional files
-
Supplementary file 1
Cryo-EM data acquisition, processing, and atomic model statistics.
- https://doi.org/10.7554/eLife.25754.015
Download links
A two-part list of links to download the article, or parts of the article, in various formats.
Downloads (link to download the article as PDF)
Open citations (links to open the citations from this article in various online reference manager services)
Cite this article (links to download the citations from this article in formats compatible with various reference manager tools)
Structure of a AAA+ unfoldase in the process of unfolding substrate
eLife 6:e25754.
https://doi.org/10.7554/eLife.25754


