The genome and phenome of the green alga Chloroidium sp. UTEX 3007 reveal adaptive traits for desert acclimatization
- New York University Abu Dhabi, United Arab Emirates
- Max Planck Institute of Molecular Plant Physiology, Germany
- Birzeit University, Palestine
- New York University, United States
Figures
Figure 1
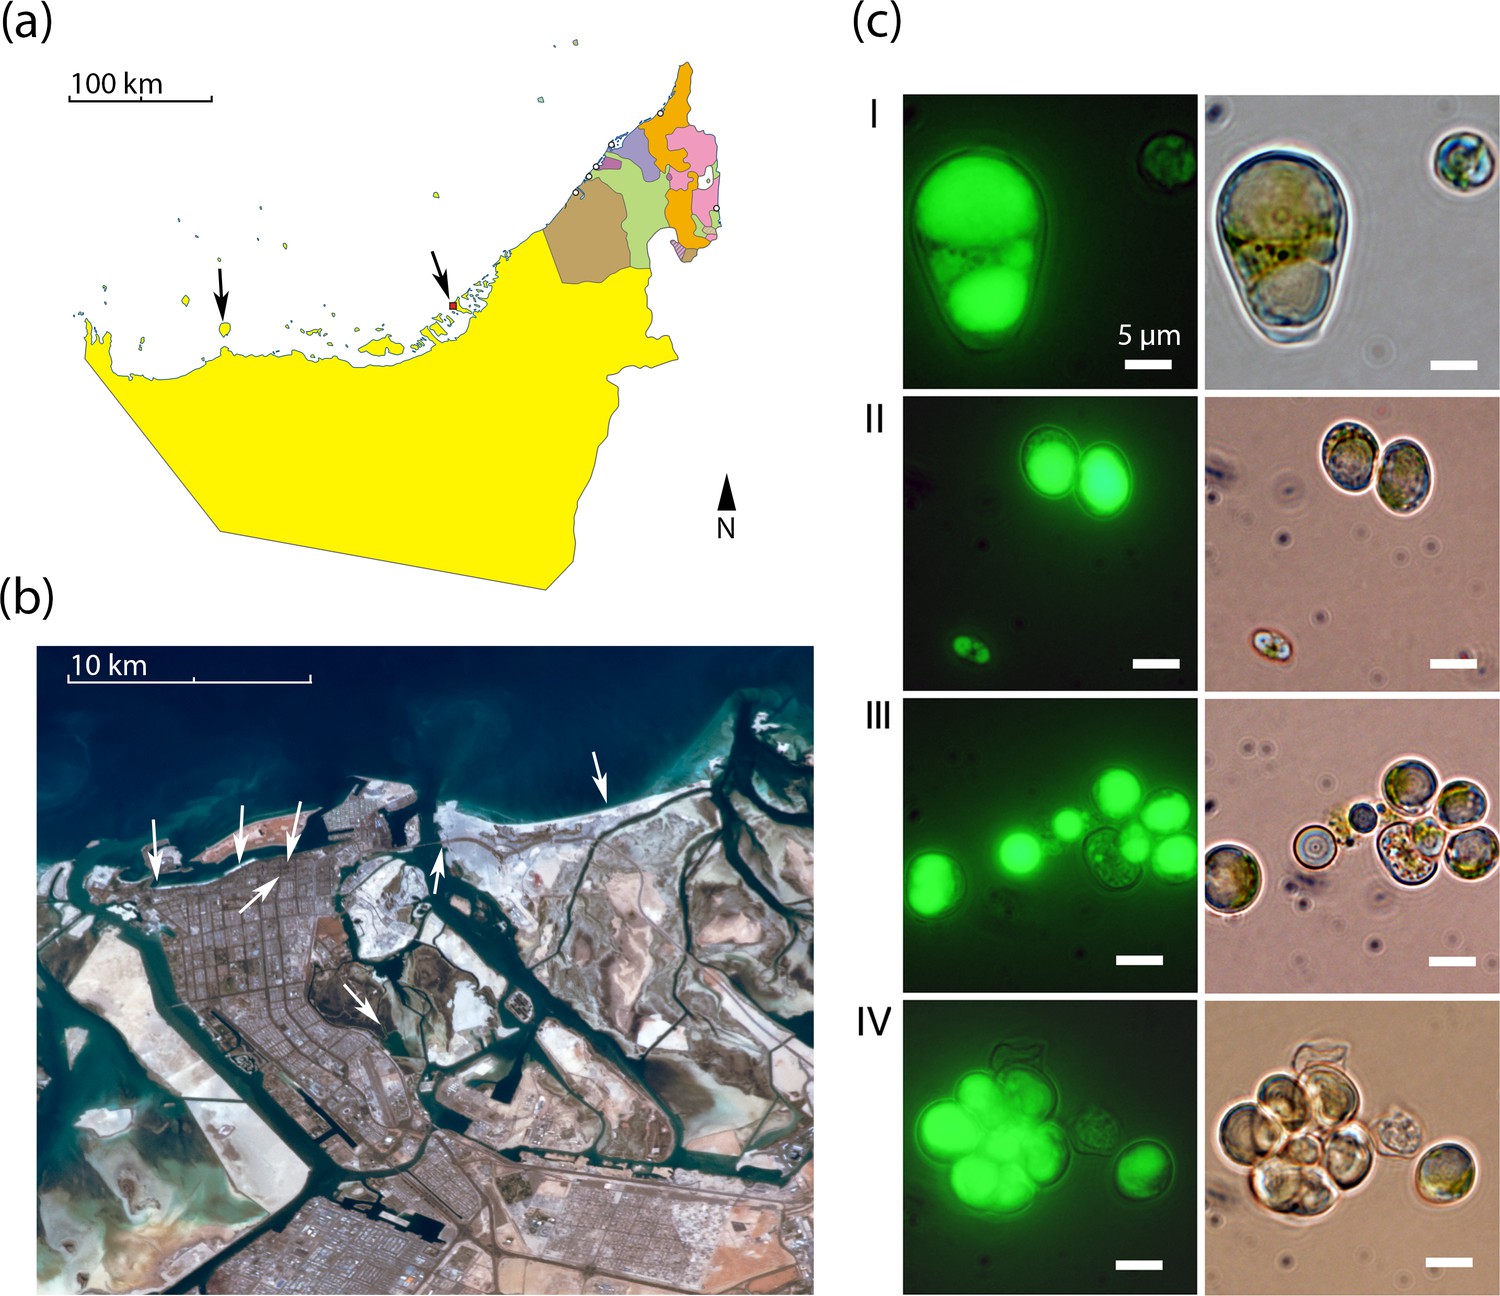
Geography and morphology of isolated Chloroidium strains.
Chloroidium strains were isolated from samples taken from the indicated locations in (a) the UAE, and (b) within Abu Dhabi city specifically. Chloroidium strains were found in estuaries, mangrove forests, adhered to buildings, in municipal waters, etc. (c) Chloroidium sp. UTEX 3007 stained for lipid bodies with BODIPY 505/515 and observed by fluorescence microscopy (left column) and phase-contrast microscopy (right column). (I) Chloroidium sp. UTEX 3007 aplanospore displaying palmello-like morphology contrasted with a smaller vegetative cell, (II) two average-sized Chloroidium sp. UTEX 3007 cells can be seen in the upper right of the panel while a miniature, recently hatched from an autospore, can be seen in the lower left, (III) Stained oil stores excreted from a Chloroidium sp. UTEX 3007 cell, and (IV) a hatched, non-segregating autospore.
Figure 2 with 2 supplements
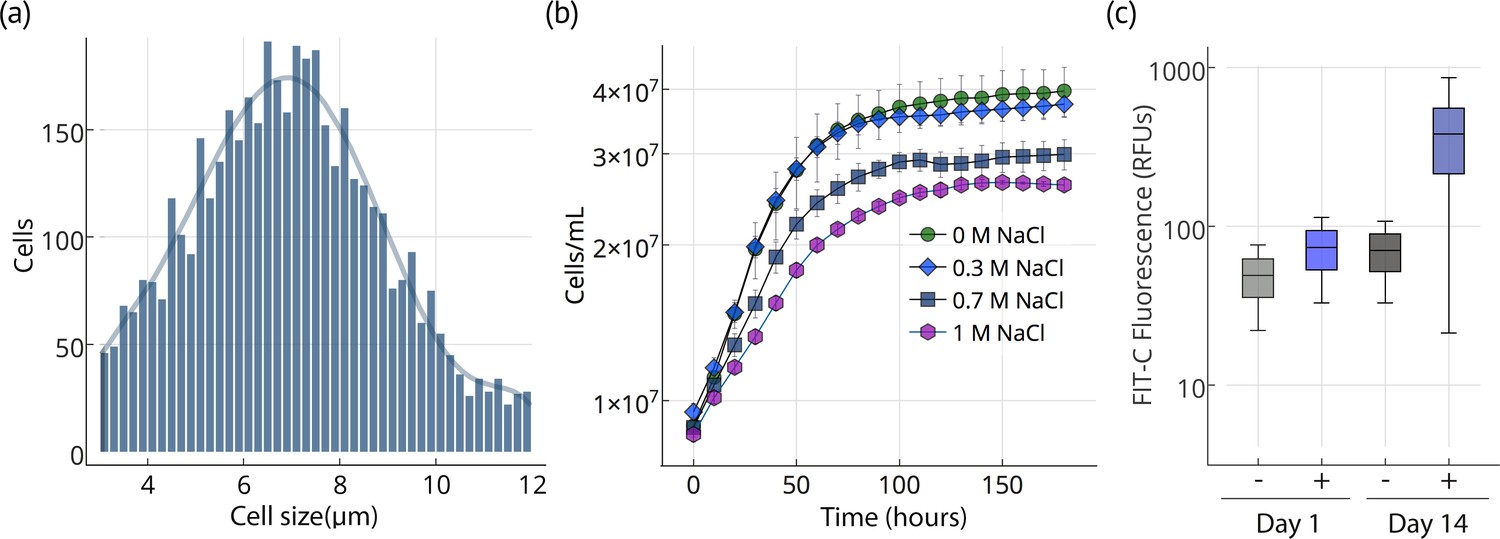
Cell size, growth, and lipid accumulation in Chloroidium sp. UTEX 3007.
(a) Cell size distribution of Chloroidium sp. UTEX 3007 in late log phase (14 days). Cell size analysis was performed using a Cellometer Auto M10 from Nexcelcom Bioscience (Lawrence, MA, USA) on 2 × 20 ul from each liquid algal sample. As autospores typically generate six progeny, the distribution was fitted with the sixth order polynomial equation: (a + b*x + c*x2 + d*x3 + e*x4 + f*x5 + g*x6). (b) Growth of Chloroidium sp. UTEX 3007 cultures in tris-minimal media supplemented with 0, 0.3, 0.7. and 1M NaCl at 20°C and 400 umol photons m−m s−s of full-spectrum light). Cells were grown in a Multi-Cultivator MC 1000 by Photon Systems Instruments (Drasov, Czech Republic. See Figure 2—figure supplement 2 for chlorophyll/cell count curve and Figure 2—figure supplement 1 for a growth curve in the open pond simulators (OPSs). (c) Fluorescence intensity of cells (RFUs=relative fluorescence units) measured with a BD FACSAria III flow cytometer (BD Biosciences, San Jose, CA) at mid-log phase (time=day 1, one week after inoculation) and one week into stationary phase (time=day 14) with and without staining (indicated as (+) or (-), respectively, from the lipophilic dye BODIPY 505/515. Whiskers indicate range, box edges indicate standard deviation and the box centerline indicates the median fluorescence intensity reading.
-
Figure 2—source data 1
Cell diameter measurements.
- https://doi.org/10.7554/eLife.25783.005
-
Figure 2—source data 2
Cell concentration time course measurements.
- https://doi.org/10.7554/eLife.25783.006
-
Figure 2—source data 3
Flow cytometry measurements.
- https://doi.org/10.7554/eLife.25783.007
Figure 2—figure supplement 1
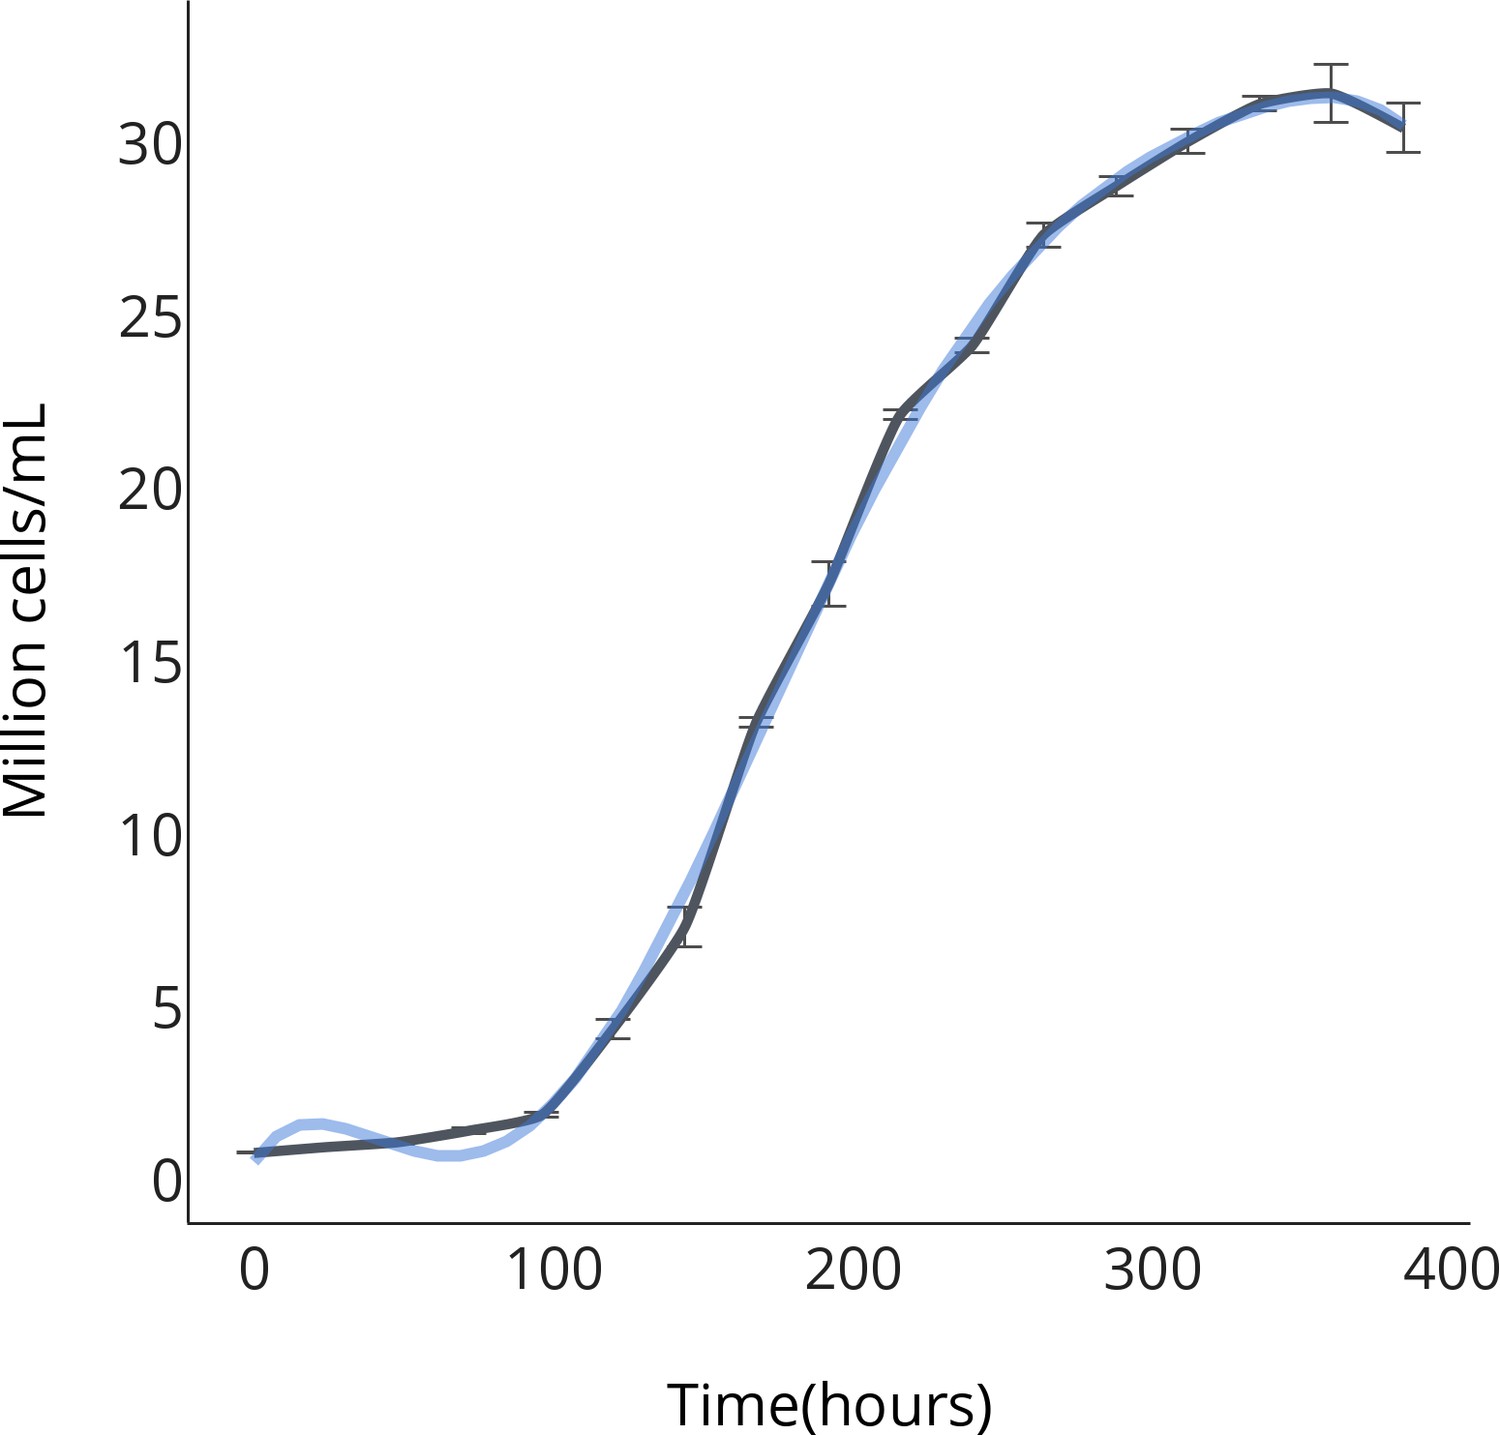
OPS growth curve.
https://doi.org/10.7554/eLife.25783.008
Figure 2—figure supplement 2
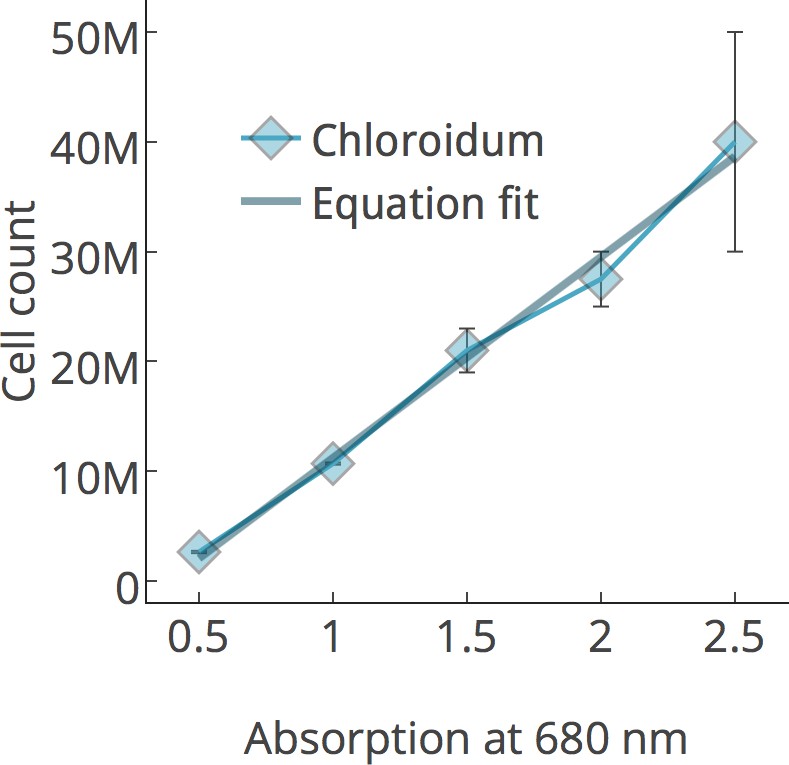
Chlorophyll/cell count curve.
https://doi.org/10.7554/eLife.25783.009
Figure 3
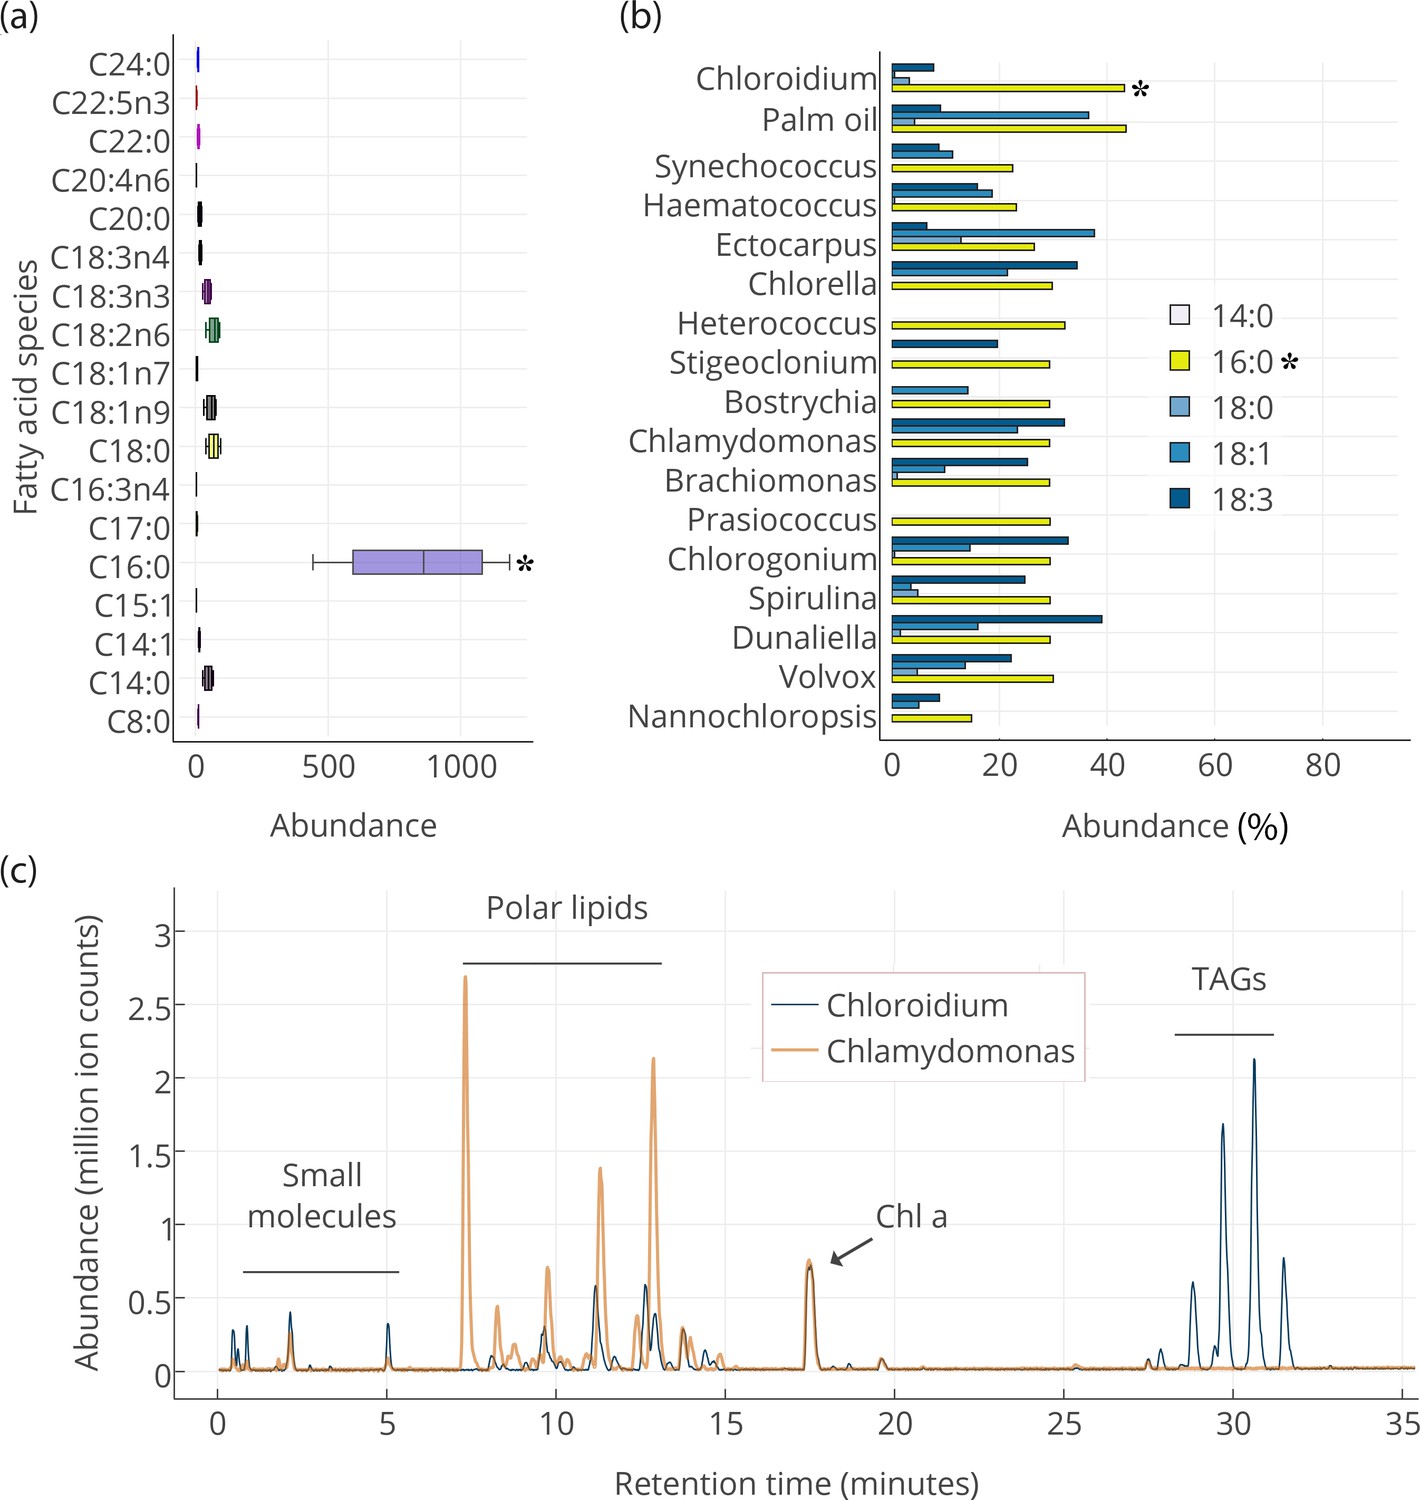
Lipid composition of Chloroidium sp. UTEX 3007 observed with HPLC/MS and GC-FID, and comparison with other photosynthetic, oleagenic species.
(a) Chloroidium sp. UTEX 3007 fatty acid content estimated by extracting total lipid, creating methyl esters, and running the esters on a GC-FID (whiskers = range, box boundaries = 1 SD, center box line = mean [8 replicates]). (b) Comparison of fatty acid profile of Chloroidium sp. UTEX 3007 with that of oil palm (Elaeis guineensis) (Barcelos et al., 2015) and several other algal isolates (Lang et al., 2011). Asterisks mark the presence of palmitic acid in Chloroidium sp. UTEX 3007. (c) Base peak chromatograms (BPCs) from stationary phase Chloroidium sp. UTEX 3007 and Chlamydomonas reinhardtii extracts run in positive mode on an Agilent LC-MS QToF 6538 (Agilent, Santa Clara, CA, USA) using an acetonitrile/ammonium formate/isopropanol gradient. Cultures were grown for three weeks in F/2 media with 0 g/L NaCl (freshwater media). Triacylglycerols (TAGs) can be seen in abundance in Chloroidium sp. UTEX 3007 while Chlamydomonas reinhardtii contained a higher ratio of polar lipids (Dataset 2).
-
Figure 3—source data 1
GC-FID results for major fatty acid species in Chloroidium sp. UTEX 3007.
- https://doi.org/10.7554/eLife.25783.011
-
Figure 3—source data 2
Fatty acid profiles of Chloroidium sp. UTEX 3007, Elaeis guineensis (Barcelos et al., 2015), and several other algal isolates (Lang et al., 2011).
- https://doi.org/10.7554/eLife.25783.012
-
Figure 3—source data 3
HPLC-MS base peak chromatograms (BPCs) for Chloroidium sp. UTEX 3007 and Chlamydomonas reinhardtii extracts.
- https://doi.org/10.7554/eLife.25783.013
Figure 4
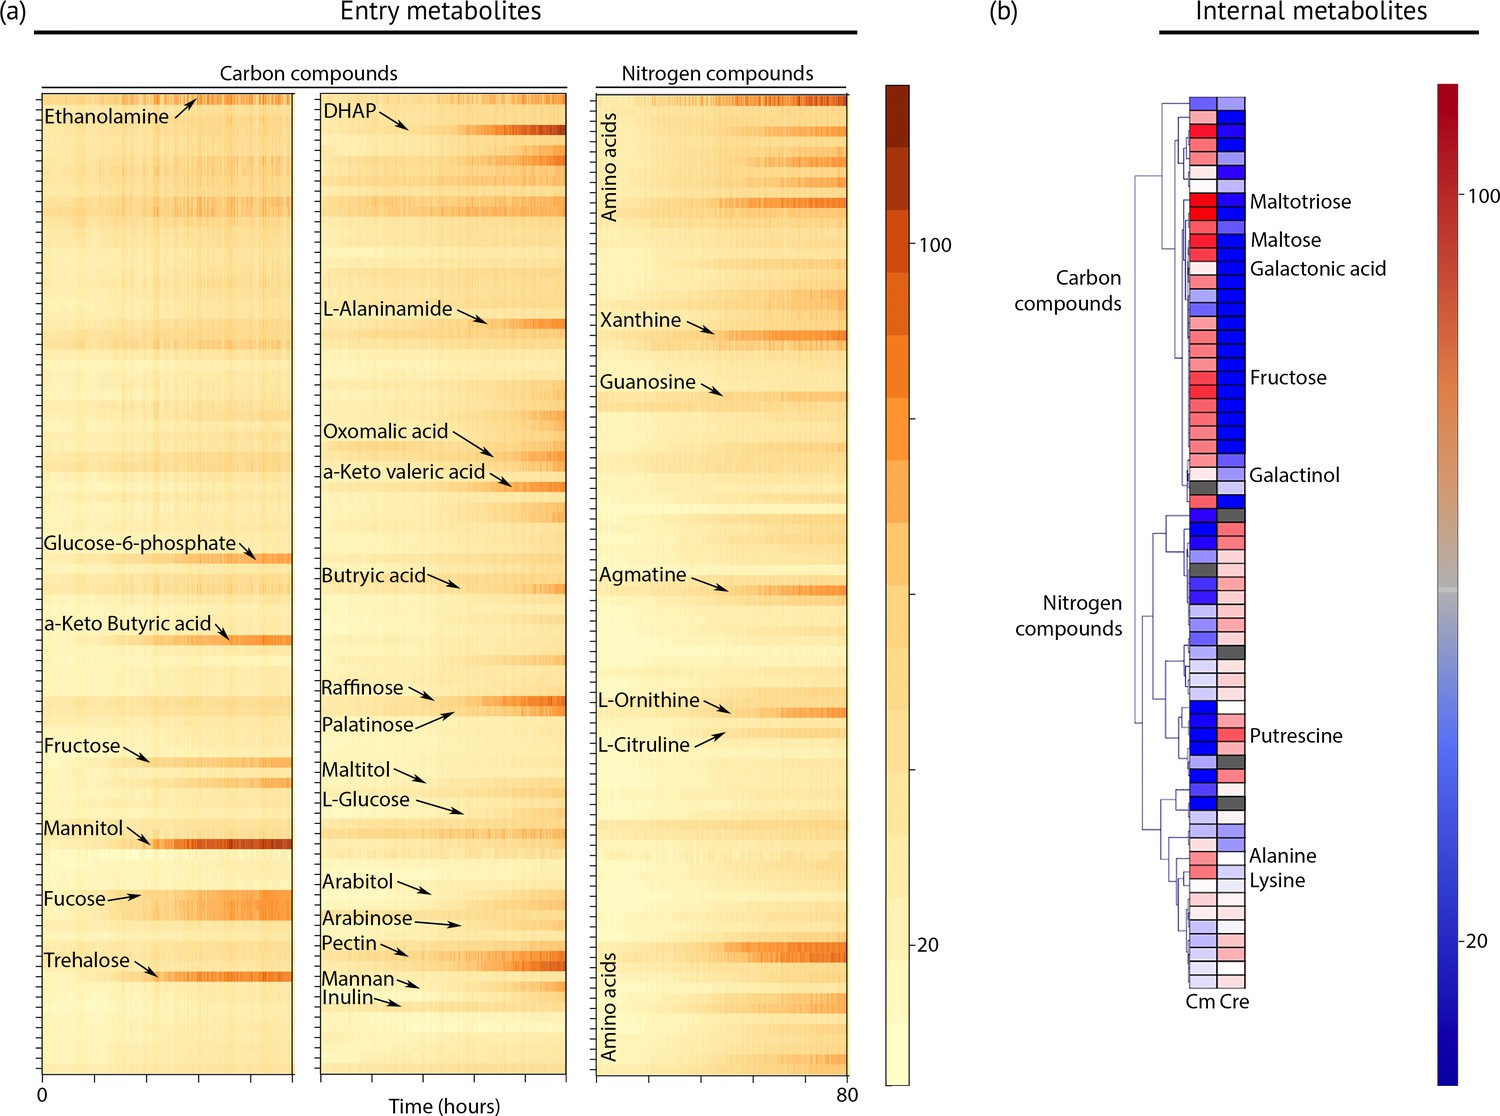
Metabolic profiling of Chloroidium sp. UTEX 3007.
(a) Biolog phenotype microarrays were run using an Omnilog instrument (Biolog Inc., Hayward, USA) as previously described (Chaiboonchoe et al., 2014). In total, 380 substrate utilization assays for carbon sources (PM01 and PM02 plates), 95 substrate utilization assays for nitrogen sources (PM03 plate), 59 nutrient utilization assays for phosphorus sources, and 35 nutrient utilization assays for sulfur sources (PM04 plate), along with peptide nitrogen sources (PM06-08 plates) were performed (Dataset 2). All microplates were incubated at 25°C for up to 8 days, and the dye color change (in the form of absorbance) was read with the Omnilog system every 15 min. As the Omnilog instrument does not provide a source of continuous light during incubation, the algae are assumed to be carrying out heterotrophic respiration. In addition, a marked increase in the chlorophyll a content and total cell count was confirmed for wells with suggested growth. Kinetic curves were plotted from the raw data in the form of heatmaps, and statistical analysis was carried out to visualize the metabolic properties and generate Omnilog values. Heatmap density correlates to Omnilog-registered color density. In addition to the dye color change, Omnilog also registers color change resulting from the accumulation of other pigments, including chlorophyll a. Thus, growth is displayed as cumulative color change density. (b) Extraction and analysis by gas chromatography coupled with mass spectrometry was performed as described in Lisec et al. (2006). The color scale corresponds to chromatogram peak areas reported in the GC-MS results in Dataset 2. Significant increase of diverse carbon compounds was observed in Chloroidium sp. UTEX 3007 (Cm) as compared to Chlamydomonas reinhardtii (Cre), and vice versa for nitrogen compounds. These differences may reflect acclimatization to their respective habitats and lifestyles.
-
Figure 4—source data 1
Phenotype microarray results for plates PM1, PM2, and PM3.
- https://doi.org/10.7554/eLife.25783.015
-
Figure 4—source data 2
GC-MS results for Chloroidium sp. UTEX 3007 (Cm) and Chlamydomonas reinhardtii (Cre) intracellular polar metabolites.
- https://doi.org/10.7554/eLife.25783.016
Figure 5
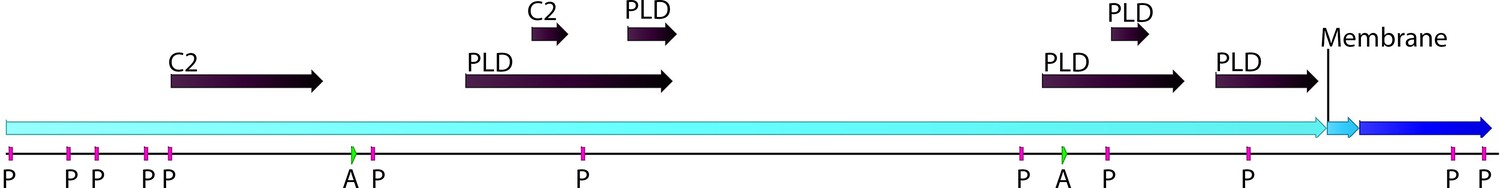
Phospholipase D (PLD; EC number: 3.1.1.4) domain-containing gene in Chloroidium sp. UTEX 3007.
Functional protein family domains in a Chloroidium sp. UTEX 3007 predicted protein with high similarity to PLD proteins from closely related organisms. PLDs are members of the phospholipase superfamily and produce phosphatidic acid as a main product. Phosphatidic acid is involved in signaling, membrane curvature, and is rapidly converted to diacylglycerol. The Chloroidium sp. UTEX 3007 PLD contains several domains with calcium-binding, amidation, and phosphorylation sites (annotated as C2 (2), A (2), or P(11) domains). C2 domains act to target proteins to cell membranes and allow phosphatases to de-phosphorylate membrane lipids without removing them from the membrane.
-
Figure 5—source data 1
Locations, confidence scores, and accession numbers for PLD and C2 Pfam domains in Chloroidium sp. UTEX 3007.
- https://doi.org/10.7554/eLife.25783.018
Figure 6
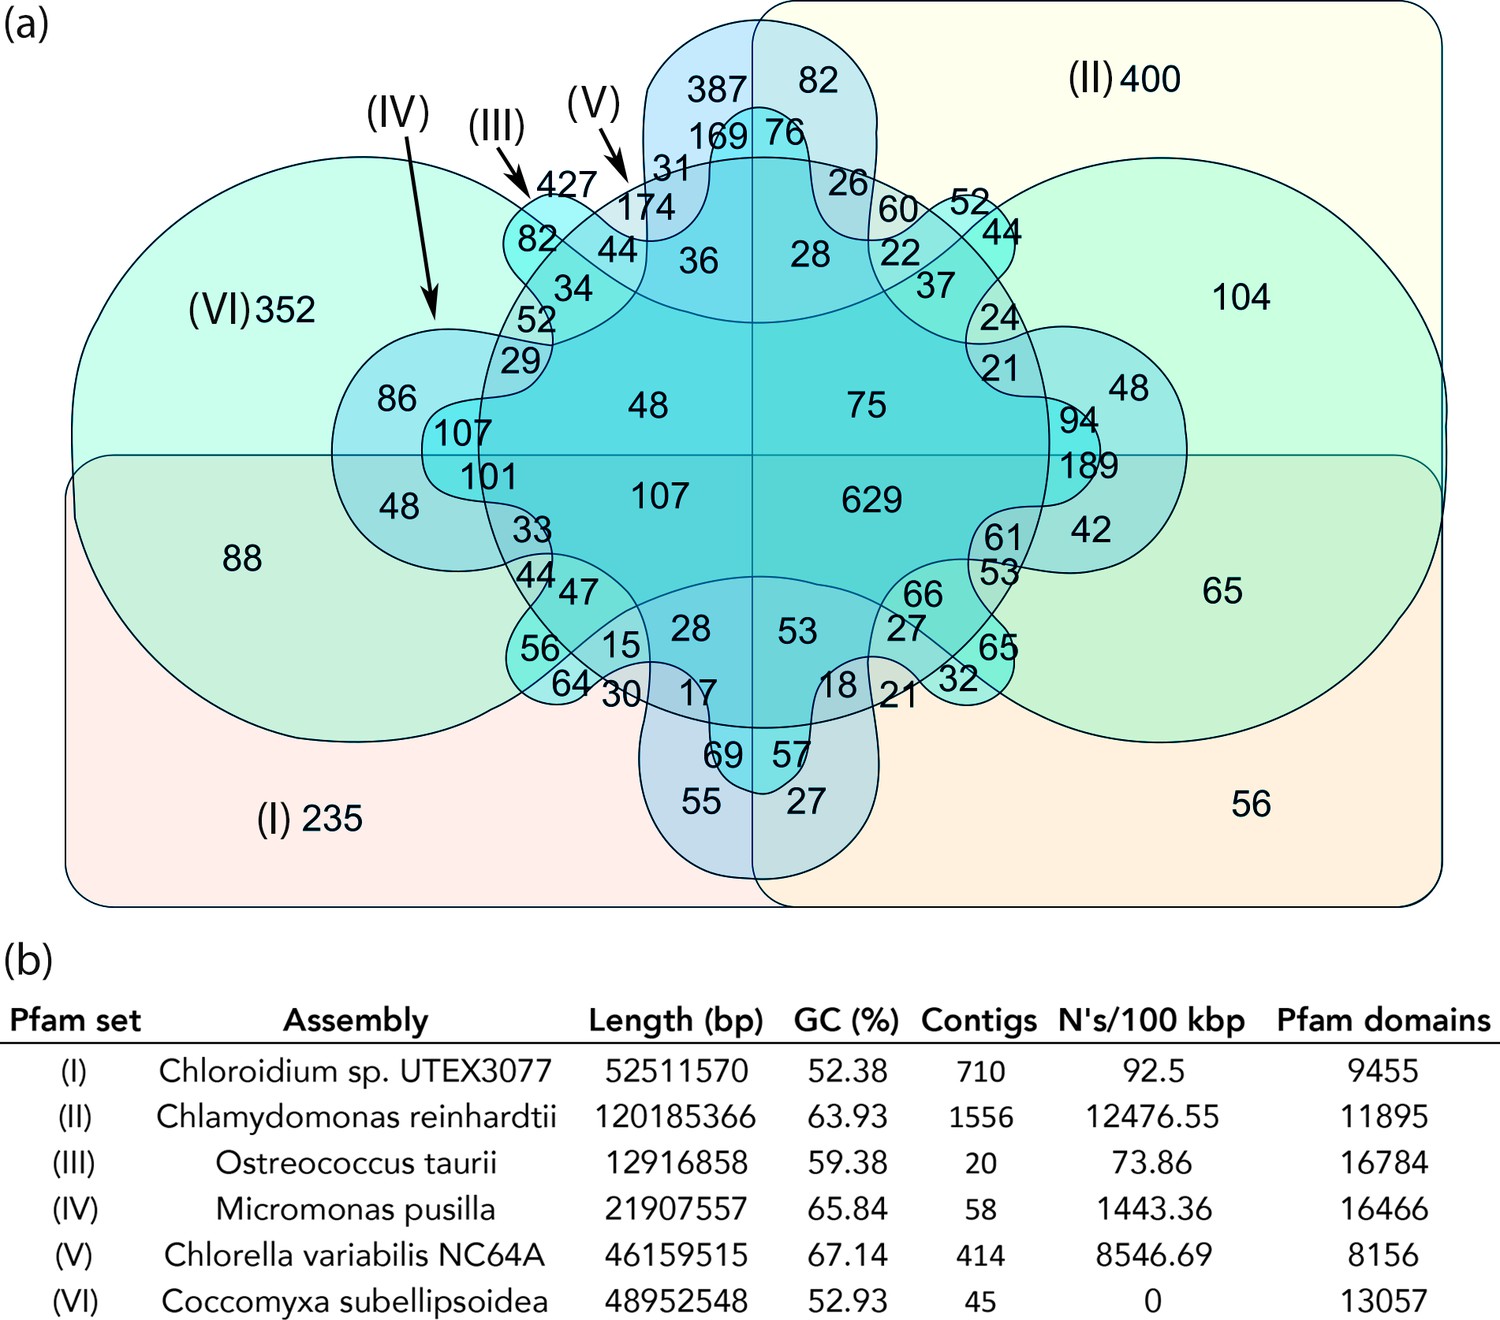
Protein family (Pfam) domains in Chloroidium sp. UTEX 3007 compared with algae from other clades.
Well-curated assemblies from genomes of algae from four other clades were downloaded from NCBI [assemblies - Micromonas pusilla, Ostreococcus taurii, and Coccomyxa subellipsoidea]. The Chlamydomonas reinhardtii genome was downloaded from Phytozome (v5.5) (Merchant et al., 2007). De novo gene prediction, including exon-intron structural modeling, yielded a set of peptide predictions that served as a base for HMM alignment with Pfam-A (v31.0, (http://hmmer.org).). (a) Shared and unique Pfam sets from representative species of major green algae clades. Pfam lists can be viewed by selecting the numbers displayed for each shared or unique value in Figure 6—source data 3. (b) Legend for (a) including additional metrics describing the algal assemblies used for de-novo coding sequence and Pfam predictions.
-
Figure 6—source data 1
Predicted Pfam designations for each species in Figure 6.
- https://doi.org/10.7554/eLife.25783.020
-
Figure 6—source data 2
Table with QUAST results used in (b).
- https://doi.org/10.7554/eLife.25783.021
-
Figure 6—source data 3
Interactive Venn diagram that can be viewed at interactivenn.net to obtain Pfam sets for numbers displayed in Figure 6.
- https://doi.org/10.7554/eLife.25783.022
Figure 7 with 1 supplement
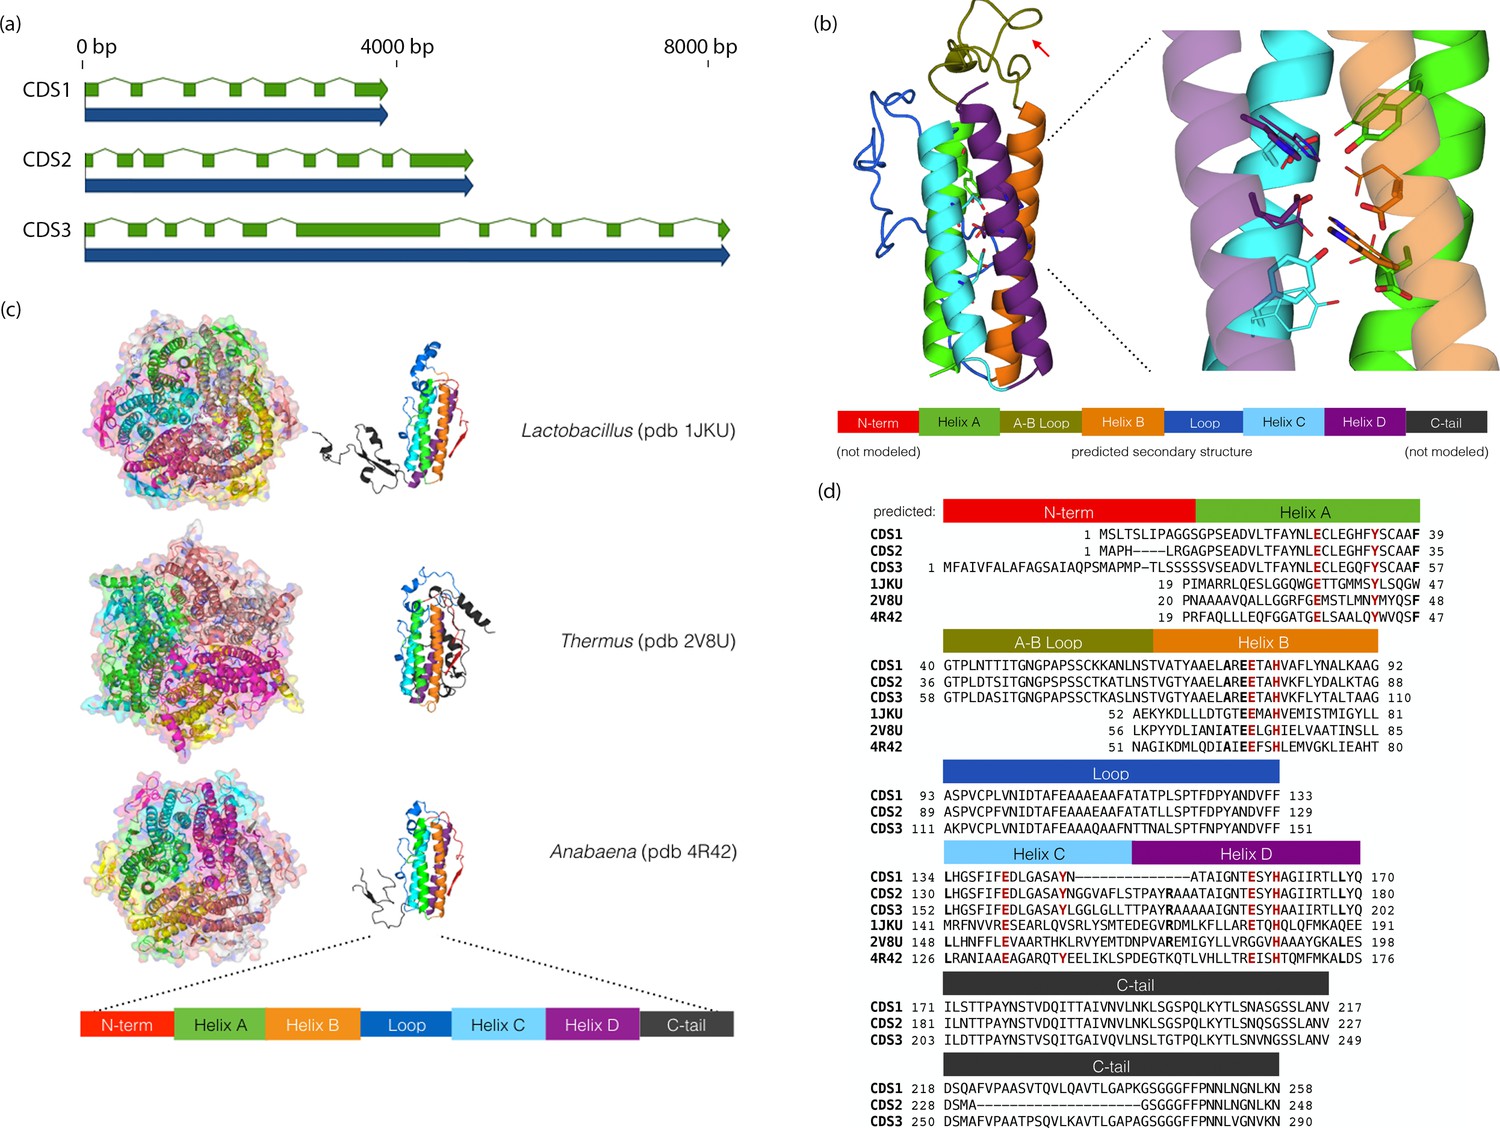
Chloroidium sp. UTEX 3007 genes exhibiting homology with desiccation-responsive Deinococcus genes.
(a) Gene models for the putative manganese catalases (CDS1/2/3). Functional annotation of homologs from (CDS1/2/3) is limited: 96 of the top 100 BLAST hits of CDS3 in the non-redundant database (nr v. 2.31, NCBI) are annotated as hypothetical or predicted proteins. Of the other four, three are characterized as desiccation related (from Auxenochlorella protothecoides, Deinococcus gobiensis I-0, and Salinisphaera shabanensis E1L3A). (b) Experimental structures of representative Mn catalases (Antonyuk et al., 2000; Barynin et al., 2001; Bihani et al., 2013) showing the homohexamers (left) and isolated monomers (right). The latter are colored according to structural motifs as given. (c) Left: Homology model of CDS3, colored according to linear structure shown below (the additional presumptive loop is indicated by the red arrow and the predicted Mn coordinating side chains are shown as sticks). Right: Zoom in of same homology model aligned with the metal coordinating residues of Anabaena PCC 7120 Mn catalase (pdb 4R42); highlighting the spatial alignment of side chains (homology model side chains shown as thick sticks, 4R42 as thin sticks). (d) Sequence alignment of CDS1-3 shown with the predicted secondary structure. The presumptive helical regions are also aligned with the corresponding sequences from the known Mn catalase structures. Canonical Mn coordinating residues are in red and other positions with sequence identity between CDS1-3 and at two least of the known catalases are in bold.
-
Figure 7—source data 1
Models of CDS1-3 in protein data bank (PDB) format.
- https://doi.org/10.7554/eLife.25783.025
-
Figure 7—source data 2
Amino acid residue alignment of CDS1-3.
- https://doi.org/10.7554/eLife.25783.026
Figure 7—figure supplement 1
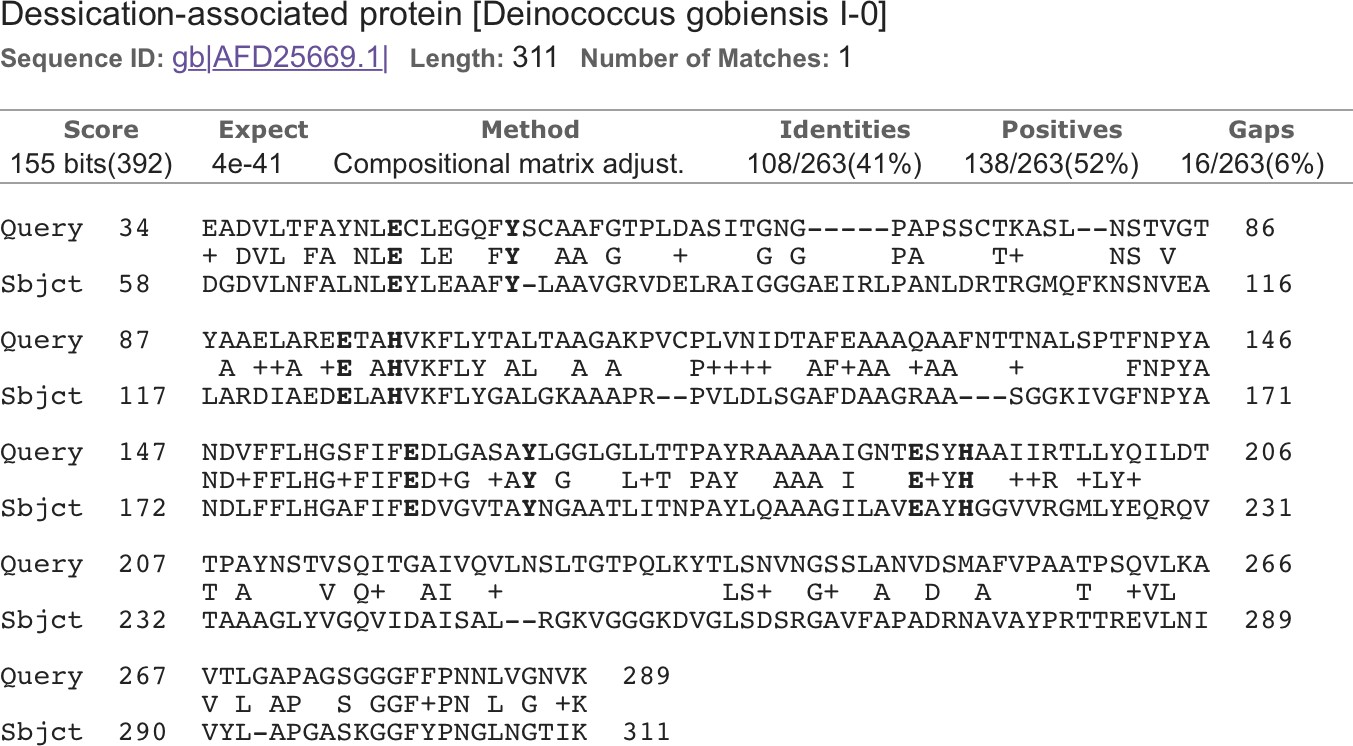
Alignment of CDS3 to a Deinococcus globiensis desiccation-related protein (Yuan et al., 2012).
Metal-binding motif residues are highlighted.
Tables
Table 1
Protein families (Pfams) with roles in (a) abiotic stress resistance and (b) saccharide metabolism unique to Chloroidium among the green algae explored. Pfam domains were predicted using HMMsearch against the Pfam-A (v31.0, http://hmmer.org) database. The i-Evalue or the ‘independent E-value’, signifies the E-value that the query would have received if it were the only domain, irrespective of homology with any other entries in the database thereby providing a stringent confidence metrics for the hit (http://hmmer.org).
| Description | Key | i-Evalue | |
|---|---|---|---|
| (a) | Iron-containing redox enzyme | Haem_oxygenas_2 | 7.50E-05 |
| Salt tolerance down-regulator | NST1 | 0.00012 | |
| Proline-rich | Pro-rich | 0.00015 | |
| Peroxisome biogenesis factor | PEX-2N | 0.003 | |
| OsmC-like protein | OsmC | 0.0066 | |
| NA,K-Atpase interacting protein | NKAIN | 0.003 | |
| Metallothionein | Metallothio_2 | 0.0074 | |
| Mercuric transport protein | MerT | 0.0054 | |
| (b) | Beta-galactosidase jelly roll domain | BetaGal_dom4_5 | 0.013 |
| Cryptococcal mannosyltransferase | CAP59_mtransfer | 3.50E-15 | |
| Carbohydrate binding domain CBM49 | CBM49 | 0.0085 | |
| Carbohydrate binding domain (family 25) | CBM_25 | 0.0023 | |
| Carbohydrate binding domain | CBM_4_9 | 0.00036 | |
| Cellulose biosynthesis protein BcsN | CBP_BcsN | 0.0018 | |
| Glycosyl hydrolase family 70 | Glyco_hydro_70 | 0.00054 | |
| Glycosyl hydrolase family 9 (heptosyltransferase) | Glyco_transf_9 | 0.0025 | |
| Carbohydrate esterase/acetylesterase | SASA | 2.00E-06 | |
| Activator of aromatic catabolism | XylR_N | 0.011 |
Download links
A two-part list of links to download the article, or parts of the article, in various formats.
Downloads (link to download the article as PDF)
Open citations (links to open the citations from this article in various online reference manager services)
Cite this article (links to download the citations from this article in formats compatible with various reference manager tools)
The genome and phenome of the green alga Chloroidium sp. UTEX 3007 reveal adaptive traits for desert acclimatization
eLife 6:e25783.
https://doi.org/10.7554/eLife.25783


