A tunable refractive index matching medium for live imaging cells, tissues and model organisms
- Max Planck Institute of Molecular Cell Biology and Genetics, Germany
- Max Planck Institute for the Physics of Complex Systems, Germany
- Center for Systems Biology Dresden, Germany
Figures
Figure 1 with 1 supplement
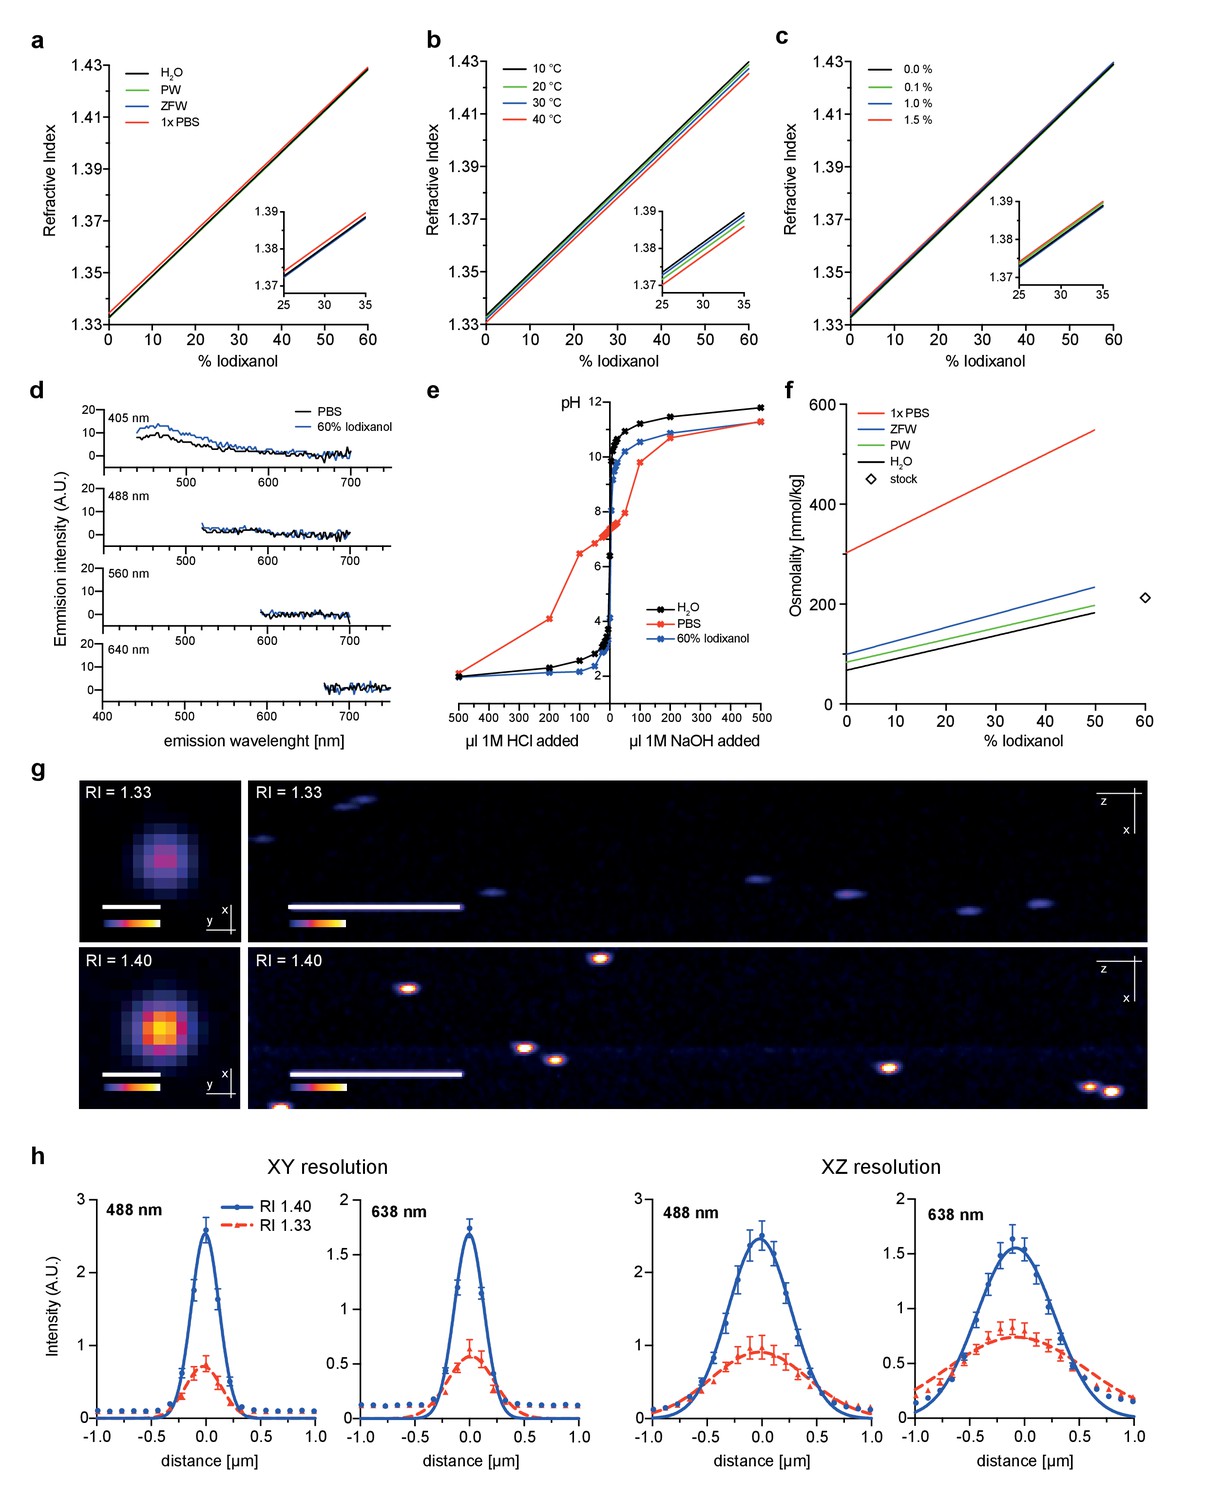
Physicochemical properties of the refractive index matching agent Iodixanol.
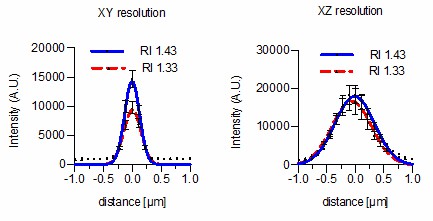
(a). Solvent dependency of the refractive index of Iodixanol. (b) Temperature dependency of the refractive index of Iodixanol solutions. Water was used as a solvent. (c) The refractive index of Iodixanol gels at various agarose concentrations. (a–c) Inset diagrams show a magnified region of the respective data set. Measurements were taken at 10% Iodixanol concentration increments as technical triplicates. In all cases a linear regression curve fit was applied to the series and the coefficient of determination is in all cases r2 > 0.999. Standard deviations (σ < 0.01% in all cases) and data points were omitted for simplicity. See Figure 1—source data 1–3 for raw measurements. (d) Autofluorescene emission spectra of Iodixanol compared to PBS measured at indicated excitation wavelengths. Note that the detected signal is by orders of magnitudes lower than that of a positive fluorescent control, even at 405 nm excitation (Figure 1—figure supplement 1). (e) pH titration curve of 60% Iodixanol stock solution and indicated reference solutions. Starting volume = 50 ml. Data obtained from a single experiment. (f) Osmolality of Iodixanol solutions in various solvents. Measurements were taken at 10% Iodixanol concentration increments as technical triplicates and a linear regression curve fit was applied to the series. The coefficient of determination is in all cases r2 > 0.981. Standard deviations (σ <0.5% in all cases) and data points were omitted for simplicity. See Figure 1—source data 4 for raw data. (g) 100 nm sub-diffraction sized beads imaged at 488 nm in unsupplemented aqueous 1% agarose (top panel) or in Iodixanol supplemented agarose tuned to the refractive index of the silicon immersion oil used for imaging (bottom panel). Lateral pictures (left) show a single optical plane while axial pictures (right) represent maximum projected y-stacks. Scale bars: lateral 0.5 µm, axial 10 µm. The colour scheme encodes relative intensity (brightest = white) and all image acquisitions were performed under identical microscope settings (h) Point spread functions of sub-diffraction sized beads as shown in (g). Quantified were peak intensity signal distributions from individual optical planes at indicated excitation wavelengths and direction (n = 20, error bars represent S.E.M). See Supplementary file 1 for quantified resolutions. Abbreviations: PBS: phosphate buffered saline; PW: planarian water; RI: refractive index; ZFW: zebrafish water.
-
Figure 1—source data 1
Raw measurement values for solvent dependency of the refractive index of Iodixanol.
- https://doi.org/10.7554/eLife.27240.004
-
Figure 1—source data 2
Raw measurement values for temperature dependency of the refractive index of Iodixanol solutions.
Water was used as a solvent.
- https://doi.org/10.7554/eLife.27240.005
-
Figure 1—source data 3
Raw measurement values for the refractive index of Iodixanol gels at various agarose concentrations.
- https://doi.org/10.7554/eLife.27240.006
-
Figure 1—source data 4
Raw measurement values for the osmolality of Iodixanol solutions in various solvents.
- https://doi.org/10.7554/eLife.27240.007
Figure 1—figure supplement 1
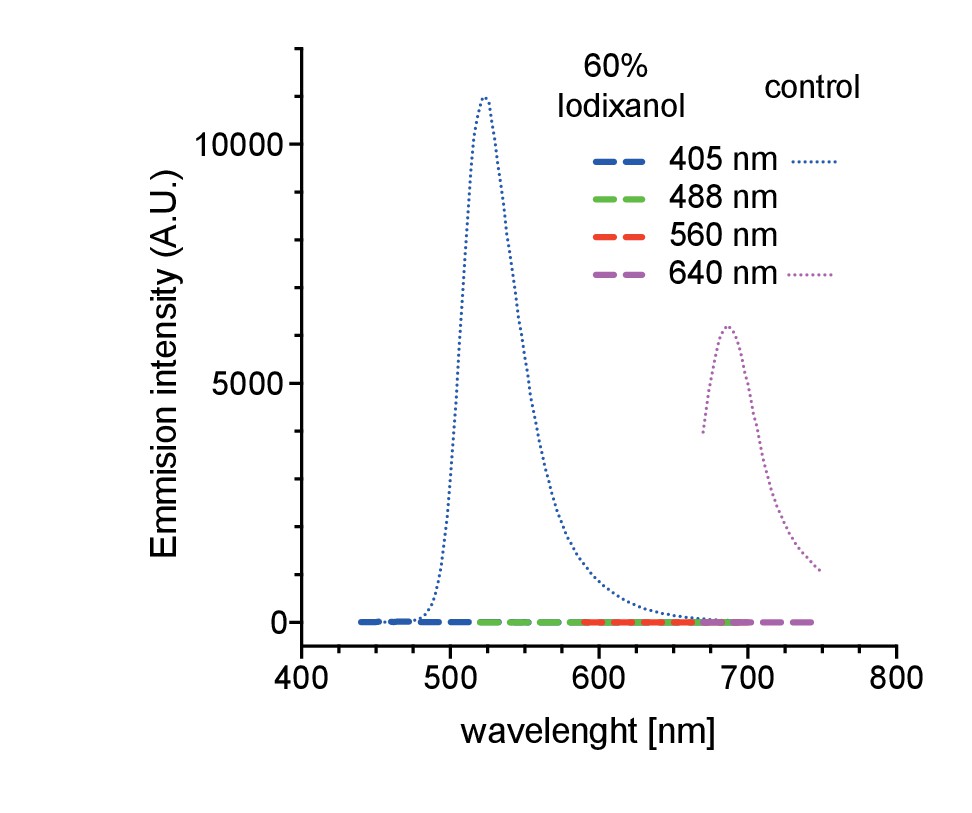
Autofluorescence measurements of 60% Iodixanol compared to a highly dilute fluorescent bead solution (0.04% solids) as positive controls at indicated excitation wavelengths.
https://doi.org/10.7554/eLife.27240.008
Figure 2 with 1 supplement
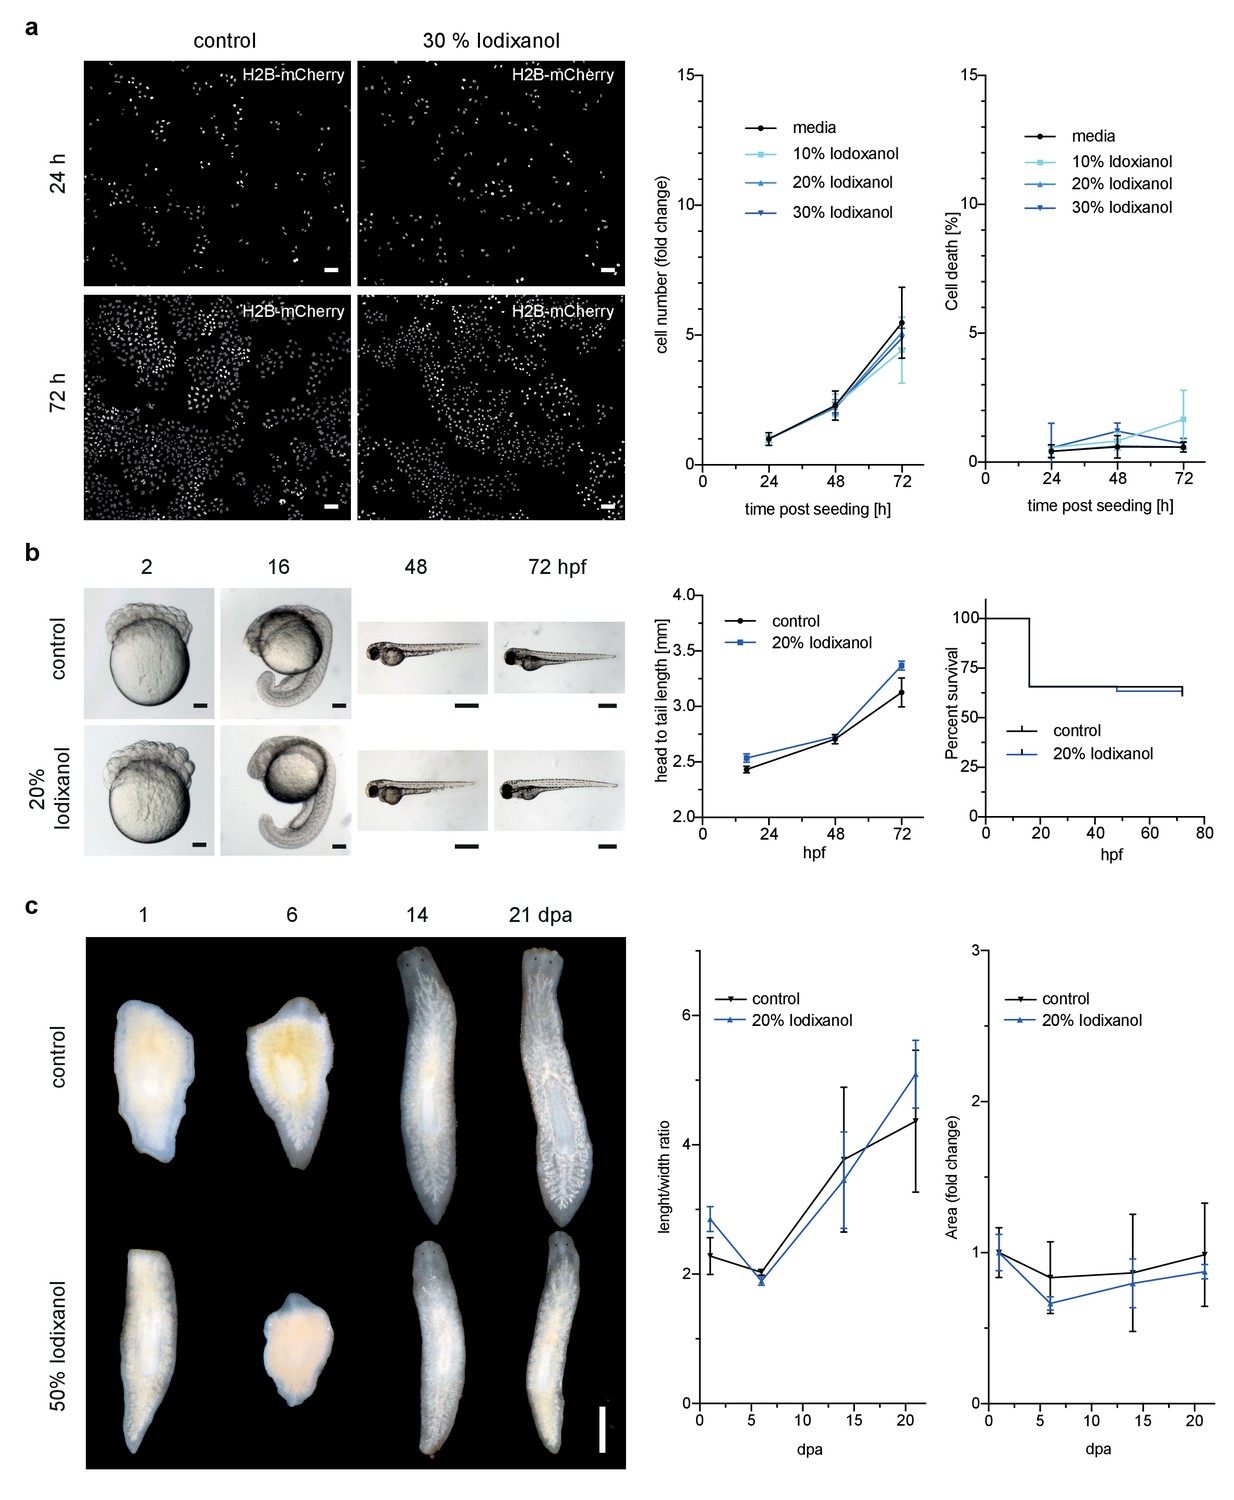
Iodixanol is live specimen compatible.
(a) Iodixanol does not affect growth and cell death levels in cultured HeLa cells. Left: Representative low-resolution images of the constitutively expressed nuclear marker H2B-mCherry at indicated incubation times and media conditions. Scale bar = 50 µm; Right: Quantification of cell numbers (number of nuclei) and dead cells (DRAQ7 positive nuclei) at the indicated time points and Iodixanol concentrations. Iodixanol was applied 24 hr post seeding and measurements were normalized to the 24 hr time point in order to compensate fluctuations in plating density. n = 3; See Figure 2—figure supplement 1 for a complete data representation. (b) Iodixanol does not affect developmental growth or survival of dechorionated zebrafish embryos. Left: Representative images of developing embryos at the indicated time points (hpf = hours post fertilization) and media conditions. N = 5; Scale bars = 100 µm at 2 and 16 hpf, 500 µm at 48 and 72 hpf. Right: Quantification of body length and survival rate at the indicated time points and media conditions. The initial drop in the survival curves is an effect of dechorionation. N = 30; (c) Iodixanol does not affect regeneration of the planarian head or body proportions. Left: Representative images of regenerating Dendrocoelum lacteum amputation fragments at the indicated time points (dpa = days post amputation) and under the indicated media conditions. Anterior is always up, Scale bar = 500 µm; Right: Quantification of length/width ratio and projected area at the indicated time points and media conditions. Measurements were normalized to the 0 time point in order to compensate initial size differences between tissue pieces. N = 3; (a–c) Error bars represent S.E.M. p>0.05 in all cases: (a) one way ANOVA (b, c) paired t-test.
Figure 2—figure supplement 1
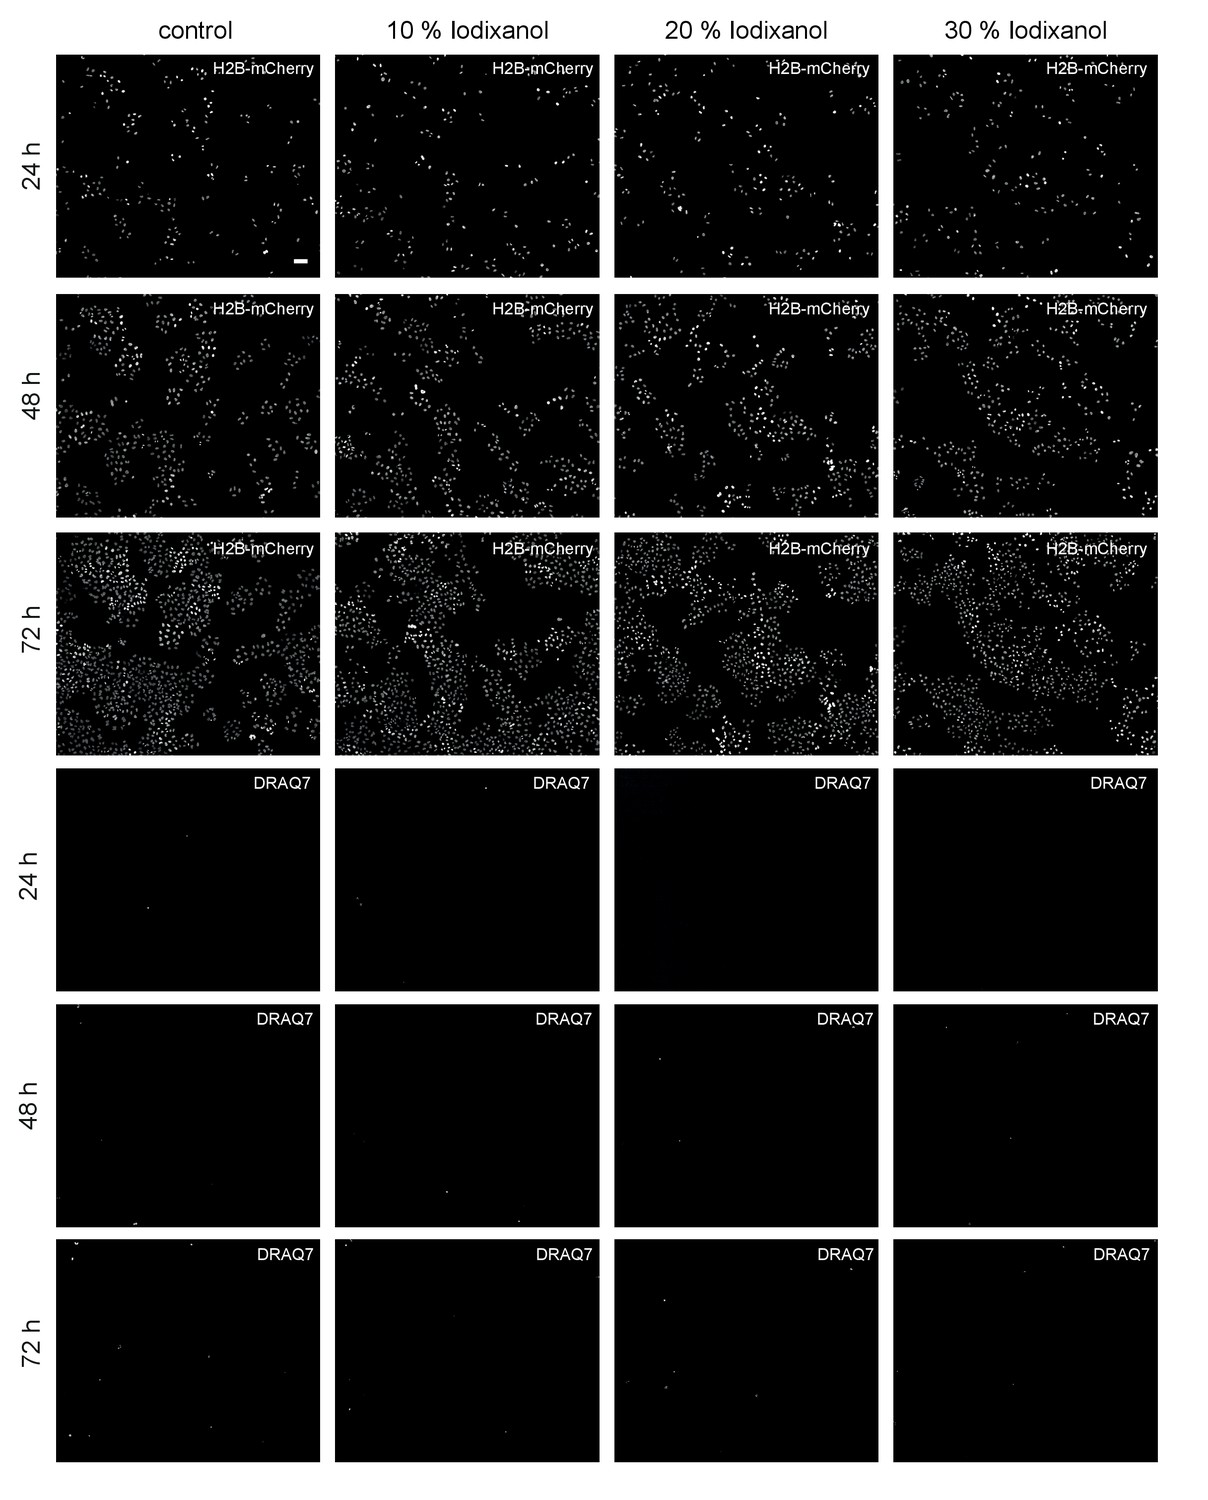
Representative low-resolution images of HeLa cell cultures exposed to the indicated Iodixanol concentrations at the indicated time points.
The top three rows show H2B-mCherry as constitutively expressed nuclear marker, the bottom three rows show staining of the same cell fields with the dead cell marker DRAQ7. Scale bar = 50 µm; all images are to scale.
Figure 3 with 1 supplement

Refractive index tuning with Iodixanol improves live-imaging of tissue culture systems.
(a). Effects of Iodixanol supplementation on live imaging of primary zebrafish cell cultures. Top Left: Brightfield image of a representative cluster of primary zebrafish embryonic cells, approximatly 50 µm in diameter. Centre panel: Images of cell clusters stained with the nuclear dye Hoechst 33342. Left column: 3D-reconstruction of representative multi-layered cell clusters, imaged in control media (RI = 1.333, top row) or in refractive index matched media (RI = 1.362, bottom row) under identical imaging conditions. The arrowheads indicate representative deep layer nuclei that are further shown as 2D optical XY-section in the right column. Graphs: Intensity profiles along the solid lines indicated in the respective xy-section image. The flatter and lower intensity profile in the control condition (top) quantitatively documents a loss of chromatin structure fine detail in deep nuclei, which is preserved by Iodixanol supplementation (bottom). Scale bars = 3D: 10 µm and 2D: 5 µm See Figure 3—figure supplement 1 for orthogonal sections. (b) Effects of Iodixanol supplementation on live imaging of human cerebral organoids. Top left: Dark field image of a representative human cerebral organoid approximately 2 mm in diameter. Centre panel: Human cerebral organoids at culture day 67 stained with the nuclear dye Hoechst 33342. Centre panel: 3D-imaging of organoids, mounted either in standard media (RI = 1.333, top row) or in refractive index matched media (RI = 1.363, bottom row) under identical imaging conditions. Left column: Maximum projections of representative z-stacks. The white frame indicates the region shown to the right as optical xy-sections at the indicated tissue depth. The solid white line across the deepest section traces the course of the pixel intensity profile shown to the right. The flatter and lower intensity profile in the standard condition (top) quantitatively documents the loss of nuclear signal at 40 µm depth, while Iodixanol supplementation (bottom) still allows nuclei detection at that depth. Scale bars = 50 µm. The color scheme encodes relative intensity (brightest = white).
Figure 3—figure supplement 1
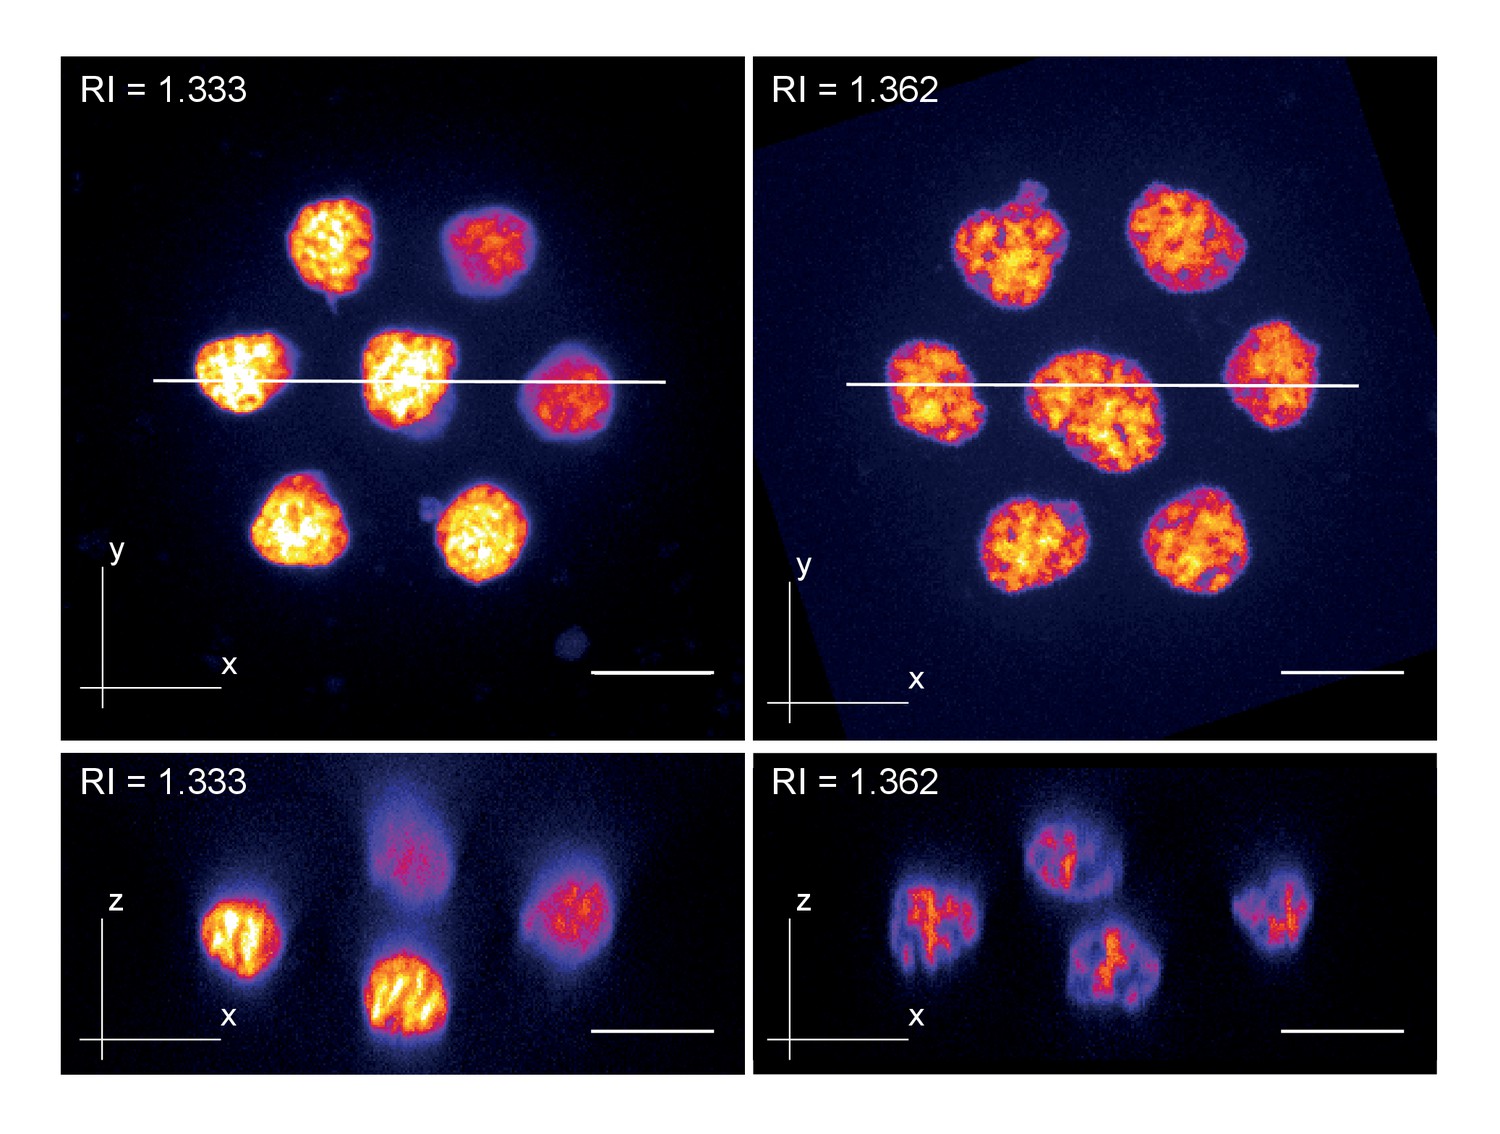
Zebrafish primary cell culture.
Top row shows maximum projected images of cell clusters imaged in standard media (RI = 1.333, left) or refractive index adjusted media (RI = 1.362, right). The bottom row shows orthogonal optical sections at the positons indicated with the solid line in the top row. Overall, the images document a loss of resolution along the Z-axis (= increasing distance from the coverslip) in standard mounting media, which can be prevented by Iodixanol supplementation.
Figure 4 with 2 supplements
Refractive index tuning with Iodixanol improves model organism live-imaging.
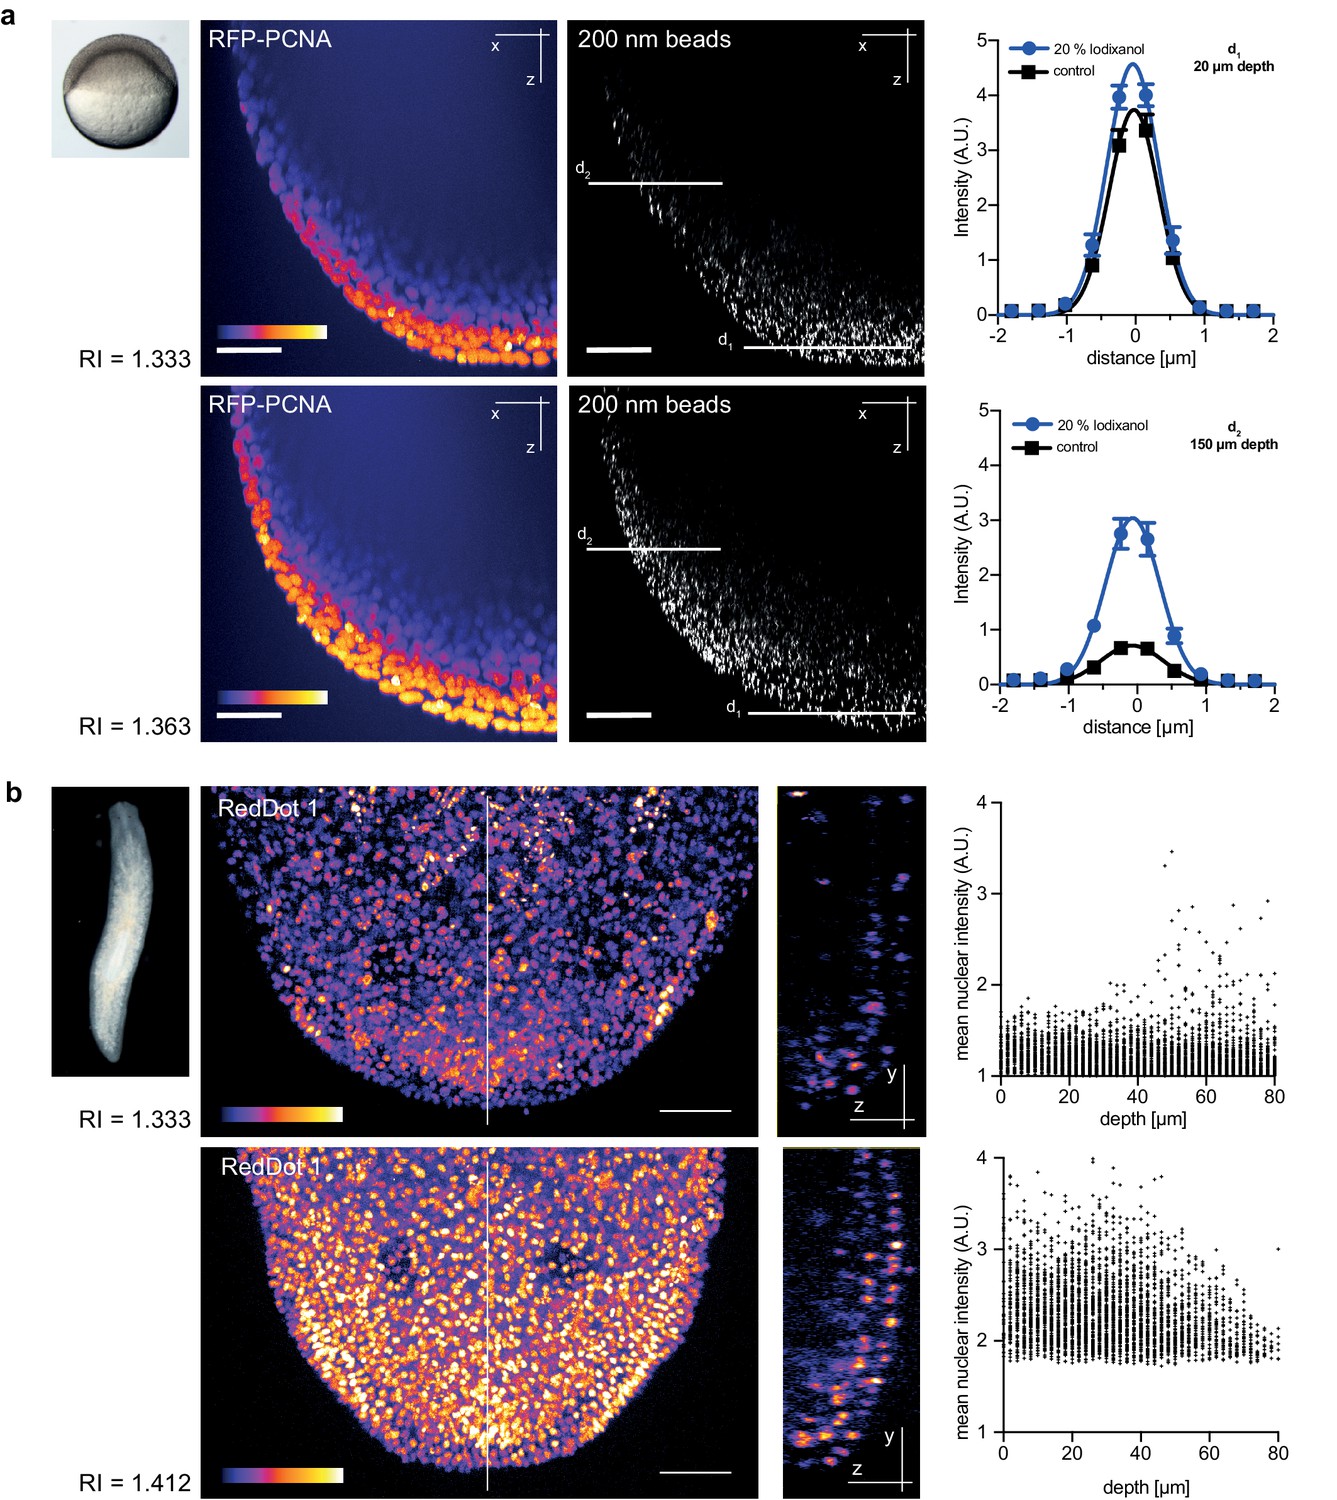
(a). Effects of Iodixanol supplementation on zebrafish embryo live imaging. Top left: Stereoscopic image of a dome stage zebrafish embryo of approximately 700 µm diameter. Centre panel: Zebrafish embryos expressing RFP-PCNA were injected at the single cell stage with 200 nm fluorescent sub-diffraction sized beads and imaged at dome stage (4 hpf). Images (left column: RFP-PCNA, right column: beads) represent 50 µm thick y-maximum projections of embryos imaged in regular media (RI = 1.333, top row) or in Iodixanol supplemented media (RI = 1.363, bottom row). Scale bars = 50 µm. The graphs to the right depict the quantification of point spread functions of individual beads (N = 20) at shallow (top) or deep (bottom) imaging depth, each for control and Iodixanol mounted specimens as per the indicated color scheme. The position of the analysed planes is indicated in the bead images to the left. The quantification of the width of the point spread function at half-maximal amplitude (See Supplementary file 1 for numerical results) reveals a significant increase in resolution in deep sections. (b) Effects of Iodixanol supplementation on planarian live imaging. Top left: Dark-field image of a specimen of the planarian flatworm Dendrocoelum lacteum approximately 4 mm in length. Centre panel: Live Dendrocoelum lacteum were stained with the nuclear marker RedDot1 and mounted in control media (RI = 1.333, top) or media Iodixanol-tuned to RI = 1.412 (bottom). The large images represent z-maximum projections of image stacks in the head region, with the solid line indicating the position of the single-plane orthogonal yz-section shown to the right. The scatter plots of mean nuclear intensity versus depth to the right quantitatively document an improved signal return upon Iodixanol supplementation, especially from deeper tissue layers. Scale bars = 50 µm. The color scheme encodes relative intensity (brightest = white).
Figure 4—figure supplement 1

Improved nuclear segmentation in deep tissue layers by Iodixanol supplementation.
four hpf zebrafish embryos expressing RFP-PCNA. Top row: Maximum projection (left) and optical XY-section at 200 µm depth (right) of an embryo in regular media (RI = 1.333) highlights a progressive loss of nuclear signal detection and segmentation beyond 100 µm imaging depth, which is quantified in the scatter plot of mean nuclear intensity versus depth (right). Bottom row: RI tuning with Iodixanol to RI = 1.363 enables nuclear detection and segmentation at up to 300 µm imaging depth. Panel order and imaging conditions exactly as above. Scale bars = 50 µm. The colour scheme encodes relative intensity (brightest = white).
Figure 4—figure supplement 2
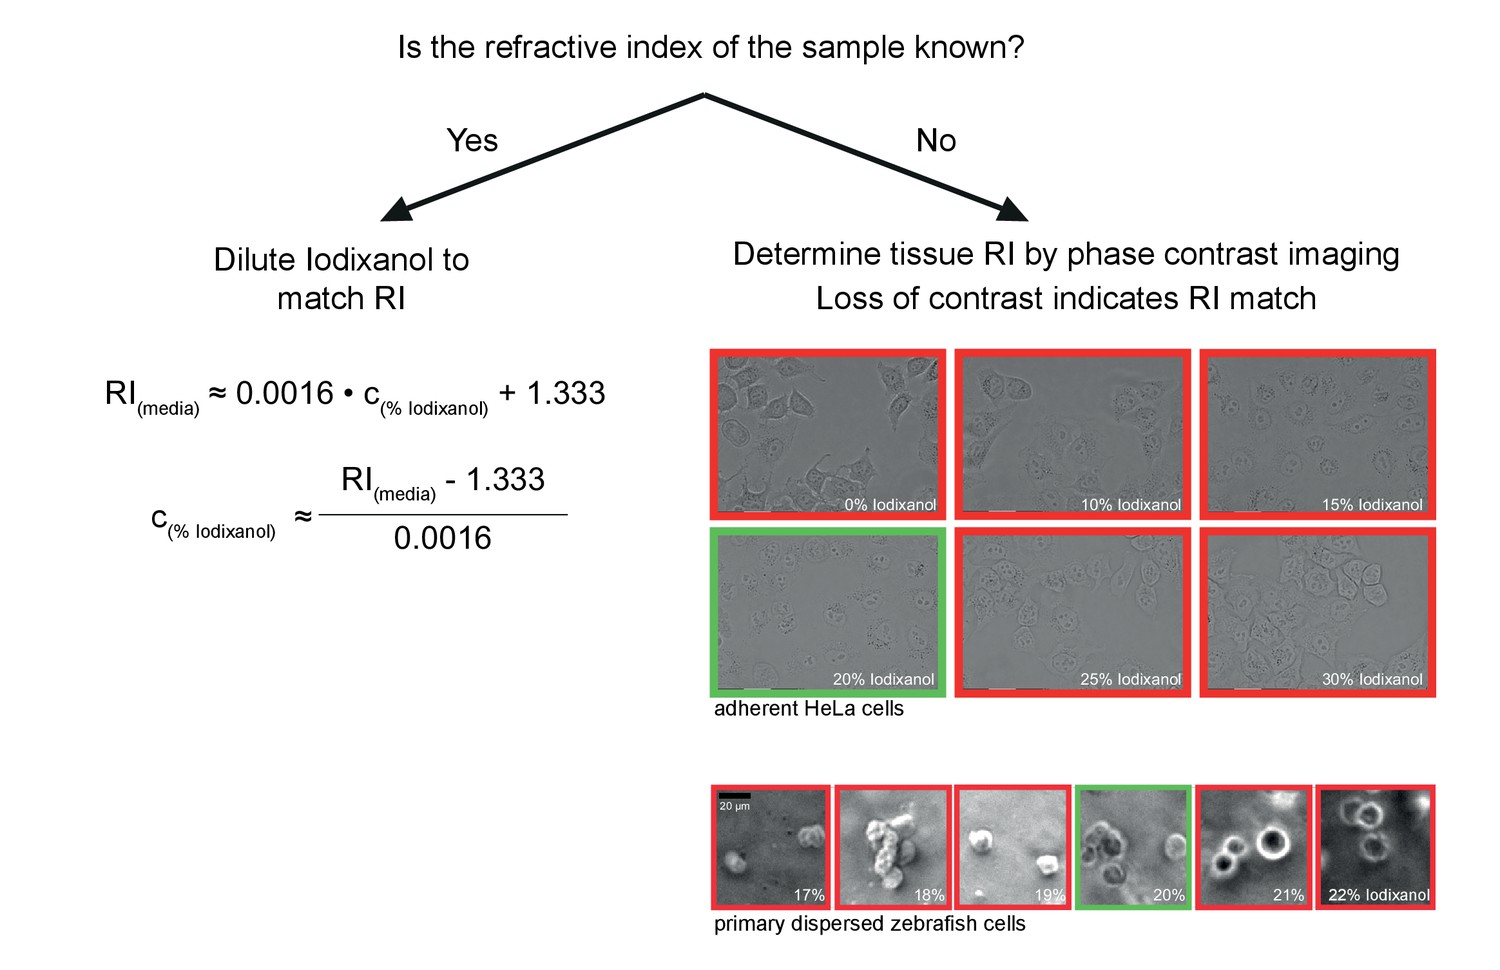
Schematic guidelines for determining the optimal Iodixanol concentration for a given specimen.
If the refractive index of the specimen is known, the formula (left) can be used to tune the refractive index of the mounting medium between RI 1.333 and RI 1.429. If the refractive index of the specimen is not known, the simple phase contrast imaging method by Oster et al. (Oster, 1956) can be used for empirically determining the optimal Iodixanol concentration (right). Briefly, this involves examining the specimen (ideally dissociated cells) mounted in different Iodixanol concentrations under a phase contrast microscope and scoring for a loss of contrast between sample and surrounding media. The images illustrate this point by example of two different specimens, with the green frame indicating the lowest contrast and thus the best amongst the tested Iodixanol concentrations. If necessary, a second round of titrations around this value can be added to determine the global optimum.
Author response image 1

HeLa cells stably expressing H2B-mCherry were exposed to 300 nM Nocodazole for 2.5 hrs.
Nocodazole treatment leads to depolimerization of microtubules stained with 0.2 nM SiR-Tubilin in both complete media and media supplemented with 30% Iodixanol. Scale bar = 10 µm. Images of live HeLa cells were acquired with a spinning disc confocal microscope.
Author response image 2
Additional files
-
Supplementary file 1
Quantitative Comparison of optical resolutions of the indicated optical systems and samples at various media refractive indexes.
Errors are S.E.M, N = 20.
- https://doi.org/10.7554/eLife.27240.016
Download links
A two-part list of links to download the article, or parts of the article, in various formats.
Downloads (link to download the article as PDF)
Open citations (links to open the citations from this article in various online reference manager services)
Cite this article (links to download the citations from this article in formats compatible with various reference manager tools)
A tunable refractive index matching medium for live imaging cells, tissues and model organisms
eLife 6:e27240.
https://doi.org/10.7554/eLife.27240


