Cortex-wide BOLD fMRI activity reflects locally-recorded slow oscillation-associated calcium waves

  1. Miriam Schwalm
  2. Florian Schmid
  3. Lydia Wachsmuth
  4. Hendrik Backhaus
  5. Andrea Kronfeld
  6. Felipe Aedo Jury
  7. Pierre-Hugues Prouvot
  8. Consuelo Fois
  9. Franziska Albers
  10. Timo van Alst
  11. Cornelius Faber
  12. Albrecht Stroh  Is a corresponding author
  1. Johannes Gutenberg-University Mainz, Germany
  2. Goethe University Frankfurt am Main, Germany
  3. University Hospital Münster, Germany

Abstract

Spontaneous slow oscillation-associated slow wave activity represents an internally generated state which is characterized by alternations of network quiescence and stereotypical episodes of neuronal activity - slow wave events. However, it remains unclear which macroscopic signal is related to these active periods of the slow wave rhythm. We used optic fiber-based calcium recordings of local neural populations in cortex and thalamus to detect neurophysiologically defined slow calcium waves in isoflurane anesthetized rats. The individual slow wave events were used for an event-related analysis of simultaneously acquired whole-brain BOLD fMRI. We identified BOLD responses directly related to onsets of slow calcium waves, revealing a cortex-wide BOLD correlate: the entire cortex was engaged in this specific type of slow wave activity. These findings demonstrate a direct relation of defined neurophysiological events to a specific BOLD activity pattern and were confirmed for ongoing slow wave activity by independent component and seed-based analyses.

https://doi.org/10.7554/eLife.27602.001

eLife digest

When a person is in a deep non-dreaming sleep, neurons in their brain alternate slowly between periods of silence and periods of activity. This gives rise to low-frequency brain rhythms called slow waves, which are thought to help stabilize memories. Slow wave activity can be detected on multiple scales, from the pattern of electrical impulses sent by an individual neuron to the collective activity of the brain’s entire outer layer, the cortex. But does slow wave activity in an individual group of neurons in the cortex affect the activity of the rest of the brain?

To find out, Schwalm, Schmid, Wachsmuth et al. took advantage of the fact that slow waves also occur under general anesthesia, and placed anesthetized rats inside miniature whole-brain scanners. A small region of cortex in each rat had been injected with a dye that fluoresces whenever the neurons in that region are active. An optical fiber was lowered into the rat’s brain to transmit the fluorescence signals to a computer. Monitoring these signals while the animals lay inside the scanner revealed that slow-wave activity in any one group of cortical neurons was accompanied by slow-wave activity across the cortex as a whole. This relationship was seen only for slow waves, and not for other brain rhythms.

Slow waves seem to occur in all species of animal with a backbone, and in both healthy and diseased brains. While it is not possible to inject fluorescent dyes into the human brain, it is possible to monitor neuronal activity using electrodes. Comparing local electrode recordings with measures of whole-brain activity from scanners could thus allow similar experiments to be performed in people. There is growing evidence – from animal models and from studies of patients – that slow waves may be altered in Alzheimer’s disease. Further work is required to determine whether detecting these changes could help diagnose disease at earlier stages, and whether reversing them may have therapeutic potential.

https://doi.org/10.7554/eLife.27602.002

Introduction

Slow oscillation-associated slow wave activity is characterized by a waxing and waning of spontaneous neuronal firing arising from neuronal populations in deeper cortical layers (Chauvette et al., 2010; Sanchez-Vives and McCormick, 2000; Stroh et al., 2013), influencing neuronal excitability as well as stimulus-response properties of neuronal networks throughout the brain (McGinley et al., 2015b; Petersen et al., 2003; Steriade et al., 1993c; 1993b). The slow wave rhythm as a ‘default mode’ of cortical network activity (Sanchez-Vives and Mattia, 2014) stands in contrast to the rather desynchronized, persistent state during rapid-eye-movement (REM) sleep and active wakefulness, dominated by low amplitude and high frequency cortical activity (Constantinople and Bruno, 2011; McGinley et al., 2015a; Steriade et al., 2001). A similar persistently active neuronal population activity can also be maintained by sedation (Constantinople and Bruno, 2011).

During slow wave activity, the corresponding low frequency (<1 Hz) component of field potential recordings reflects bimodality: active phases, in which cells are depolarized and silent periods with rather hyperpolarized membrane potentials (Timofeev et al., 2001), likely influenced through neuromodulatory pathways (Eggermann et al., 2014). This oscillation is highly similar across cortical regions (Ruiz-Mejias et al., 2011), and also across species, from lizards to humans (Achermann and Borbély, 1997; Buzsáki et al., 2013; Eschenko et al., 2006; Mölle et al., 2002; Shein-Idelson et al., 2016; Steriade et al., 2001), suggesting well-defined conserved roles (Destexhe et al., 2007).

It has been shown that slow waves are propagating, most of the times in anterior-posterior direction over the cortical surface, eventually recruiting large cortical areas (Busche et al., 2015; Massimini et al., 2004; Stroh et al., 2013), resembling a travelling wave, likely mediated by recurrent excitatory activity (Luczak et al., 2007; Massimini et al., 2004; Sanchez-Vives et al., 2017; Stroh et al., 2013). In addition, slow wave activity – correlated to cortical slow wave events - can also be found in sub-cortical regions such as the thalamus (Stroh et al., 2013) and the hippocampus (Busche et al., 2015; Hahn et al., 2006), probably mediated by long-range excitatory connections (Leong et al., 2016). However, it remains to be established whether slow wave dynamics monitored in a local neural population are correlated with global functional network dynamics captured by whole-brain measures.

Slow wave activity of a spatially confined neural population can be detected by optic fiber-based calcium recordings (Adelsberger et al., 2014; Grienberger et al., 2012; Stroh et al., 2013). Upon staining of cells with fluorescent calcium indicators such as the synthetic dye Oregon Green BAPTA-1 (OGB-1; Stosiek et al., 2003) or by transduction of neurons with the genetically encoded GCaMP6 (Chen et al., 2013a), these optical recordings exclusively monitor activity of stained or transfected cells. Besides neurons, OGB-1 also stains astrocytes (Garaschuk, 2013), yet population-based recordings are dominated by neuronal action potential related calcium influx (Grienberger et al., 2012; Grienberger and Konnerth, 2012). Calcium transients acquired by the means of an optic fiber result from synchronous spiking of at least 30 cells at the recording site (Grienberger et al., 2012) and represent the integrated signals obtained mainly from neurons and the surrounding neuropil, as demonstrated by simultaneous two-photon calcium imaging (Grienberger et al., 2012; Schulz et al., 2012). Consequently, optic fiber-based calcium recordings are well suited for the recording of local slow wave activity.

BOLD fMRI provides a measure of brain-wide hemodynamic signals. The BOLD signal reflects changes in blood oxygenation, regional cerebral blood flow, and regional cerebral blood volume, linking these hemodynamic parameters to neuronal activity by neurovascular coupling. Resting state fMRI (Biswal et al., 1995; Fox and Raichle, 2007; Hutchison and Everling, 2014) is increasingly employed to study large-scale correlations of brain activity fluctuations in low frequency bands. Neuronal correlates of spontaneous fluctuations in the BOLD signal have been identified by combining fMRI and LFP recordings at rest, subsequently correlating these two signals (Chang et al., 2013; Hsu et al., 2016; Magri et al., 2012; Pan et al., 2013; Shmuel and Leopold, 2008; Thompson et al., 2014). However, those studies used resting state fMRI methods to spatially map signal fluctuations which correlate to infra-slow fluctuations of the LFP signal, but they did not detect fMRI signal responses directly related to individual slow wave events.

Others correlated hemodynamic fluctuations with wide-field calcium imaging of excitatory neurons, convolving these two signals (Ma et al., 2016b) or compared functional connectivity during different, temporally transient patterns of calcium activity (Matsui et al., 2016). While these results support the notion of resting-state hemodynamics being coupled to underlying patterns of excitatory neuronal activity, particularly lower-frequency hemodynamic fluctuations were not well-predicted (Ma et al., 2016b). Evidence was found that globally detected calcium signals are linked to hemodynamic functional connectivity and that the spatial information of the cortical network functional connectivity may be embedded in the phase of global calcium waves (Matsui et al., 2016). Nevertheless, it has not been investigated until now, which cortical network activity reflected by the hemodynamic BOLD signal underlies the active phase of the slow wave rhythm – the slow wave event.

In order to investigate brain-wide BOLD correlates of locally occurring slow waves, these two signals have to be recorded simultaneously, and slow waves have to be detected in a spatiotemporally precise manner and directly related to BOLD activity.

To achieve this aim, optic fiber-based calcium recordings are well-suited as they can be performed unperturbed by the magnetic field of the MR scanner (Schmid et al., 2016; Schulz et al., 2012).

In this study, we examine BOLD hemodynamic responses upon individually detected, optically recorded slow calcium waves by employing event-related fMRI analysis which can be used to identify BOLD changes in response to individual events. The key concepts of event-related analyses are time-locking and signal averaging. Although originally intended to reveal transient changes in brain activation associated with the presentation of discrete sensory stimuli, event-related analysis can detect BOLD activity upon any type of previously defined events (Huettel et al., 2009; Josephs et al., 1997), in our case the active phases of the optically recorded slow calcium wave activity. In addition to the general linear model (GLM) based event-related method, we employ two multivariate exploratory approaches for fMRI data: seed-based and independent component analysis (ICA).

Here we show that a change of excitability state of a small population of neurons can be indicative for rather global network states being reflected by whole-brain BOLD activity patterns, demonstrating the particular relevance of considering readouts of local population activity for fMRI measurements. We reveal the interrelation of a neurophysiological defined slow wave event and a macroscopic, network organizing signal, and find a cortex-wide BOLD fMRI correlate.

Results

Optic-fiber based recordings are suitable for recording slow oscillation-associated calcium waves

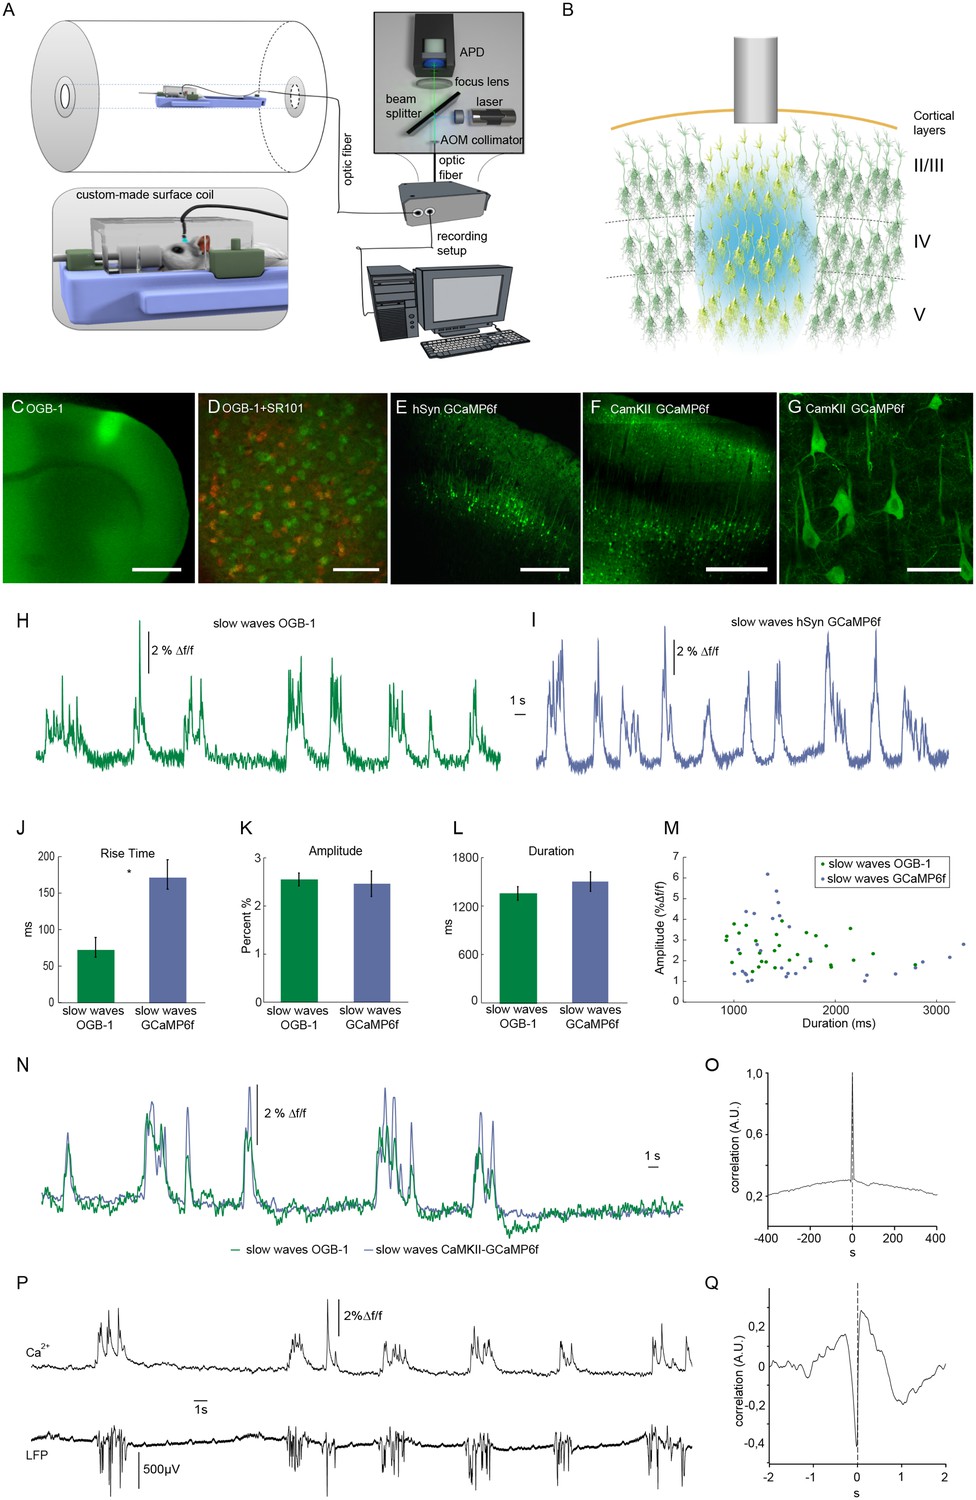
We employed an optic fiber-based approach to detect calcium transients simultaneously to fMRI scans within a 9.4 T small animal MR scanner (Figure 1A) (Schmid et al., 2016; Schulz et al., 2012). To monitor intracellular calcium as proxy of spiking, the synthetic dye Oregon Green 488 BAPTA-1 (OGB-1) was injected stereotactically resulting in a column-like stained region with a diameter of about 600 µm using the multicell bolus loading technique (Stosiek et al., 2003) (Figure 1B,C). The tip of the optical fiber with a diameter of 200 µm was implanted dorsal to the stained region (Figure 1B) in primary somatosensory cortex (S1 front limb, S1FL). As mentioned above, OGB-1 stains both neurons and astrocytes, as confirmed by co-staining with the astrocytic marker SR101 (Nimmerjahn et al., 2004) (Figure 1D). In addition, we employed the genetically encoded calcium indicator GCaMP6f under control of a pan-neuronal promoter hSyn (Figure 1E) and the CamKII promoter limiting expression to excitatory neurons (Figure 1F,G, Figure 1—figure supplement 1).

Figure 1 with 1 supplement see all
Optical recordings of slow oscillation-associated calcium waves within a small animal MR scanner in anesthetized rats.

(A) Scheme of optical recording setup comprising of a solid state laser (488 nm) coupled to a multimode optic fiber with a diameter of 200 μm. Emitted light is recorded by an avalanche photo diode (APD) and converted to a voltage signal. For simultaneous fiber-based calcium recordings and fMRI, a custom-built surface coil with a lead-through for the optic fiber is employed. (B) Upon bolus loading with OregonGreen BAPTA-1 (OGB-1) or after viral transduction with GCaMP6f, an optic fiber (grey shaded rectangle) is implanted in primary somatosensory cortex to record an integrated, yet spatially defined neural population signal. Cortical layers are indicated. (C) Fluorescence micrograph of a coronal brain slice depicting the area of OGB-1 staining at the level of primary somatosensory cortex, scale bar = 1 mm. (D) Fluorescence micrograph of co-staining with OGB-1 (green) and SR101 (red) (scale bar = 100 µm) (E) Expression of GCaMP6f four weeks after injection of AAV1.Syn.GCaMP6f (scale bar = 500 µm). (F–G) Expression of GCaMP6f four weeks after injection of AAV1.CamKII.GCaMP6f scale bar F = 500 µm G = 50 µm. (H) Calcium trace upon OGB-1 staining recorded in the MR scanner during slow wave activity. Optically recorded spontaneous stereotypical calcium waves are interrupted by periods of network quiescence. (I) Optical recordings in GCaMP6f expressing rats similarly reveal slow calcium waves. (J–M) Quantifications of slow calcium wave parameters in OGB-1 stained vs. GCaMP6f expressing rats reveal significant differences only in rise times (p=0.0001), whereas amplitude and durations are not significantly different (p=0.13; p=0.61). (N) Simultaneous optical calcium recordings outside the MR scanner using two optic fibers implanted into left hemisphere with OGB-1 staining (green trace) and with CaMKII-GCaMP6f staining. An overlay of recorded traces shows that with both indicators the occurrence of a slow wave is reflected by similar transients. (O) Cross-correlation of simultaneously recorded optical calcium signals obtained in (N) indicates high similarity between both signals. (P) Simultaneous optical calcium and LFP recordings outside of the MR scanner indicating correlation of slow calcium waves with electrically recorded slow oscillations under isoflurane anesthesia. (Q) Cross-correlation of optically and electrically recorded traces result in a prominent peak with almost zero time shift, indicating a close similarity of the two signals.

https://doi.org/10.7554/eLife.27602.003
Figure 1—source data 1

Amplitude, duration and rise time values for quantification of OGB-1 slow calcium wave events (data shown in Figure 1J–M).

Rise time, duration and amplitude of calcium transients were assessed and statistically compared in animals measured upon OGB-1 injections (n = 8 animals). Rise time was defined as time between onset of the transients and 50% of maximum intensity peak. Duration of the transients was defined as the time between the first and the last intensity value exceeding 50% of maximum intensity peak. Amplitude was determined as the intensity difference (∆f) from the baseline and the highest intensity value of the transients.

https://doi.org/10.7554/eLife.27602.005
Figure 1—source data 2

Amplitude, duration and rise time values for quantification of GCaMP6f slow calcium wave events (data shown in Figure 1J–M).

Rise time, duration and amplitude of calcium transients were assessed and statistically compared in GCaMP6f transduced rats (n = 2 animals). Rise time, duration and amplitude were defined as described for OGB-1 slow calcium wave events (Figure 1—source data 1).

https://doi.org/10.7554/eLife.27602.006

Experiments were conducted under isoflurane anesthesia (1.1–1.8%) inducing and maintaining slow wave activity with recurrent slow wave events at similar frequencies (Chen et al., 2013b; Grienberger et al., 2012; Lissek et al., 2016; Luczak et al., 2007; Stroh et al., 2013). Calcium waves were reliably recorded during simultaneous fMRI recordings (8 out of 10 experiments in 7 out of 8 animals), occurring at frequencies ranging between 9 and 15 events/min (mean 10.9 ± 1.3 events/min), in line with previous in vivo recordings (Busche et al., 2015; Kerr et al., 2005; Stroh et al., 2013) (Figure 1H,I).

For OGB-1, the typical and rather uniform calcium waves exhibited sharp rise times (72 ± 14 ms, and rather variable durations and amplitudes of 1356 ± 85 ms and 2.6 ± 0.1 Δf/f, respectively (n = 30 traces, five animals). For GCaMP6f (hSyn) the rise times exhibited slower kinetics (163 ± 14 ms, n = 30 traces, two animals, Figure 1J) presumably due to four calcium binding sites of the calmodulin, which need to be occupied to reach maximum fluorescence change, while similar values for durations and amplitudes of slow waves were observed as compared to OGB-1 (Figure 1K,L,M). To test, whether indeed OGB-1 and GCaMP6f both reveal the same slow wave events, we conducted two-fiber experiments outside of the MR scanner, in two animals expressing GCaMP6f under control of the CaMKII promoter in S1FL, and being injected with OGB-1 2 mm posterior to that site on the same hemisphere. (Figure 1N). Indeed, we found the associated slow waves to be highly correlated (Figure 1N,O). The calcium waves were separated by periods of network quiescence of variable durations (Figure 1H,I,N,P), equivalent to down states in electrophysiological recordings (Poulet and Petersen, 2008; Seamari et al., 2007; Steriade et al., 1993c; 1993b). In line with previous results (Busche et al., 2015; Stroh et al., 2013), the observed population calcium transients were correlated with electrically recorded slow oscillations in the local field potentials (LFPs; Figure 1P,Q).

Onsets and durations of optically recorded slow calcium waves can be utilized for hemodynamic response extraction and event-related fMRI analysis

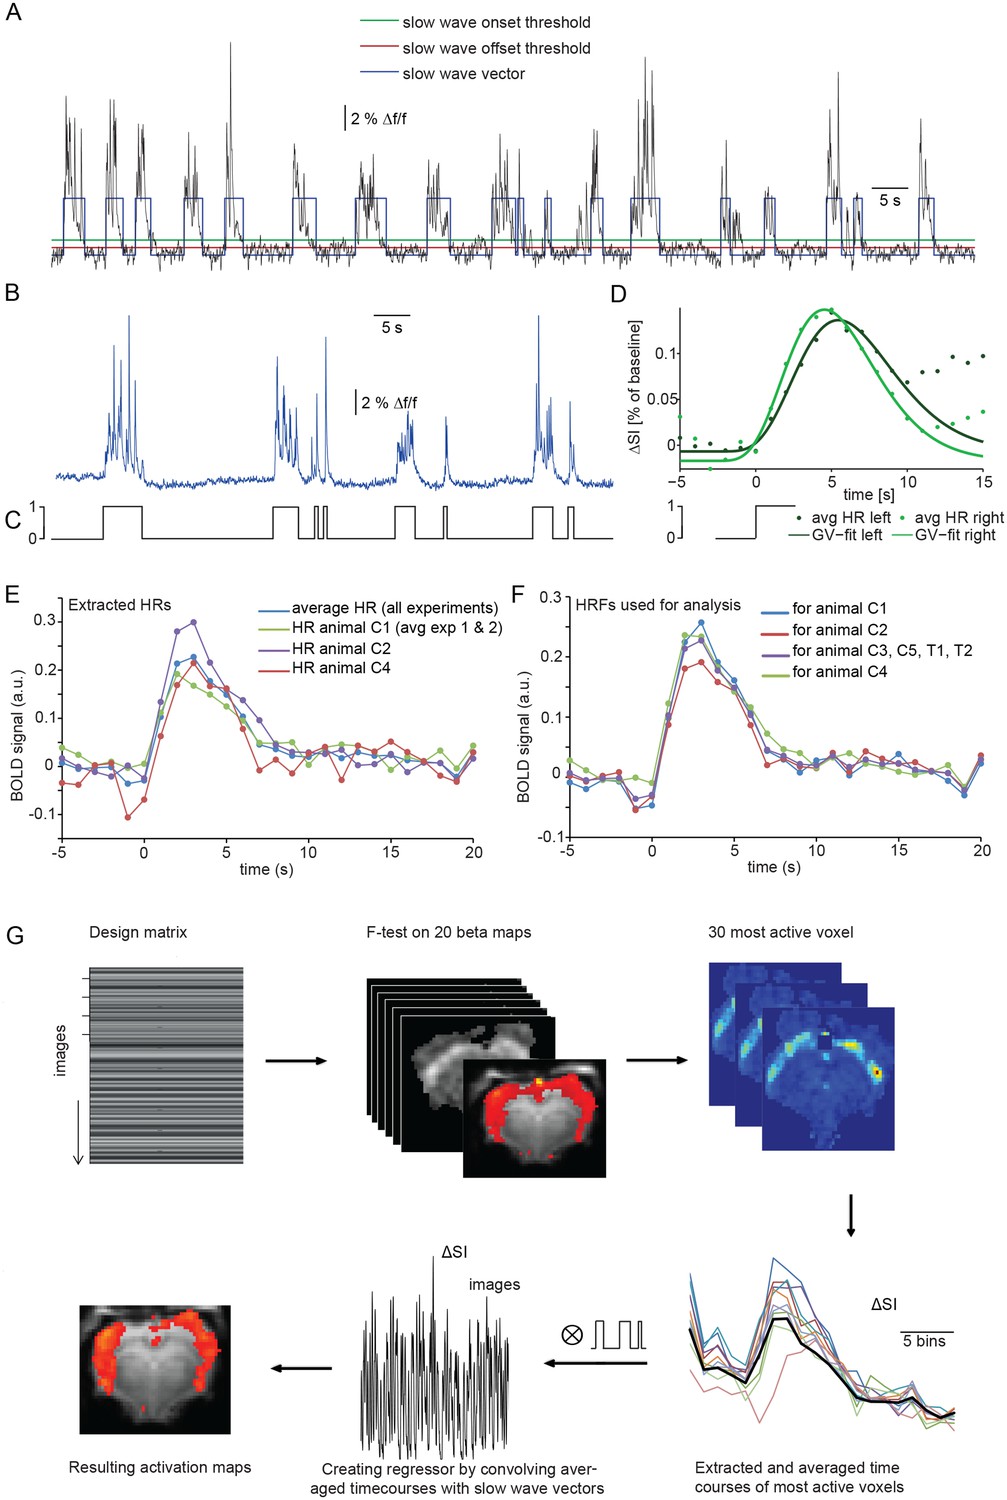
Calcium slow wave events were identified using an adapted version of an algorithm established for the detection of slow oscillations in electrophysiological recordings in vitro and in vivo (Seamari et al., 2007), separating slow oscillatory activity and silent periods based on exponential moving average (EMA) filters. We adapted and optimized this procedure for the identification of slow wave activity in optical calcium recordings in vivo. Applying this detection algorithm yielded an average number of 298 ± 20 slow wave events per 30 min experiment (n = 7 animals; Figure 2B). The resulting onsets and durations of calcium slow waves were encoded as a binary array of events (one) and silent periods (zero). These ‘slow wave vectors’ (Figure 2A,C) were used as a condition in an event-related fMRI analysis and were convolved and correlated with the fMRI signal to detect BOLD responses following the specified events defined in a design matrix.

Figure 2 with 3 supplements see all
Identifying a BOLD response upon slow wave events detected in cortical calcium recordings.

(A) Onset and termination thresholds based on EMA filters detect slow wave events in a calcium trace recorded in the MR scanner and can be used to create a slow wave vector. (B,C) The binarized slow wave vector (C) containing the precise timing of the slow calcium wave events (B) can be used as an event array for subsequent fMRI analysis. (D) Averaged BOLD signal in cortical ROIs in both hemispheres of an individual experiment upon the onset of slow calcium wave events, fitted with a gamma variate (GV). Note, that due to subsequent slow calcium wave events within the time frame of the respective BOLD response (see A,B), the raw signal does not decay to baseline levels. (E) Extracted hemodynamic responses (HRs) with finite impulse response (FIR) methods. Intra- and interindividual timecourses show almost identical signal characteristics. (F) Individual HRs were averaged and used as HRF for subsequent fMRI analysis (for animal C1 HRs from animal C2 and animal C3 were averaged; for animal C2 HRs from animal C1 and animal C3; for animal C3 HRs from animal C1 and C2; for animal C4 HRs from animal C1, C2; for animal C3, C5, T1 and T2 HRs from animal C1, C2 and C4 were averaged). (G) Flow chart of fMRI analysis procedure starting with the design matrix, defined by the FIR basis function set and the spontaneous calcium wave as event.

https://doi.org/10.7554/eLife.27602.007

The temporal characteristics of the hemodynamic response (HR) elicited by slow wave activity remains insufficiently explored and due to the specific slow wave network activity may differ from HRs elicited e.g. by sensory stimulation. Therefore we first examined the shape of typical HRs elicited by individual slow wave events in cortical ROIs on left and right hemisphere (Figure 2D, Figure 2—figure supplement 1). Timecourse of averaged HRs exhibited a sharp rise from baseline to maximum during 0.7 s ± 0.4 s after the onset of a slow calcium wave, reaching the maximum signal amplitude of 0.17%±0.03% (ΔSA) at 6.5 s ± 0.4 s (TTP) with a half maximum duration (HMD) of 6.8 s +- 0.5 s. Next, we extracted HRs following the onsets of slow calcium waves from the 30 most active voxel of each measurement using a model-free approach based on a finite impulse response method (FIR) (Dale, 1999; Glover, 1999) which approximates the underlying timecourse of HRs without any a priori assumptions (Jansma et al., 2013) (Figure 2E).

Subsequently, we used a leave-n-out approach analyzing datasets with averaged HRs extracted solely from the remaining animals, to avoid circular analysis (Kriegeskorte et al., 2009) (Figure 2F). For this purpose, the resulting HRs were averaged and used as hemodynamic response functions (HRFs) convolved with the event arrays generated from the calcium waves to create activation maps reflecting ongoing BOLD activity during slow oscillation-associated slow wave activity (Figure 2G).

Calcium slow wave event-related analysis reveals cortex-wide BOLD correlate

We used event-related analysis (Josephs et al., 1997), based on either the extracted HRF or the FIR-derived HRF (see Materials and Methods) to correlate onsets and durations of locally detected slow calcium waves (Figure 3A,B) with the simultaneously acquired fMRI BOLD signal. Event-related fMRI analysis accounts for responses to each predefined event which is specified in terms of its onset and duration (Huettel et al., 2009).

Figure 3 with 3 supplements see all
Relating neurophysiologically defined slow calcium wave events to fMRI BOLD signal reveals cortex-wide activation.

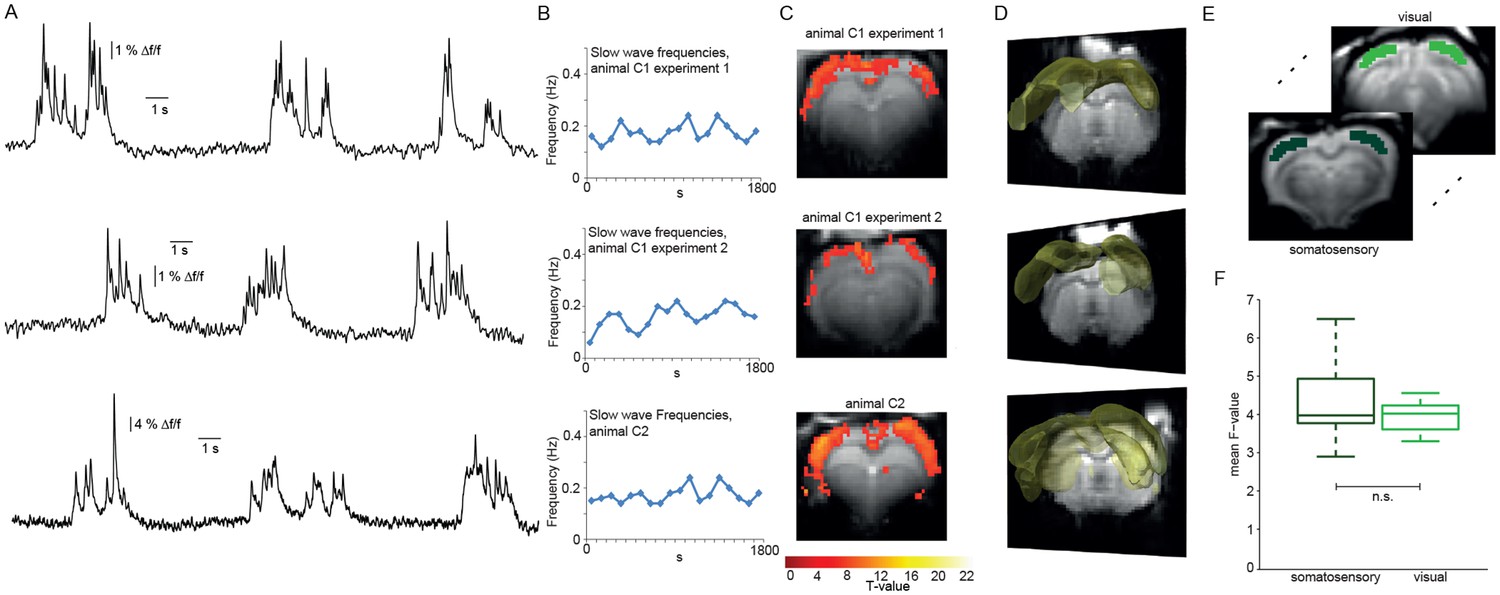
(A) Excerpts of calcium traces acquired during fMRI measurements in three experiments depicting slow calcium waves. (B) Frequencies of slow calcium waves within an imaging experiment. (C) BOLD correlate upon FIR-based event-related fMRI analysis in the cortex. (D) 3D renderings depict cortex-wide expansion of activity shown in (B) (light-yellow shading shows above threshold activity). (E,F) Quantitative comparison of BOLD activation in somatosensory (10 ROIs, 4 animals, 5 experiments) and visual cortex (6 ROIs, 4 animals, 5 experiments). No significant difference in the mean F-values could be detected (mean F-values in somatosensory cortex: 4.3 ± 0.3, in visual cortex: 4.0 ± 0.1, p=0.41).

https://doi.org/10.7554/eLife.27602.011
Figure 3—source data 1

Cluster sizes and T-values for experimental HRF versus canonical HRF for all experiments (Table for data shown in Figure 3—figure supplement 2).

Mean T-value over all ROIs for canonical HRF: 3.95 ± 0.53, mean T-value for FIR-extracted HRF: 3.91 ± 0.32. Means do not differ significantly between groups (Wilcoxon rank-sum test).

https://doi.org/10.7554/eLife.27602.015

Using the detected individual slow wave events in the calcium signal in an event-related analysis based on extracted HRFs revealed BOLD activation of nearly the entire cortex during slow wave activity (Figure 3C,D; Figure 3—figure supplement 1) in 6 of 8 experiments (n = 7 rats). Although cluster sizes varied over animals and experiments, the activation clusters were spanning almost all slices for all experiments showing BOLD activation (Figure 3C,D; Figure 3—figure supplement 2). While activation patterns were occasionally patchy (Figure 3—figure supplement 1C; Figure 3—figure supplement 2), each cortical area was showing at least partial BOLD activation predicted by slow calcium waves in every experiment, i.e. no cortical area was excluded from BOLD activity.

We next asked, whether the BOLD activity quantitatively differs between cortical areas. Therefore, we analyzed bilateral ROIs drawn on the F-maps derived from the event-related analysis employing HRFs obtained from a FIR analysis previously performed in a different set of animals, both in somatosensory and visual cortex (Figure 3E). The F-values of the two regions of the cortex showed no significant differences in mean values (Figure 3F). In addition, we extracted the HR of the two regions from the beta-maps, no apparent differences in the shape of the HRs could be observed (p=0.23, Wilcoxon rank-sum test), indicative of a rather uniform activation profile throughout the cortex. These results suggest that locally recorded slow calcium wave events have a cortex-wide correlate in the fMRI BOLD signal representing global slow wave activity.

To confirm that the resulting HRs do not differ depending on the dataset used for extraction, we performed a cross-validation procedure and analyzed datasets with two different previously extracted HRs and compared cluster sizes and T-values (Figure 2—figure supplement 3). For this analysis we used mean HRs extracted from at least two other animals.

Next, we compared our individualized HRF estimation based on the experimental slow wave data with the canonical HRF, routinely employed in fMRI data both in humans (Glover, 1999; Lindquist and Wager, 2007) and rats (Amirmohseni et al., 2016), by applying the SPM standard procedure which uses a continuous canonical HRF model (Figure 3—figure supplement 2A,B). We compared T-values in the previously defined ROIs and the approaches yielded comparable results (Figure 3—source data 1).

To further test for the specificity and interrelation of a recorded calcium event array to the respective BOLD activation and to rule out a general effect of specifically spaced event-timing causing the reported effects, we applied two control procedures for this analysis: swapping regressors between the animals (Figure 3—figure supplement 3A,B) and temporally reverting the event arrays (Figure 3—figure supplement 3C,D) resulted in no BOLD activation in any of the data sets, thus confirming the specificity of the observed activations.

Slow oscillation-associated calcium waves in the thalamus

As mentioned, slow oscillations-associated calcium waves recruit not only the cortex, but also the thalamus. We therefore conducted optic fiber-based calcium recordings in the posterior medial nucleus of the somatosensory thalamus (POm; Figure 4A). As expected, we were able to record typical slow wave events, albeit at a lower SNR (Figure 4B) in two animals, with similar characteristics compared to the cortically recorded slow waves, in line with a previous study (Stroh et al., 2013). We then extracted the HR as described earlier. Using those thalamic calcium waves as events, we found BOLD activation in the cortex only (Figure 4E,F; 2 experiments in two animals), similar to the cortical recordings. This confirmed the tight synchronicity between cortical and thalamic calcium waves. The fact that no BOLD signal in thalamus was detected is most likely due to using a MR surface coil which results in lower detection sensitivity in subcortical regions.

BOLD correlate upon FIR-based event-related fMRI analysis using slow wave vectors acquired in the thalamus.

(A) Micrograph of a coronal brain slice depicting the area of OGB-1 staining at the level of thalamus (POm). (B) Excerpt of calcium trace acquired in thalamus during fMRI measurements depicting slow calcium waves and the binarized slow wave vector derived from these calcium waves. (C) Extracted hemodynamic responses (HRs) with FIR methods. The time course shows almost identical signal characteristics as in previous datasets using cortical calcium recordings. (D) Frequencies of slow calcium waves within an imaging experiment. (E) BOLD correlate upon FIR-based event-related fMRI analysis in the cortex of animal T1 and T2. (F) 3D rendering depicts cortex-wide expansion of activity shown in (E) (light-yellow shading shows above threshold activity).

https://doi.org/10.7554/eLife.27602.016

Cortex-wide BOLD activation is specific for slow calcium wave events

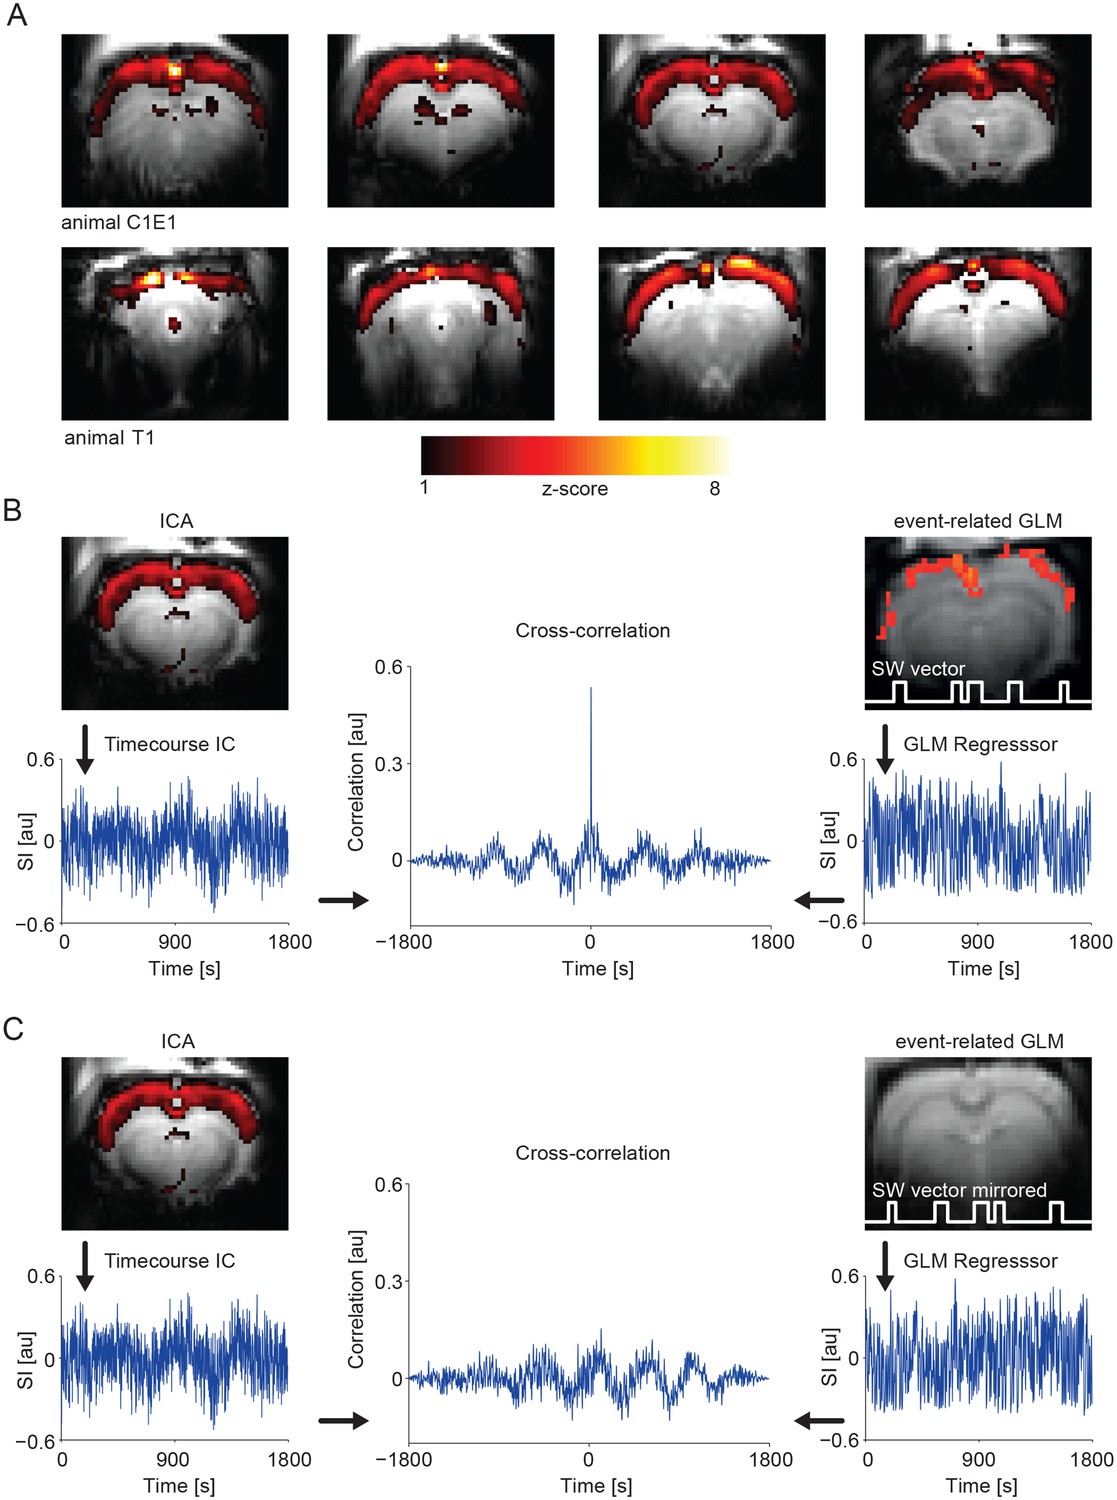
GLM-based fMRI analysis identifies voxel correlated with the model timecourse. Model-free analysis approaches do not require a priori knowledge about activation patterns and do not consider voxel individually to reveal potential voxel interactions. Consequently, in addition to the event-related GLM method, we employed independent component analysis (ICA) for ongoing slow wave activity. ICA aims to recover a set of maximally independent sources from their observed mixtures without knowledge of the source signals or the mixing parameters (Hyvärinen and Oja, 2000). With this analysis, during ongoing slow wave activity, we found ICA components mirroring the results obtained by using the slow calcium waves as regressor in the same animals (Figure 5A). Notably, the timecourse of the ICA component revealing cortex-wide activation is highly correlated with the GLM regressor obtained from taking into account slow wave onsets detected in the calcium recordings (R = 0.4 ± 0.05, n = 9 animals; Figure 5B), further confirming the neurophysiological basis of this component. To test for specificity of those results we also calculated the same cross-correlation of the ICA component timecourse with the GLM-regressor, but with the GLM-regressor obtained from the temporally mirrored slow wave vector (see Figure 3—figure supplement 3C) of the same animal, which leads to a complete absence of correlation between the ICA component timecourse and the event-related GLM-regressor (Figure 5C).

Figure 5 with 4 supplements see all
IC analysis in slow activity results in a component showing pan-cortical activation specifically correlating to the calcium slow wave vector.

(A) Pan-cortical component in slow wave activity (isoflurane anesthesia). Spatial correlate of two exemplary ICs showing consistent high values covering the entire cortex. Two representative animals and four imaging slices each are depicted. (B) The timecourse of the pan-cortical activation component is highly correlated with the regressor extracted from the slow wave vector (SW vector) obtained from the calcium recordings (r = 0.535 and r = 0.628) for upper and lower ICs shown in (A), when this SW vector is mirrored in time, this correlation completely disappears (C). (B) and (C) both shown for animal C1E1.

https://doi.org/10.7554/eLife.27602.017

As ICA decomposition can produce a substantial number of noise components, we extracted the component set (number of components identified by minimum description length criterion (MDL), see Materials and Methods) for a group ICA (Figure 5—figure supplement 1A), as well as for the corresponding single datasets (Figure 5—figure supplement 1B). Notably, we could again identify pan-cortical activation patterns in both the group- and the single-subject based results (ICs #3, #6 in Figure 5—figure supplement 1). In addition, with this analysis we could identify components related to typical resting state networks including auditory (IC #1) and visual (IC #8) cortex, striatum (IC #7) and hippocampus (IC #20) in line with others (Jonckers et al., 2011). A comparison of the power spectra related to the timecourses of the pan-cortical and two other components shows that the pan-cortical component exhibits higher power in the <0.1 Hz range (Figure 5—figure supplement 2A–D).

Regressing out the timecourse derived by the slow wave vector obtained from the calcium transients (see Materials and Methods), leads to complete absence of pan-cortical components in the ICA (Figure 5—figure supplement 2E,F).

Next, we asked, whether the cortex-wide BOLD activation is indeed specifically related to individually detected slow wave events. Therefore, we contrasted this activity, maintained by isoflurane anesthesia, with persistent activity, maintained by medetomidine sedation. This persistent activity is lacking slow calcium wave activity, i.e. bimodality (Figure 5—figure supplement 3). We confirmed the differential population activity under the two conditions by assessing both spontaneous as well as sensory-evoked calcium transients as previously described separately for both conditions (Schmid et al., 2016; Schulz et al., 2012; Stroh et al., 2013).

During persistent activity, we did not find any component indicative of a synchronous cortical activation (n = 6), but we found resting state networks as previously described (Figure 5—figure supplement 4A,B) (Hsu et al., 2016; Jonckers et al., 2011; Kalthoff et al., 2013; Lu et al., 2012; Ma et al., 2016b).

To complement the ICA approach, we employed seed-based analyses. Using the somatosensory cortex as seed-ROI, during ongoing slow wave activity, we found a correlating cortex-wide BOLD activation (Figure 6A). Furthermore, the average signal in the somatosensory seed-ROI was strongly correlated with the normalized signal of the pan-cortical component previously revealed by the ICA (Figure 6B; Figure 6—source data 1). During persistent activity this pan-cortical activity was absent (Figure 6—figure supplement 1; Figure 6—source data 1), but bilateral somatosensory activity, potentially reflecting inter-hemispheric connectivity between the somatosensory cortices (Hodkinson et al., 2016) could be detected (Figure 6—figure supplement 1).

Figure 6 with 3 supplements see all
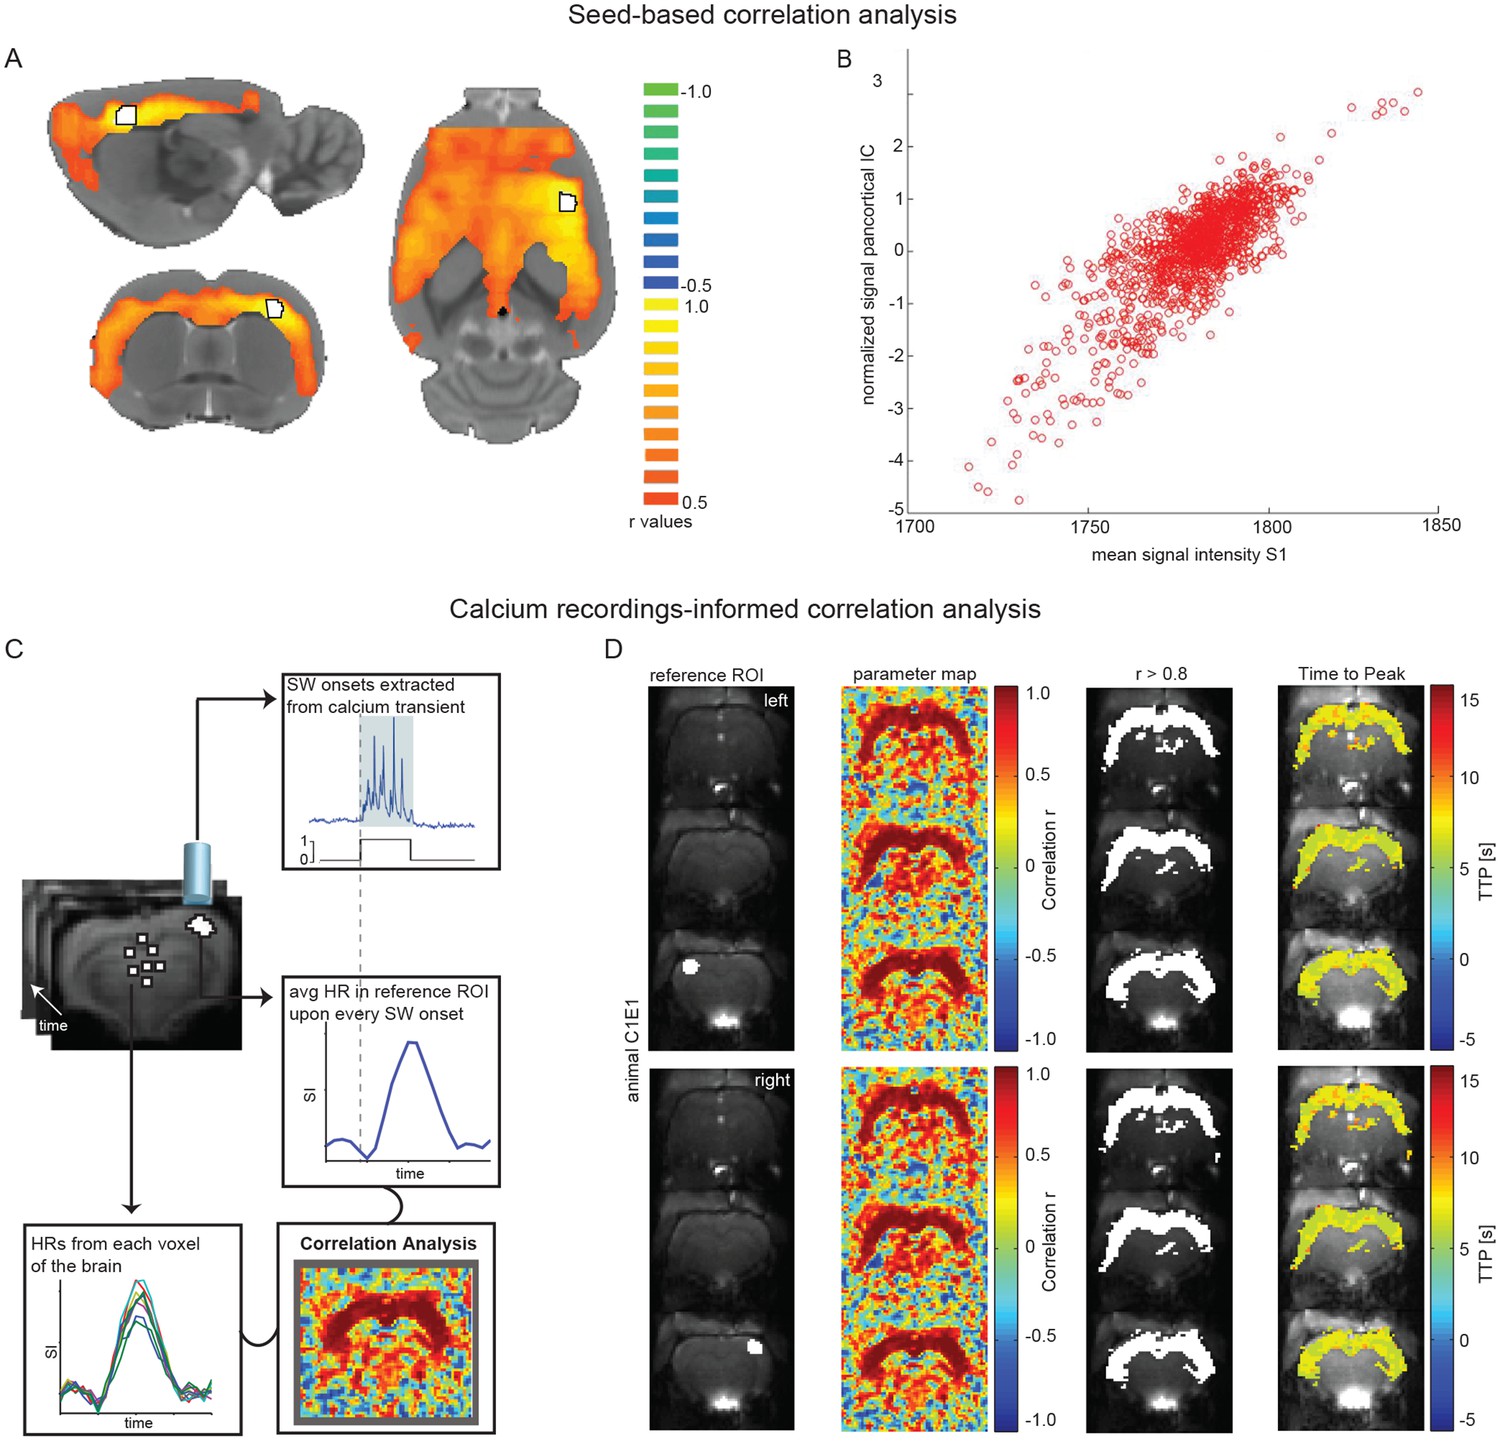
Seed-based and calcium recordings-informed correlation analyses reveal pan-cortical BOLD activation during slow wave activity.

(A) Signal correlation between primary somatosensory cortex ROI (S1; white with black outline) and the rest of the cortex in a representative animal during slow wave activity. (B) Correlation between the average signal in S1 and the pan-cortical independent component (IC) from this representative animal’s ICA (pearson correlation coefficient, r = 0.799, p<0.001). (C) Flow-chart of correlation analysis procedure employing slow wave onsets from calcium transients. (D) ROIs on both hemispheres (ipsi- and contralateral sites of the fiber recordings), parameter maps showing r-values and regions of highest correlation (r > 0.8; white). The mean HR was calculated from these thresholded regions and time to peak of voxel-by-voxel HR was determined.

https://doi.org/10.7554/eLife.27602.022
Figure 6—source data 1

Values for seed-based correlation between S1 and cortex during slow wave and persistent activity (n = 4 animals; table for data shown in Figure 6 and Figure 6—figure supplement 1).

Number of clusters (>300 voxel) differ significantly between conditions (two-sample t-test (6)=−2.5538, p=0.0433).

https://doi.org/10.7554/eLife.27602.026
Figure 6—source data 2

Values for seed-based correlation between hippocampal formation (hf) and cortex during slow wave and persistent activity (n = 4 animals; table for data shown in Figure 6—figure supplement 2).

Number of clusters (>300 voxel) differ significantly between conditions(two-sample t-test (6)= −3.6667, p=0.0105).

https://doi.org/10.7554/eLife.27602.027

As we occasionally observed hippocampal BOLD (Figure 3—figure supplement 1C; Figure 3—figure supplement 2A,B) we applied the same seed-based approach to the hippocampal formation. Again, only during ongoing slow wave activity we found pan-cortical BOLD activation related to the hippocampal seed-ROI and also found a correlation to the pan-cortical ICA component (Figure 6—figure supplement 2A–C, Figure 6—source data 2).

Finally, we conducted an optical calcium recordings-informed correlation analysis (Figure 6C). When HRs upon slow calcium wave onsets in a ROI in somatosensory cortex are correlated with every remaining voxel in the brain, again a cortex-wide network becomes apparent. Independent of the location of the somatosensory ROI (right or left hemisphere) this correlation analysis revealed highest r-values for the entire cortex. Additionally, correlation values reveal that slow wave related BOLD activity recruits almost all cortical areas with nearly synchronous time-to-peak values for HRs (Figure 6D; Figure 6—figure supplement 3).

Discussion

In summary, our results demonstrate that locally recorded calcium events related to slow wave activity show a global cortical fMRI BOLD correlate. The novelty of our approach consists in establishing a direct relation of neurophysiologically defined slow wave events to the macroscopic fMRI signal by detecting the precise time points of individual slow waves and probing their underlying hemodynamic responses by using event-related fMRI analysis.

Slow wave activity in the context of large-scale networks

Our results provide evidence for large-scale recruitment of cortical networks upon a specific type of neural activity – slow waves – which have previously been shown to be present under different types of anesthesia (Busche et al., 2015; Chauvette et al., 2011; Petersen et al., 2003; Sanchez-Vives et al., 2017; Sanchez-Vives and McCormick, 2000; Seamari et al., 2007; Stroh et al., 2013; Zucca et al., 2017), and in natural slow wave sleep (Massimini et al., 2004; Sanchez-Vives et al., 2017; Steriade et al., 1993a; Steriade et al., 1993b; Steriade et al., 1993c; 1993b; Steriade and Timofeev, 2003; Steriade et al., 2001). Although the main features appear similar to those of the SWS oscillation (Destexhe et al., 2007; Sanchez-Vives et al., 2017), under anesthesia, slow waves appear more rhythmic and more synchronous across the cortex and also show longer silence periods (Busche et al., 2015; Chauvette et al., 2011).

During natural sleep, spindle activity - which is related to memory consolidation - is grouped by slow waves (Mölle et al., 2002), but this is not the case for anesthesia induced slow waves (Murphy et al., 2011). Nevertheless sleep slow waves and anesthesia slow waves may recruit the same cortical and subcortical structures (Murphy et al., 2011). Although cortically generated (Steriade et al., 1993c; Timofeev et al., 2000) slow waves also engage the thalamus (Sheroziya and Timofeev, 2014; Steriade et al., 1993a; Stroh et al., 2013) and hippocampus (Busche et al., 2015; Ji and Wilson, 2007; Sirota et al., 2003), suggesting that slow wave associated excitation plays a synchronizing role in functional coupling of remote brain regions (Hahn et al., 2006). Indeed we occasionally observed hippocampal BOLD activation during slow waves and therefore conducted a seed-based analysis for an atlas-based hippocampal ROI, showing that voxel in the hippocampus correlate well with cortical voxel, again spanning the entire cortical surface during ongoing slow wave activity. This correlation of hippocampal activity to slow-wave related cortical BOLD (Chan et al., 2017) might provide a mechanism of coordination for reactivation and redistribution of hippocampus-dependent memories to neocortical sites (Buzsáki, 1996; Mitra et al., 2016). Although this is unlikely the case for anesthesia related slow waves (Murphy et al., 2011), they might recruit the same structures and thereby provide a spatiotemporal mechanism for such plasticity-relevant cortico-hippocampal functions (Logothetis et al., 2012).

Although the thalamus is being recruited during slow wave activity (Sheroziya and Timofeev, 2014; Stroh et al., 2013), we did not observe robust thalamic BOLD activity, despite of optically recorded thalamic slow calcium waves. This might be due to a lower density of neurons carrying the slow wave rhythm, reflecting the lower overall cell density in the thalamus in comparison to the cortex (Meyer et al., 2013) or due to reduced sensitivity of the MR surface coil in deeper brain areas.

Intracortically, slow waves can propagate as a travelling wave (Busche et al., 2015; Matsui et al., 2016; Stroh et al., 2013), likely by relays of local populations of cells (Destexhe et al., 2007). Depending on excitability state of the network, a slow wave event could either remain local (Nir et al., 2011; Vyazovskiy et al., 2011) or could spread ‘smoothly like an oil-spot’ (Massimini et al., 2004; Sanchez-Vives et al., 2017). The recruitment of sub-cortical regions is discussed to rather involve long-range excitatory projections (Leong et al., 2016).

Although slow wave activity is a multiscale phenomenon (Jercog et al., 2017; Sanchez-Vives et al., 2017), previous work has focused either on local and cellular (Chen et al., 2013b; Grienberger et al., 2012; Kerr et al., 2005; Sanchez-Vives and McCormick, 2000; Stroh et al., 2013) or on large-scale characteristics (Massimini et al., 2004) of slow waves. Here, we bridge these mentioned levels of observation by relating the mesoscopic representation of slow waves in a defined cortical or thalamic population - in a spatio-temporally precise manner - to the whole-brain hemodynamic BOLD signal.

Specific relation of the cortex-wide BOLD signature to slow wave activity

We contrast our findings obtained during slow wave activity to a network activity, maintained by light sedation, in which slow calcium wave events are absent. Indeed, the calcium recordings reveal distinct response properties of local sensory networks, matching earlier studies under the same condition (Schmid et al., 2016; Schulz et al., 2012).

Here, seed-based analysis and ICA revealed typical default mode and resting state networks as described previously (Hsu et al., 2016; Lu et al., 2012). Notably, we did not find any component resembling pan-cortical activation as identified for slow wave activity, speaking for a direct relation of slow waves to this BOLD pattern.

Furthermore, during slow wave activity, we could demonstrate that the ICA component showing pan-cortical activation is highly correlated to the GLM timecourse derived from optically detected calcium waves. Exclusively this pan-cortical component is related to higher power in the ultra-low frequency range. Such low frequency components were related to slow wave activity in spontaneous EEG/fMRI signal fluctuations in earlier studies and have been investigated in different species (Leopold et al., 2003; Schölvinck et al., 2010; Steriade and Amzica, 1998; Wang et al., 2012; Wen and Liu, 2016)) including humans (Achermann and Borbély, 1997; Boly et al., 2012; Dang-Vu et al., 2008; Hiltunen et al., 2014; Marshall et al., 2006; Massimini et al., 2004; Wen and Liu, 2016). Notably, if the timecourse derived from the slow wave vector is regressed out of the data, the ICA is devoid of any components showing pan-cortical activation.

Nonetheless, also during ongoing slow wave activity, we can identify components which likely resemble resting state networks, which seems reasonable, given that these networks are discussed to mirror basic functional connectivity.

Conventional model-based analysis for fMRI using the general linear model (GLM) solely identifies individual voxel significantly correlated with the chosen model timecourse. Data-driven, or model-free analysis as ICA, do not require a priori knowledge about activation patterns and furthermore consider interactions between voxel, as voxel are not considered individually. But it has to be noted that especially the ICA approach bears several significant drawbacks. For example this analysis can produce a large number of noise components. We used the minimum description length criterion (Li et al., 2007) to estimate the number of components, but also alternative techniques, as e.g. Bootstrap Stability Analysis (Majeed and Avison, 2014) are available. Still, this approach has to deal with the trade-off between extracting enough components to actually reveal all signals of interest and adding up spurious noise components. We used ICA to extract additional components which would be meaningful for our data, but were nevertheless able to identify the pan-cortical component of interest, as only this component showed high correlation to the timecourse revealed by the locally measured slow calcium wave signal. We furthermore used a seed-based approach to confirm our event-related GLM-based results.

Translational perspective of using slow wave activity as a regressor for BOLD fMRI

Ongoing changes in network activity can contribute to the variability of experimental results and may appear as noise if they are disregarded in the statistical modeling of neural signals (McGinley et al., 2015b). A direct readout of neurophysiological measures may also be beneficial to monitor and control for homogenous network activity states during BOLD measurements, as depth of anesthesia may vary depending on many physiological factors, as e.g. cortical temperature (Reig et al., 2010; Schwalm and Easton, 2016; Sheroziya and Timofeev, 2015). From this perspective it is of high importance to relate local network activity to the global BOLD response, especially regarding the potential translational value of such studies.

Including ongoing signals revealed by local neurophysiological readouts as an independent variable, i.e. covariate, regressor, or entirely new factor depending on the type of analysis, could explain a considerable amount of variance in neuronal responses, leading to more reliable readouts, especially in global measures as fMRI.

We investigated the functional recruitment of brain areas by slow waves based on the reasoning that, if there is a global participation of cortical areas in slow wave rhythmicity, the activity of the cellular population as a whole should produce a macroscopic signal detectable by functional neuroimaging (Doeller et al., 2010). This study illustrates the power of combining cellular measures of neural activity with fMRI in systems neuroscience.

Our study directly relates a neurophysiological event – the calcium slow wave – to its potentially present BOLD correlate by employing a specific type of fMRI analysis (event-related), a straightforward and easy-to-apply approach as it is an inbuilt type of analysis of many standard fMRI analysis toolboxes. Results acquired with this method are in agreement with model-free and seed-based analysis approaches revealing a similar extension of network activity spanning almost the entire neocortex, also during ongoing slow wave activity.

Our results provide a framework for further analysis of slow wave brain activity within fMRI experiments in anesthetized rodents or for EEG/fMRI studies at a translational level (Tagliazucchi et al., 2012), since spatio-temporal dynamics and behavioral correlates of slow waves in humans and animal models are highly preserved (Buzsáki et al., 2013). For example, there is growing evidence of impaired slow oscillations in models of Alzheimer disease (Busche et al., 2015; Menkes-Caspi et al., 2015) and resting-state functional connectivity in Alzheimer patients (Zhou et al., 2015). Such studies could refine slow wave activity as potential disease marker (Tagliazucchi and Laufs, 2014) or specifically target impaired slow oscillations and their potential restoration. Even though calcium measures provide advantages in terms of spatial specificity (Kajikawa and Schroeder, 2011) and lack signal distortions by the varying magnetic fields of the scanner in comparison to electric population recordings, our event-related approach could also be applied for combined EEG-fMRI measures feasible in human experiments.

Materials and methods

Animals

Experiments were performed on 36 adult female Fisher rats (>12 weeks old, 160–180 g), of which optic fiber implantation in the cortex was performed in five animals (C1-C5) and optic fiber implantations in the thalamus in three animals (T1, T2, T3). Dual optic fiber implantation had been performed in two animals (DF1, DF2). LFP recordings were carried out in three animals (LFP1-LFP3) and resting state data acquisition without optic fiber implantation in 10 animals (M1-M10). Immunohistochemistry was done in four animals (H1-H4) and quantifications (amplitude, duration, rise time and probability of induction) of calcium responses and for the two different indicators were performed respectively in 8 (Q1-Q8) and in 2 (C3 and Q9) animals. Animals were housed under a 12 hr light–dark cycle and provided with food and water ad libitum. Animal husbandry and experimental manipulation were carried out according to animal welfare guidelines of the Westfalian Wilhelms-University Münster and the Johannes Gutenberg-University Mainz and were approved by the Landesamt für Natur-, Verbraucher- und Umweltschutz Nordrhein-Westfalen, Recklinghausen, Germany, and the Landesuntersuchungsamt Rheinland-Pfalz, Koblenz, Germany, respectively.

Dye or virus injections and fiber placement

Request a detailed protocol

For surgical procedures including staining with fluorescent calcium indicator and optic fiber implantation, rats were anesthetized with isoflurane (maintenance 2–3%, Forene, Abbott, Wiesbaden, Germany), treated with subcutaneous injection of 1 mg/kg Metacam for analgesia, placed on a warming pad (37° C), and fixed in a stereotactic frame with ear and bite bars.

The skull was exposed, dried from blood and fluids, and leveled for precise stereotactic injections. Under a dissection microscope a small craniotomy was performed with a dental drill (Ultimate XL-F, NSK, Trier Germany, and VS1/4HP/005, Meisinger, Neuss, Germany). The fluorescent calcium sensitive dye Oregon Green 488 BAPTA-1 (OGB-1, Invitrogen, Life Technologies, Carlsbad, CA, USA) was prepared as described previously (Garaschuk et al., 2006), filtered, and injected into primary somatosensory cortex front limb area (S1FL; 0 mm AP,+3.5 mm ML, −0.5,–0.7 and 0.9 mm DV; n = 4 animals) or into the posterior thalamic nucleus (POm; three animals) at AP −3.3 mm, ML +1 mm, 12°, dorso-ventral 4.6, 4.9, 5.2 mm according to stereotactic coordinates (Paxinos and Watson, 2006). For co-staining of astrocytes, 10 mM of sulforhodamine 101 (SR101) was added to the OGB-1 solution in two animals (Nimmerjahn et al., 2004). Dye solution was delivered using a glass micropipette with an outer tip diameter of 45 µm and an inner diameter of 15 µm connected to a 10 mL syringe. Approximately 0.3 µL of the solution were slowly released at each depth by gentle manual pressure. After injection, the pipette was held in place for 2 min before slowly retracting it from the tissue. Alternatively, the genetically encoded calcium indicator GCaMP6f (UPenn Vector Core, PA, USA) was expressed via viral gene delivery four weeks prior to calcium/fMRI measurements. two animals received injections of approximately 1.0 µL AAV1.Syn.GCaMP6f.WPRE.SV40 in S1FL (0.0 mm AP, +3.0 mm ML, −1.2 mm DV) with an 35° injection angle. Two animals received approximately 1.0 µL AAV1.CamKII.GCamP6f.WPRE.SV40 at AP +0.2, ML +2.4, DV −1.6 with an 34° injection angle. A craniotomy (AP +0.2, ML +3.3) was performed on the day of the experiment. For the dual-fiber experiments a second craniotomy was performed at AP −1.8, ML +2.3 and approximately 0.3 µL OGB-1 was injected as described above.

After removing the cladding from the tip, an optic fiber was inserted perpendicular to the dura above the OGB-1 stained or GCaMP6f expressing region, typically at −300 µm (cortex) and

−4.4 mm (POm), respectively and fixed to the skull with UV glue (Polytec, PT GmbH, Waldbrunn, Germany). The amount of glue for holding the fiber in place was kept at a necessary minimum to reduce MR image distortions.

After experiments rats were transcardially perfused with 4% paraformaldehyde (PFA) under deep isoflurane anesthesia. Coronal sections with 1000 µm slice thickness of acute brain slices were prepared from OGB-1/SR101 animals. For GCaMP6f animals 20 µm microtome slices (Leica CM 1850, Leica microsystems) of brains fixed overnight in 4% PFA, 30% sucrose, and embedded in Tissue Tec (Sakura Finetec Europe, NL) were prepared. Precise location of OGB-1 injections and GCaMP6f expressions were validated under a fluorescence microscope.

Immunofluorescence

Request a detailed protocol

Coronal brain sections of 70 µm thickness of previously perfused animals were prepared using a vibratome (Leica, Wetzlar, Germany). For permeabilization/blocking, slices were incubated with 0.1% Triton X-100% and 5% normal donkey serum (Invitrogen, Life Technologies, Carlsbad, CA) in phosphate buffer solution for 90 min. Slices were incubated with rabbit anti-GAD 65/67 (1:200, Swant, Marly, Switzerland) or rabbit anti-CamKII (1:200, Epitomics, Burlingame, CA) at 4° C overnight. On the next day, slices were incubated with the secondary antibody Cy-3 donkey anti-rabbit (1:500, Jackson Immuno Research, West Grove, PA). Slices were mounted using antiquenching Vectashield (Vector Laboratories, Burlingame, CA), and confocal imaging was conducted using a Leica SP8 (Leica, Wetzlar, Germany) confocal microscope.

Optical recordings

Request a detailed protocol

A custom-built setup was used for optic-fiber based calcium recordings (Schmid et al., 2017; Schmid et al., 2016). The light for excitation of the calcium indicators was delivered by a 20 mW solid state laser (Sapphire, Coherent, Dieburg, Germany) with a wavelength of 488 nm. To control laser power, an acousto-optic modulator (AOM 3080–125, Crystal Technology, Palo Alto, CA) was used. After deflection by a dichroic mirror, the beam was focused by means of a collimator into one end of a multimode fiber (Thorlabs, Grünberg, Germany) with a diameter of 200 µm and a numerical aperture of 0.48. The emitted fluorescent light was guided back through the same fiber and focused on a photodetector containing an avalanche photodiode (LCSA500-01, Lasercomponents GmbH, Olching, Germany) with an aperture of 0.5 mm. The recorded fluorescence signals were digitized with a sampling frequency of 2 kHz using a multifunction I/O device (PCI 6259, National Instruments, Austin, TX) and custom-written LabVIEW-based software (LabVIEW, National Instruments). Calcium data preprocessing was performed with Igor analysis software (WaveMetrics, Portland, OR; RRID:SCR_000325). All traces represent relative changes in fluorescence intensity (∆f/f) and were low-pass filtered before subsequent event detection. Rise time, duration and amplitude of calcium transients were assessed and statistically compared in animals measured upon OGB-1 injections (n = 8 animals) as well as in GCaMP6f transduced rats (n = 2 animals). Rise time was defined as time between onset of the transients and 50% of maximum intensity peak. Duration of the transients was defined as the time between the first and the last intensity value exceeding 50% of maximum intensity peak. Amplitude was determined as the intensity difference (∆f) from the baseline and the highest intensity value of the transients. For details see Source Data files 1 and 2 linked to Figure 1. Data were tested for normal distribution using the Lilliefors test, an assumption-free adaptation of the one-sample Kolmogorov-Smirnov test. In cases where normal distribution could be assumed (p>0.05), the parametric two-tailed Student’s t-test was employed to compare means. Where normal distribution could not be verified, the non-parametric Wilcoxon rank-sum test for equal medians was used to test median differences. All quantifications are presented as mean ± SEM, unless stated otherwise. In cases of an unstable baseline or absence of characteristic signal dynamics of slow wave-associated calcium transients (Grienberger et al., 2012; Stroh et al., 2013) calcium data was excluded from analysis (n = 2 animals).

Calcium slow wave detection

Request a detailed protocol

Data was read into Matlab (The Mathworks, Inc., Natick, MA; RRID:SCR_001622) and downsampled from 2 kHz to 1 kHz by averaging two adjacent values. The baseline of the calcium signal was determined and corrected by using the Matlab function msbackadj estimating the baseline within multiple shifted windows of 2500 datapoints width, regressing varying baseline values to the window’s datapoints using a spline approximation, then adjusting the baseline in the peak range of the calcium signal. This method provides a correction for linear and low-frequency drifts while avoiding contributions of signal-of-interest events. We employed a procedure based on exponential moving average (EMA) filters, originally established to identify slow wave activity in electrophysiological recordings (Seamari et al., 2007). According to this algorithm, to detect slow waves, an EMA filter with a window of 25 ms was applied. Then, the datapoints of the filtered signal exceeding or falling below a threshold were used as preliminary transition points between slow calcium waves and silent periods.

To determine this threshold, amplitudes of all datapoints were sorted into a histogram. Onsets and durations for each threshold (in percent of maximum) were derived and the resulting numbers of active voxel of SPM-evaluations using these onsets and durations showed an inflection point at 70%, therefore the threshold was set to 70% for further evaluations (Figure 2—figure supplement 2).

Onsets of slow calcium waves were defined as signal timepoints exceeding the threshold (70%), termination of calcium slow waves was defined as signal timepoints dropping below 50% of the threshold value. As EMAs are optimized to detect onsets of events but provide less precision regarding event terminations, these were corrected with regard to the noise level. Further, the detected activity was post-processed in the following order: (1) calcium waves separated by a time-interval below 100 ms were interpreted as one wave; (2) calcium waves with a duration of less than 600 ms were discarded; (3) activity not reaching 90% of the histogram-based cumulative signal intensity was discarded.

Frequencies of calcium slow wave events were evaluated by separating the measurements into bins comprising of 100 s duration of measurement time. For each bin, the number of detected events was counted and the frequency of these events was recalculated in Hz.

Onset and duration time points of calcium slow waves were extracted and subsequently used for the fMRI analysis described below.

fMRI Data acquisition

Request a detailed protocol

fMRI data acquisition under isoflurane (1.2–1.8% in 80% air and 20% oxygen) was performed on a 9.4 T small animal imaging system with a 0.7 T/m gradient system (Biospec 94/20, Bruker Biospin GmbH, Ettlingen, Germany). The optic fiber-implanted animals were mounted on a heated MRI cradle. The skull was covered with a 1–2 mm thick layer of dental alginate (Weiton, Johannes Weithas dental-Kunststoffe, Lütjenburg, Germany) or 1% agar, to reduce susceptibility artifacts which may occur at the tissue air boundary. The fiber was guided through a lead-through in the RF surface head coil and local shimming was applied (shimming volume 0.6–2.2 cm³, first order Mapshim, Bruker). Anatomical images were acquired with a T2-weighted 2D RARE sequence, TR/TE 2000/12.7 ms, RARE factor 8, 256 matrix, 110 × 100 µm² spatial resolution and slice thickness 1.2 mm, 6–16 contiguous slices prior to fMRI scans to check for tissue damage and validate the fiber’s location. For BOLD fMRI measurements, T2*-weighted images were acquired with a single-shot gradient echo EPI sequence with TR = 1 s (1.5 s for animals M1-M10), TE = 18 ms (14 ms for animals M1-M10), and FA 65°, 350 × 325 µm² spatial resolution (320 × 290 µm² for animals M1-M10), slice thickness 1.2 mm (0.8 mm for animals M1-M10), 9–16 continuous slices (34 for animals M1-M10), 2400 (n = 3), 1800 (n = 5) or 1200 (n = 10) acquisitions resulted in a scan time of 40, 30 or 20 min, respectively.

Experiments were performed at least 1 hr after OGB-1 injection (Stosiek et al., 2003) under isoflurane anesthesia (1.1–1.8%) inducing slow wave activity (Grienberger et al., 2012; Stroh et al., 2013). Body temperature and respiration rate were routinely monitored during experiments.

fMRI data acquisition under medetomidine (n = 5) was performed under the same parameters as under isoflurane. For the recordings animals were anesthetized with 1.5% isoflurane and mounted in on a heated MRI cradle in the scanner. Anatomical images with the same parameters as the previous experiment were acquired. During the acquisition of the T2 images a bolus of 0.04 mg/kg of medetomidine was administrated to the animals. Five minutes later, isoflurane anesthesia was turned off and medetomidine 0.08 mg/kg/h was perfused until the end of the experiment.

fMRI analysis

GLM analysis

Request a detailed protocol

GLM fMRI data processing was performed using Matlab software environment and SPM12 (Functional Imaging Laboratory, Wellcome Trust Centre for Neuroimaging, UK London; RRID:SCR_007037). Preprocessing steps included realignment, reslicing and smoothing of the images, using asecond degree B-Spline interpolation method for realignment and a fourth degree B-Spline for reslicing. Serial autocorrelation was performed with an autoregressive AR(1) model during classical (ReML) parameter estimation, datasets were smoothed using a 0.5 mm FWHM Gaussian Kernel and highpass filtered with a cutoff frequency of 1/128 s. The initial five images were discarded to only include data for which signal had reached steady state.

To approximate the underlying timecourse of hemodynamic responses (HRs) in the raw data, the hemodynamic response function (HRF) was derived using in a different sub-set of animals a model-free approach based on a finite impulse response filter (Glover, 1999). The FIR set consists of a number of successive post-event time bins and effectively averages the BOLD response at each post-event time. Note that the statistical efficiency of this approach increases with decreasing and jittered onset intervals (Dale, 1999). To detect the HR upon slow calcium waves without making a priori assumptions about the shape of the HR, estimates were computed at 40 time points according to the TR with an interval of 1 s, ranging from 20 s prior to the start of an onset to 20 s after the start (Agam et al., 2014; Masterton et al., 2013). The actual response upon a slow calcium wave is considered as the resulting shape of the timecourse starting at 0 s up to 20 s (Figure 2E shows the derived timecourses 5 s prior onset to 20 s after onset).

The onsets and durations of spontaneous calcium waves were binarized to define an array of input functions: slow calcium wave events (‘1’) and silent periods (‘0’). These ‘slow wave vectors’ define a condition for an event-related SPM analysis (Friston et al., 1998) and were convolved with a basis set to yield regressors subsequently being correlated with the raw data (see below).

For the FIR basis function, window size was set to 40 s. According to TR = 1 s a total number of 40 bins was used, leading to 40 beta maps (Henson, 2001). Therefore, each beta map corresponded to 1 s within the timecourse, while the interval between beta maps was 1 s and the total timecourse was 40 s. F-tests including all 40 beta maps were calculated with a contrast threshold of p<0.05. Starting from the slice containing most active voxel in the resulting F-maps, we extracted the 10 voxel with highest activation and did so for the previous and the following slice to identify in total 30 voxel of highest F-value in three slices for the extraction of signal timecourses. Voxel in the sinus vein were manually masked to exclude them from the selection of activated voxel. All identified voxel were checked for localization. The HRs of the identified voxel were extracted using a custom-written Matlab script exporting the value of each voxel for each beta map. The resulting 30 HRs were averaged to derive the mean BOLD response upon a spontaneous slow calcium wave. For analysis of each animal, extracted timecourses of either 2 or 3 other animals were used to avoid circular analysis (Kriegeskorte et al., 2009), for this procedure HRs from animal C4 were not included because of minor signal loss due to susceptibility artefacts (Figure 3—figure supplement 2). The extracted HRs were averaged and used as regressors by manually convolving the extracted, averaged timecourses, considering data points from 0 s (onset) until 15 s when the timecourses reached baseline level, with the slow wave vectors (event arrays). A t-test was performed using a contrast threshold of p<0.05 (FWE) for the resulting activation maps. For an overview of the analysis work flow see Figure 2G.

To confirm that resulting activation maps were independent from the considered averaged extracted HR used as basis function, a cross-validation was performed. Therefore, the event array of the animal to be analyzed was convolved with the extracted HR from one animal and the procedure was reiterated convolving the event-train with the extracted HR of another animal. Statistical threshold was set to p=0.05 (FWE) and T-values are reported and compared.

To control for specificity of results, we exchanged calcium event arrays between animals and used onset and duration time points to create a regressor for analyzing corresponding fMRI data. In addition, to test results upon arrays containing the same number of events and the same distribution of event durations and inter-event intervals but with differential event timing, we mirrored the originally detected events for each experiment in time and used them likewise for the fMRI analysis.

For quantitative comparisons of regional activity (Figure 3E) mean images of the functional scans, F-maps, and 20 beta-maps were loaded into ImageJ and slices on the level of somatosensory (S1) and visual cortex (V1) were identified according to anatomical landmarks. Ipsi- and contralateral ROIs containing a constant number of 23 pixels were drawn for S1 and V1 respectively with respect to anatomical structures in all regions devoid of susceptibility artefacts. The mean F- and beta-values of all 20 beta-maps were calculated in these ROIs. F-values were tested for normal distribution (Lilliefors test) and subsequently compared for equality of the means by Student’s t-test. Beta values were averaged to receive an average HR of every cortex region. The two resulting HRs were compared using a Wilcoxon rank-sum test.

To compare the influences of the FIR-HRF model used for the analysis to the classical canonical HRF model, we reiterated the analysis using the classical SPM procedure with the standard canonical HRF which is modeled by two gamma functions. We compared T-values derived from the canonical HRF and the FIR-HRF in ipsi- and contralateral ROIs as described above. The mean values of these ROIs for each method in the corresponding T-maps were tested for normal distribution (Lilliefors test) and compared using a paired t-test or Wilcoxon rank-sum test. ROIs were drawn based on the mean functional images on S1FL, ipsi- and contralateral to the side of optic fiber recordings. The averaged HRs upon slow calcium waves were analyzed in terms of latency in respect to the preceding calcium wave, time-to-peak (TTP), normalized peak amplitude (ΔSA) and half-maximum-duration (HMD), for every voxel in all ROIs. For this purpose data were smoothed by a moving average filter (average of 5 time points, i.e. 5 s) and normalized according to the baseline signal defined as the mean signal intensity of 5 s preceding the calcium wave onset. Timecourses were averaged for each event and each voxel within the ROI. The resulting timecourse was fitted by a gamma variate-function (Yu et al., 2016), yielding a correlation coefficient of r2 = 0.96 ± 0.02 (n = 4 experiments). The onset of HRs was defined as fit parameter t0 and TTP, ΔSA and HMD were calculated.

For the calcium recordings-informed correlation analysis, baseline was corrected as described above, but with a window width of 100 s, and averaged HRs of selected ROIs were correlated with the signal over the entire timecourse from every voxel in the slice. For this purpose, HRs upon slow calcium waves as defined by the event array were averaged over selected ROIs and used as a reference for the HRs derived from the voxel-by-voxel analysis. To derive regions of highest correlations, voxel values with r > 0.8 were displayed, clusters of less than 70 contiguous voxel were removed and the resulting region was superimposed onto the mean functional data set. For every voxel of this region, a parameter map of TTP was derived from the voxel-by-voxel data as the duration between the slow wave onset and timepoint of maximum signal value.

Independent component analysis

Request a detailed protocol

For the independent component analysis the freely available software ‘Group ICA of fMRI Toolbox (GIFT)”, version 4.0b (http://mialab.mrn.org/software/gift/; RRID:SCR_001953) was used. Mask-calculation using the first image was employed and time-series were linearly detrended and converted to z-scores. For all other settings the following default parameters were used. For back-reconstruction, the ‘GICA’-algorithm (Calhoun et al., 2001) has been used and all results have been scaled by their z-scores. We used the Infomax-algorithm with regular stability analysis and no autofill was performed. The options for the Infomax-algorithm were as follows: Block: 119, Stop: 1e-006, Weight: 0, Lrate: 0.01082, MaxSteps: 512, Anneal: 0.9, Annealdeg: 60, Momentum: 0, Extended: 0. Images for the ICA were motion corrected and smoothed as described above for each animal. To be able to perform a group analysis, the functional data was co-registered to the anatomical data and the software DARTEL (Ashburner, 2007) was used to normalize the anatomical data as described (Kronfeld et al., 2015; Sawiak et al., 2013). The resulting DARTEL ‘flow fields’, which are containing the normalization parameters, were applied to the functional data to normalize all images to the same space consisting of a 96 × 54 × 58 voxel matrix with 0.3 mm3 isovoxel resolution. BOLD activation patterns revealed by ICs are shown on 21 of the 96 resulting reconstructed coronal slices with a slice distance of 0.6 mm.

For the group-level-ICA (n = 4) the mean minimum description-length (MDL)-criterion (Li et al., 2007) was used which revealed 37 ICs to be calculated. For group ICA standard PCA was performed with two data-reduction/pre-whitening steps: the number of principal components (PC) is first calculated from all data defined as 1.5 times the number of ICs, resulting in 56 PCs for the pre-whitening step. In the second step the concatenated datasets of all subjects is reduced to the number of extracted ICs (37). Results were inspected visually and ICs that showed only activity outside of the brain were discarded. The remaining 23 ICs were displayed (group analysis, 23 mean ICs of n = 4 animals, and on single subjects basis underlying the group analysis), sorted by the mean power of their frequency spectrum derived from a Fast Fourier transform (FFT) of their timecourses, in the range up to 0.1 Hz.

For ICAs performed on single subject basis (n = 15; animals C1-C5, T1 and T2, M1-M6, M8 and M9) the number of ICs to calculate for each animal was set to 20 for assuring the same number of components for each animal and representing a similar number of ICs as identified in the group analysis as detailled above. For single-subject ICA only one data-reduction-/pre-whitening-step is performed with the number of PCs equaling the number of ICs. Spatial allocation of ICs was inspected visually. The ICs timecourses were related to the regressors used in the SPM evaluation by cross-correlation analysis. FFTs were calculated for IC timecourses to derive their power spectra.

For regressing out the calcium slow wave vector from the BOLD timecourse, we used the resting state fMRI Data Analysis Toolkit (Song et al., 2011). The function ‘rest_RegressOutCovariates’ was used to eliminate the signal part of the SPM-regressors from the BOLD-signal in every voxel over time. A single-subject ICA as described above was performed prior and after this procedure.

Seed-based analysis

Request a detailed protocol

To perform seed-based analysis, fMRI data was preprocessed as previously described for the GLM analysis. The somatosensory ROIs were defined on subject-by-subject basis, based on active voxel upon a forepaw stimulation localizer. The mean signal in these functionally defined ROIs was then subsequently extracted in the resting conditions. For the hippocampal formation each subject’s functional data was manually aligned to a template obtained from Valdés-Hernández et al. (Valdés-Hernández et al., 2011) using Brain Voyager QX (vs. 2.8.4, Brain innovation, Maastricht, The Netherlands). According to the resulting atlas for each animal, the mean signal of the hippocampal ROI was extracted.

These mean signals were correlated with the signal of each cortical voxel. To perform this correlation, we used a cortical mask based on the previously employed atlas template (Valdés-Hernández et al., 2011). Voxel and cluster were then quantified from the correlation maps obtained from this step. Significance threshold for r-values was set to 0.5. Finally, for the slow wave fMRI data, we correlated the mean signal of the ROIs for each subject with the timecourse of the pan-cortical component obtained from the previously calculated ICAs.

Electrophysiological recordings

Request a detailed protocol

In a series of control experiments (n = 3) simultaneous local field potential (LFP) recordings and calcium measurements (as described above) were performed outside the MR scanner. A pipette with a tip resistance of 0.2 MΩ filled with Phosphate Buffered Saline (Sigma, Munich, Germany) was inserted through a second craniotomy at a depth of 300 µm, lateral to the optic fiber insertion site. A reference electrode was inserted into the cerebellum, 1 mm posterior from Lambda and signals were amplified using an extracellular amplifier (EXT-02F/2, npi Electronics, Tamm, Germany). Signals were filtered at 300 Hz (low pass), digitized at 2 kHz and recorded together with the optical signals using LabView (RRID:SCR_014325).

References

    1. Achermann P
    2. Borbély AA
    (1997)
    Low-frequency (< 1 Hz) oscillations in the human sleep electroencephalogram
    Neuroscience 81:213–222.
  1. Book
    1. Huettel SA
    2. Song AW
    3. McCarthy G
    (2009)
    Functional Magnetic Resonance Imaging (2nd ed)
    Sunderland, Mass: Sinauer Associates.
    1. Mölle M
    2. Marshall L
    3. Gais S
    4. Born J
    (2002)
    Grouping of spindle activity during slow oscillations in human non-rapid eye movement sleep
    The Journal of Neuroscience : The Official Journal of the Society for Neuroscience 22:10941–10947.
  2. Book
    1. Paxinos G
    2. Watson C
    (2006)
    The Rat Brain in Stereotaxic Coordinates: Hard Cover Edition
    Elsevier Science.
    1. Petersen CC
    2. Grinvald A
    3. Sakmann B
    (2003)
    Spatiotemporal dynamics of sensory responses in layer 2/3 of rat barrel cortex measured in vivo by voltage-sensitive dye imaging combined with whole-cell voltage recordings and neuron reconstructions
    The Journal of Neuroscience : The Official Journal of the Society for Neuroscience 23:1298–1309.
    1. Sanchez-Vives MV
    2. Mattia M
    (2014)
    Slow wave activity as the default mode of the cerebral cortex
    Archives Italiennes De Biologie 152:147–155.
    1. Schmid F
    2. Wachsmuth L
    3. Schwalm M
    4. Prouvot PH
    5. Jubal ER
    6. Fois C
    7. Pramanik G
    8. Zimmer C
    9. Faber C
    10. Stroh A
    (2016) Assessing sensory versus optogenetic network activation by combining (o)fMRI with optical Ca2+ recordings
    Journal of cerebral blood flow and metabolism : official journal of the International Society of Cerebral Blood Flow and Metabolism 36:1885–1900.
    https://doi.org/10.1177/0271678X15619428
    1. Steriade M
    2. Contreras D
    3. Curró Dossi R
    4. Nuñez A
    (1993a)
    The slow (< 1 Hz) oscillation in reticular thalamic and thalamocortical neurons: scenario of sleep rhythm generation in interacting thalamic and neocortical networks
    Journal of Neuroscience 13:3284–3299.
    1. Steriade M
    2. Nuñez A
    3. Amzica F
    (1993c)
    Intracellular analysis of relations between the slow (< 1 Hz) neocortical oscillation and other sleep rhythms of the electroencephalogram
    Journal of Neuroscience 13:3266–3283.
    1. Steriade M
    2. Nuñez A
    3. Amzica F
    (1993d)
    A novel slow (< 1 Hz) oscillation of neocortical neurons in vivo: depolarizing and hyperpolarizing components
    Journal of Neuroscience 13:3252–3265.
    1. Steriade M
    2. Timofeev I
    3. Grenier F
    (2001)
    Natural waking and sleep states: a view from inside neocortical neurons
    Journal of Neurophysiology 85:1969–1985.

Decision letter

  1. Jan-Marino Ramirez
    Reviewing Editor; Seattle Children's Research Institute and University of Washington, United States

In the interests of transparency, eLife includes the editorial decision letter and accompanying author responses. A lightly edited version of the letter sent to the authors after peer review is shown, indicating the most substantive concerns; minor comments are not usually included.

[Editors’ note: a previous version of this study was rejected after peer review, but the authors submitted for reconsideration. The first decision letter after peer review is shown below.]

Thank you for submitting your work entitled "Locally recorded slow calcium waves are associated with cortex–wide BOLD fMRI activity" for consideration by eLife. Your article has been reviewed by four peer reviewers, one of whom, Jan–Marino Ramirez is a member of our Board of Reviewing Editors and the evaluation has been overseen a Senior Editor. The following individual involved in review of your submission has agreed to reveal their identity: Sylvain Crochet (Reviewer #3).

Our decision has been reached after consultation between the reviewers. Based on these discussions and the individual reviews below, we regret to inform you that your work will not be considered further for publication in eLife.

As you can see from the critiques the reviewers saw the technical advances of your study, but were concerned by the biological significance. It is indeed very important that you demonstrated that the waves extend globally, and that you can link the calcium imaging with the fMRI signal. However, the use of anesthesia is a major caveat. The use of anesthetics may explain the global spread, which might be different from natural SWS. While we understand that the lack of thalamic involvement may be merely a technical issue, one reviewer felt that this could also be due to the anesthesia. We hope you can address these comments in a new manuscript that carefully discusses these caveats, emphasizes the technical advances and the importance of the biological significance of your finding.

Also, please carefully explain the lack of thalamic activity, the rationale for using these particular anesthetics and the caveats associated with this.

Reviewer #1:

Default state functional MRI has become an increasingly important tool to explore various neurological and psychiatric conditions. This approach, which was pioneered by Dr. Marcus Raichle, can be used to characterize addiction, demonstrate developmental changes in cortical connectivity between different brain regions and identify developmental delays. The importance of this approach is documented by an increasing number of publications in high profile Journals. A major limitation of this approach is that the relationship between the BOLD signal and neuronal activity is complicated and there are those that believe this signal reflects primarily hemodynamic changes rather then actual changes in neuronal activities. One of the main technical limitations is that the use of MRI technology is difficult to combine with conventional electrophysiological techniques, because the magnetic fields are disturbed by the metallic nature of wires. The major strength of this study is the use of optical techniques that allows the combined characterization of neuronal signals and the wide-range Bold signal using fMRI approaches. The present study has also another strength in that it characterizes these activities in "small" animals. This has the major advantage that wide range optical signals can be characterized.

This study is clearly of great interest for a general readership: the demonstration that locally recorded calcium waves correlate with BOLD signals spanning distant cortical states is important since understanding the neuronal basis of cortical states is critical for understanding sensory processing, the generation of sleep and wake states and the role of memory consolidation, just to name a few examples. The study can relate slow wave onsets to fMRI fluctuations, which has not been possible before. These slow waves have been well characterized by other neurophysiological studies, which closes the loop between a well-characterized neuronal activity and the macroscopic fMRI signal. The study therefore strongly suggests that the cortex-wide BOLD signal is a property of slow-wave neuronal activity. The study seems to be well powered and carefully conducted. The introduction and discussion is very interesting to read and relates the finding in this rodent model to various general neurobiological phenomena. Thus, I don't have major concerns.

Reviewer #2:

These authors combined fMRI with a fiber optic–mediated calcium recording method to study the slow calcium waves in the rodent brain. It is an excellent combination of techniques to study brain function at multiple scales. The main effort of this work is to decipher the potential linkage of slow calcium waves with the resting state fMRI signal of the anesthetized rodent brain, which is an important and novel direction for small animal fMRI studies. Besides the technical advancement, more discussion could be provided to better clarify the biological significance and image processing strategy. The reviewer has a few concerns needed to be clarified by the authors:

1) The calcium signal was recorded in rats anesthetized with isoflurane. The trace of local field potential (Figure 1M) mimics the burst suppression events. It will be better to discuss the states of the anesthetized animals of this work in comparison to the literature using similar drugs (or other anesthetics) to study slow wave activity.

2) The procedure to estimate hemodynamic response function (HRF) should be carefully described. One puzzling issue is the time course of the HRF, which showed very fast onset time in comparison to the existing models (Figure 2E, F). The authors stated "Time course of averaged HRs exhibited a sharp rise 0.7 s {plus minus} 0.4 s after the onset of a slow calcium wave." What does the "sharp rise" mean (equal to onset time?). If it is the case, please discuss the early onset of the estimated HRF by referring to the existing literature on this matter. If the authors presented the time courses of simultaneously acquired calcium and fMRI signal, would they have observed any phase shift? It will be better to provide a cross correlation curve to specify the temporal features of the two kinds of signals.

3) One of the key conclusions of this work is that the functional significance of the "slow calcium waves" specifies global correlation of the whole cortex. The authors suggested that the slow calcium waves were related to the slow wave activity as discussed by the authors. It will be better to explain the underlying rationale that no subcortical regions detected in the correlation maps.

Reviewer #3:

In this manuscript Schwalm et al., have developed an innovative approach to study global patterns of activation brain–wide in relation to local slow–wave activity, combining local calcium imaging and fMRI in anesthetized rats. Using different analytical approaches, the authors show that cortical slow–waves detected locally with calcium imaging, are correlated to a global, cortex–wide activation detected with BOLD fMRI. This is an elegant and well-conducted study and I have little concern about the methodology – but I must say that I have little expertise in fMRI.

My main issue with this study concerns the limitation of the interpretation of the results that need to be addressed in the discussion. Indeed, the authors make a strong statement about highly coherent slow–waves activity across the entire cortex based on their results obtained in deeply anesthetized rats. Anesthesia is not SWS. Although anesthetics have been used extensively to characterize slow–wave activity and determine its cellular mechanisms – because of the apparent similarity of the brain activity under some anesthetics and natural SWS – many studies also point directly or indirectly to critical differences between anesthetized states and natural SWS:

1) Down– or Silent–states are shorter during SWS compared to anesthesia and last rarely longer than 1s (Steriade et al., 2001; Timofeev et al., 2001; Mahon et al., 2006; Chauvette et al., 2011). In this paper, the authors report patterns of activity with very long Silent–states (~ 5 s or more) between consecutive slow–waves, which indicates very deep levels of anesthesia. Although it is easy to understand the rational for maintaining such depressed cortical activity to provide enough temporal separation of single slow–wave events in this study, the relevance of the data acquire in such anesthetized state to natural SWS is questionable.

2) While under anesthesia slow–wave activity is highly synchronized across cortical areas, the long–range cortico–cortical coherence during natural SWS is much lower (Chauvette et al., 2011; Busche et al.,), probably due to the fact that slow–waves often occur very locally (Nir et al., 2011). As a result, many studies point to a decreased long–range functional connectivity during SWS compared to wakefulness (Olcese et al., 2016; Tagliazucchi et al., 2013). Therefore, the conclusion that slow–waves are highly coherent across cortex might only be true under anesthesia.

3) SWS seems to promote, or even to be critical, for memory formation, whereas, to the best of my knowledge, anesthesia has a rather negative impact on memory formation.

The authors should address these points in their discussion and moderate their conclusions.

Reviewer #4:

What is the question asked by the manuscript? What is the answer provided? The manuscript appears as an elegant exercise to correlate slow brain activity with BOLD signal, I can't evaluate whether this is new. It doesn't seem new based on the references. There is nothing new in terms of biological data, the widespread and synchronized nature of slow oscillations is well known since the original description of the slow oscillation by Steriade et al., (1993). In those papers, also the synchrony with thalamus was established and then confirmed repeatedly, it is surprising that the thalamus shows no signal, slow oscillation in synchrony with cortex have also been shown in basal ganglia, why is there no signal in basal ganglia?

Why are these called calcium waves? Does it make reference to propagation? Or are these just increments in calcium signal with weak periodicity? Please clarify and be consistent throughout text.

I don't understand the statement in the subsection “Cortical slow wave–associated population activity can be reliably detected by optic calcium recordings during fMRI scans”, or what its significance is. ("This local confinement allows for a clear attribution of slow wave activity to a spatially restricted region") Also, the statement about the LFP is incorrect, if the LFP is recorded in bipolar configuration it is as confined or more than the calcium signal. Only in monopolar configuration (with a reference elsewhere in muscle or bone) the statement of volume conduction is true. In the original description of the slow oscillations by Steriade et al., (1993), the recordings are bipolar between the surface and depth of a cortical column and the intracellular recordings were obtained from the immediate vicinity of the LFP. By doing cross correlation between recording sites from spatially confined regions at different distances is how global synchrony was demonstrated, such demonstration would have been impossible with monopolar LFPs which are contaminated by volume conduction.

Furthermore, the paper by Katzner et al., 2009 [cited?] reaches the opposite conclusion than Kajikawa and Schroeder (Cited in the manuscript) and states that the LFPs represent mostly local activity within 450 microns. The paper by Linden 2011, reaches yet another conclusion: that the area of tissue represented by the LFP depends on the degree of correlation of the underlying networks. Thus, the authors do a poor job here and this part of the manuscript should be rewritten.

The HR peak at 6.5 s contains at least 5 calcium waves, how is the HR related to an individual calcium wave? Calcium waves occur rhythmically and continuously, how is the effect of subsequent calcium waves eliminated from HR? What does the decay signal of HR represent? How can the HR signal decay many seconds after the calcium wave? Please explain.

The HR suggests that the entire brain is having increases and decreases of oxy/deoxy Hb, which are more than an order of magnitude longer than the underlying oscillations. How is this possible? What is driving the HR?

The finding that BOLD signal in the entire cortex is not new and confirms the early findings of Steriade et al., 1993. In the subsection “Calcium slow wave event–related analysis reveals cor tex–wide BOLD correlate”, the authors indicate that the data "suggest" but in reality the data "agrees" with previous descriptions.

Subsection “Calcium slow wave event–related analysis reveals cortex–wide BOLD correlate”: functional assemblies under isoflurane anesthesia? That sounds absurd. Widespread slow activity is the exact opposite of functional assemblies. The brain is anesthetized. Unless the authors refer to a functional state related with deep sleep? What would it be?

This manuscript should not be published or considered further without clear answers and clarifications to the above questions.

[Editors’ note: what now follows is the decision letter after the authors submitted for further consideration.]

Thank you for submitting your work entitled "Cortex–wide BOLD fMRI activity reflects locally–recorded slow oscillation–associated calcium waves" for consideration by eLife. Your article has been reviewed by three peer reviewers, one of whom, Jan–Marino Ramirez is a member of our Board of Reviewing Editors and the evaluation has been overseen a Senior Editor. The following individuals involved in review of your submission have agreed to reveal their identity: Sylvain Crochet (Reviewer #2).

Our decision has been reached after consultation between the reviewers. Based on these discussions and the individual reviews below, we regret to inform you that your work will not be considered further for publication in eLife.

This study is very innovative with the use of cutting–edge calcium imaging techniques and the combination with fMRI. This combination can potentially provide critical insights into the relationship between neuronal activity and the BOLD signal used for fMRI studies. Thus, the study is very timely, as the use of fMRI approaches is becoming an increasingly important tool in translational neuroscience. While the reviewers acknowledged the improvement following the careful revision of the manuscript and the addition of the de–synchronized state, they also raised several important methodological and conceptual concerns. As you can read from the reviews, a major issue was the design and analysis of the fMRI study, which limits the interpretation of your data. In addition, one reviewer was still concerned with regards to the use of anaesthesia as a method to characterize a natural brainstate.

Reviewer #1:

The authors have done a great job in revising the manuscript. They added the characterisation of a desynchronised state, and they showed slow oscillations in the thalamus, which was a major concern in the previous submission. The authors use light anaesthesia, which was a confounding issue in the first submission, but the first submission did not show the desynchronised state, which differs fundamentally from the more synchronised state that has similar characteristics of SWS.

The comparison with the BOLD signal is interesting and will contribute to our understanding of what neuronal activity actually underlies this signal.

Reviewer #2:

In this manuscript Schwalm et al., use an innovative approach to study global patterns of activation brain–wide in relation to "local" slow–wave activity, combining local calcium imaging and fMRI in anesthetized rats. Using different analytical approaches, the authors show that cortical slow–waves detected locally with calcium imaging, are correlated to a global, cortex–wide activation detected with BOLD fMRI.

In this revised version, the authors also compare the pattern of activation during slow–wave activity in deep anesthesia to a more desynchronized brain activity under sedation. They find that the cortex wide activation during slow–waves contrast with the more restricted activation during sedation similar to the default mode network. The authors also studied the BOLD correlate of thalamic slow–waves, finding again a cortex–wide activation but no thalamic activation. The authors argue that the absence of thalamic activation during slow–waves could result from technical limitation.

Although this revised version provides new and interesting data, the authors have not address my main concerns and I keep thinking that the relevance of this study is considerably limited by the use of deep level of anesthesia and technical limitation – in particular the very poor temporal resolution of fMRI. Hence, my comments for this revised version are very similar to my initial comments.

However, I suppose this study might be of interest for the field of fMRI.

Please refer to my previous comments (then as Reviewer #3), appended here for reference:

My main issue with this study concerns the limitation of the interpretation of the results that need to be addressed in the discussion. Indeed, the authors make a strong statement about highly coherent slow–waves activity across the entire cortex based on their results obtained in deeply anesthetized rats and with poor temporal resolution. Anesthesia is not SWS. Although anesthetics have been used extensively to characterize slow–wave activity and determine its cellular mechanisms – because of the apparent similarity of the brain activity under some anesthetics and natural SWS – many studies also point directly or indirectly to critical differences between anesthetized states and natural SWS:

1) Down– or Silent–states are shorter during SWS compared to anesthesia and last rarely longer than 1s (Steriade et al., 2001; Timofeev et al., 2001; Mahon et al., 2006; Chauvette et al., 2011). In this paper, the authors report patterns of activity with very long Silent–states (~ 5 s or more) between consecutive slow–waves, which indicates very deep levels of anesthesia. Although it is easy to understand the rational for maintaining such depressed cortical activity to provide enough temporal separation of single slow–wave events in this study, the relevance of the data acquire in such anesthetized state to natural SWS is questionable.

2) While under anesthesia slow–wave activity is highly synchronized across cortical areas, the long–range cortico–cortical coherence during natural SWS is much lower (Chauvette et al., 2011; Busche et al., 2015, Fernandez et al., 2016), probably due to the fact that slow–waves often occur very locally (Nir et al., 2011). As a result, many studies point to a decreased long–range functional connectivity during SWS compared to wakefulness (Olcese et al., 2016; Tagliazucchi et al., 2013). Again, many studies point to slow–wave events being rather local than global during natural slow–wave sleep. Therefore, the conclusion a cortex–wide activation during slow–waves events might only be true under anesthesia.

3) SWS seems to promote, or even to be critical, for memory formation, whereas, to the best of my knowledge, anesthesia has a rather negative impact on memory formation. In order to synchronize cortical activities across areas and efficiently drive plasticity, the precise timing – at milliseconds scale – of slow–waves is critical (Miyamoto et al.et al., 2016). Such time precision cannot be achieved with fMRI.

The authors should really address these points in their discussion and moderate their conclusions.

Reviewer #3:

Essentially, it seems to me the authors are trying to prove that there is cortex–wide BOLD activation in the rat brain that is driven by (or at least correlates to) activation in calcium slow–wave response by means of demonstrating that one can convolve calcium slow wave tracings with a FIR basis set and fit this to the BOLD data. However, FIR basis sets are complex alternatives to standard models of the HRF and while they allow a large amount of flexibility this comes at the price of bias–variance tradeoff, and they should be used within rigorous multivariate models. Generally, FIR basis sets are used in studies aiming at characterizing the shape of the HRF, and not for studies aiming to detect activations. This study aims at detecting activation. As well, there are a very small number of subjects, and many substantial questions in the methods used to process the BOLD, ranging from sequence used to pre–processing to use of ICA. It is not clear to me what the authors have actually "detected" in the BOLD – it may just be motion, or other artifact.

Specific Methods Concerns

I have substantial concerns with the methods described to acquire, pre–process and analyze the resting–state fMRI data. These include but are not limited to:

1) Sequence: a very short TR of 1 sec was used. This is unconventional and has disadvantages in the acquisition of resting–state (in rodents, or humans). Generally, a TR of at 2–3 secs is preferred.

2) Pre–processing pipeline: this is (thinly) described as being realignment, reslicing and smoothing. This raises the following concerns:

a) Coregistration and normalization do not appear to have been performed prior to smoothing. Realignment only performs within–subject motion correction. It does not perform between–subject motion correction. The authors describe a process (subsection “fMRI analysis”) where they take heavily processed maps and manually align them with anatomical images (presumably for purposes resembling coregistration) using ImageJ. This is of concern because (a) coregistration should be performed earlier in the pipeline, prior to smoothing (b) They are performing a manual process and not using an appropriate normalization algorithm and (c) Using a piece of software intended for the processing of visual (not neuroimaging) images. The authors should re–perform their pre–processing pipeline to incorporate coregistration and normalization prior to smoothing. Excellent choices are readily available in SPM12, which they are using.

b) Smoothing has the effect of boosting SNR. It is generally used in pipelines where masses of voxels are being considered in larger numbers of subjects. Here, a small number of voxels is being considered in a small number of subjects. How do we know the resulting 'signal' is not artificially boosted by the smoothing process?

c) The lack of normalization and use of manual methods in ImageJ introduces many concerns regarding anatomic standardization among the various parts of this complex pipeline. It is not clear to this reviewer how integrity is maintained in comparing one location vs another between processes and animals. For example, the sites of optical fiber recordings, ROI, etc. – why have conventional methods not been used to place all locations in MNI space?

d) Serial autocorrelation: The authors do not describe how they managed the risk of serial autocorrelation, even though they use small voxel clusters and a cluster–based method. This is essential to avoid false positives.

e) Other conventional steps are not described e.g. filtering.

3) Group ICA.

a) It is not acceptable to note that GIFT was used "with its pre–defined settings". GIFT is a large software platform that does not have "pre–defined settings". It has many choices available to the researcher in terms of algorithms, number of PCs, ICs. At a very granular level there are default settings, but this is after other choices have been made (e.g. one could use the default settings for the Infomax algorithm). The authors must describe in much more detail how they conducted the group ICA, especially given the small number of subjects.

b) Use of MDL to estimate the number of components seems unusual and unnecessary in this analysis. Did the authors perform a parameter sweep to think through their criteria for number of ICs given the study objectives?

c) Is a group ICA being performed or single subject? This is not clear – it appears single subject results are presented in figures.

d) ICA produces a substantial number of noise components such as the signals from CSF, vascular sources and pulsations, motion and so on. The authors do not describe how they removed the noise components and how many ICs remained (and what they were). This leaves the reviewer to wonder if the "cortex–wide" component they identify as corresponding to the calcium slow–wave signal is, in fact, one of these noise components. There are a number of figures where the activation maps resemble the output of ICA that corresponds to motion artifact.

e) The authors do not comment what ICs they have found – how many? What networks? Are the results expected for the rat brain? There are many excellent papers on brain networks derived from ICA in rodents they can compare results to.

[Editors’ note: following the rejection, the authors appealed. The appeal was assessed by the editors, and revisions were requested prior to acceptance.]

Thank you for submitting your article "Cortex–wide BOLD fMRI activity reflects locally–recorded slow oscillation–associated calcium waves" for consideration by eLife. Your article has been reviewed by four peer reviewers, one of whom is a member of our Board of Reviewing Editors and the evaluation has been overseen by Sabine Kastner as the Senior Editor. The following individual involved in review of your submission has agreed to reveal his identity: Sylvain Crochet (Reviewer #2).

The reviewers have discussed the reviews with one another and the Reviewing Editor has drafted this decision to help you prepare a revised submission.

Summary:

The manuscript by Schwalm et al., investigates a macroscopic signal equivalent of spontaneous slow wave events in the brain. This study has two major strengths: i.e. modeling calcium waves using a design borrowed from task fMRI (but applied to resting–state data), and an attempt to correlate a component identified using the data–driven technique of ICA with the "contrast" obtained from the former model, in the same data set. The approach of simultaneously recording calcium activity in the cortex and acquiring whole–brain functional MRI (fMRI) in–vivo is considered elegant, and the examination of the relationship between a defined neurophysiological event and resting–state fMRI (rsfMRI) signals is highly relevant and of great interest. As such, this work is timely.

However, the manuscript will require further analyses of the current data and all reviewers felt that the manuscript would benefit from scaling back on some of the claims and from discussing several missing references that are presently omitted. Specifically, it seems that some of the claims on the characteristics of the two brain states distract from the main strength of the paper – i.e. establishing a relationship between the calcium waves and the BOLD signal.

Essential revisions:

1) The authors postulate that resting–state fMRI (rsfMRI) networks are broadly synchronized networks upon the presence of global slow waves. To study the contributions of global slow waves to rsfMRI, the authors used isoflurane anesthesia (1.1–1.8%) to induce and maintain slow wave activity. However, the rsfMRI network in "slow–wave state" (Figure 4—figure supplement 4A) is not a typical network observed in previous studies, while the "active desynchronized state" induced by medetomidine is consistent with previously reported rodent rsfMRI studies. It would be important to show typical rsfMRI networks, such as interhemispheric/bilateral somatosensory, visual and auditory networks (1–3) for both experimental conditions. Using ICA analysis, which the authors have already done, to identify such typical rsfMRI networks will be sufficient to address this concern.

2) The isoflurane anesthesia used in this study was higher than previous rodent rsfMRI studies. In addition, Liu et al. showed that the interhemispheric somatosensory network gradually merged from a spatially specific network under light anesthesia (1.0% isoflurane) into a highly synchronized and spatially less specific network under deep anesthesia (1.8% isoflurane) (4). The reviewers appreciate the technical difficulty of this experiment and do not suggest additional experiments. However, given that the range of isoflurane levels as stated is very large, categorizing the individual animals based on their approximate experimental anesthesia levels would be very informative and should be added as a table, perhaps in the Supplement. Additionally, the authors should comment on how the different levels of anesthesia affected the network activity and how this was handled in interpreting their data.

3) The authors concluded that slow waves provide a temporal framework for long–range coherence. However, previous studies have also shown that long–range coherence exists under active desynchronized state (e.g., under medetomidine sedation). In fact, the authors identified default mode network (DMN) activity under this state. One could argue that DMN also demonstrates the characteristics of long–range coherence in the brain. We urge that the authors clarify in the text what they mean by long–range coherence (i.e., through slow wave) in the present manuscript, and they should also specifically discuss the difference(s) to other long–range networks that are also identified under active desynchronized state.

4) A recent paper by Ma et al. also examined the relationship between neuronal events detected through calcium recordings and resting–state hemodynamic signals through optical methods (5). They found clear evidence for the contribution of excitatory neural activity underlying resting–state hemodynamic patterns in the awake and anesthetized brain (i.e., interhemispheric/bilateral functional connectivity). Additionally, earlier work by Matsui et al., also utilizing simultaneous monitoring of neuronal calcium signals and resting–state hemodynamic signals identified two types of large–scale spontaneous patterns (i.e., global waves propagating across neocortex and transient co–activations such as interhemispheric connectivity) (6). Thus, the reviewer suggests two essential revisions. First, the present manuscript should acknowledge these prior works, discuss and compare the findings, as these prior studies are highly complementary. Furthermore, authors should also justify the use of the current analysis technique to examine the relationship between calcium signals and rsfMRI BOLD signals and they should also discuss why they used a different approach than the approach used by prior studies as the general objective were largely similar. Second, the comparison of BOLD signal extracted from 30 most active voxels and from an ROI (Figure 3 Suppl. 1) showed apparent delay in the peak and onset. Is this in anyway related to certain propagation characteristics as alluded by (6) and prior work done by the authors (7)? If so, the authors should characterize this phenomenon as it is highly interesting. In addition, a recent work by Leong et al. also demonstrated that the low frequency or slow waves can propagate robustly through long–range excitatory projections. Offering a multi–faceted view in the context of rsfMRI will definitely increase the impact of the present study.

5) At present, the authors attempt to claim that cortex–wide BOLD activity was identified only in slow wave state but not in the active desynchronized state and attribute their findings to different brain states by conducting the experiments under isoflurane anesthesia and medetomidine sedation. As eluded already above, this claim is generally too broad and simplistic. Moreover, the present finding is insufficient to support such assertions, unless awake animal experiments are conducted. In fact, this message distracts the reader from the core findings of the study, which is correlating a neuronal event (i.e. calcium slow wave activity) to brain–wide rsfMRI hemodynamic signals. The core message however, is not examining such relationship at different "states", which was the major reason the paper was rejected in the first place. The authors are certainly aware that brain states fluctuate temporally whereby different states are only dominant for a certain period. Moreover, certain features of the rsfMRI such as interhemispheric functional connectivity are also present at both states. Hence, it is a gross oversimplification to assign binary representations for the characterized brain states. Scaling back on these claims and better emphasizing the strength of the paper – i.e. relationship between the calcium waves and the fMRI will address the reviewers' concerns.

6) The authors stated that slow wave activity represents a brain state indispensable for memory consolidation. Knowing that the hippocampus plays a major role in memory consolidation, it would be interesting to also explore the BOLD fMRI signals in the hippocampus, but this is not an essential revision.

7) As stated in the previous review there was serious concerns related to the computational/analytic processing of the fMRI signal.

– The authors should provide a convincing argument that their "global signal" is not a processing or acquisition artifact. ICA decomposition always produces a substantial number of noise components from white matter, CSF, cardiac and respiratory sources. The authors do not mention if or how they dealt with them. They do not mention if their data was pre–whitened prior to submission to ICA. They do not present their component set and discuss it. Further, claims regarding the 'event–related' regressor and global signal would also have been burnished by thoughtful treatment of other potential extraneous signal noise such as drift, fMRI lag, temporal autocorrelation etc. Why has this global signal not been described in rsfMRI before, and if so, please cite the literature where such a "global signal" has been described before.

– It is difficult to understand why the rsfMRI ICA model suggests that under deep anesthesia, a neuronal component appears that represents wide activation. The rsfMRI ICA is not contingent on the calcium wave model – it was just regressed against it. Please explain this confusion.

– Please explain how your data unambiguously demonstrates that the fMRI signals come from neuronal sources.

– Please provide more methodological detail for the fMRI methods used.

– The pipeline used (HRF, task–based contrast modeling) is very vulnerable to artifacts. The link with neuronal activity is novel, and thus, it will be extremely important to be very cautious with making claims. This should be specifically addressed in the discussion.

– The authors should clarify whether they performed group or single subject ICA notwithstanding their presentation of single subject results.

– While the authors in their rebuttal provide some additional information as to their conduct of the ICA, this was not reassuring. At the heart of every ICA is the choice the researcher must make as to how many components to model. Model order is critical to the number and kind of components produced and the interpretation of results. Contrary to the authors assertion, the choice of model order is not "arbitrary". Please clarify were 4 or 17 or 22 PCs/ICs specified in the model? Were the number of PCs and ICs the same or different? Were different ICs used in different animals? If only 4 ICs were specified, one wonders if this drove the production of a single, ostensibly 'global' signal. If 17–22 ICs were specified, one wonders what all those other ICs were.

– The authors should discuss the significant drawbacks of ICA (as opposed to e.g. cluster or seed based methods) as it produces a large number of noise components along with actual gray matter maps. There is an entire field of research dedicated to the better, automated identification of components. The authors have not detailed any of their QC process, presented their component sets or even acknowledged the context and complexity of component identification in ICA. The authors need to discuss the issues associated with this approach.

https://doi.org/10.7554/eLife.27602.029

Author response

[Editors’ note: the author responses to the first round of peer review follow.]

As you can see from the critiques the reviewers saw the technical advances of your study, but were concerned by the biological significance. It is indeed very important that you demonstrated that the waves extend globally, and that you can link the calcium imaging with the fMRI signal. However, the use of anesthesia is a major caveat. The use of anesthetics may explain the global spread, which might be different from natural SWS.

We want to point out that indeed isoflurane anesthesia was routinely employed in several high-impact studies to explore aspects of slow wave sleep. Most importantly, the rationale of this study was not to draw conclusions on natural SWS. It might very well be the case, that the global spread be different in SWS.

We rather asked, for the first time, whether we can use a neurophysiologically defined event – an up-state-associated slow wave – as a regressor for fMRI analysis. We only refer our results to the phenomenon of an individual Up state, and this Up state (represented as slow calcium wave) is clearly no epiphenomenon of anesthesia, as shown in multiple studies using a combination of single cell electrophysiology and calcium imaging (e.g. Chen, 2013).

Importantly, in a recent study, the group of Arthur Konnerth employed the same methodology as used in this paper, using the same anesthesia protocol, except for the use of cameras for recording calcium signals (Busche et al., 2015). They could indeed prove that the cortical synchronicity of slow waves is similar in natural sleep, compared to isoflurane. The treatment effective in restoring slow wave propagation in AD mice under isoflurane was effective in restoring SWS propagation (see Supplemental Figure 17 of the aforementioned publication). This again by no means should convey the notion that slow waves maintained under isoflurane are identical to SWS, but they seem to share important characteristics.

We see the general issue of studies bridging communities with apparently few interactions. In the fMRI community, oscillations of the BOLD signal have been attributed to a vast plethora of effectors: breathing, vascular effects, astrocytic activity, sub vs suprathreshold neuronal activity. Here, we provide for the first time a causal link between individual neuronal slow waves and an oscillation of the BOLD signal. Unlike mentioned by one of the reviewer, we do not merely correlate two signals, as performed in studies correlating EEG/electrophysiology and fMRI, which however are lacking the causal approach.

Certainly, we know, already since the pioneering studies of Steriade, that slow oscillations can be recorded from all cortical areas and certainly also from subcortical regions such as the thalamus.

However, it was far from clear, whether these events also dominate neurovascular signals. Therefore, we strongly believe, that this study bridges two communities which rarely interact, this notion was underscored by the high level of interest in this study both at imaging conferences (ISMRM) as well as at more basic science conferences (SfN).

We certainly agree that anesthesia can have tremendous effects on neuronal activity and on how wide-spread such activity might appear, e.g. upon sensory stimulation. We again want to clearly state that with our study we do not want to make statements regarding SWS or claim that anesthesia is similar to natural SWS and we modified the manuscript accordingly. Nevertheless, isoflurane anesthesia in the concentrations we administered has classically been used in many studies to mimic a certain type of neuronal activity which shares characteristics of activity also present under deep SWS (for a review see e.g. Destexhe et al., 2007). Many of the most cited studies in the field of slow waves are conducted under anesthesia: under isoflurane (Kerr et al., 2005; Luczak et al., 2007; Constantinople and Brunot, 2011; Grienberger et al., 2012.; Stroh et al., 2013; Chen et al., 2013;), but also under urethane (Steriade and Amizca, 1998) or Ketamin/Xylazin (Seamari et al., 2007). Here we do not aim to explain a phenomenon similar or mimicking SWS, but a specific brain state in which neurons of e.g. the cortex are undergoing phases of silence and phases of synchronous firing (also termed “up state” on the single neuron level, with our population calcium readout termed “slow wave”). These “on and off states” of neurons have been found to be meaningful for memory consolidation especially during SWS in behavioral (Ribeiro et al., 2004) and molecular (Yang et al., 2014) studies, but indeed also in studies conducted under isoflurane anesthesia it could be demonstrated that slow wave activity is meaningful for synaptic plasticity on the dendritic spine level (Chen et al., 2013). Despite the difficulties related with sleep studies in small rodent fMRI – where here even more, the specific sleep stage of deep SWS and not only the broader NREM classification as usually summarized in sleep studies, would have to be reached and verified – we here used isoflurane anesthesia to achieve clear and long enough on and off periods as described under the same anesthesia in previous studies (see above references) which is very difficult to achieve in natural sleep. In this way we are able to resolve a hemodynamic response upon an individual, separately detected slow wave, which is neurophysiologically defined, which to the best of our knowledge has not been done before. While we agree that the global spread might be exclusive to deep anesthesia (eventually generalizable to very deep SWS stages if so) we believe that this fact does not impede the biological value of our study as explained in detail further below.

To provide further evidence for the relevance of our findings, we now:

We directly contrasted neuronal responsiveness in slow wave state and another brain state – the desynchronized state – (see new Figure 2). We could conclusively show, that neuronal calcium responses differ fundamentally in these two brain states. Only in slow wave state, the entire cortex was recruited in slow oscillation-associated calcium wave activity, whereas in desynchronized state, the typical default mode networks could be identified using model-free ICA. This finding has immediate translation value, as it indicates, that resting state studies in humans, conducted under awake conditions, are very well captured in sedated desynchronized state in animals, but that in a slow wave state, the cortex is dominated by spontaneous slow wave events.

While we understand that the lack of thalamic involvement may be merely a technical issue, one reviewer felt that this could also be due to the anesthesia.

We published a study in Neuron in 2013, using the exact same methodology, that we can record slow waves from the thalamus (Stroh et al., 2013), but we conducted a new dataset:

In response to this comment, we now conducted thalamic recordings (see new Figure 5). Under our isoflurane anesthesia regime we could clearly show typical slow waves in thalamus, albeit with a lower SNR. And again, we could find a cortex-wide correlate to the thalamically recorded slow wave events, not surprising given the strong thalamocortical synchronicity (see Stroh et al., 2013). We again could not reliably detect BOLD activation in the thalamus, but we can now conclude that this will most likely represent a combination of technical issues: the surface coil not being sensitive in deeper brain regions, and presumably less neurons carrying the slow wave event, as indicated by the low SNR of the optical recordings. But most importantly, we can now exclude the major concern of the reviewer, the lack of thalamic BOLD activity being due to anesthesia as there is indeed thalamic slow wave activity under isoflurane.

We hope you can address these comments in a new manuscript that carefully discusses these caveats, emphasizes the technical advances and the importance of the biological significance of your finding.

Also, please carefully explain the lack of thalamic activity, the rationale for using these particular anesthetics and the caveats associated with this.

We thank the reviewers for these valuable comments and concerns and now offer a new and fully revised version of the manuscript in which we address the mentioned critiques and rule out potential caveats pointed out by the reviewers, please see our point-by-point responses below.

Reviewer #1:

Default state functional MRI has become an increasingly important tool to explore various neurological and psychiatric conditions. This approach, which was pioneered by Dr. Marcus Raichle, can be used to characterize addiction, demonstrate developmental changes in cortical connectivity between different brain regions and identify developmental delays. The importance of this approach is documented by an increasing number of publications in high profile Journals. A major limitation of this approach is that the relationship between the BOLD signal and neuronal activity is complicated and there are those that believe this signal reflects primarily hemodynamic changes rather then actual changes in neuronal activities. One of the main technical limitations is that the use of MRI technology is difficult to combine with conventional electrophysiological techniques, because the magnetic fields are disturbed by the metallic nature of wires. The major strength of this study is the use of optical techniques that allows the combined characterization of neuronal signals and the wide-range Bold signal using fMRI approaches. The present study has also another strength in that it characterizes these activities in "small" animals. This has the major advantage that wide range optical signals can be characterized.

This study is clearly of great interest for a general readership: the demonstration that locally recorded calcium waves correlate with BOLD signals spanning distant cortical states is important since understanding the neuronal basis of cortical states is critical for understanding sensory processing, the generation of sleep and wake states and the role of memory consolidation, just to name a few examples. The study can relate slow wave onsets to fMRI fluctuations, which has not been possible before. These slow waves have been well characterized by other neurophysiological studies, which closes the loop between a well-characterized neuronal activity and the macroscopic fMRI signal. The study therefore strongly suggests that the cortex-wide BOLD signal is a property of slow-wave neuronal activity. The study seems to be well powered and carefully conducted. The introduction and discussion is very interesting to read and relates the finding in this rodent model to various general neurobiological phenomena. Thus, I don't have major concerns.

We thank the reviewer for his comments.

Reviewer #2:

These authors combined fMRI with a fiber optic–mediated calcium recording method to study the slow calcium waves in the rodent brain. It is an excellent combination of techniques to study brain function at multiple scales. The main effort of this work is to decipher the potential linkage of slow calcium waves with the resting state fMRI signal of the anesthetized rodent brain, which is an important and novel direction for small animal fMRI studies. Besides the technical advancement, more discussion could be provided to better clarify the biological significance and image processing strategy. The reviewer has a few concerns needed to be clarified by the authors:

1) The calcium signal was recorded in rats anesthetized with isoflurane. The trace of local field potential (Figure 1M) mimics the burst suppression events. It will be better to discuss the states of the anesthetized animals of this work in comparison to the literature using similar drugs (or other anesthetics) to study slow wave activity.

We did now extend our discussion on these events; indeed we found very similar, if not identical, LFP signatures as others in the field (Kerr et al., 2005; Stroh et al., 2013; Busche et al., 2015).

2) The procedure to estimate hemodynamic response function (HRF) should be carefully described. One puzzling issue is the time course of the HRF, which showed very fast onset time in comparison to the existing models (Figure 2E, F). The authors stated "Time course of averaged HRs exhibited a sharp rise 0.7 s {plus minus} 0.4 s after the onset of a slow calcium wave." What does the "sharp rise" mean (equal to onset time?). If it is the case, please discuss the early onset of the estimated HRF by referring to the existing literature on this matter. If the authors presented the time courses of simultaneously acquired calcium and fMRI signal, would they have observed any phase shift? It will be better to provide a cross correlation curve to specify the temporal features of the two kinds of signals.

The different temporal domains of the neuronal response and the neurovascular response represents the main enigma of fMRI, this is not different in this study. It is rather a strength of this study that despite this drastic difference in timing, we can extract a BOLD correlate to individual slow waves states.

A cross correlation between these signals seems not to be meaningful, due to these drastic differences in timing.

3) One of the key conclusions of this work is that the functional significance of the "slow calcium waves" specifies global correlation of the whole cortex. The authors suggested that the slow calcium waves were related to the slow wave activity as discussed by the authors. It will be better to explain the underlying rationale that no subcortical regions detected in the correlation maps.

The lack of subcortical BOLD activity is a mere technical issue due to the employment of a so-called surface MR coil, dedicated for high resolution of cortical areas, which have been the primary interest in our study so far.

We now conducted thalamic calcium recordings, see point 2.

Reviewer #3:

In this manuscript Schwalm et al., have developed an innovative approach to study global patterns of activation brain–wide in relation to local slow–wave activity, combining local calcium imaging and fMRI in anesthetized rats. Using different analytical approaches, the authors show that cortical slow–waves detected locally with calcium imaging, are correlated to a global, cortex–wide activation detected with BOLD fMRI. This is an elegant and well-conducted study and I have little concern about the methodology – but I must say that I have little expertise in fMRI.

My main issue with this study concerns the limitation of the interpretation of the results that need to be addressed in the discussion. Indeed, the authors make a strong statement about highly coherent slow–waves activity across the entire cortex based on their results obtained in deeply anesthetized rats. Anesthesia is not SWS. Although anesthetics have been used extensively to characterize slow–wave activity and determine its cellular mechanisms – because of the apparent similarity of the brain activity under some anesthetics and natural SWS – many studies also point directly or indirectly to critical differences between anesthetized states and natural SWS:

We do not want to give the impression and it was certainly not our intention to treat results obtained under anesthesia equally to SWS phenomena. We now rephrased the manuscript accordingly.

Nevertheless, as we wrote in the introduction and as the reviewer points out correctly, many studies addressing slow wave phenomena are conducted under anesthesia, particularly isoflurane. As mentioned above, in a recent study using the identical methodology, the group of Konnerth could show, that the cortical slow wave dynamics is similar in SWS and under isoflurane anesthesia. Again, this does not prove that they are identical, but that isoflurane anesthesia can be used to mimic certain aspect of slow waves occurring during deep sleep.

The novelty of our approach represents the approach to directly relate (not merely correlate) the two simultaneously measured signals, which is to use the neurophysiologically defined slow wave measured by the local calcium recordings as a predictor for the global hemodynamic BOLD signal in an event-related analysis.

We now strongly point out the fact that we do not want to compare our isoflurane anesthesia condition to SWS in the introduction and in the discussion and thus also moderate our conclusions as suggested by this reviewer, please also see new experiments 1-2.

1) Down– or Silent–states are shorter during SWS compared to anesthesia and last rarely longer than 1s (Steriade et al., 2001; Timofeev et al., 2001; Mahon et al., 2006; Chauvette et al., 2011). In this paper, the authors report patterns of activity with very long Silent–states (~ 5 s or more) between consecutive slow–waves, which indicates very deep levels of anesthesia. Although it is easy to understand the rational for maintaining such depressed cortical activity to provide enough temporal separation of single slow–wave events in this study, the relevance of the data acquire in such anesthetized state to natural SWS is questionable.

As in the multiple high impact studies using isoflurane to study up/Down states, we do not claim a one-to-one relation to SWS, and this was not the rational of this study. Indeed the reviewer is right; the long interval between the Up states is preferable for our analysis approach.

2) While under anesthesia slow–wave activity is highly synchronized across cortical areas, the long–range cortico–cortical coherence during natural SWS is much lower (Chauvette et al., 2011; Busche et al., 2015), probably due to the fact that slow–waves often occur very locally (Nir et al., 2011). As a result, many studies point to a decreased long–range functional connectivity during SWS compared to wakefulness (Olcese et al., 2016; Tagliazucchi et al., 2013). Therefore, the conclusion that slow–waves are highly coherent across cortex might only be true under anesthesia.

We are aware of these studies, indeed, the level of coherence might vary depending not only on anesthesia vs sleep conditions, but in addition might vary between different sleep stages. We never made the point that the level of coherence is similar under all these conditions; this was not the rationale of this study. We nevertheless want to mention that most of sleep studies refer to NREM sleep stages when talking about slow wave activity (Tagliazucchi et al., 2013 for humans and Olcese et al., 2016 for rats), which not necessarily resembles the pure stage of natural deep SWS as this is not easy to determine. In a modeling study, Deco et al., (2004) showed that if considering decrease of cholinergic neuromodulation to very low levels, slow waves do become global and resting-state networks merge into a single undifferentiated, broadly synchronized network, as it is the case in our study.

In future follow-up studies in naturally sleeping rodents, using the methodology implemented here, which is clearly not possible in the context of this study, there might be indeed different patterns of BOLD activation. But this is exactly the strength of our approach: we provide first evidence that individual slow waves show a clear BOLD correlate, so now this can be used to study this very question in the future.

3) SWS seems to promote, or even to be critical, for memory formation, whereas, to the best of my knowledge, anesthesia has a rather negative impact on memory formation.

We agree with the reviewer that important work regarding the role of slow waves for memory consolidation was conducted under natural SWS, on the behavioral (Ribeiro et al., 2004) as well as on the molecular level (Yang et al., 2014). We do not claim that in this state of anesthesia, memory formation takes place. However, we want to draw the reviewer’s attention on a study conducted by Chen et al., (2013) showing slow calcium waves present under isoflurane anesthesia to promote mechanisms necessary for synaptic plasticity on the dendritic spine level. In this study the authors show that the same synapses which are activated while mice are subjected to sensory stimulation are also active during spontaneous up states (the single-cell equivalent to our population slow waves) and identify recurrent NMDAR-activation-dependent calcium signals occurring reliably in a subset of spines in cortical neurons during slow waves under subsequent anesthesia in the same animals. These findings were conducted under isoflurane anesthesia and suggest that these calcium signals represent a cellular substrate for synaptic plasticity and therefore memory consolidation.

The authors should address these points in their discussion and moderate their conclusions.

We modified the manuscript accordingly.

Reviewer #4:

What is the question asked by the manuscript? What is the answer provided? The manuscript appears as an elegant exercise to correlate slow brain activity with BOLD signal, I can't evaluate whether this is new. It doesn't seem new based on the references. There is nothing new in terms of biological data, the widespread and synchronized nature of slow oscillations is well known since the original description of the slow oscillation by Steriade et al., (1993). In those papers, also the synchrony with thalamus was established and then confirmed repeatedly, it is surprising that the thalamus shows no signal, slow oscillation in synchrony with cortex have also been shown in basal ganglia, why is there no signal in basal ganglia?

We now conducted a new set of experiments, please see experiment 3.

Why are these called calcium waves? Does it make reference to propagation? Or are these just increments in calcium signal with weak periodicity? Please clarify and be consistent throughout text.

We call the recorded signals ‘calcium waves’ in accordance with others (Adelsberger et al., 2005; Stroh et al., 2013; Busche et al., 2016) indeed to reference to their propagation mechanisms as shown by others before (Stroh et al., 2013; Busche et al., 2016).

I don't understand the statement in the subsection “Cortical slow wave–associated population activity can be reliably detected by optic calcium recordings during fMRI scans”, or what its significance is. ("This local confinement allows for a clear attribution of slow wave activity to a spatially restricted region").

With this statement we wanted to clarify calcium recordings derive a signal exclusively from the population of cells stained with the calcium indicator, when illuminated by the optic fiber. Considering this we can be sure about the source of our signal regarding local constrictions and can exclude influences from other regions, which is important as we wanted to relate a local slow wave event with a whole-brain readout and therefore need to be precise regarding the locality of such signals.

Also, the statement about the LFP is incorrect, if the LFP is recorded in bipolar configuration it is as confined or more than the calcium signal. Only in monopolar configuration (with a reference elsewhere in muscle or bone) the statement of volume conduction is true. In the original description of the slow oscillations by Steriade et al., (1993), the recordings are bipolar between the surface and depth of a cortical column and the intracellular recordings were obtained from the immediate vicinity of the LFP. By doing cross correlation between recording sites from spatially confined regions at different distances is how global synchrony was demonstrated, such demonstration would have been impossible with monopolar LFPs which are contaminated by volume conduction.

Furthermore, the paper by Katzner et al., 2009 [cited?] reaches the opposite conclusion than Kajikawa and Schroeder (Cited in the manuscript) and states that the LFPs represent mostly local activity within 450 microns. The paper by Linden 2011, reaches yet another conclusion: that the area of tissue represented by the LFP depends on the degree of correlation of the underlying networks. Thus, the authors do a poor job here and this part of the manuscript should be rewritten.

We rephrased accordingly, but we clearly state that in principle LFP would also be a suitable method; we even show data on the one to one correlation. We use the optical method due to the fact that there is no interference between the fast shifting magnetic field of the MR scanner and the optic fiber-based readout.

The HR peak at 6.5 s contains at least 5 calcium waves, how is the HR related to an individual calcium wave? Calcium waves occur rhythmically and continuously, how is the effect of subsequent calcium waves eliminated from HR? What does the decay signal of HR represent? How can the HR signal decay many seconds after the calcium wave? Please explain.

The most fundamental principle in the most accepted model of the BOLD fMRI signal (i.e. the HR) generation is that the BOLD signal is described by the convolution of the stimulus shape with the hemodynamic response function (HRF). The HRF, being the response to a delta function-shaped stimulus, has the major features of a signal rise to a maximum and a slower decay to baseline (accompanied by a small undershoot), and has a duration of several seconds. For longer stimuli, as a calcium wave in our case, the response is prolonged accordingly. In the commonly accepted General Linear Model, repeated stimuli (calcium waves in our case) add up and further prolong the HR. Our observations are therefore in agreement with the theory of BOLD fMRI that has been developed and tested over more than twenty years.

The HR suggests that the entire brain is having increases and decreases of oxy/deoxy Hb, which are more than an order of magnitude longer than the underlying oscillations. How is this possible? What is driving the HR?

As described above, a HR lasting for several seconds is exactly what is expected from the theory of BOLD fMRI. The stimuli that drive the HR, are in our case the calcium waves. The cellular mechanism behind the HR is still a matter of debate in the field and its clarification way beyond the scope of this paper.

The finding that BOLD signal in the entire cortex is not new and confirms the early findings of Steriade et al., 1993. In the subsection “Calcium slow wave event–related analysis reveals cor tex–wide BOLD correlate”, the authors indicate that the data "suggest" but in reality the data "agrees" with previous descriptions.

We agree with the reviewer that our data agree with previous findings, in regards to the global spread of cortical waves. However, we for the first time showed that the BOLD correlate of cortical waves is linked to the calcium signal, and thus directly to the oscillatory activity. Indeed, Steriades seminal work showed slow waves (similar in SWS and under different types of anesthesia) to be present in distinct areas of the cortex. Nevertheless, a whole-brain correlate, showing how the activity of the entire cortex at the same time is directly related to an individual slow wave event, was never demonstrated before. What was indeed shown by others are local readouts in various brain areas or cortical areas at the same time (Steriade’s work, but also see the work of Igor Timofeev or Stroh et al., 2013) or the simultaneous presence of a slow EEG/LFP rhythm and the corresponding low frequency BOLD signals, which indeed show a correlation (Chang et al., 2013; Hsu et al., 2016; Magri et al., 2012 and many others), but the direct relationship of the whole-brain fMRI signal to an individual slow wave event was never analyzed before in the way we present it in this study.

Subsection “Calcium slow wave event–related analysis reveals cortex–wide BOLD correlate”: functional assemblies under isoflurane anesthesia? That sounds absurd. Widespread slow activity is the exact opposite of functional assemblies. The brain is anesthetized. Unless the authors refer to a functional state related with deep sleep? What would it be?

This statement was directed at a potential relation of isoflurane-associated slow waves to deep SWS oscillations. “On and off states” of neurons have been found to be meaningful for memory consolidation especially during SWS in behavioral (Ribeiro et al., 2004) and molecular (Yang et al., 2014) studies, but indeed also in studies conducted under isoflurane anesthesia it could be demonstrated that slow wave activity is meaningful for synaptic plasticity on the dendritic spine level (Chen et al., 2013). At least in SWS this reverberating activity has been associated with spike sequence replay related to previous experience (Ribeiro et al., 2004). Again, we only want to convey that in anesthesia, aspects of SWS can be studied.

This manuscript should not be published or considered further without clear answers and clarifications to the above questions.

We hope that our revised manuscript now gives sufficiently clear answers to the reviewers’ questions.

[Editors’ note: the author responses to the second round of peer review follow.]

Reviewer #1:

The authors have done a great job in revising the manuscript. They added the characterisation of a desynchronised state, and they showed slow oscillations in the thalamus, which was a major concern in the previous submission. The authors use light anaesthesia, which was a confounding issue in the first submission, but the first submission did not show the desynchronised state, which differs fundamentally from the more synchronised state that has similar characteristics of SWS.

The comparison with the BOLD signal is interesting and will contribute to our understanding of what neuronal activity actually underlies this signal.

We thank Reviewer 1 for his comments.

Reviewer #2:

In this manuscript Schwalm et al., use an innovative approach to study global patterns of activation brain–wide in relation to "local" slow–wave activity, combining local calcium imaging and fMRI in anesthetized rats. Using different analytical approaches, the authors show that cortical slow–waves detected locally with calcium imaging, are correlated to a global, cortex–wide activation detected with BOLD fMRI.

In this revised version, the authors also compare the pattern of activation during slow–wave activity in deep anesthesia to a more desynchronized brain activity under sedation. They find that the cortex wide activation during slow–waves contrast with the more restricted activation during sedation similar to the default mode network. The authors also studied the BOLD correlate of thalamic slow–waves, finding again a cortex–wide activation but no thalamic activation. The authors argue that the absence of thalamic activation during slow–waves could result from technical limitation.

Although this revised version provide new and interesting data, the authors have not address my main concerns and I keep thinking that the relevance of this study is considerably limited by the use of deep level of anesthesia and technical limitation – in particular the very poor temporal resolution of fMRI. Hence, my comments for this revised version are very similar to my initial comments.

However, I suppose this study might be of interest for the field of fMRI.

We thank the reviewer for his comments.

We agree on the reviewer’s concern regarding the low temporal resolution of fMRI, which is a general and unavoidable inherent drawback of this method. Nevertheless, it has to be stated, that the other reviewer suggested even lower temporal resolutions for our study, claiming this to be more appropriate for studies investigating resting brain networks. This by no means would be applicable for our experiments exactly because of the aim to resolve calcium slow waves during this type of ongoing activity, but clearly demonstrates the methodological, terminological and conceptional gap still existing between the communities.

As many rodent studies in fMRI are carried out under anesthesia out of practical reasons, the impact of different brain states induced by anesthesia (e.g. isoflurane slow waves versus desynchronized medetomidine sedation) on ongoing activity and stimulus response properties is of specific interest for this field. Also, here it is particularly relevant to consider readouts of local population activity as the calcium measurements and relate those signals to the broad fMRI signal. Directly relating a neurophysiological readout to fMRI BOLD is still not routinely done, even in the field of rodent fMRI. Especially because of the concerns the reviewers raise regarding globality versus locality of cortical engagement in slow wave activity it is of high relevance to pay attention to these local readouts. A local event, e.g. a change of excitability state of a small population of neurons, can have tremendous effects on global brain state and network responsiveness upon sensory stimulation. In the small animal fMRI community many studies of potential translational value are carried out in rodents, now more than ever due to the availability of genetic disease models and the possibility of optogenetic circuit probing. Especially resting state studies are performed under a plethora of different anesthesia protocols without controlling for the neurophysiological effects this might have on local cortical network activity and with referring to ongoing neuronal activity simply as ‘resting state fluctuations’ without further refinement of their properties. From this perspective it is of high value for the fMRI community to relate local network states induced by different types of anesthesia to the global BOLD response. But the value of our study goes beyond the specific relevance for fMRI measurements. To bridge the gap between the micro- and macro perspective on cortical activity held by the fMRI and the neurophysiology community, studies combining methodology and concepts of the two perspectives are relevant, also for a broader neuroscientific audience. As rodent so-called resting state studies carried out under undefined brain states induced by different anesthetics are compared and claimed to have translational value for human research, the induced states have to be closely investigated regarding their BOLD correlates. This will lead to a better understanding of which types of different states resting state or default mode activity consists, as this is also very loosely defined for the human brain. Tagliazucchi and Laufs, (2014) for example showed reliable drifts between wakefulness and sleep in typical fMRI resting-state data in humans, meaning that also in humans the exact state of the network during resting state fMRI is unknown and variable. Taking into account recent findings in rodents showing that also during awake resting a type of slow wave activity (which is also very likely different from sleep regarding length of silence periods and other properties) is present in different cortical areas (Fernandez et al., 2016; McGinley et al., 2015), the presence of slow wave activity and its effects on BOLD becomes even more relevant for resting state measurements and their potential translational value. Additionally, our study is not merely correlating two signals as many other studies did before, it is directly relating a neurophysiological event – the calcium slow wave – to its potentially present BOLD correlate by employing a specific type of fMRI analysis (eventrelated), which has never been shown before in such way. Thus, while we agree on all points the reviewer is rising in his comments and also can address them (see below), we truly believe in the relevance this study potentially has regarding cortical states and their different correlates, which is going well beyond the field of fMRI research. Such translational studies are valuable to reunify different fields investigating similar phenomena from their inherent point of view and eventually leading to a better defined terminology for said phenomena as well as how different observational scales of cortical activity can contribute to a holistic understanding of how the brain works.

My main issue with this study concerns the limitation of the interpretation of the results that need to be addressed in the discussion. Indeed, the authors make a strong statement about highly coherent slow–waves activity across the entire cortex based on their results obtained in deeply anesthetized rats and with poor temporal resolution. Anesthesia is not SWS. Although anesthetics have been used extensively to characterize slow–wave activity and determine its cellular mechanisms – because of the apparent similarity of the brain activity under some anesthetics and natural SWS – many studies also point directly or indirectly to critical differences between anesthetized states and natural SWS:

We completely agree with the reviewer and by no means wanted to give the impression to be in the belief anesthesia is comparable to slow wave sleep.

We also completely agree that with the temporal resolution at hand, a locally initiated, potentially traveling wave could not be resolved. We are aware of that such traveling waves exist, also e.g. under anesthesia (Stroh et al., 2013) and that the long-term aim of fMRI-based slow wave studies needs to be reaching a temporal and spatial resolution which enables a brain-wide readout of such traveling activity. This up to now is not possible with the current methods, which is why we aimed at resolving a cortical BOLD correlate of calcium slow waves by employing a specific type of analysis. We are relating every calcium event detected in the optical signal to the brain wide BOLD activation of the animal and thereby detect the reported cortex-wide activation. This analysis reveals the ongoing BOLD signal in the whole cortex related to a locally detected wave in the calcium signal. It is not revealing a correlation, nor is it similar to coherence or connectivity and therefore cannot be directly compared to results obtained by these measures. We agree that for clarifying these issues we need to modify the discussion and especially focus on the limitation of the interpretation of the results.

1) Down– or Silent–states are shorter during SWS compared to anesthesia and last rarely longer than 1s (Steriade et al., 2001; Timofeev et al., 2001; Mahon et al., 2006; Chauvette et al., 2011). In this paper, the authors report patterns of activity with very long Silent–states (~ 5 s or more) between consecutive slow–waves, which indicates very deep levels of anesthesia. Although it is easy to understand the rational for maintaining such depressed cortical activity to provide enough temporal separation of single slow–wave events in this study, the relevance of the data acquire in such anesthetized state to natural SWS is questionable.

It is indeed true that during SWS, down or silent states are much shorter than during deep isoflurane anesthesia. This faster reoccurrence of the waves may also be the reason for a more local than global spreading of this activity. In the manuscript indeed we focused on data with higher temporal separation to detect single slow-wave events as the reviewer correctly pointed out. Again, we do not want to draw a parallel from our deep anesthesia data to natural slow wave sleep and apologize to have given that impression throughout the manuscript. Our only interest in this study was to analyze the whole-brain correlate of such locally occurring slow wave events. The interrupting silent states may be of different length in different types of slow wave rhythms, but the slow wave event itself by its very own nature and microarchitecture is comparable throughout states on a neurophysiological level as– no matter if in natural slow wave sleep, anesthesia or during awake resting- on the cellular level it consists of synchronous firing of a population of thalamic and cortical neurons.

2) While under anesthesia slow–wave activity is highly synchronized across cortical areas, the long–range cortico–cortical coherence during natural SWS is much lower (Chauvette et al., 2011; Busche et al., 2015, Fernandez et al., 2016), probably due to the fact that slow–waves often occur very locally (Nir et al., 2011). As a result, many studies point to a decreased long–range functional connectivity during SWS compared to wakefulness (Olcese et al., 2016; Tagliazucchi et al., 2013). Again, many studies point to slow–wave events being rather local than global during natural slow–wave sleep. Therefore, the conclusion a cortex–wide activation during slow–waves events might only be true under anesthesia.

We are well aware of the existence of such locally occurring slow waves in lighter anesthesia states or even when the animal is resting but awake, from the literature, and this is also what we are seeing in data from our own lab. Nevertheless, what we are looking at is different from measures of functional connectivity and we would of course agree and expect that compared to wakefulness, functional connectivity in SWS as well as during deep anesthesia is much lower. We definitely agree that we have to address the issue of rather local slow waves during natural slow wave sleep and that therefore our results may be valid for deep anesthesia states only, in the discussion. Also we want to further discuss the point that what we are observing might be several, locally initiated, but traveling wave.

3) SWS seems to promote, or even to be critical, for memory formation, whereas, to the best of my knowledge, anesthesia has a rather negative impact on memory formation. In order to synchronize cortical activities across areas and efficiently drive plasticity, the precise timing – at milliseconds scale – of slow–waves is critical (Miyamoto et al., 2016). Such time precision cannot be achieved with fMRI.

We agree about the millisecond scale timing necessary to synchronize cortical activities across areas and efficiently drive plasticity as shown by Miyamoto et al., 2016. Indeed, such a temporal precision cannot be reached with fMRI. Regarding the meaningfulness of slow wave events under anesthesia for memory formation we do not want to make any claim in our manuscript.

Nevertheless, we want to draw the reviewers attention on a paper from Chen and colleagues (2013) which showed that dendritic spines in neurons are active during the neuron’s up state (and inactive during silent states) and that spontaneously recurring up states evoked in these spines under isoflurane anesthesia “patterned” calcium activity that may control consolidation of synaptic strength following epochs of sensory stimulation. So it may be the case that at least the up state on the single neuron level under isoflurane anesthesia indeed plays a role in the consolidation of synaptic strength.

The authors should really address these points in their discussion and moderate their conclusions.

We fully agree with the reviewer on this point and prepared a revised manuscript addressing these points in the discussion and moderating the conclusions drawn from our data.

Reviewer #3:

Essentially, it seems to me the authors are trying to prove that there is cortex–wide BOLD activation in the rat brain that is driven by (or at least correlates to) activation in calcium slow–wave response by means of demonstrating that one can convolve calcium slow wave tracings with a FIR basis set and fit this to the BOLD data. However, FIR basis sets are complex alternatives to standard models of the HRF and while they allow a large amount of flexibility this comes at the price of bias–variance tradeoff, and they should be used within rigorous multivariate models. Generally, FIR basis sets are used in studies aiming at characterizing the shape of the HRF, and not for studies aiming to detect activations. This study aims at detecting activation. As well, there are a very small number of subjects, and many substantial questions in the methods used to process the BOLD, ranging from sequence used to pre–processing to use of ICA. It is not clear to me what the authors have actually "detected" in the BOLD – it may just be motion, or other artifact.

We thank the reviewer for the comments on our manuscript. Nevertheless, we have to state that many assumptions the reviewer makes are factually wrong. Regarding the main criticism expressed here that “Generally, FIR basis sets are used in studies aiming at characterizing the shape of the HRF, and not for studies aiming to detect activations” we totally agree with this view. What the reviewer does not take into consideration is that we did exactly what she/he claims what should be done with this basis function set. We used the FIR basis set to derive the hemodynamic response upon the onsets of optically detected slow calcium waves. Afterwards, we use the hemodynamic response that was detected to convolve it with a binarized slow calcium wave vector that is used afterwards as a regressor. This second step of course was performed in a different subset of animals to avoid what is known as “double dipping” (this is explicitly informed in lines 620-635 of the main manuscript). Furthermore, the sentence is misleading, since an FIR basis set is used to characterize the HR, not the HRF, since an HRF is already a basis function itself. We therefore assume the reviewer did not understand the important difference between HR and HRF, but also we have to say that nevertheless we already did exactly what the reviewer claims what has to be done: characterizing the shape of the hemodynamic response upon a slow calcium wave. Therefore, we conclude that the reviewer did not understand the procedure used by the authors to perform the GLM, and consequently further claims on this issue are obsolete. Additionally, the claim that our results could be due to a motion artifact is not a reasonable assumption considering that the data was acquired in deeply anesthetized animals which tend to move very little due to the deep anesthesia. Nevertheless, for the GLM data we carried out a series of control analysis to reveal eventual artifacts leading to spurious activation, as e.g. switching around the regressor obtained from the calcium data temporally or switching calcium regressors between animals – both without any results, showing that the activation we detected based on this regressors are very specifically related with the underlying neuropyshiological event (see in detail Figure 4—figure supplement 2). And, additionally for the results obtained with the ICA method we showed that the ICA component does strongly correlate with the regressor of the GLM model used for the same animal. This strong correlation is significant for all the animals, which totally annihilates the idea of a spurious component.

Specific Methods Concerns

I have substantial concerns with the methods described to acquire, pre–process and analyze the resting–state fMRI data. These include but are not limited to:

1) Sequence: a very short TR of 1 sec was used. This is unconventional and has disadvantages in the acquisition of resting–state (in rodents, or humans). Generally, a TR of at 2–3 secs is preferred.

To our knowledge, most of resting state fMRI experiments in rodents use a TR between 0.5 and 2 seconds which is also stated in a recent review by PAN W-J and collaborators (2015): “As in human rs-fMRI studies, most rodent studies employ fast imaging sequences to image the brain on the order of once per second… A typical rs-fMRI study in rats has an in-plane spatial resolution of 200–400 microns, a slice thickness of 1–2 mm, a repetition time (TR) of 0.5–2 s”.

2) Pre–processing pipeline: this is (thinly) described as being realignment, reslicing and smoothing. This raises the following concerns:

a) Coregistration and normalization do not appear to have been performed prior to smoothing. Realignment only performs within–subject motion correction. It does not perform between–subject motion correction. The authors describe a process (subsection “fMRI analysis”) where they take heavily processed maps and manually align them with anatomical images (presumably for purposes resembling coregistration) using ImageJ. This is of concern because (a) coregistration should be performed earlier in the pipeline, prior to smoothing (b) They are performing a manual process and not using an appropriate normalization algorithm and (c) Using a piece of software intended for the processing of visual (not neuroimaging) images. The authors should re–perform their pre–processing pipeline to incorporate coregistration and normalization prior to smoothing. Excellent choices are readily available in SPM12, which they are using.

The reviewer claims that the authors presumably co-registered images using Image-J. The reviewer expresses this concern as this would not correspond to a proper normalization. Here, the reviewer is mistaken since the authors did not perform any alignment. We clearly mentioned this in the subsection “fMRI analysis “cited by the reviewer that 20 beta-maps were overlaid, so a co-registration was not necessary in this case. Again, in same subsection, the reviewer mistakenly argues that the entire pre-processing pipeline should be re-performed which is based on her/his misunderstanding of the data analysis. Again, we want to strongly state, that since no group analysis was performed, neither co-registration nor normalization is necessary or reasonable for our preprocessing pipeline.

Because no group analysis was done between-subject motion correction is not necessary since no second level analysis was ever performed. Statistical tests had only been performed in within subject analysis, so no co-registration, neither normalization of datasets is necessary.

b) Smoothing has the effect of boosting SNR. It is generally used in pipelines where masses of voxels are being considered in larger numbers of subjects. Here, a small number of voxels is being considered in a small number of subjects. How do we know the resulting 'signal' is not artificially boosted by the smoothing process?

The reviewer correctly argues that smoothing can sometimes artificially increase the SNR. Nevertheless, what the reviewer does not consider is the size of the smoothing applied. Typically, a large smooth can boost up the SNR, nevertheless the reviewer does not consider that the voxel size in our case is 350 x 325μm² spatial resolution (slice thickness 1.2mm) and the smoothing used is 500μm, what practically cannot increase the SNR by any means.

c) The lack of normalization and use of manual methods in ImageJ introduces many concerns regarding anatomic standardization among the various parts of this complex pipeline. It is not clear to this reviewer how integrity is maintained in comparing one location vs another between processes and animals. For example, the sites of optical fiber recordings, ROI, etc. – why have conventional methods not been used to place all locations in MNI space?

The reviewer argues that it is not clear how the integrity in the sites of optical recordings was maintained, while it is clearly stated in the manuscript how and where the craniotomies were performed (S1, subsection “Dye or virus injections and fiber placement”), which is obviously consistent throughout the entire study.

The reviewer suggests putting all the data in MNI space. This suggestion again highlights the fact that the reviewer did not understand the experimental protocol. Standardization of brains in MNI space is only useful for group analysis but is not necessary and furthermore, definitely not recommended for single subject analysis as those performed in our manuscript, since they unnecessarily distort the brain volume to make it fit onto a template.

d) Serial autocorrelation: The authors do not describe how they managed the risk of serial autocorrelation, even though they use small voxel clusters and a cluster–based method. This is essential to avoid false positives.

Serial autocorrelations were performed by using an autoregressive AR(1) model during classical (ReML) parameter estimation. These are standard SPM12 parameters.

e) Other conventional steps are not described e.g. filtering.

All datasets had been filtered using a Highpass Filter with a cutoff frequency of 1/128 seconds. As well these are the standard SPM12 parameters.

3) Group ICA

This point of the reviewer is entitled “Group ICA”, which raises the authors concern that this reviewer may have misunderstood the point of the manuscript. We would like to emphasize that we did not perform any kind of group analysis in this study and do not understand from where she/he got that impression.

We did this type of analysis (single-subject ICA) specifically to avoid the mentioned danger of spurious results due to a reduced number of subjects or due to the co-registration and normalization procedures. On the contrary, we show that our BOLD activations and independent components in the ICA analysis are robust and reproducible on a subject-by-subject basis for all the animals.

a) It is not acceptable to note that GIFT was used "with its pre–defined settings". GIFT is a large software platform that does not have "pre–defined settings". It has many choices available to the researcher in terms of algorithms, number of PCs, ICs. At a very granular level there are default settings, but this is after other choices have been made (e.g. one could use the default settings for the Infomax algorithm). The authors must describe in much more detail how they conducted the group ICA, especially given the small number of subjects.

We indeed do not mention the details of the ICA parameters used, but those a rarely mentioned within a manuscript. Nevertheless, we can add them here: on preprocessing, means were removed per timepoint. The default mask and standard PCA (with 2 data reduction steps) have been used. For back reconstruction, GICA has been used and all results have been scaled by their Z-scores. In the first step, 4 PC/IC has been used, none in the second. We used the Infomax-algorithm with regular stability analysis and no autofill was performed. The options for the Infomax-algorithm were as follows: Block:119, Stop:1e-006, Weight:0, Lrate:0.01082, MaxSteps:512, Anneal:0.9, Annealdeg:60, Momentum:0, Extended:0, Posact:off, Spering:on, Bias:on Verbose:on. The reviewer asks for a detailed explanation of the performed group ICA which we never performed and which would make no sense to perform it in the framework of our study.

b) Use of MDL to estimate the number of components seems unusual and unnecessary in this analysis. Did the authors perform a parameter sweep to think through their criteria for number of ICs given the study objectives?

Regarding this point, we indeed used MDL to estimate the number of components because it is an option that is part of the GIFT platform, which is commonly employed. We agree with the reviewer that it is not “necessary” for this analysis but it is not detrimental for it either. Indeed, most of other authors usually choose an arbitrary number of components – 15-20 or even 40 – for the ICA and do not use the MDL procedure. In our case, while using MDL most of the animals showed between 17-22 components what is practically similar to choosing them arbitrarily.

c) Is a group ICA being performed or single subject? This is not clear – it appears single subject results are presented in figures.

After exposing the criticisms in the three previous points concerning mistakes in the supposedly performed “group ICA” analysis of our data, only now the reviewer wonders if any group ICA was ever performed. Just to be clear on this point: no group ICA was performed in this manuscript at all. Actually, the only time the words “group ICA” appear together in the manuscript is when the tool GIFT is cited, which can indeed also be used for such analysis, but does not have to be. In any case as stated throughout the manuscript, we used it for single-subject ICA. Finally, and just to complement, as the reviewer is speculating on this point, all the figures are single subject ICA analysis because we only performed single subject ICA analysis.

d) ICA produces a substantial number of noise components such as the signals from CSF, vascular sources and pulsations, motion and so on. The authors do not describe how they removed the noise components and how many ICs remained (and what they were). This leaves the reviewer to wonder if the "cortex–wide" component they identify as corresponding to the calcium slow–wave signal is, in fact, one of these noise components. There are a number of figures where the activation maps resemble the output of ICA that corresponds to motion artifact.

The reviewer argues that the authors do not show all the components and that therefore it would be difficult to know whether the “cortex-wide” component is indeed a true or just a noise component. In figure 4—figure supplement 4A-B, we show the signal of the “cortex-wide” ICA component to strongly correlate with the regressor of the GLM model used for the same animal. This correlation is significant for all the animals and this is clearly stated in the manuscript. The fact that this correlation is strong totally annihilates the idea of a spurious component. The authors cannot be sure about the reviewer having understood this point since the reviewer was never sure if a single subject ICA was performed or not.

e) The authors do not comment what ICs they have found – how many? What networks? Are the results expected for the rat brain? There are many excellent papers on brain networks derived from ICA in rodents they can compare results to.

Here, the reviewer wonders which components were found and if these results are expected in the rat brain under medetomidine. This point is explained in detail in figure 4—figure supplement 4C where the rat DMN can clearly be observed in two animals. In the text this issue is covered in detail in the subsection “Calcium slow wave event-related analysis reveals cortex-wide BOLD correlate” of the main manuscript, where we indeed compare these results to the mentioned papers on brain networks derived from ICA in rodent (yes these results are expected, yes they match the results of others).

[Editors' note: revisions were requested prior to acceptance, as described below.]

Summary:

The manuscript by Schwalm et al. investigates a macroscopic signal equivalent of spontaneous slow wave events in the brain. This study has two major strengths: i.e. modeling calcium waves using a design borrowed from task fMRI (but applied to resting–state data), and an attempt to correlate a component identified using the data–driven technique of ICA with the "contrast" obtained from the former model, in the same data set. The approach of simultaneously recording calcium activity in the cortex and acquiring whole–brain functional MRI (fMRI) in–vivo is considered elegant, and the examination of the relationship between a defined neurophysiological event and resting–state fMRI (rsfMRI) signals is highly relevant and of great interest. As such, this work is timely.

We thank the reviewers for this summary of our work. Investigating the relationship of neurophysiologically defined calcium wave events and the fMRI BOLD signal was indeed the main aim of our study. We now brought this objective into the focus of the manuscript and further highlighted the approach of correlating the pan-cortical activation component detected by model-free ICA with the GLM regressor.

However, the manuscript will require further analyses of the current data and all reviewers felt that the manuscript would benefit from scaling back on some of the claims and from discussing several missing references that are presently omitted. Specifically, it seems that some of the claims on the characteristics of the two brain states distract from the main strength of the paper – i.e. establishing a relationship between the calcium waves and the BOLD signal.

We fully agree with the reviewers that the relation between slow wave events and BOLD fMRI represents the essence and novelty of this work. We therefore significantly scaled back on our claims in relation to brain states. However, we still feel the need to contrast the bimodal nature of slow waves with a network activity in which these large amplitude slow waves are absent, for demonstrating the specificity of our findings. We refrained from the nomenclature of “desynchronized state” as this might indeed be misleading. The term “desynchronized” came into being as a description of the calcium traces, in line with the electrophysiology literature (e.g. Poulet and Petersen, 2008; Constantinople and Bruno, 2011; Eggermann et al., 2014). However, this indeed may not fittingly describe the large-scale network dynamics observed in BOLD fMRI measures. We rather now refer to this activity as “persistent”, unimodal activity (Constantinople and Bruno, 2011), which still describes the nature of the local network behavior reflected by the calcium readout but is not misleading regarding the BOLD activity. Indeed, during “persistent activity”, we do find spatially separated, specific network signatures such as the default mode network (Hsu et al., 2016b; Lu et al., 2012), highlighted in the revised version of the manuscript. We refrain from using the term “state”, as there might be different sub-states of both types of activity, and clearly, to describe and characterize brain states was not the main scope of this paper. We modified the figure set accordingly, and focus solely on slow wave activity in the main figures. Nonetheless, we feel that these experiments in the conditions of persistent, unimodal network activity are highly useful not the least as a control, strengthening the specific relation of slow wave events and their related BOLD fMRI correlate.

In response to the reviewer´s comments, we conducted several new analyses of the current data, focusing on the relationship of BOLD and slow calcium waves, and providing additional evidence for a specific relation of slow calcium wave events and fMRI BOLD by ruling out spurious sources, particularly in our ICA approach:

1) As mentioned above, the ICA component showing pan-cortical activation (new Figure 5A) in slow wave state is highly correlated to the GLM timecourse derived from optically detected calcium waves (new Figure 5B). Nevertheless, we share the reviewers concern regarding the ICA approach and now conducted group ICA for the slow wave datasets and now show the complete component set (new Figure 5—figure supplement 1). We identified components showing pan-cortical activation, both on the individual animal level (new Figure 5—figure supplement 1B), and in the group analysis (new Figure 5—figure supplement 1A). Additionally, we show that exclusively this pan-cortical component is related to higher power in the ultra-low frequency range (0-0.1 Hz) as expected for slow wave activity (new Figure 5—figure supplement 2A-D).

2) We already demonstrated that temporally mirroring the slow wave vectors of each dataset for obtaining the GLM regressors leads to a complete absence of BOLD, suggesting a non-spurious source of the observed pan-cortical activation. Using temporally unmatched regressors (Figure 3—figure supplement 3A, C) does not only lead to a complete lack of cortical activation (Figure 3—figure supplement 3B, D), but also these GLM regressors do not correlate anymore with the slow-wave related ICA component when using the cross-correlation approach (new Figure 5C). As we are well aware of the importance of these new cross-correlation controls, we now show them in main figure 5.

Additionally, we prepared an analysis showing that if the timecourse derived from the slow wave vector is regressed out of the data, the subsequent ICA does not show any pan-cortical components anymore (new Figure 5—figure supplement 2E, F).

3) We conducted seed-based analysis placing a seed ROI in the somatosensory cortex, the location we recorded the neuronal calcium transients from. Notably, confirming the slow calcium wave event-related analysis, also with the seed-based approach we again find pan-cortical activation during ongoing slow wave activity (new Figure 6A). The mean signal intensity in the seed-ROI also correlates high with the normalized signal of the previously identified pan-cortical component (new Figure 6B; new Figure 6—source data 1 – Table 2). Ongoing persistent activity on the other hand is characterized by spatially separated foci of BOLD activity showing typical connectivity patterns reflecting the inter-hemispheric connectivity between these sensory areas (e.g. Hodkinson et al., 2017) as shown in new Figure 6—figure supplement 1 and new Figure 6—source data 1 – Table 2. Finally, we now highlight more an optical calcium recordings-informed correlation analysis (new Figure 6C): when hemodynamic responses (HRs) upon previously detected slow calcium wave onsets in a ROI in somatosensory cortex are correlated with every remaining voxel in the brain, again a cortex-wide network becomes apparent. Independent of the location of the somatosensory ROI (right or left hemisphere) this correlation analysis revealed highest r-values for the entire cortex (Figure 6D; Figure 6—figure supplement 3).

4) We extended the analysis of network activation patterns. We now show that, independent of the condition, typical rs-networks can observed (new Figure 5—figure supplement 1 and 4), as described previously (Hsu et al., 2016b; Lu et al., 2012, Jonckers et al., 2011).

5) We conducted seed-based analysis to investigate potential hippocampal recruitment during slow wave activity, which indeed seems likely (Hahn et al., 2006; Chan et al., 2017). Employing an atlas-based selection of the seed-ROI encompassing the bilateral hippocampal formations, we now correlated activity in the hippocampal ROI to cortical BOLD (new Figure 6—figure supplement 2). This analysis revealed a pan-cortical correlation of the hippocampal ROI during slow wave activity.

During persistent activity, the pan-cortical BOLD correlation was absent, but frontal areas correlated with the hippocampus as it has been shown during awake or more active states (Sigurdsson et al., 2010; Li et al., 2015).

6) We added the missing references and discussed these studies appropriately.

Essential revisions:

1) The authors postulate that resting–state fMRI (rsfMRI) networks are broadly synchronized networks upon the presence of global slow waves. To study the contributions of global slow waves to rsfMRI, the authors used isoflurane anesthesia (1.1–1.8%) to induce and maintain slow wave activity. However, the rsfMRI network in "slow–wave state" (Figure 4—figure supplement 4A) is not a typical network observed in previous studies, while the "active desynchronized state" induced by medetomidine is consistent with previously reported rodent rsfMRI studies.

Slow wave activity has long been described as a multiscale phenomenon, present on the single neuron level with the typical bimodality, rather hyperpolarized Down states and rather de-polarized and stereotypical Up states (e.g. Sanchez-Vives, Massimini and Mattia, 2017). These transitions between Up and Down states can occur synchronously in larger populations as identified by optic-fiber-based calcium recordings or LFP recordings (which represents the most common readout for this type of activity, starting from the seminal experiments of Mircea Steriade) and can even be detected in whole brain readouts as EEG (see for instance Massimini et al., 2004). In all the mentioned readouts if by patching a cell or looking at ensemble activity – and this may be in vivo or in vitro recordings – the most prominent feature of this activity is bistability: the reoccurrence of a stereotypical spontaneous neuronal response – slow waves – while between these responses the network remains silent. From previous work we know that these waves may travel across the cortex as well as to subcortical areas (e.g. Stroh et al., 2013; Massimini et al., 2004), a property which we cannot resolve with BOLD fMRI because of its low temporal resolution (1s of fMRI sampling rate versus 30-37mm/s wave propagation). Still, it is of immense interest for a broad neuroscientific community what the actual BOLD correlate of this activity might be and which brain areas are recruited by a locally recorded wave. It is indeed highly likely that the propagation of these waves relies on spreading activity of local networks (Sanchez-Vives, Massimini and Mattia, 2017), which is why we correlated the BOLD activity to a locally precise readout of neurophysiologically defined slow wave events based on calcium transients.

We furthermore agree with the reviewer, that indeed the direct BOLD correlate of the slow wave activity has not been identified in earlier studies, as this requires the very analysis we put forward in our manuscript. But nonetheless, a pan-cortical/cortex-wide activation was reported in previous work using similar anesthetic regimens (Kalthoff et al., 2013), and it has been speculated, that a pan-cortical activation could have its source in slow wave activity, but it could not unambiguously be assigned to this phenomenon (Liu et al., 2011; Kalthoff et al., 2013; Pan et al., 2013).

Congruently, during persistent activity, which supposedly reflects a network which is more active and therefore richer in complexity, lacking the bistability of slow wave activity, we find typical spatially complex networks such as the default mode network, referred to as “resting state networks”, as identified in many other studies.

It would be important to show typical rsfMRI networks, such as interhemispheric/bilateral somatosensory, visual and auditory networks (1–3) for both experimental conditions. Using ICA analysis, which the authors have already done, to identify such typical rsfMRI networks will be sufficient to address this concern.

We thank the reviewer for this suggestion. We analyzed our data accordingly, and as mentioned above, for both experimental conditions could indeed identify typical rsfMRI networks previously described (see new Figure 5—figure supplement 1 and 4). In addition to the already identified default mode network activation (Hsu et al., 2016b; Lu et al., 2012, Jonckers et al., 2011) observed during persistent activity (new Figure 5—figure supplement 1 and 4A), we identified another component putatively recruiting resting state auditory networks involving sensorimotor (medial superior) and auditory (inferior arietal) cortices (new Figure 5—figure supplement 4B).

During slow wave activity, additionally to the pan-cortical component, by using ICA we can now also identify networks resembling typical resting state patterns, as e.g. auditory and visual cortex, as well as hippocampus.

These results are in line with the work of others characterizing rat resting state networks (e.g. Jonckers et al., 2011)

2) The isoflurane anesthesia used in this study was higher than previous rodent rsfMRI studies. In addition, Liu et al., showed that the interhemispheric somatosensory network gradually merged from a spatially specific network under light anesthesia (1.0% isoflurane) into a highly synchronized and spatially less specific network under deep anesthesia (1.8% isoflurane) (4). The reviewers appreciate the technical difficulty of this experiment and do not suggest additional experiments. However, given that the range of isoflurane levels as stated is very large, categorizing the individual animals based on their approximate experimental anesthesia levels would be very informative and should be added as a table, perhaps in the Supplement. Additionally, the authors should comment on how the different levels of anesthesia affected the network activity and how this was handled in interpreting their data.

We used relatively high levels of isoflurane concentrations as we were aiming to achieve slow wave activity around 0.1 Hz. As depth of anesthesia is highly dependent on the physiological state of the animal we relied on the online calcium signal readout we had available to ensure stable slow wave activity throughout the measurements and adjusted the isoflurane level accordingly, to achieve a rather uniform occurrence of slow waves. Consequently, while the absolute level of isoflurane anesthesia varied, based on many parameters such as length of anesthesia, we achieved rather constant conditions in terms of the characteristics of slow waves.

We already showed in earlier work, that by varying anesthesia levels on intra-individual level, we indeed observed a direct relation of the level of anesthesia and the occurrence of slow waves (see Figure S4 panel E in Stroh et al., 2013. Neuron)

Furthermore, we feel that our results perfectly match the findings of Liu et al.: in lightly anesthetized or sedated condition – termed persistent activity based on our real-time calcium recordings – we also identified the typical rat default mode network. We, however, use the calcium recordings to stably maintain slow wave (or persistent) activity.

Please find below the table of the respective anesthesia levels for the reviewer´s appreciation. We would, however, not show this table in the manuscript, as this might mislead the readers. The strength of our study lays in our approach to maintain a very stable network activity using calcium recordings, not relying on variable isoflurane levels. As mentioned above, the slow wave occurrence as identified in the calcium recordings is the main variable, and the different anesthesia levels were adjusted to maintain these values. Therefore, while we present this very table here, we would not deem it useful to include it in the manuscript, but would of course follow the reviewer´s suggestion, if he/she still deems it important.

ExperimentMean SW frequency (Hz)Isoflurane (%)
C1E10.171.6
C1E20.161.3
C20.171.1
C30.221.6
C3a0.161.8
C40.181.5
C50.11.7
T10.181.5
T20.21.4

3) The authors concluded that slow waves provide a temporal framework for long–range coherence. However, previous studies have also shown that long–range coherence exists under active desynchronized state (e.g., under medetomidine sedation). In fact, the authors identified default mode network (DMN) activity under this state. One could argue that DMN also demonstrates the characteristics of long–range coherence in the brain. We urge that the authors clarify in the text what they mean by long–range coherence (i.e., through slow wave) in the present manuscript, and they should also specifically discuss the difference(s) to other long–range networks that are also identified under active desynchronized state.

We apologize for this confusion and agree with the reviewers regarding the need for clarification on terminology and proposed function. As coherence is mainly an EEG-related term we decided to refrain from this terminology. The bistable “default” state of slow oscillations or slow waves may be of low complexity (Sanchez-Vives, Massimini and Mattia, 2017; Bettinardi et al., 2015), but cortically it can “spread smoothly like an oil-spot” (Sanchez-Vives, Massimini and Mattia, 2017), eventually recruiting the entire cortex.

A recent study by Leong et al., (2016) showed that low-frequency slow waves can propagate robustly through long-range excitatory projections e.g. from the thalamus to the cortex, which is not a contradiction to the aforementioned idea that slow wave activity can also spread cortico-cortically from cell assembly to cell assembly.

As mentioned by the reviewer, the persistent activity is mainly characterized by a spatially specific pattern of network activity (see new Figure 5—figure supplement 4), likely relying on long range connectivity. We added up upon this topic in the Discussion.

4) A recent paper by Ma et al., also examined the relationship between neuronal events detected through calcium recordings and resting–state hemodynamic signals through optical methods (5). They found clear evidence for the contribution of excitatory neural activity underlying resting–state hemodynamic patterns in the awake and anesthetized brain (i.e., interhemispheric/bilateral functional connectivity). Additionally, earlier work by Matsui et al. also utilizing simultaneous monitoring of neuronal calcium signals and resting–state hemodynamic signals identified two types of large–scale spontaneous patterns (i.e., global waves propagating across neocortex and transient co–activations such as interhemispheric connectivity) (6). Thus, the reviewer suggests two essential revisions. First, the present manuscript should acknowledge these prior works, discuss and compare the findings, as these prior studies are highly complementary.

We fully agree that these two studies are of high relevance and complementary to our work and now mention them prominently already in the introduction of the revised manuscript version as they confirm our findings of slow propagating calcium waves and a related hemodynamic signal.

These two studies correlated hemodynamic fluctuations with wide-field calcium imaging. Ma et al., (2016) convolved these two signals and Matsui et al., (2016) compared functional connectivity during different transient calcium signals. The results support the notion of resting-state hemodynamics being coupled to underlying patterns of excitatory neuronal activity, but particularly lower-frequency hemodynamic fluctuations were not well-predicted (Ma et al., 2016). Evidence was found that global calcium activity is linked to the hemodynamic activity and that the spatial information of the cortical network’s functional connectivity may be embedded in the phase of global calcium waves (Matsui et al., 2016).

However, we did conduct a different methodological approach: we identified calcium waves and used them as a regressor for the BOLD fMRI timecourse and asked, whether any component of the BOLD signal is related to it. Therefore, while we certainly agree with the reviewers that these two studies are important in the context of our work and are beautifully conducted, they are indeed complementary, as we start with the calcium wave, and these studies rather correlate the hemodynamic signals to the calcium activity, without defining specific events.

We thank the reviewers for pointing out these studies and now acknowledge them in the introduction and compare their findings to ours to grant the complementarity of their and our results.

Furthermore, authors should also justify the use of the current analysis technique to examine the relationship between calcium signals and rsfMRI BOLD signals and they should also discuss why they used a different approach than the approach used by prior studies as the general objective were largely similar.

As explained above, the initial idea of our study was to exclusively determine BOLD activity during the active phases of slow wave activity. As we recorded calcium slow waves of a local population with state-of-the-art methods (Stroh et al., 2013; Adelsberger et al., 2014; Zhang et al., 2017) and assured the extraction of these waves from the ongoing signal to be in line with previous studies in the field of slow wave activity (e.g. of the group of Maria Sanchez-Vives who is working on this topic since decades employing electrophysiological methods), we are confident regarding the spatiotemporal precision of our event detection. The subsequently employed event-related fMRI analysis is well suited for this approach as any type of previously defined event, may this be brief epochs of stimulus presentation as in the classical use of this analysis within an event-related design in human fMRI, or neurophysiologically defined events extracted from our calcium signal, can be used as an regressor to detect related BOLD responses. Additionally, the approach is straight-forward as it is built-in for commonly used analysis software (spm) and therefore could be of advantage for many researchers, including translational human studies which have secondary readouts from EEG-signals. Other studies relating low-frequency activity (e.g. LFP signals, or the previously mentioned large-scale calcium readouts) to rsfMRI/BOLD or hemodynamic signals in most of the cases merely correlated the ongoing signal to BOLD. At least we are not aware of any study comparing only the epochs of activity (slow wave events or “population up-states”) during slow wave activity to the BOLD signal. Our work started with this aim and later on expanded on the investigation of the ongoing signal (e.g. see our new seed-based approach) exactly to be able to compare our results to the ones of others. Nevertheless, we acknowledge the reviewers concern regarding the GLM based model and therefore now included several control analyses, which we mention in detail below.

We certainly agree with the reviewers that it is an essential point of this revision to integrate results of previous work more into the Discussion section of the manuscript as well as discussing and comparing the methods of others. We followed this request and included a new paragraph in the Introduction as well as in the Discussion section upon this topic.

Second, the comparison of BOLD signal extracted from 30 most active voxels and from an ROI (Figure 3—figure supplement 1) showed apparent delay in the peak and onset. Is this in anyway related to certain propagation characteristics as alluded by (6) and prior work done by the authors (7)? If so, the authors should characterize this phenomenon as it is highly interesting.

We definitely agree with the notion of this comment, that indeed our global activation may represent traveling waves as it is suggested by the work the reviewers mention but also by many others (e.g. Massimini et al., 2004). Nevertheless, to draw the conclusion regarding propagation characteristics upon a delay in the peak and onset of the BOLD signal would be an overinterpretation of our data. With the slow sampling rate of fMRI (1s) we are undersampled to be able to make this claim. Again, we agree that it is very likely that this propagation exists, as it is exactly what the work of Matsui et al. and previous work from our lab (Stroh et al., 2013) shows, however both using methods with high sampling rates, but the inherent slow sampling rate of classical fMRI will unfortunately not be able to resolve the propagation speed in the rodent brain (~ 30 mm/s). Recently introduced so called line-scanning techniques (Yu et al., 2014) would be a way to resolve traveling slow waves in fMRI data in future studies as we now mention in the discussion of the revised manuscript version.

In addition, a recent work by Leong et al. also demonstrated that the low frequency or slow waves can propagate robustly through long–range excitatory projections. Offering a multi–faceted view in the context of rsfMRI will definitely increase the impact of the present study.

We agree with the reviewer’s comment and expanded the discussion upon this topic to ensure the mentioned multi-faceted view in the context on rsfMRI and cite the work of Leong et al., 2016.

5) At present, the authors attempt to claim that cortex–wide BOLD activity was identified only in slow wave state but not in the active desynchronized state and attribute their findings to different brain states by conducting the experiments under isoflurane anesthesia and medetomidine sedation. As eluded already above, this claim is generally too broad and simplistic. Moreover, the present finding is insufficient to support such assertions, unless awake animal experiments are conducted. In fact, this message distracts the reader from the core findings of the study, which is correlating a neuronal event (i.e., calcium slow wave activity) to brain–wide rsfMRI hemodynamic signals. The core message however, is not examining such relationship at different "states", which was the major reason the paper was rejected in the first place. The authors are certainly aware that brain states fluctuate temporally whereby different states are only dominant for a certain period. Moreover, certain features of the rsfMRI such as interhemispheric functional connectivity are also present at both states. Hence, it is a gross oversimplification to assign binary representations for the characterized brain states. Scaling back on these claims and better emphasizing the strength of the paper – i.e. relationship between the calcium waves and the fMRI will address the reviewers' concerns.

We agree with the reviewers that the emphasis of the manuscript – indeed the relationship between slow calcium waves and BOLD fMRI – has to regain strength in this work. We are definitely aware of the fact that brain states may fluctuate over time and represent ongoing phenomena, which are not binary and we never intended to claim any categorical or binary state characteristics. We agree that this would be an oversimplification of the data presented. We apologize for giving this impression in the previous version of the manuscript and address the reviewers concerns by scaling back on the brain state related claims and by emphasizing the strength of the manuscript as mentioned above, focusing on the relation of slow waves and their corresponding BOLD correlates. Just to clarify this issue, we want to state that the presented types of neuronal activity (slow wave and persistent activity), represent two extreme cases of continuously fluctuating states of the neural network. Classifications of such states indeed have been done before (see below figure of Renart et al., for in vivo data and Mattia and Sanchez-Vives for simulated networks), but as the reviewers correctly point out, are neither the emphasis of our study nor the correct envision for our data. Exactly because of the fact that certainly, the underlying anatomical connectivity is identical in both conditions, overlapping activity signatures likely do exist. Indeed we now can demonstrate that this is the case: when inspecting the complete component set revealed by group ICA of the slow wave data, also here classical rs-networks and interhemispheric connectivity can be identified. For example the auditory resting state network is present during both types of activity (Figure 5—figure supplement 1 and 4).

So the reviewers are indeed right, although apparently dominated by the cortex-wide BOLD activation related to slow wave activity, also rs-networks (which can be found under different conditions) remain to be present during slow wave activity – a finding which seems reasonable as these networks are discussed to mirror basic functional connectivity.

We nonetheless base our concept on two conditions in which a) large amplitude calcium waves mirroring slow oscillations are present (slow wave activity) and b) a sedated condition, in which these slow oscillations are absent (persistent activity). Thereby we are not contradicting or challenging earlier studies, we rather provide an additional variable, which is already used in basic neuroscience since many years, and translate the concept of relating local neurophysiological measures of slow waves to the field of neuroimaging. We however, feel that investigating the conditions under which no slow waves are present highlights the specificity of our findings and serves as an important control condition. Nevertheless, as this control is not the main focus of our study, we now present exclusively the slow wave activity related results in the main figures (please also refer to Fig. S1 from Renart et al., 2010, and Figure 4D from Mattia and Sanchez-Vives, 2012).

6) The authors stated that slow wave activity represents a brain state indispensable for memory consolidation. Knowing that the hippocampus plays a major role in memory consolidation, it would be interesting to also explore the BOLD fMRI signals in the hippocampus, but this is not an essential revision.

It was previously reported that slow waves also engage the hippocampus (Sirota, Csicsvari, Buhl, & Buzsaki, 2003; Hahn, Sakmann and Mehta, 2006; Ji and Wilson, 2007; Busche et al., 2015), suggesting that the slow wave associated excitation plays a synchronizing role in cortico-hippocampal functional coupling (Hahn, Sakmann, & Mehta, 2006).

A very recent study by Chan et al., (2017) which we now cite, investigates this issue in beautiful detail.

As indeed we occasionally observed hippocampal BOLD activation during slow waves which we already reported in the previous version in the manuscript, we thank the reviewers for this comment and now conducted an atlas-based seed-ROI analysis for the hippocampus (Figure 6—figure supplement 2). This analysis revealed that voxel in the hippocampal ROI correlate well with cortical voxel, again spanning the entire cortical surface during ongoing slow wave activity, but lacking such a pan-cortical component under medetomine sedation.

7) As stated in the previous review there was serious concerns related to the computational/analytic processing of the fMRI signal.

– The authors should provide a convincing argument that their "global signal" is not a processing or acquisition artifact.

We fully agree with the reviewer´s comment that we have to rule out any sources which may result in the observed cortex-wide activity patters, and which are not related to the optically recorded slow waves. We now conducted a new set of analyses (set in italics) and we strongly believe that we demonstrate this very relation beyond reasonable doubt. We here mention possible sources of artefacts and address them point by point:

a) Technical artefact

When slow wave vectors used as regressors for the subsequent BOLD fMRI analysis are temporally distorted, either by swapping them between animals/experiments or by temporally mirroring them, pan-cortical activation vanishes completely (Figure 3—figure supplement 4), and the correlation between the GLM timecourse and the ICA component disappears (Figure 5C). These results speak for the slow wave events being temporally informative for these analyses.

b) Physiological/non-physiological noise artefact

See A); in addition we compare these results to a type of neural activity which lacks the slow wave component and which is phenomenologically similar to an persistent/active type of ensemble activity when observing the calcium readouts (Figure 5—figure supplement 3). This physiological control for slow wave specificity of our results indeed revealed the absence of a pan-cortical component also in seed-based analyses. As both network conditions were achieved in the same animal, this rules out potential confounds or artifacts related to subject-specific noise, which would have been present in both measurements.

c) Data processing artefact

We rely on three independent methods for the analysis of our data: (1) a classical GLM-based approach (event-related analysis employing simultaneously acquired slow calcium wave events; Figure 24), and two model-free techniques (2) ICA (Figure 5) and (3) seed-based analysis (Figure 6). We identify pan-cortical activity in all of these analyses. While each method clearly has its limitations, and we significantly expanded on the IC analysis (see below), we believe that it is highly unlikely that an analysis artefact is the source of our finding. Even more so, as pretreatment (preprocessing) and handling of the data in the analysis types we used is slightly different (see Material and Methods part) it is unlikely that a data processing artifact is causing the global signal in the slow wave related data only. Also, we now show that regressing out the slow wave vector extracted from the calcium measurements from the data leads to the absence of pan-cortical components in the IC analysis (Figure 5—figure supplement 2F).

d) Artefact of non-neuronal source.

We employed calcium indicators reflecting only neuronal activity (GCaMP6 under control of an excitatory neuronal promoter) and could identify the same slow calcium wave with the same dynamics, ruling out major non-neuronal contributions.

ICA decomposition always produces a substantial number of noise components from white matter, CSF, cardiac and respiratory sources. The authors do not mention if or how they dealt with them. They do not mention if their data was pre–whitened prior to submission to ICA. They do not present their component set and discuss it. Further, claims regarding the 'event–related' regressor and global signal would also have been burnished by thoughtful treatment of other potential extraneous signal noise such as drift, fMRI lag, temporal autocorrelation etc.

In the previous version of the manuscript we initially extracted 17-22 components for each experiment, based on the minimum description length criterion (MDL), which should avoid choosing too few components (please see also below). In this previous analysis we calculated the number of components for each dataset separately employing MDL. We now implemented a group ICA approach (equally based on the MDL method for component identification) where we show the complete component set and identify meaningful components by comparing the network activity they reveal with the work of others. Based on the results of the group ICA we chose the number of components for the single subject IC analysis.

Further evidence on the specificity of the pan-cortical component (other than its absence in persistent state, see above) is also presented now by regressing out the timecourse derived by the slow wave vector obtained from the calcium signal, leading to a complete absence of this pan-cortical component.

We now added detailed information about the ICA processing steps (as well as about the GLM) in the Material and methods section. The ICA data is pre-whitened and drift corrected, the GLM data is preprocessed in line with other studies (realignment, reslicing and smoothing), serial autocorrelation was performed and we now describe these steps accordingly in the revised manuscript. We apologize that this information was insufficiently provided in the previous version.

Why has this global signal not been described in rsfMRI before, and if so, please cite the literature where such a "global signal" has been described before.

A pan-cortical signal component had previously been described in other studies (see below), but the origin of this signal was not neurophysiologically well-defined. But since the implementation of calcium recordings alongside fMRI recordings, the same pan-cortical activation, following our event-related approach, had been reported in mouse by the group of Markus Rudin (Schlegel et al., 2017).

As explained above, we would not necessarily relate slow waves induced by deep anesthesia to the classical definition of resting state activity as this has been defined in awake human subjects. Nevertheless, as mentioned, the extent of cortical recruitment by a locally measured slow wave event (our event-related analysis), as well as the networks present during ongoing slow wave activity (our seed-based and ICA approach), is of high interest for the community as slow wave activity is an extensively studied phenomenon.

Indeed, under similar conditions such global signals have been described, e.g. by Liu et al., 2011 as well as by Kalthoff et al., 2013. As already speculated by Kalthoff and colleagues, the global signal removal step – often applied in rs studies – might conceal this very component identified here, under experimental conditions in which slow waves could in principle occur (rather deep anesthesia). Kalthoff et al., (2013) speculated that such a signal exists and may be related to slow wave activity.

Also, Murphy and colleagues described a similar result for EEG activity under Propofol anesthesia in human subjects (Murphy et al., 2011; see their Figure 1C). Deco et al., (2014) modeled that when neuromodulators decrease to very low levels (as it is likely the case during deep anesthesia), slow waves become global and resting-state networks merge into a single undifferentiated, synchronized network.

In their beautifully designed study employing optogenetics, Leong et al., (2016) also show a broad cortical activation for waves traveling upon stimulation at a low frequency (1Hz; see their Figure 2B upper panel).

Also, Matsui et al. show global cortical waves (compare their Figure 2A upper last panel).

But clearly, the concept of relating only the slow wave events to the simultaneously acquired BOLD fMRI signal is novel and represents the main advance of this study. We now cite the literature mentioned here in the revised version of the manuscript.

– It is difficult to understand why the rsfMRI ICA model suggests that under deep anesthesia, a neuronal component appears that represents wide activation. The rsfMRI ICA is not contingent on the calcium wave model – it was just regressed against it. Please explain this confusion.

As explained it is likely that the global activity we observe is actually a traveling/expanding wave which is passed on to neighboring local networks (Sanchez-Vives, Massimini and Mattia, 2017). The work of Matsui et al. using similar readouts (large-scale calcium imaging) also shows a widespread activation during slow wave activity. Additionally, the merging of activity to a global signal was modeled in silico by Deco et al., (2014). For details please see also replies above.

– Please explain how your data unambiguously demonstrates that the fMRI signals come from neuronal sources.

For the exclusion of non-neural (or non-physiological) source please see above points A-C. Specifically for the exclusion of non-neuronal sources:

D: We employed calcium indicators reflecting only neuronal activity (GCaMP6 under control of an excitatory neuronal promoter) and could identify the same slow calcium wave with the same dynamics, ruling out major non-neuronal contributions.

Additionally, to show what removing the influence of the neuronal source produces in the BOLD signal, we now regressed out the calcium wave regressor from our data, which leads to the complete elimination of meaningful results in the BOLD signal when used in the ICA.

– Please provide more methodological detail for the fMRI methods used.

We extended the method section accordingly and also structured the fMRI methods by analysis approaches by using sub-headings.

– The pipeline used (HRF, task–based contrast modeling) is very vulnerable to artifacts. The link with neuronal activity is novel, and thus, it will be extremely important to be very cautious with making claims. This should be specifically addressed in the discussion.

We scaled back on our claims and addressed these issues in the discussion. We put our results, which fit very well to the assumptions previous authors made, in perspective to the literature cited above.

– The authors should clarify whether they performed group or single subject ICA notwithstanding their presentation of single subject results.

In the revised version of the manuscript we now performed group ICA (Figure 5—figure supplement 1A). We additionally present single subject results. We extended the Materials and methods section accordingly and also clarify this in the results and apologize for the confusion.

– While the authors in their rebuttal provide some additional information as to their conduct of the ICA, this was not reassuring. At the heart of every ICA is the choice the researcher must make as to how many components to model. Model order is critical to the number and kind of components produced and the interpretation of results. Contrary to the authors assertion, the choice of model order is not "arbitrary". Please clarify were 4 or 17 or 22 PCs/ICs specified in the model? Were the number of PCs and ICs the same or different? Were different ICs used in different animals? If only 4 ICs were specified, one wonders if this drove the production of a single, ostensibly 'global' signal. If 17–22 ICs were specified, one wonders what all those other ICs were.

In our new group ICA (Figure 5—figure supplement 1) we now defined the number of components by using the minimum description length criterion (MDL; Li et al., 2007; see also below). This statistical parameter estimation revealed 37 ICs, which were then inspected visually, and ICs that showed activity outside of the brain only were discarded. By this procedure a number of 23 ICs remained, which in our view provides a good equilibrium between extracting sufficient components for not artificially producing a single global signal – as mentioned by the reviewer – and identifying a reasonable number of meaningful components in terms of resulting network activity (see our results explained above). Based on the result of this group IC analysis we set the number of components for the ICAs performed on single-subject basis to 20 (Figure 5, Figure 5—figure supplement 1 and 4), as group analysis provides a good basis to choose components for each individual subject and 20 is a reasonable starting number for ICs in single subject analysis within the framework of resting state data (e.g. Li and Wang, 2015).

We apologize for the previous confusion regarding PCs/ICs: PCs are used for pre-whitening of the data. For the group-level-ICA (n=4), first, the number of principal components (PC) is calculated from all data, taking into account the number of independent components. In our case this resulted in 56 PCs for the pre-whitening step. For ICAs performed on single subject basis (n=15) the number of PCs used for pre-whitening equals the number of ICs, as here only one calculation step is performed.

We rephrased the Materials and methods section accordingly to make our approach better comprehensible. We explain how numbers of ICs were derived, state the number of PCs in the pre-whitening steps and provide all the parameters used within the employed “Group ICA of fMRI Toolbox (GIFT)”-toolbox.

–The authors should discuss the significant drawbacks of ICA (as opposed to e.g. cluster or seed based methods) as it produces a large number of noise components along with actual gray matter maps. There is an entire field of research dedicated to the better, automated identification of components. The authors have not detailed any of their QC process, presented their component sets or even acknowledged the context and complexity of component identification in ICA. The authors need to discuss the issues associated with this approach.

We thank the reviewer for this comment; we expanded the method section and the discussion accordingly. ICA is only one of several analyses we performed and our finding of pan-cortical BOLD activity related to slow wave activity has been identified by different paralleled approaches, now additionally by seed-based methods. Importantly, here the main signal intensities in the seed-ROIs (S1 and hippocampus) correlate high with the normalized signal of the pan-cortical ICs in those animals (Figure 6B and Figure 6—source data 1 – Table 2 for S1 data; Figure 6—figure supplement 2B and Figure 6—source data 2 – Table 3 for hippocampus data). We are aware of the drawbacks of ICA and for clarification now show the complete component set, including the potential noise components. For identification of components we used the minimum description length (MDL) criterion, which was specifically developed for ICA applied to fMRI data (Li et al., 2007) and is implemented in the GIFT toolbox we used. We discuss the drawbacks of ICA now thoroughly in the Discussion section.

https://doi.org/10.7554/eLife.27602.030

Article and author information

Author details

  1. Miriam Schwalm

    1. Focus Program Translational Neurosciences, Institute for Microscopic Anatomy and Neurobiology, Johannes Gutenberg-University Mainz, Mainz, Germany
    2. GRADE Brain, Goethe Graduate Academy, Goethe University Frankfurt am Main, Frankfurt, Germany
    Contribution
    Conceptualization, Formal analysis, Investigation, Visualization, Writing—original draft, Writing—review and editing
    Contributed equally with
    Florian Schmid, Lydia Wachsmuth, Cornelius Faber and Albrecht Stroh
    Competing interests
    No competing interests declared
    ORCID icon "This ORCID iD identifies the author of this article:" 0000-0003-4162-2298
  2. Florian Schmid

    Department of Clinical Radiology, University Hospital Münster, Münster, Germany
    Contribution
    Data curation, Formal analysis, Visualization, Methodology, Writing—review and editing
    Contributed equally with
    Miriam Schwalm, Lydia Wachsmuth, Cornelius Faber and Albrecht Stroh
    Competing interests
    No competing interests declared
  3. Lydia Wachsmuth

    Department of Clinical Radiology, University Hospital Münster, Münster, Germany
    Contribution
    Data curation, Methodology, Writing—review and editing
    Contributed equally with
    Miriam Schwalm, Florian Schmid, Cornelius Faber and Albrecht Stroh
    Competing interests
    No competing interests declared
  4. Hendrik Backhaus

    Focus Program Translational Neurosciences, Institute for Microscopic Anatomy and Neurobiology, Johannes Gutenberg-University Mainz, Mainz, Germany
    Contribution
    Data curation, Formal analysis, Visualization
    Competing interests
    No competing interests declared
  5. Andrea Kronfeld

    Focus Program Translational Neurosciences, Institute for Microscopic Anatomy and Neurobiology, Johannes Gutenberg-University Mainz, Mainz, Germany
    Contribution
    Formal analysis, Visualization
    Competing interests
    No competing interests declared
  6. Felipe Aedo Jury

    Focus Program Translational Neurosciences, Institute for Microscopic Anatomy and Neurobiology, Johannes Gutenberg-University Mainz, Mainz, Germany
    Contribution
    Data curation, Formal analysis, Visualization
    Competing interests
    No competing interests declared
  7. Pierre-Hugues Prouvot

    Focus Program Translational Neurosciences, Institute for Microscopic Anatomy and Neurobiology, Johannes Gutenberg-University Mainz, Mainz, Germany
    Contribution
    Data curation, Formal analysis, Visualization
    Competing interests
    No competing interests declared
  8. Consuelo Fois

    Focus Program Translational Neurosciences, Institute for Microscopic Anatomy and Neurobiology, Johannes Gutenberg-University Mainz, Mainz, Germany
    Contribution
    Data curation
    Competing interests
    No competing interests declared
  9. Franziska Albers

    Department of Clinical Radiology, University Hospital Münster, Münster, Germany
    Contribution
    Data curation
    Competing interests
    No competing interests declared
  10. Timo van Alst

    Department of Clinical Radiology, University Hospital Münster, Münster, Germany
    Contribution
    Data curation
    Competing interests
    No competing interests declared
  11. Cornelius Faber

    Department of Clinical Radiology, University Hospital Münster, Münster, Germany
    Contribution
    Conceptualization, Funding acquisition, Project administration, Writing—review and editing, Equally contributing last author
    Contributed equally with
    Miriam Schwalm, Florian Schmid, Lydia Wachsmuth and Albrecht Stroh
    Competing interests
    No competing interests declared
    ORCID icon "This ORCID iD identifies the author of this article:" 0000-0001-7683-7710
  12. Albrecht Stroh

    Focus Program Translational Neurosciences, Institute for Microscopic Anatomy and Neurobiology, Johannes Gutenberg-University Mainz, Mainz, Germany
    Contribution
    Conceptualization, Supervision, Funding acquisition, Writing—original draft, Project administration, Writing—review and editing
    Contributed equally with
    Miriam Schwalm, Florian Schmid, Lydia Wachsmuth and Cornelius Faber
    For correspondence
    albrecht.stroh@unimedizin-mainz.de
    Competing interests
    No competing interests declared
    ORCID icon "This ORCID iD identifies the author of this article:" 0000-0001-9410-4086

Funding

Deutsche Forschungsgemeinschaft (Fa474/5)

  • Cornelius Faber

Deutsche Forschungsgemeinschaft (SFB 1080)

  • Albrecht Stroh

Deutsche Forschungsgemeinschaft (SFB 1193)

  • Albrecht Stroh

Deutsche Forschungsgemeinschaft (SPP 1665)

  • Albrecht Stroh

Focus Program Translational Neurosciences

  • Miriam Schwalm
  • Albrecht Stroh

Interdisciplinary Center for Clinical Research Münster (Fa3/1603,PIX)

  • Cornelius Faber

Excellence Cluster Cells in Motion (EXEC 1003)

  • Cornelius Faber

The funders had no role in study design, data collection and interpretation, or the decision to submit the work for publication.

Acknowledgements

This work was supported by the DFG (Fa474/5, SFB 1080, SFB 1193, SPP 1665); the Focus Program translational Neurosciences (ftn), the Interdisciplinary Center for Clinical Research Münster (Fa3/1603, PIX) and the Excellence Cluster Cells in Motion (DFG EXEC 1003). We thank Nina Nagelmann for excellent technical assistance; Lara Hamzehpour for helping with data collection and analysis; Nathalie Just, Eduardo Rosales Jubal and Kenneth Yuen for advice.

Ethics

Animal experimentation: Animal husbandry and experimental manipulation were carried out according to animal welfare guidelines of the Westfalian Wilhelms-University and the Johannes Gutenberg-University Mainz and were approved by the Landesamt für Natur-, Verbraucher- und Umweltschutz Nordrhein-Westfalen, Recklinghausen, Germany (animal protocol number: 84-02.04.2015.A427), and the Landesuntersuchungsamt Rheinland-Pfalz, Koblenz, Germany (animal protocol number: G 14-1-040). All surgery was performed under deep isoflurane anesthesia.

Reviewing Editor

  1. Jan-Marino Ramirez, Seattle Children's Research Institute and University of Washington, United States

Version history

  1. Received: April 7, 2017
  2. Accepted: September 14, 2017
  3. Accepted Manuscript published: September 15, 2017 (version 1)
  4. Accepted Manuscript updated: September 19, 2017 (version 2)
  5. Version of Record published: October 26, 2017 (version 3)

Copyright

© 2017, Schwalm et al.

This article is distributed under the terms of the Creative Commons Attribution License, which permits unrestricted use and redistribution provided that the original author and source are credited.

Metrics

  • 4,007
    Page views
  • 710
    Downloads
  • 57
    Citations

Article citation count generated by polling the highest count across the following sources: Scopus, Crossref, PubMed Central.

Download links

A two-part list of links to download the article, or parts of the article, in various formats.

Downloads (link to download the article as PDF)

Open citations (links to open the citations from this article in various online reference manager services)

Cite this article (links to download the citations from this article in formats compatible with various reference manager tools)

  1. Miriam Schwalm
  2. Florian Schmid
  3. Lydia Wachsmuth
  4. Hendrik Backhaus
  5. Andrea Kronfeld
  6. Felipe Aedo Jury
  7. Pierre-Hugues Prouvot
  8. Consuelo Fois
  9. Franziska Albers
  10. Timo van Alst
  11. Cornelius Faber
  12. Albrecht Stroh
(2017)
Cortex-wide BOLD fMRI activity reflects locally-recorded slow oscillation-associated calcium waves
eLife 6:e27602.
https://doi.org/10.7554/eLife.27602

Further reading

    1. Neuroscience
    Alex TL Leong, Ed X Wu
    Insight

    Simultaneous measurements of neuronal activity and fMRI signals in the rat brain have shed new light on the origins of resting-state fMRI connectivity networks.

    1. Genetics and Genomics
    2. Neuroscience
    Yoshifumi Sonobe, Soojin Lee ... Paschalis Kratsios
    Research Article Updated

    A hexanucleotide repeat expansion in C9ORF72 is the most common genetic cause of amyotrophic lateral sclerosis (ALS) and frontotemporal dementia (FTD). A hallmark of ALS/FTD pathology is the presence of dipeptide repeat (DPR) proteins, produced from both sense GGGGCC (poly-GA, poly-GP, poly-GR) and antisense CCCCGG (poly-PR, poly-PG, poly-PA) transcripts. Translation of sense DPRs, such as poly-GA and poly-GR, depends on non-canonical (non-AUG) initiation codons. Here, we provide evidence for canonical AUG-dependent translation of two antisense DPRs, poly-PR and poly-PG. A single AUG is required for synthesis of poly-PR, one of the most toxic DPRs. Unexpectedly, we found redundancy between three AUG codons necessary for poly-PG translation. Further, the eukaryotic translation initiation factor 2D (EIF2D), which was previously implicated in sense DPR synthesis, is not required for AUG-dependent poly-PR or poly-PG translation, suggesting that distinct translation initiation factors control DPR synthesis from sense and antisense transcripts. Our findings on DPR synthesis from the C9ORF72 locus may be broadly applicable to many other nucleotide repeat expansion disorders.