Electrical activity controls area-specific expression of neuronal apoptosis in the mouse developing cerebral cortex
- University Medical Center of the Johannes Gutenberg University Mainz, Germany
Figures
Figure 1
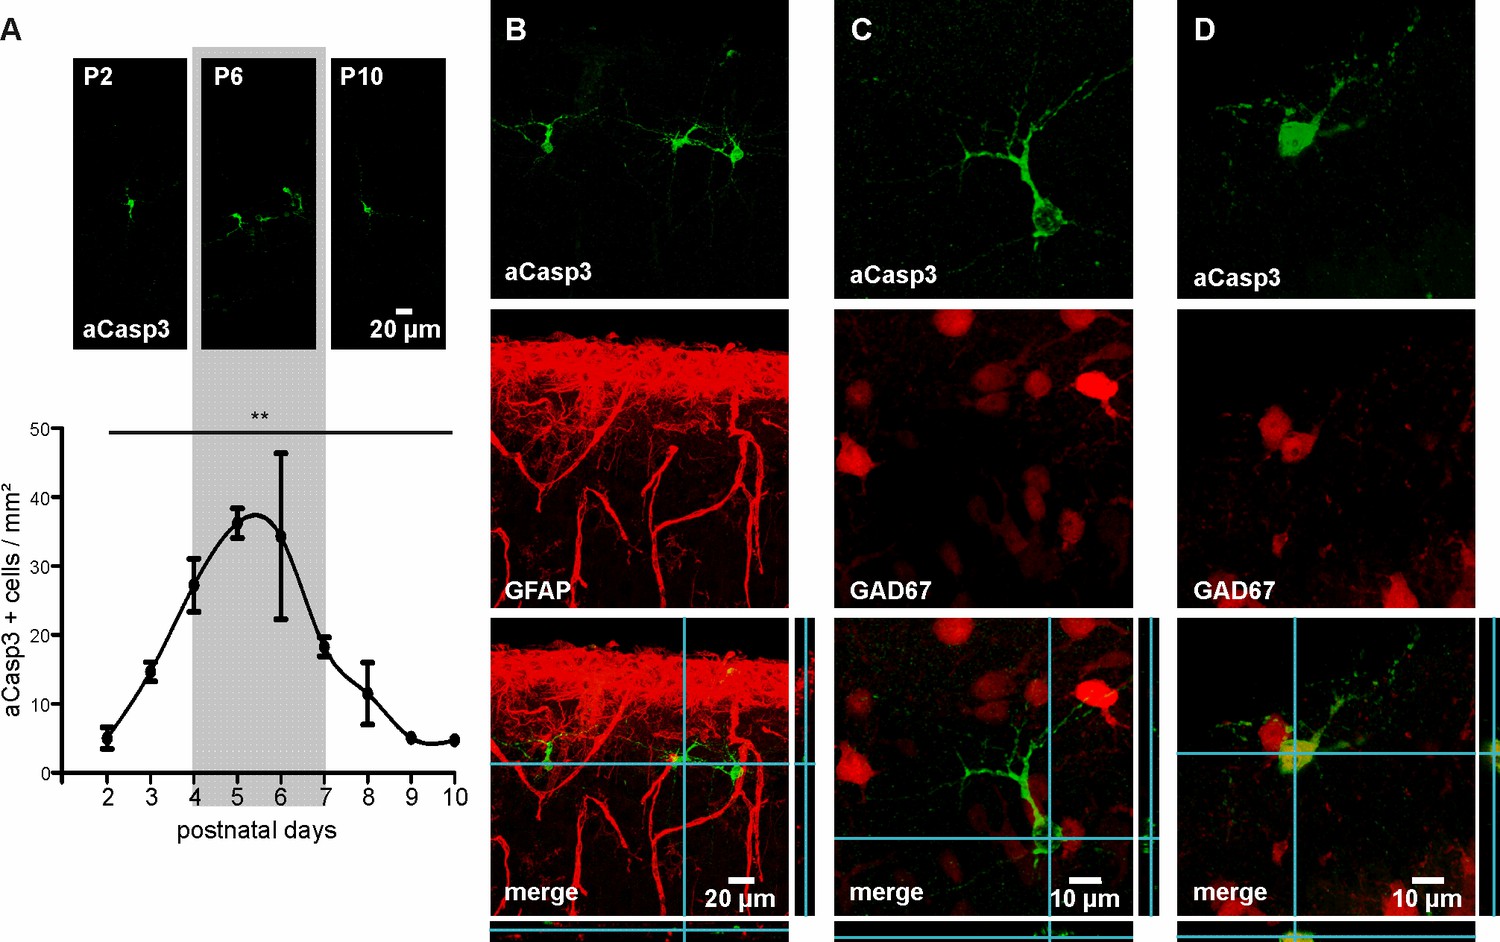
Characterization of neuronal apoptosis in the developing mouse neocortex in vivo.
(A) Representative images of aCasp3-stained cells in 50 µm thick coronal slices of mouse pups and quantitative analysis of the density of apoptotic cells in the mouse primary motor and somatosensory cortices show that cell death peaks between postnatal day (P) 4 and 7 (grey shaded area) and declines until P9-10. (B) aCasp3 labeling (green) does not colocalize with the astrocytic marker GFAP (red). (C) Most of aCasp3-positive neurons (green) are GAD67-negative, putative glutamatergic neurons. (D) A subset of apoptotic neurons is expressing the GABAergic marker GAD67 (red and green).
-
Figure 1—source data 1
Quantification of aCasp3-positive cells/mm² in M1 and S1 regions of newborn mice.
n = number of mice; sd = standard deviation; sem = standard error of mean.
- https://doi.org/10.7554/eLife.27696.003
Figure 2
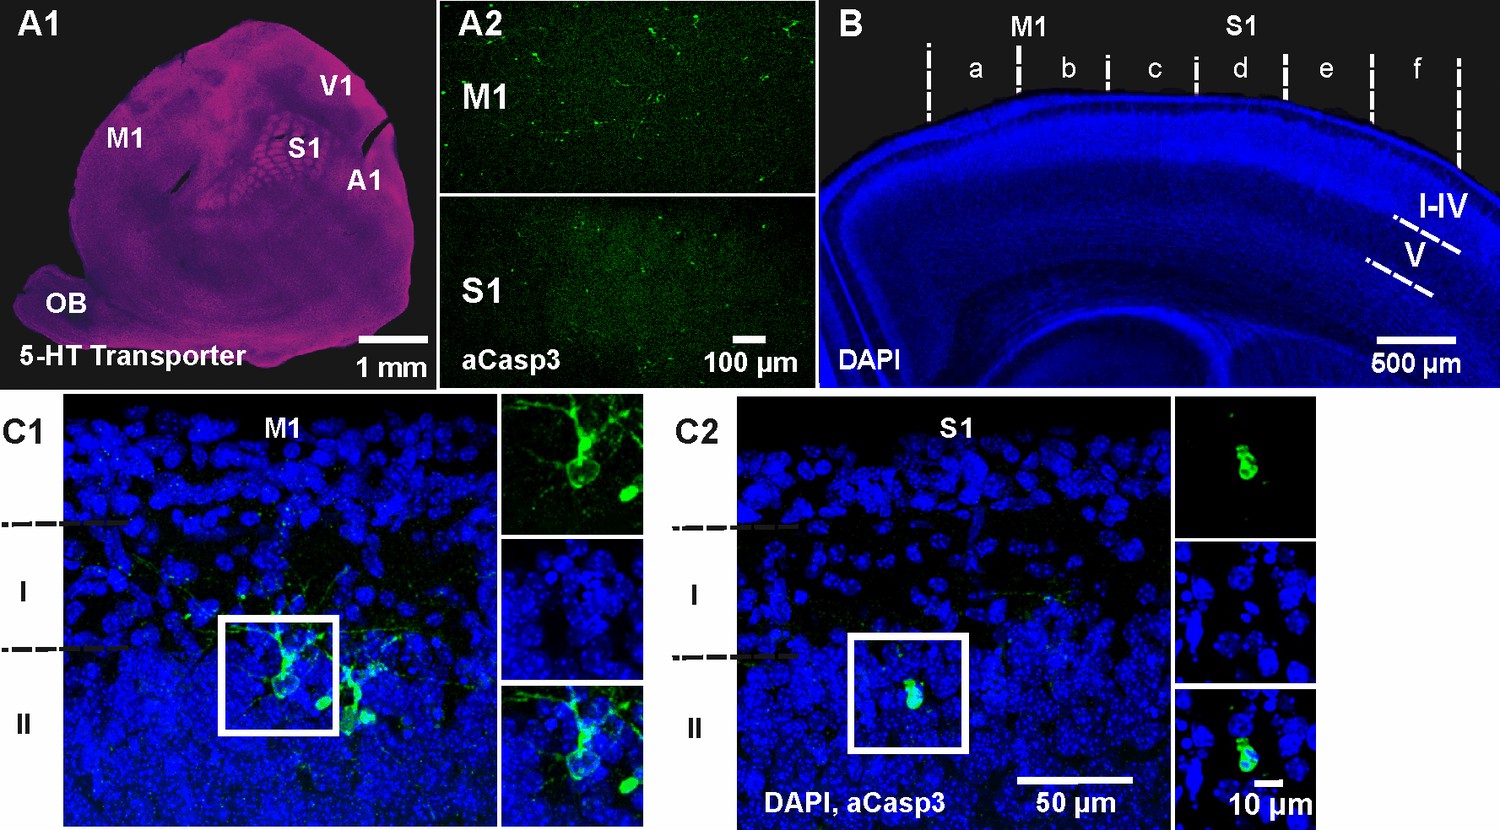
Spatiotemporal pattern of neuronal apoptosis in the developing mouse neocortex.
(A1) Serotonin (5-HT) transporter expression in a flat-mounted, tangential section of P6 brain delineates primary sensory areas. S1, primary somatosensory cortex; M1, primary motor cortex; A1, auditory cortex; V1, visual cortex; OB, olfactory bulb. (A2) Co-immunostaining against aCasp3 reveals strong area discrepancies in the density of apoptotic neurons: M1 (upper panel) displays a high density of aCasp3 positive cells compared with S1 (lower panel). (B) Representative DAPI staining of a coronal slice at P6 allows the identification of cortical layers and areas. Cortical regions were divided into sectors a to f containing M1 (sectors a and b) and S1 (sectors c to f) for further analysis. Based on DAPI staining, upper layers (layers I-IV), layer V and layer VI were identified. (C1) Representative aCasp3-positive neurons in M1 of a coronal slice from a P6 mouse brain. Cell bodies and basal dendrites are located in layers II-IV while apical dendrites project to layer I. Note that aCasp3 allows the detection of dying neurons at an early stage of apoptosis, when aCasp3 signal is not yet translocated into the nucleus and when the nucleus does not display any visible sign of degradation. (C2) Representative aCasp3-positive neuron in S1. The aCasp3 signal has translocated into the nucleus (green), the nucleus starts to condense (DAPI, blue) and neurites are not visible anymore.
Figure 3
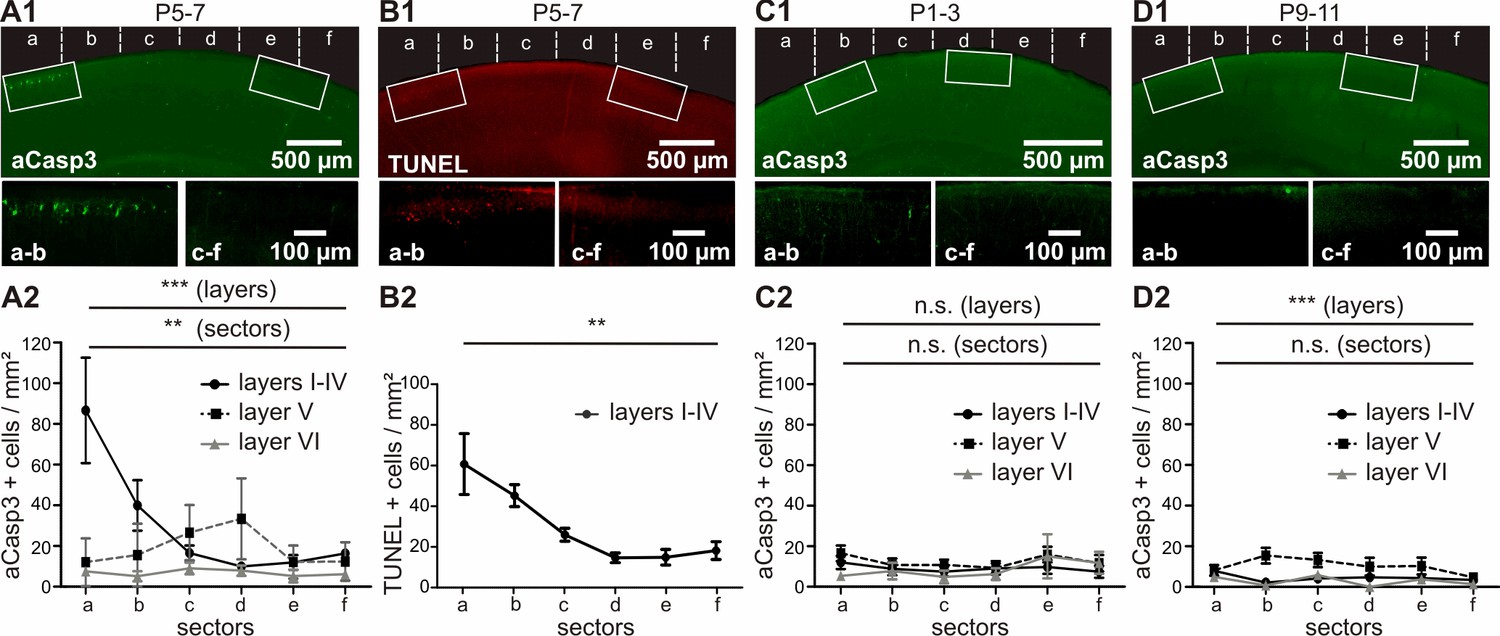
In vivo, apoptosis is layer-, sector- and age-dependent.
(A) In P5-7 mice, cortical layers I-IV display higher cell death densities than deeper layers, with particularly elevated densities of apoptotic cells in M1 compared with S1. (B) Comparative labeling of layers I-IV apoptotic neurons with TUNEL staining shows the same pattern as aCasp3 immunostaining. (C) In P1-3 mice, the neocortex presents a very low amount of apoptotic cells with no significant difference in density between sectors or layers. (D) In P9-11 mice, the number of apoptotic cells is also low, with a lower density in layers I-IV and VI than in layer V and no significant difference between sectors.
-
Figure 3—source data 1
Quantitative analysis of the density of aCasp3-positive cells in layers I-IV, V and VI of P5-7 mouse neocortex.
n = number of slices analyzed; sd = standard deviation; sem = standard error of mean.
- https://doi.org/10.7554/eLife.27696.006
-
Figure 3—source data 2
Quantitative analysis of the density of TUNEL-positive cells in layers I-IV of P5-7 mice neocortex.
n = number of slices analyzed; sd = standard deviation; sem = standard error of mean.
- https://doi.org/10.7554/eLife.27696.007
-
Figure 3—source data 3
Quantitative analysis of the density of apoptotic cells in layers I-IV, V and VI of P1-3 mouse neocortex.
n = number of slices analyzed; sd = standard deviation; sem = standard error of mean.
- https://doi.org/10.7554/eLife.27696.008
-
Figure 3—source data 4
Quantitative analysis of the density of apoptotic cells in layers I-IV, V and VI of P9-11 mouse neocortex.
n=number of slices analyzed; sd= standard deviation; sem= standard error of mean.
- https://doi.org/10.7554/eLife.27696.009
Figure 4 with 1 supplement
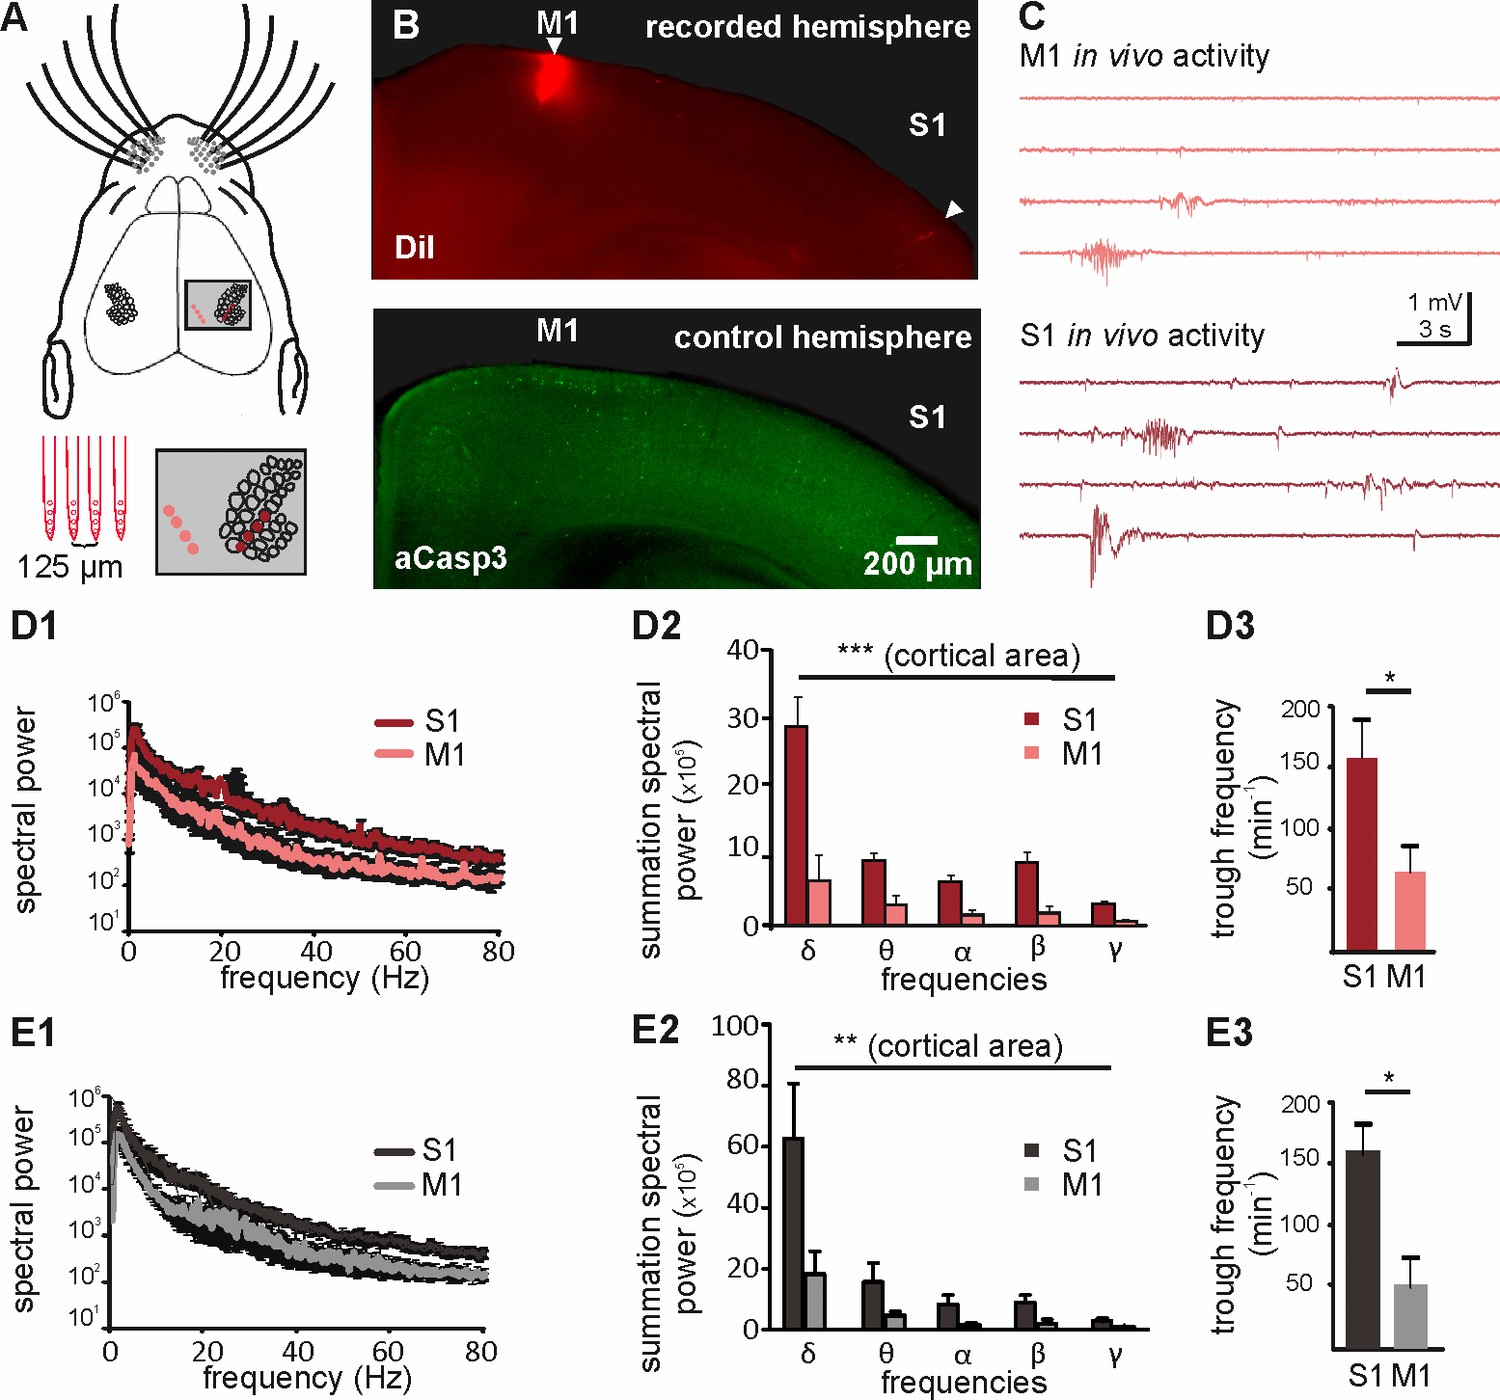
Different levels of spontaneous activity in somatosensory and motor cortical areas in urethane-anesthetized and non-anesthetized mice in vivo.
(A) Location of the 4-shank recording electrode in M1 and S1 (upper panel and close-up in grey-shaded area) and schematic illustration of the electrodes (lower left panel). (B) Tracks of DiI marked electrodes illustrate recording positions in M1 and S1 in a coronal slice (upper panel, filled arrows). In the opposite control hemisphere from the same slice (lower panel), aCasp3 expression reveals that M1 recording site corresponds to a region of high rate of apoptosis and S1 recording site to a region of low apoptosis. (C) Representative in vivo local field potential (LFP) recordings performed simultaneously in M1 and S1 of urethane-anesthetized mice. (D) In urethane-anesthetized mice, (D1) the averaged spectral power from continuous LFP recordings, (D2) the summation of LFP spectral power and (D3) the detected trough rate are significantly higher in S1 than in M1. (E) Also in non-anesthetized mice, (E1) the averaged spectral power from continuous LFP recordings, (E2) the summation of LFP spectral power and (E3) the trough rate are significantly higher in S1 than in M1.
-
Figure 4—source data 1
Analysis of in vivo recordings in S1 and M1 from urethane-anesthetized mice.
- https://doi.org/10.7554/eLife.27696.012
-
Figure 4—source data 2
Analysis of in vivo recordings in S1 and M1 from non-anesthetized mice.
- https://doi.org/10.7554/eLife.27696.013
Figure 4—figure supplement 1

Analysis of in vivo recordings from S1 and M1.
(A) For the event detection, the original trace was downsampled to 1000 Hz (upper trace) and two different sets of bandpass filtering were applied: 4–30 Hz (middle trace) and 30–100 Hz (lower trace). A threshold at 8-fold baseline SD was applied and timestamps of detected troughs in both filtered trace were pooled together. To prevent a duplicated detection of trough in both filtered data sets, troughs occurring within 8 ms of each other were excluded. (B) Quantitative analysis of the event frequency calculated from interevent intervals. Box-plots represent median and upper/lower quartile of frequencies for all events (S1: n = 2333 and M1: n = 944). Note significantly higher frequencies in S1 than in M1. The circles represent the median frequencies of the five individual recordings performed in M1 and S1. The filled symbols identify the two recordings used for in vitro stimulation.
Figure 5 with 2 supplements
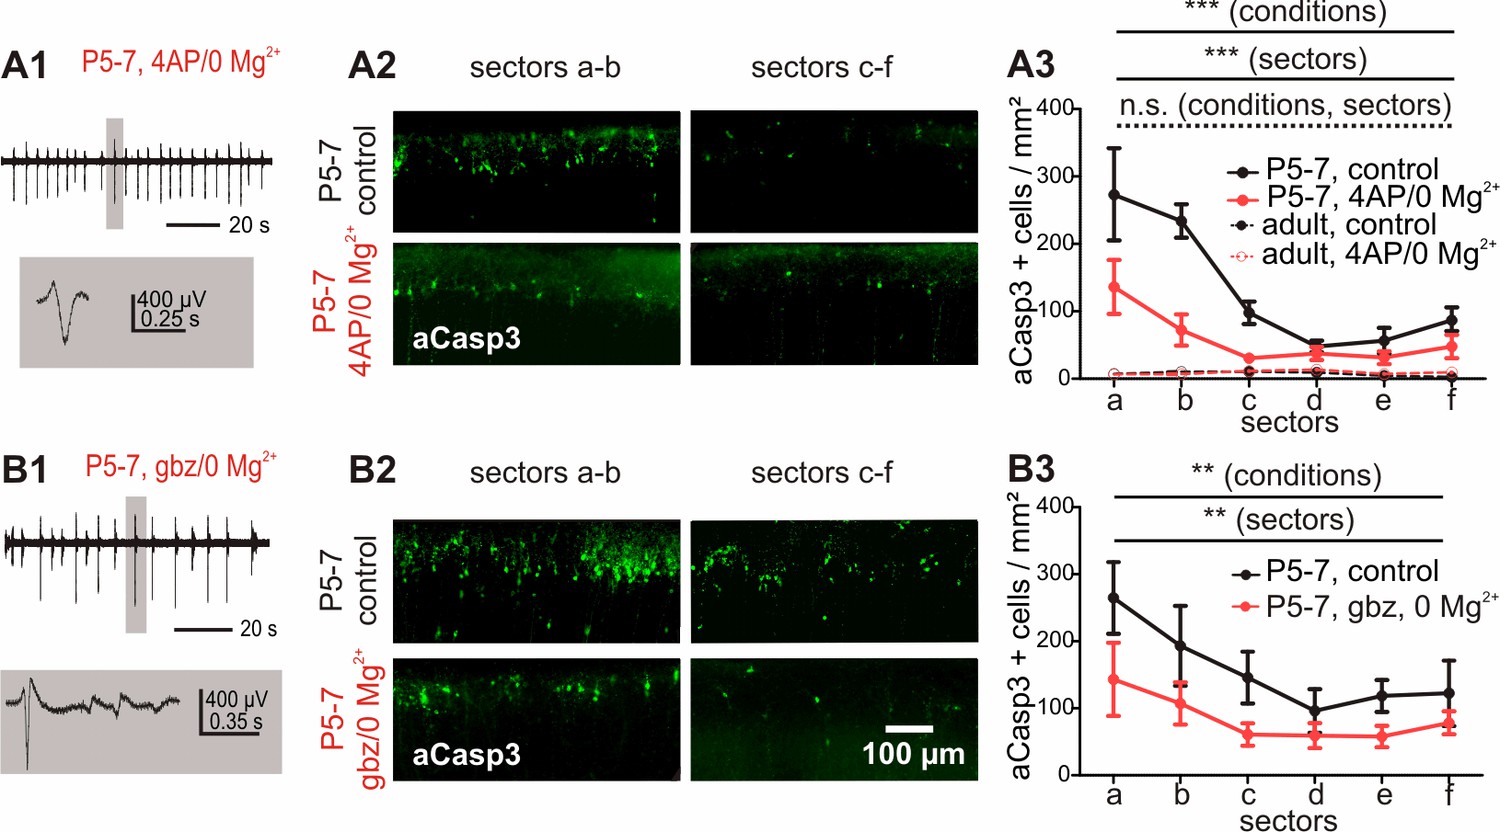
Increased electrical activity in vitro causes a reduction in apoptosis.
(A1) Typical LFP activity in cortical slices from P5-7 mice induced by 4AP/0 Mg2+ ACSF. (A2 and A3) Under control conditions, in vitro cortical slices (black solid line) present the same area-specific pattern of apoptosis as in vivo although rates of apoptosis are increased. Bath application of 4AP/0 Mg2+ ACSF reduces the extent of cell death in vitro (red solid line). Control experiments in adult cortical slices (black dotted lines) reveal a lower density of apoptotic neurons which is insensitive to 4AP/0 Mg2+ treatment (red dotted lines). (B1) Application of 3 µM gabazine (gbz)/0 Mg2+ ACSF also increases the spontaneous electrical activity in coronal slices from P5-7 mice and significantly reduces the amount of apoptotic neurons (B2 and B3).
-
Figure 5—source data 1
Quantitative analysis of the density of aCasp3-positive cells in layers I-IV of acute slices from P5-7 or adult mouse neocortex perfused with control or 4-AP/no Mg2+ ACSF.
n=number of slices analyzed; sd= standard deviation; sem= standard error of mean.
- https://doi.org/10.7554/eLife.27696.017
-
Figure 5—source data 2
Quantitative analysis of the density of aCasp3-positive cells in layers I-IV of acute slices from P5-7 mouse neocortex perfused with control or gabazine/no Mg2+ ACSF.
n=number of slices analyzed; sd= standard deviation; sem= standard error of mean.
- https://doi.org/10.7554/eLife.27696.018
Figure 5—figure supplement 1
Field potential recordings in coronal cortical slices under control and high frequency activity conditions.
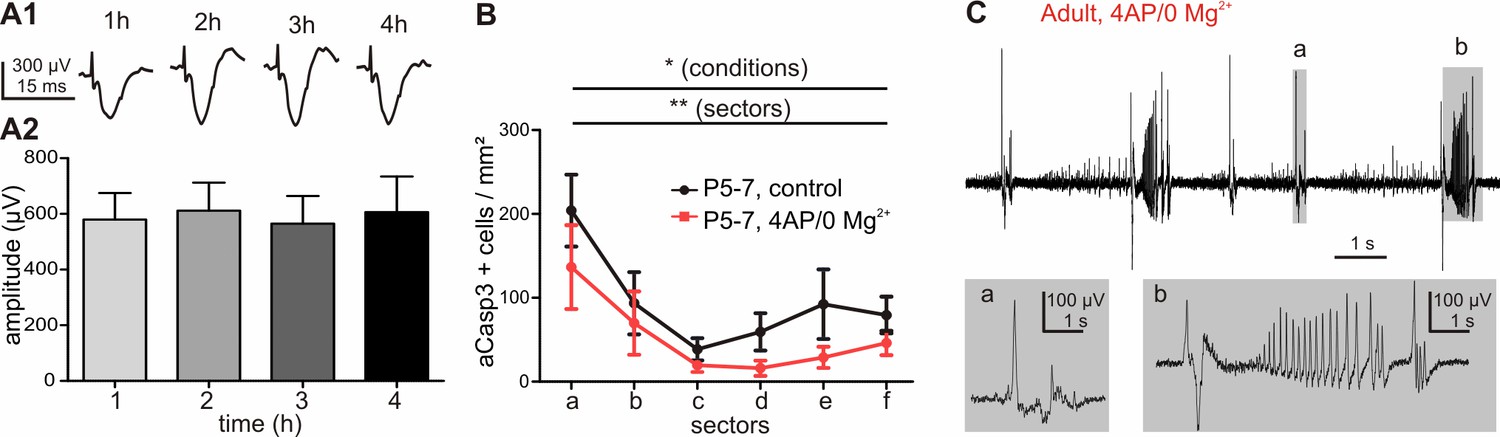
(A1) Representative evoked field postsynaptic potential (fEPSP) and (A2) quantitative analysis of control slices from 4AP/0 Mg2+ and gabazine/0 Mg2+ experiments reveal that amplitudes of fEPSP do not change over the course of the experiment (one-way ANOVA, R²=0.54, p=0.99, n = 8 recordings). (B) After 2 hr of perfusion with 4AP/0 Mg2+ ACSF, cortical slices from P5-7 mice already show a significant decrease in the density of apoptotic neurons (red line) compared with control slices (black line). (C) Representative recording of fEPSP in slices from adult P27 mouse perfused with 4AP/0 Mg2+ ACSF.
Figure 5—figure supplement 2
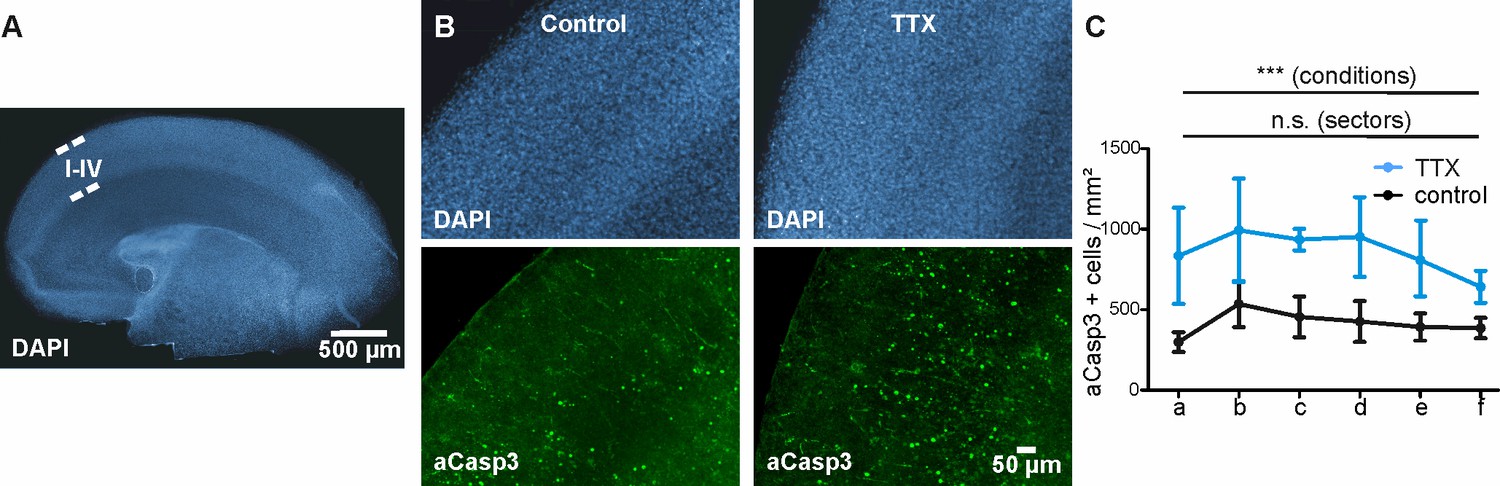
The area-specific pattern of apoptosis disappears in a cortical preparation with homogenous electrical activity.
(A) Representative DAPI staining of organotypic cortical slices from P3 mouse after 4 DIV. Layers are preserved after 4 DIV. DAPI and aCasp3 immunostaining of vehicle- or TTX-treated slices (B) and (C) quantitative analysis do not reveal any difference in density of aCasp3-positive neurons between cortical areas. Upon TTX application, overall rate of apoptosis is increased but is still not significantly different between cortical sectors.
Figure 6 with 1 supplement
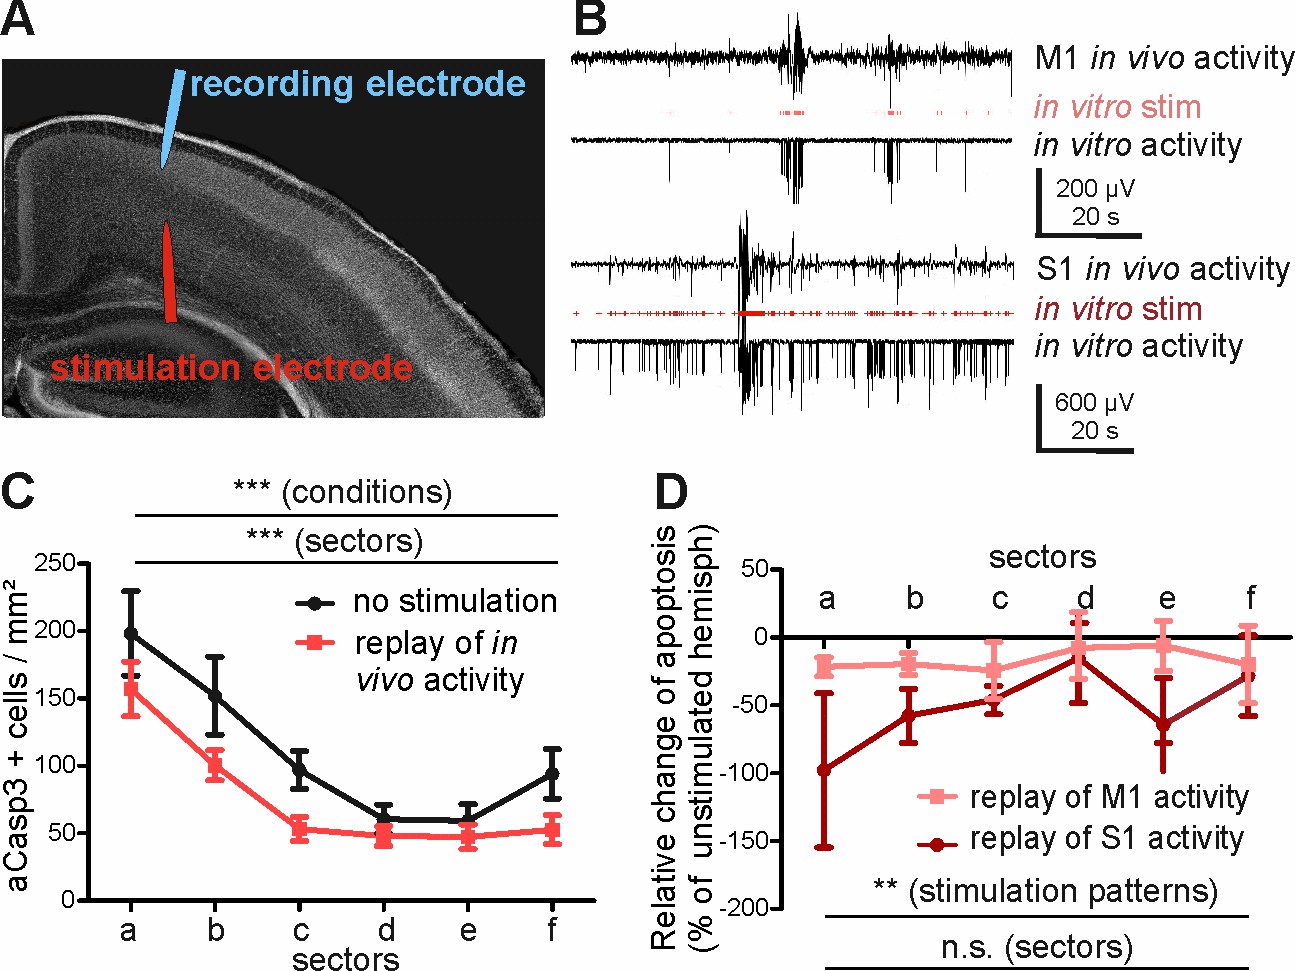
Replay of in vivo S1 activity has a stronger anti-apoptotic effect than replay of in vivo M1 activity.
(A) DAPI image of a slice schematically illustrating the position of the stimulation electrode in layer V of M1 and of the recording electrode in layers II-III of M1. (B) Typical LFP recordings illustrating in vivo M1 activity (upper trace), the stimulus sequence extracted from the in vivo recording (red trace) and the resulting LFP recording in an acute slice using this stimulus sequence (lower trace) for either M1 (upper panel) or S1 (lower panel) activity pattern. (C) Statistical analysis demonstrating that repetitive electrical stimulation using replay of S1 and M1 in vivo activity decreases the density of apoptotic neurons in the stimulated hemisphere (red symbols/lines) compared to unstimulated contralateral hemisphere (black symbols/lines). (D) Statistical analysis of the decrease in the number of aCasp3-positive neurons related to the unstimulated hemisphere. The relative reduction in number of aCasp3-labeled neurons is higher after replay of S1 in vivo pattern than after replay of M1 in vivo pattern .
-
Figure 6—source data 1
Quantitative analysis of the density of aCasp3-positive cells in layers I-IV of acute slices from P5-7 mouse neocortex with and without replay of S1 and M1 in vivo activity.
n=number of hemispheres analyzed; sd= standard deviation; sem= standard error of mean.
- https://doi.org/10.7554/eLife.27696.021
-
Figure 6—source data 2
Quantification of decrease in the number of aCasp3-positive neurons following electrical stimulation (related to the unstimulated hemisphere).
n=number of slices analyzed; sd= standard deviation; sem= standard error of mean.
- https://doi.org/10.7554/eLife.27696.022
Figure 6—figure supplement 1
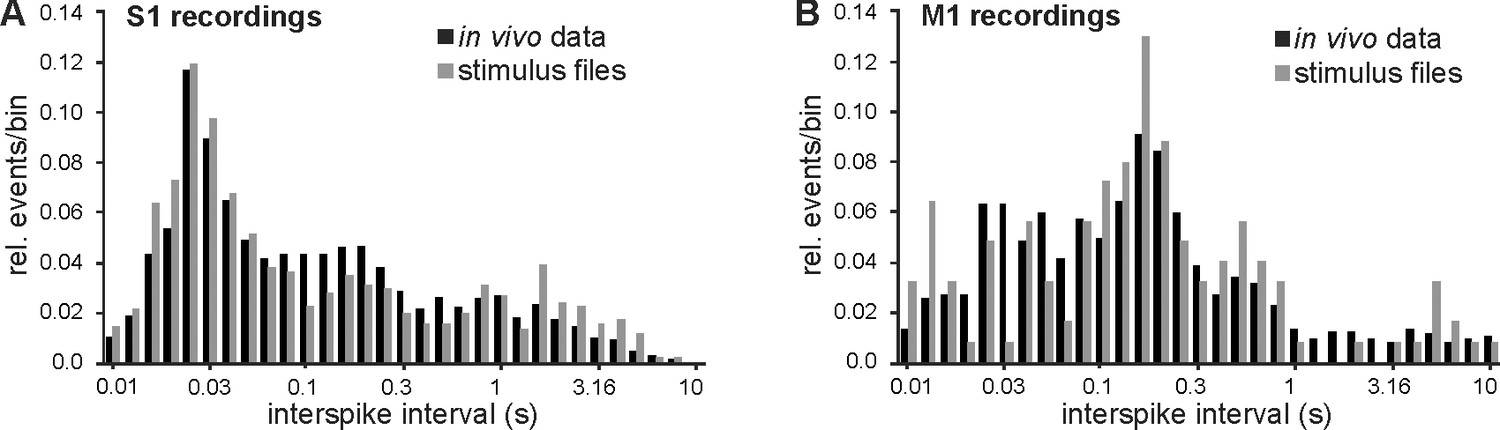
Generation of in vitro stimulus protocols replaying S1 and M1 in vivo activities.
(A) Histogram displaying the normalized occurrence of events with a given interspike interval in S1. Note the logarithmic size of the bins (10 bins per decade). Black bars represent all analyzed events in all five in vivo recordings and gray bars the data from the two recordings used for in vitro stimulation. The distribution of interspike intervals in the stimulation files is representative for the in vivo data. (B) Same as in A but for M1.
Figure 7
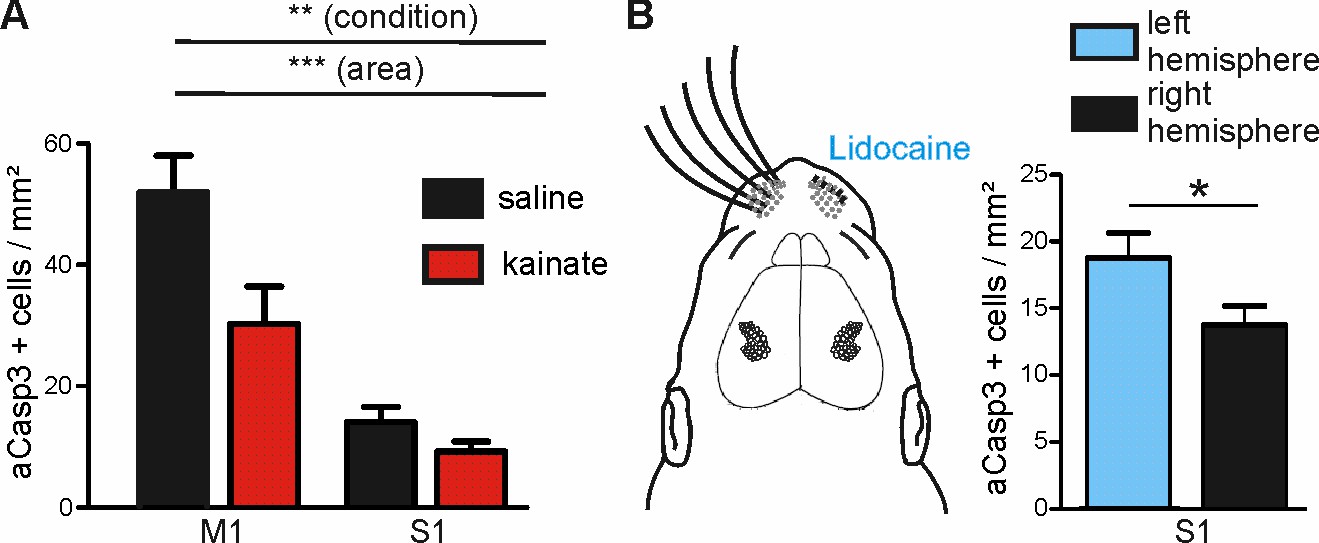
Modulation of spontaneous activity in vivo affects neuronal apoptosis in the developing cortex.
(A) Increasing spontaneous electrical activity for 5 hr by kainate injection significantly decreases rate of apoptosis in M1 whereas it does not affect neuronal apoptosis in S1. (B) Left panel: Schematic illustration of sensory deprivation by unilateral clipping of the whiskers and local lidocaine application into the whisker pad for 5 hr. Right panel: Unilateral whisker deafferentation leads to increased amounts of apoptosis in the corresponding contralateral barrel field in comparison to the ipsilateral hemisphere receiving intact whisker afferents.
-
Figure 7—source data 1
Quantitative analysis of the density of aCasp3-positive cells in M1 and S1 areas of saline- or kainate-injected P5-7 mice.
n=number of slices analyzed; sd= standard deviation; sem= standard error of mean.
- https://doi.org/10.7554/eLife.27696.024
-
Figure 7—source data 2
Quantitative analysis of the density of aCasp3-positive cells in S1 area of P5-7 mice.
n=number of slices analyzed; sd= standard deviation; sem= standard error of mean.
- https://doi.org/10.7554/eLife.27696.025
Author response image 1
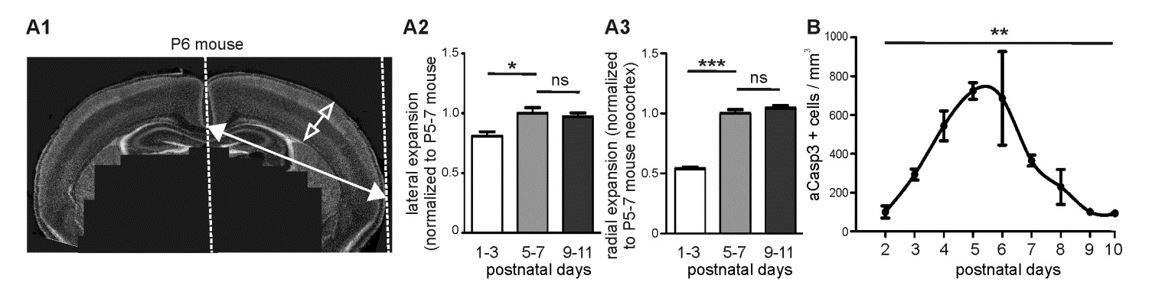
Brain expansion and apoptosis in the developing mouse neocortex.
(A1) Lateral expansion of developing mouse brains was determined by measuring the distance between midline and lateral boundary of coronal sections (filled arrow). Radial expansion was investigated by measuring the thickness of neocortical layers (open arrow). (A2) Mouse neocortex laterally expands from P1-3 to P5-7 by a factor of 1.23 ± 0.06, but does not display a significant lateral expansion between P5-7 and P9-11. (A3) Quantification of radial expansion (layers I to VI) shows a significant increase between P1-3 and P5-7 but not between P5-7 and P9-11. (B) Quantification of the number of aCasp3-positive cells per mm³ brain volume during the 10 first postnatal days.
Author response image 2
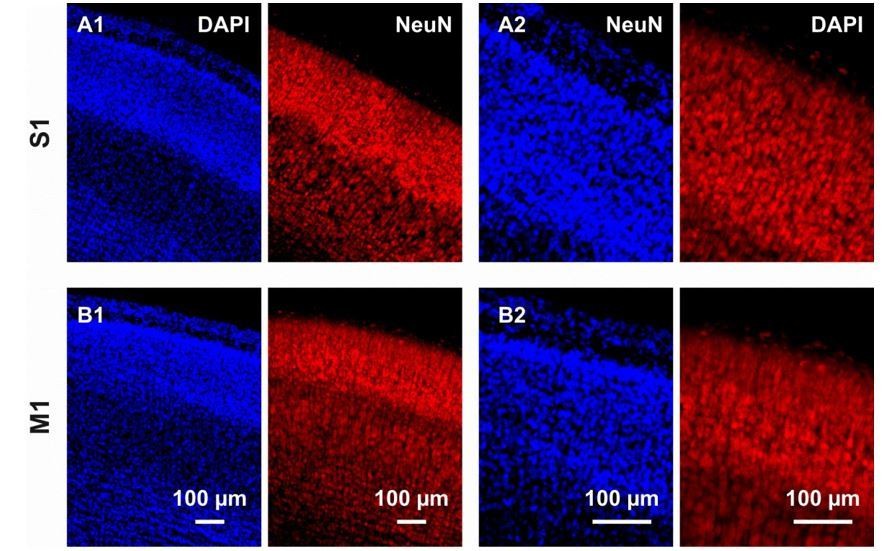
Immunostaining against DAPI and NeuN in coronal cortical slices from P6 mouse brains.
(A1) In the S1 region, immunostaining against DAPI and NeuN respectively allows the detection of nuclei in the overall cortical population and the cytoplasm of neurons. The high cell density, in particular in layers I-IV, hampers any reliable quantification. (A2) Also at a higher magnification, quantification of NeuN-positive cells is difficult. (B) Same than (A) but in M1.
Author response image 3

Characterization of neuronal apoptosis in the developing mouse neocortex in vivo.
(A1) Most of aCasp3-positive neurons (green) are GAD67-negative, putative glutamatergic neurons. (A2) Acasp3 allows the detection of dying neurons at an early stage of apoptosis, when acasp3 signal is not yet translocated into the nucleus and when the nucleus does not display any visible sign of degradation. (B1) A subset of apoptotic neurons is expressing the GABAergic marker GAD67 (red). (B2) The aCasp3-positive neuron displays aCasp3 signal into the nucleus (green), the nucleus starts to slightly condense (DAPI, blue) and starts to show signs of neurite degradation.
Author response image 4
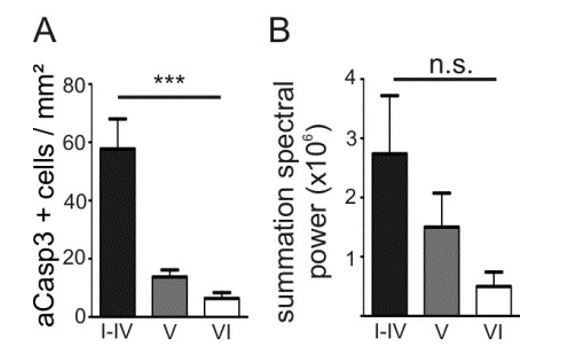
Density of apoptotic neurons and levels of activity in M1 positively correlate across cortical layers.
(A) In M1, the density of apoptotic neurons is significantly higher in layers I-IV than in the deeper layers. (B) The spectral power tends to be higher in layers I-IV than in layers V and VI.
Additional files
-
Transparent reporting form
- https://doi.org/10.7554/eLife.27696.026
Download links
A two-part list of links to download the article, or parts of the article, in various formats.
Downloads (link to download the article as PDF)
Open citations (links to open the citations from this article in various online reference manager services)
Cite this article (links to download the citations from this article in formats compatible with various reference manager tools)
Electrical activity controls area-specific expression of neuronal apoptosis in the mouse developing cerebral cortex
eLife 6:e27696.
https://doi.org/10.7554/eLife.27696


