Structure of RNA polymerase bound to ribosomal 30S subunit
- University of Massachusetts Medical School, United States
- New York University School of Medicine, United States
- Howard Hughes Medical Institute, New York University School of Medicine, United States
- Janelia Research Campus, Howard Hughes Medical Institute, United States
Figures
Figure 1 with 5 supplements
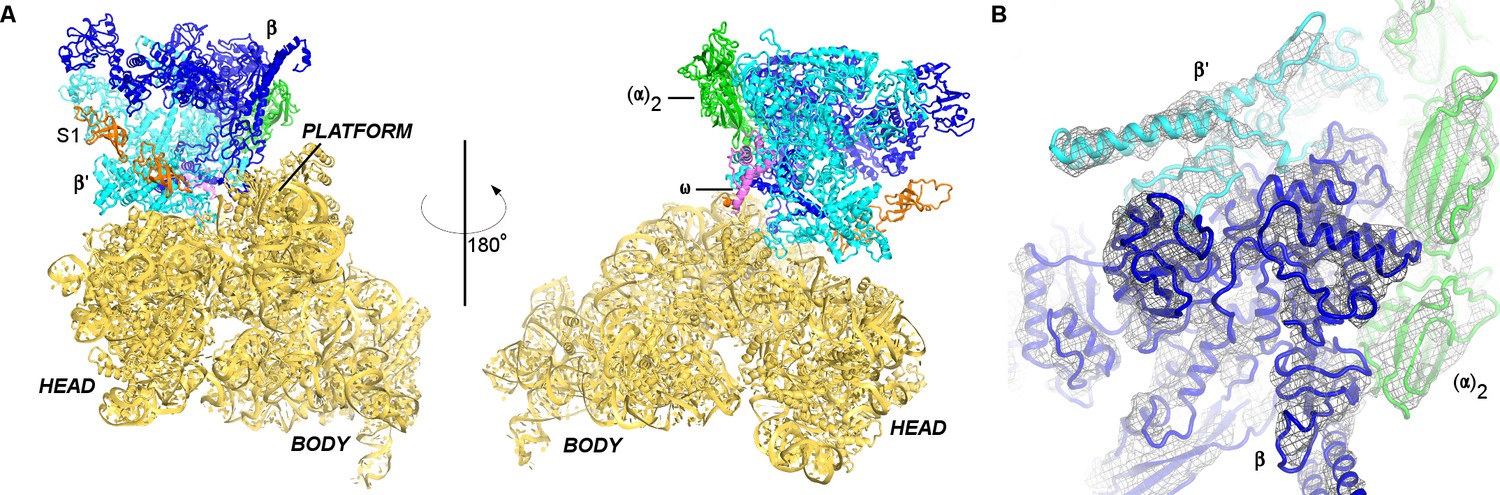
Cryo-EM structure of the 30S•RNAP complex.
(A). The 30S•RNAP structure. The 30S subunit is in yellow (ribosomal protein S1 is in orange) with domains labeled. RNAP domains are colored in green (α-subunits), blue (β-subunit), cyan (β’-subunit) and violet (ω-subunit). (B) Cryo-EM density (gray mesh) for RNAP (shown at σ = 5). The view shows the top of RNAP,~90° relative to that shown in the left panel (A).
Figure 1—figure supplement 1
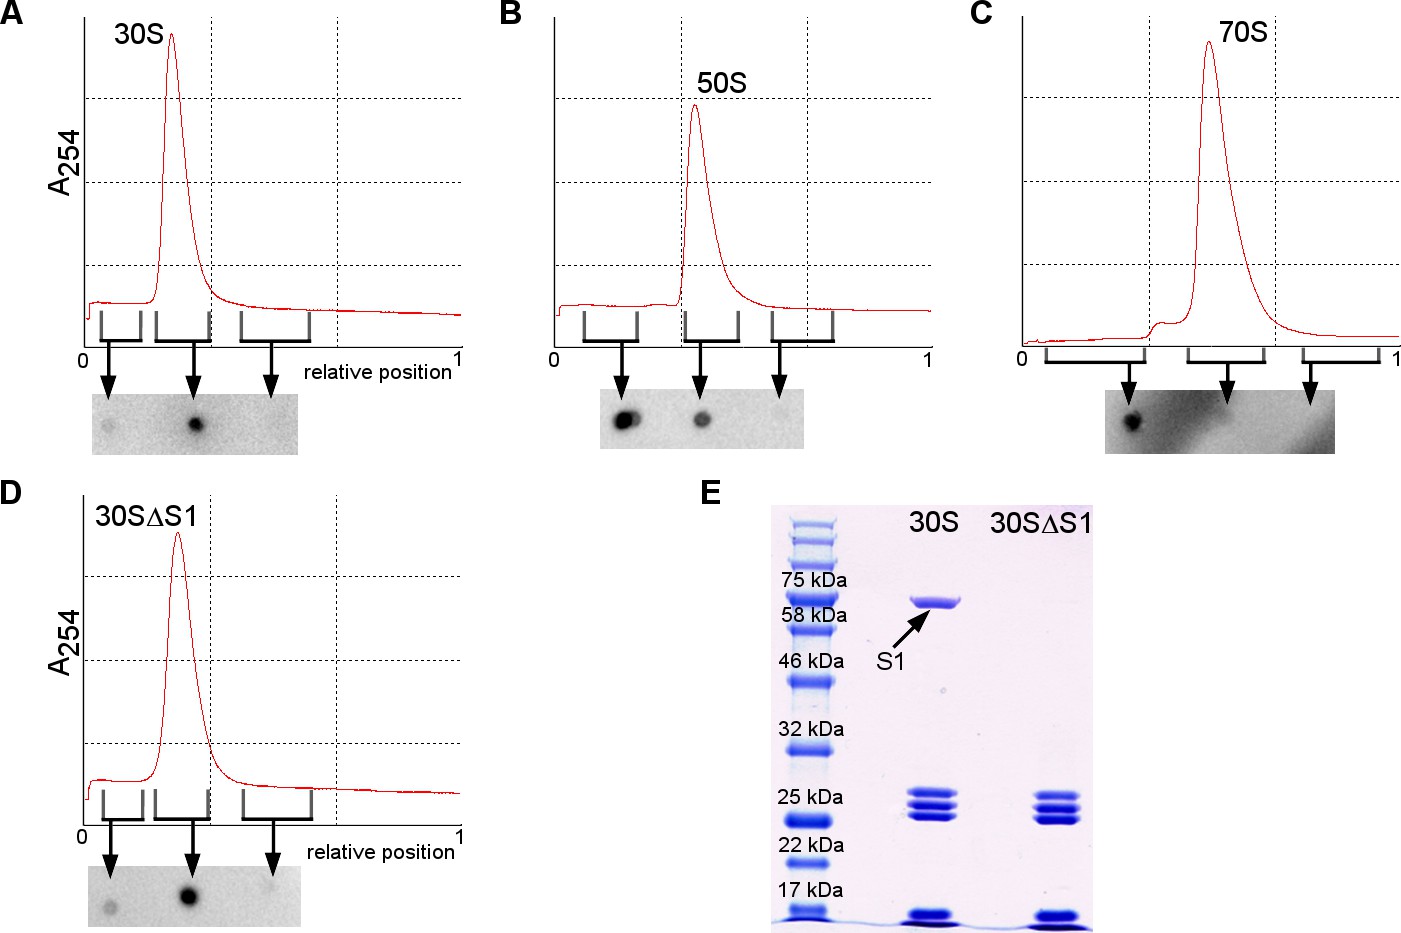
Binding of RNAP core to the ribosome or ribosomal subunits.
(A–D) Sucrose gradients (upper graph) and dot blot assays detecting RNAP in 30S, 50S, 70S or 30SΔS1 complexes. Three fractions (before the peak, at the peak and after the peak) were used for dot blot to detect unbound RNAP (lighter fraction before the peak) and bound RNAP (at the peak) (see Materials and methods). (E) SDS PAGE gel showing the absence of S1 in the 30SΔS1 subunit.
Figure 1—figure supplement 2
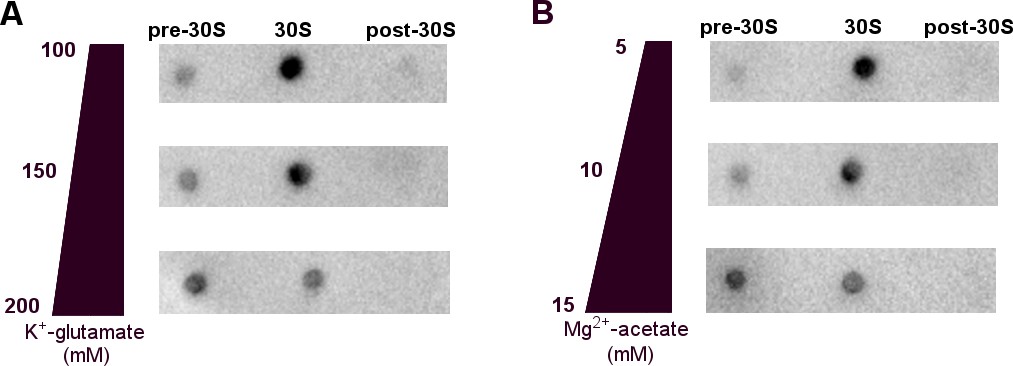
Binding of 1 µM RNAP core to the 30S ribosomal subunit in a range of cell-like conditions including glutamate and acetate anions and potassium and magnesium cations, optimized for transcription-translation coupling (Jewett and Swartz, 2004).
(A) Dot blots detecting RNAP in 30S•RNAP mixtures fractionated by sucrose gradient, in the buffers with varying potassium glutamate concentrations. (B) Dot blots detecting RNAP in 30S•RNAP mixtures fractionated by sucrose gradient, in the buffers with varying magnesium acetate concentrations. In panels A and B, unbound RNAP is in the lighter fraction (pre-30S) and 30S-bound RNAP is at the 30S peak, as described in Figure 1—figure supplement 1 (see Materials and methods).
Figure 1—figure supplement 3
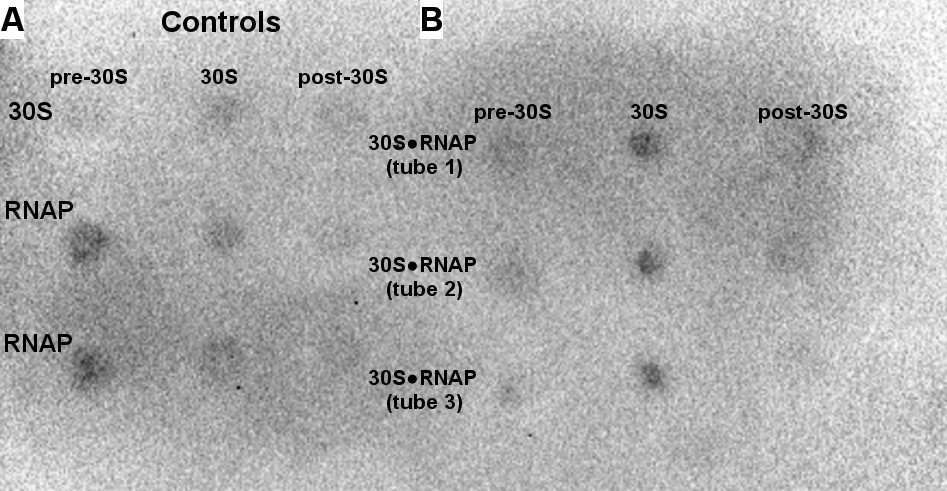
Binding of 50 nM RNAP core to the 30S subunit under cell-like conditions optimized for transcription-translation coupling (Jewett and Swartz, 2004).
Dot blot assay detecting RNAP in sucrose gradient samples (shown as in Figure 1—figure supplement 1 and Figure 1—figure supplement 2). Controls included free 30S and free RNAP (A) and were used for quantification of bound RNAP (B). The 30S•RNAP complex was analyzed in triplicates (tubes 1–3) (see Materials and methods).
Figure 1—figure supplement 4
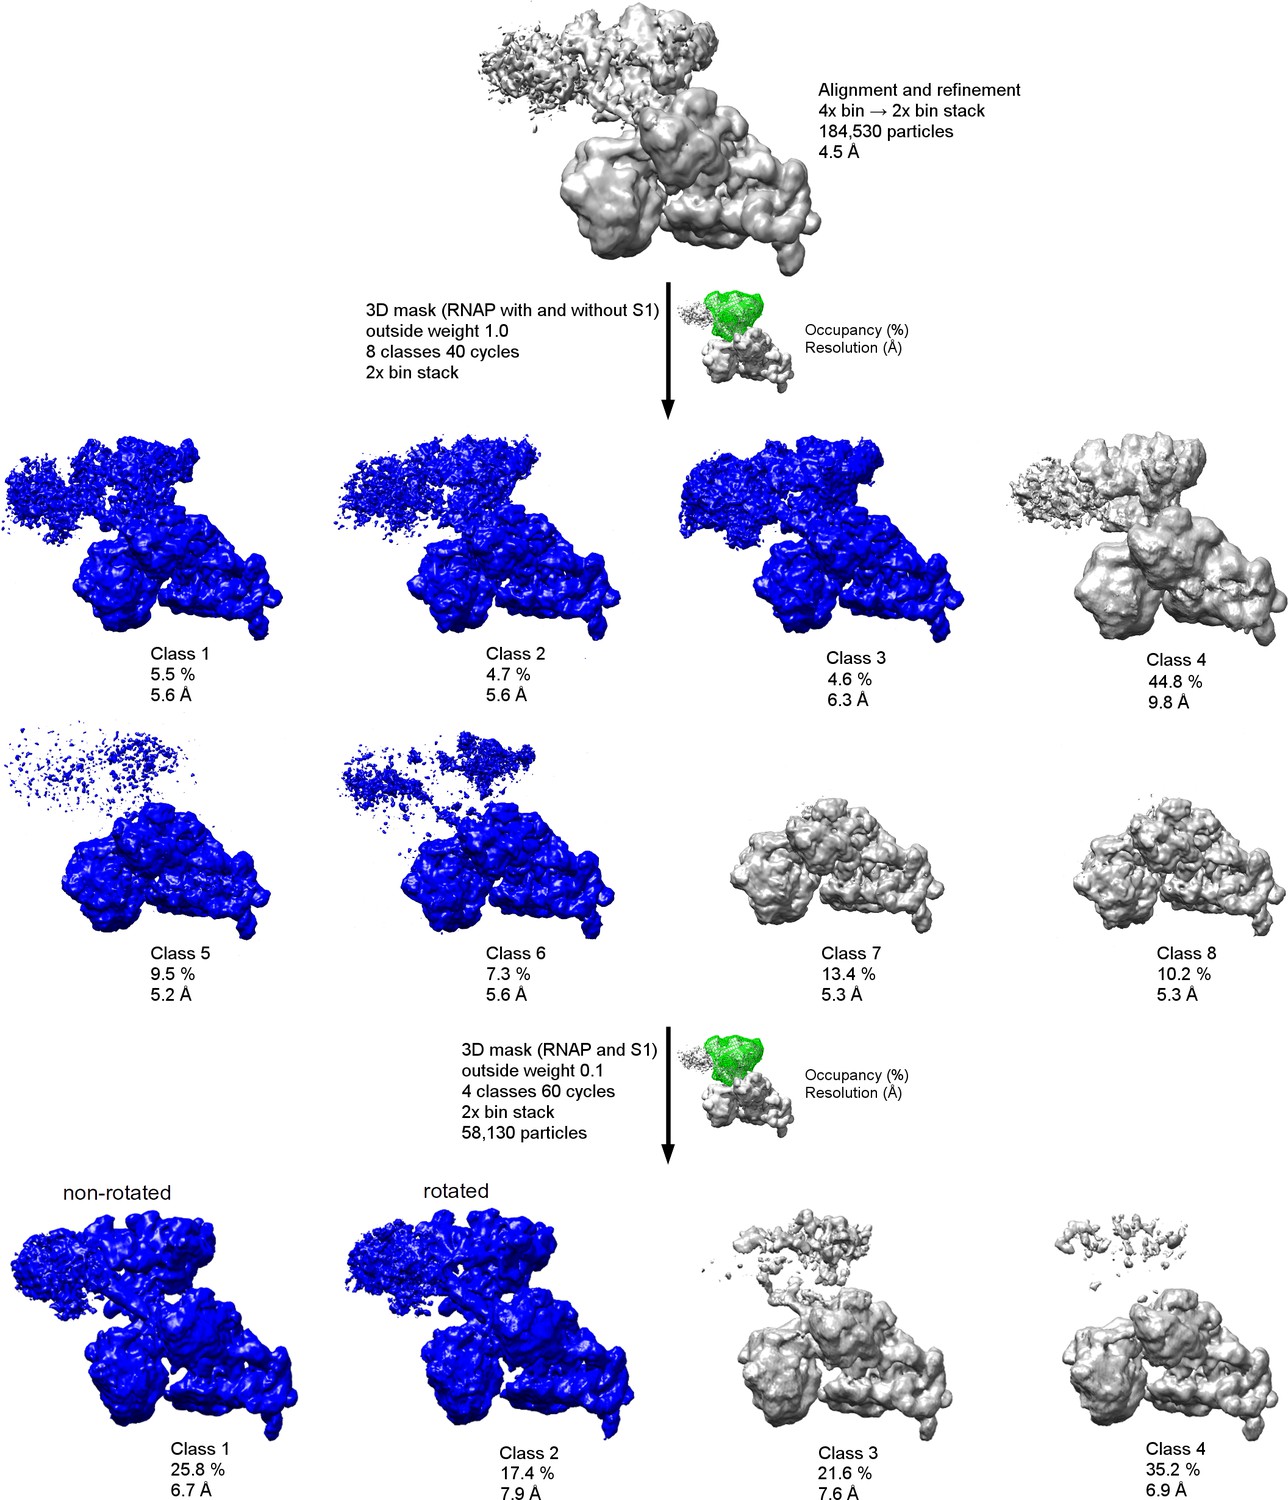
Schematic of cryo-EM refinement and classification of the 30S•RNAP dataset.
All particles were initially aligned to a single model using a 4x binned stack. 3D classification (8 classes) using the 2x binned stack (with a 3D mask, green) was used to identify the particles with RNAP at ~5–6 Å resolution (blue). Subsequent 3D classification using a 3D mask around RNAP and S1 yielded two classes with well-defined structural features (blue).
Figure 1—figure supplement 5
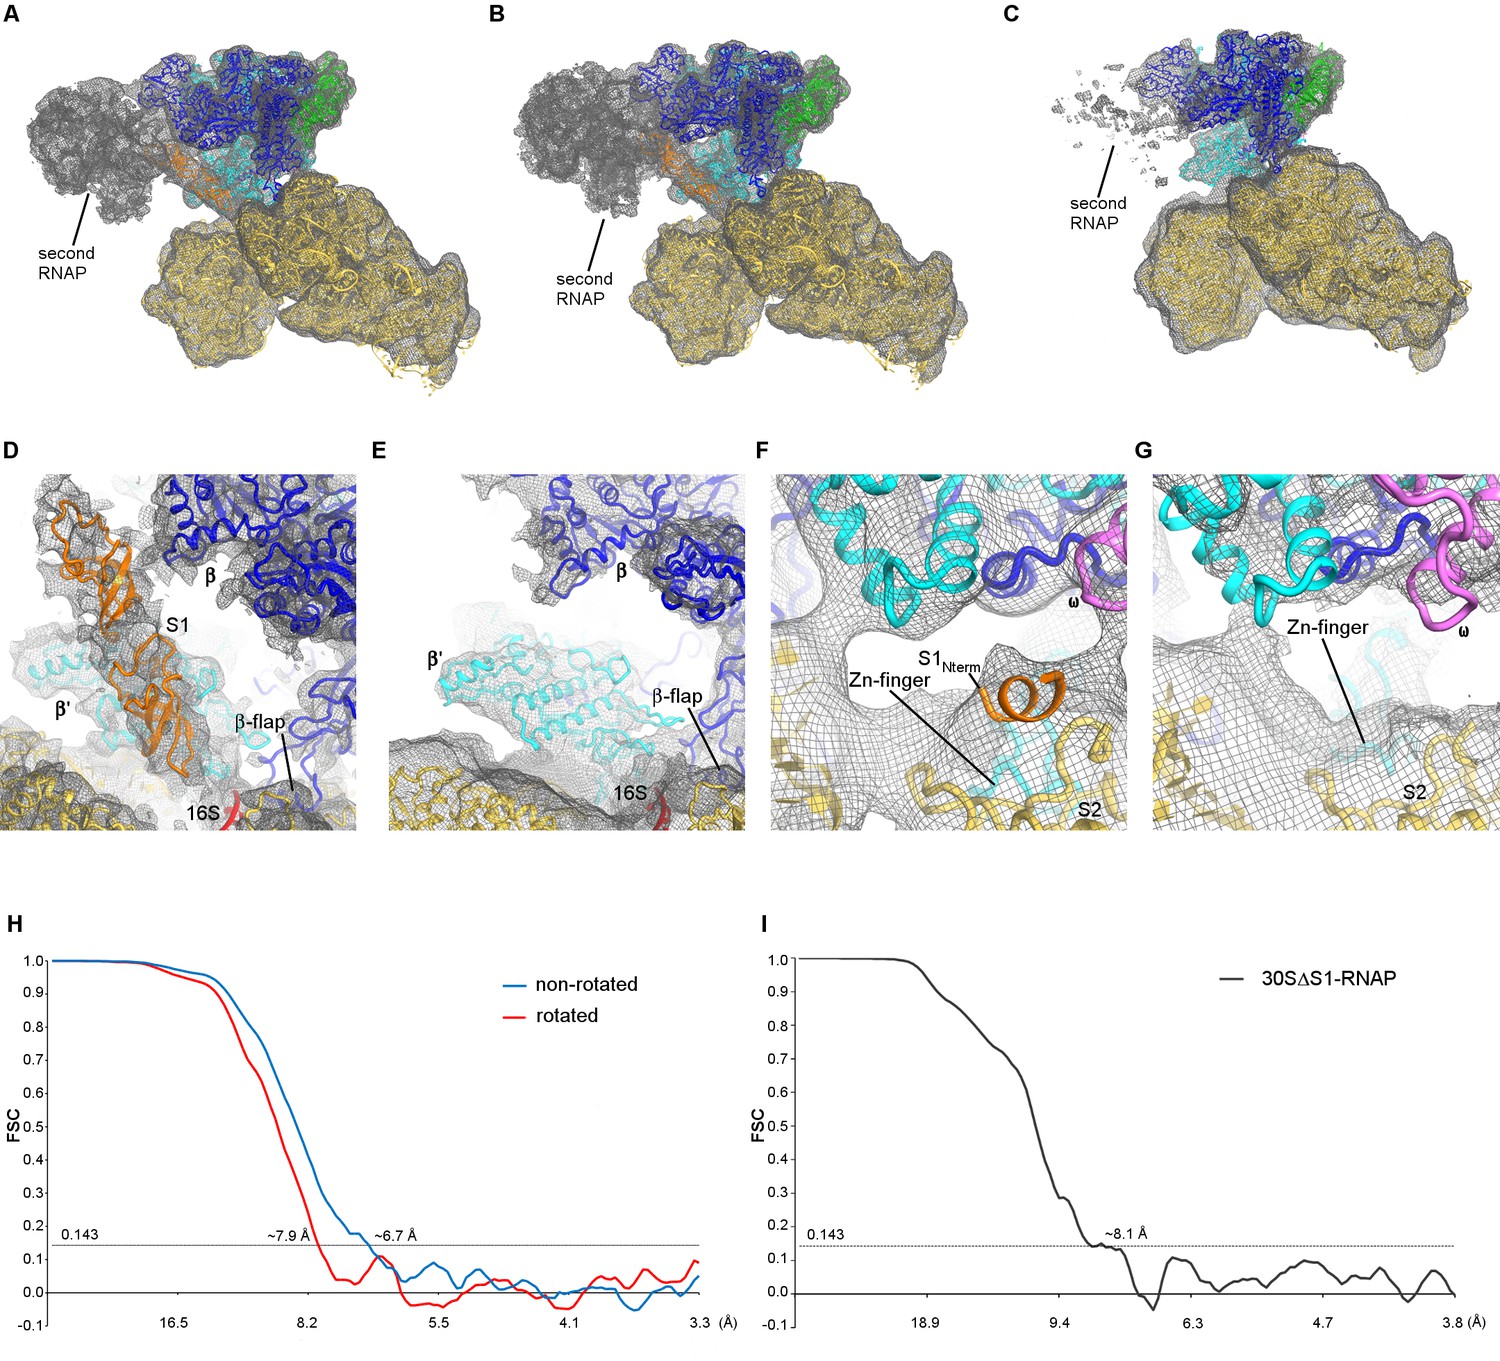
Cryo-EM densities for the 30S•RNAP and 30SΔS1•RNAP complexes.
(A) Density of the 30S•RNAP complex (non-rotated RNAP) shown at σ = 3. (B) Density of the 30S•RNAP complex (rotated RNAP) shown at σ = 3. The maps were sharpened by applying the B-factor of −200 Å2. (C) Density of the 30SΔS1•RNAP complex shown at σ = 2.5. The map was sharpened by applying the B-factor of −200 Å2. (D) Density corresponding to two OB domains of S1 (non-rotated RNAP is shown). Putative placement of two OB domain structures is shown in orange in panels (A), (B) and (D). (E) Absence of density for the OB domains of S1 in the 30SΔS1•RNAP complex. (F) Close-up view of the N-terminal helix of S1 bound to S2 (non-rotated RNAP is shown). (G) Absence of density for the N-terminal helix of S1 in the 30SΔS1•RNAP complex. The maps in (D–G) were sharpened by applying the B-factor of −250 Å2 (H) Fourier shell correlation as a function of resolution for 30S•RNAP complexes. (I) Fourier shell correlation as a function of resolution for the 30SΔS1•RNAP complex.
Figure 2 with 2 supplements
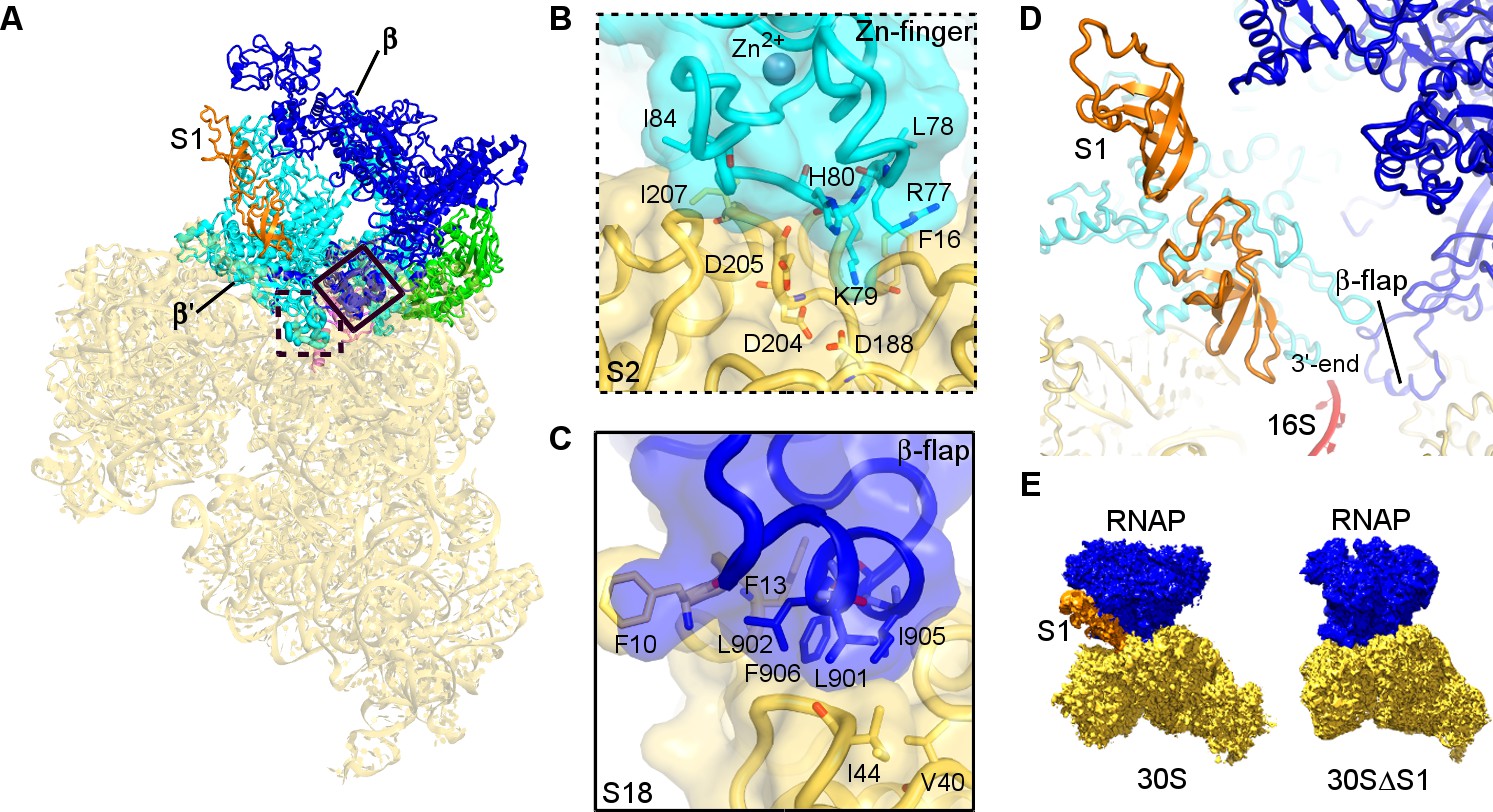
Structural basis for binding of RNAP to the 30S subunit.
(A). Two binding sites of RNAP (boxed). (B) Close-up view of the Zn-finger interactions with S2. (C) Close-up view of the β−flap helix packing on S18. Molecular surface, secondary structure and sticks are shown in panels (B) and (C). (D) Position of two OB domains of S1 (orange) near the 3′ end of 16S rRNA (red). (E) Comparison of segmented maps of the 30S•RNAP complex formed with and without S1.
Figure 2—figure supplement 1
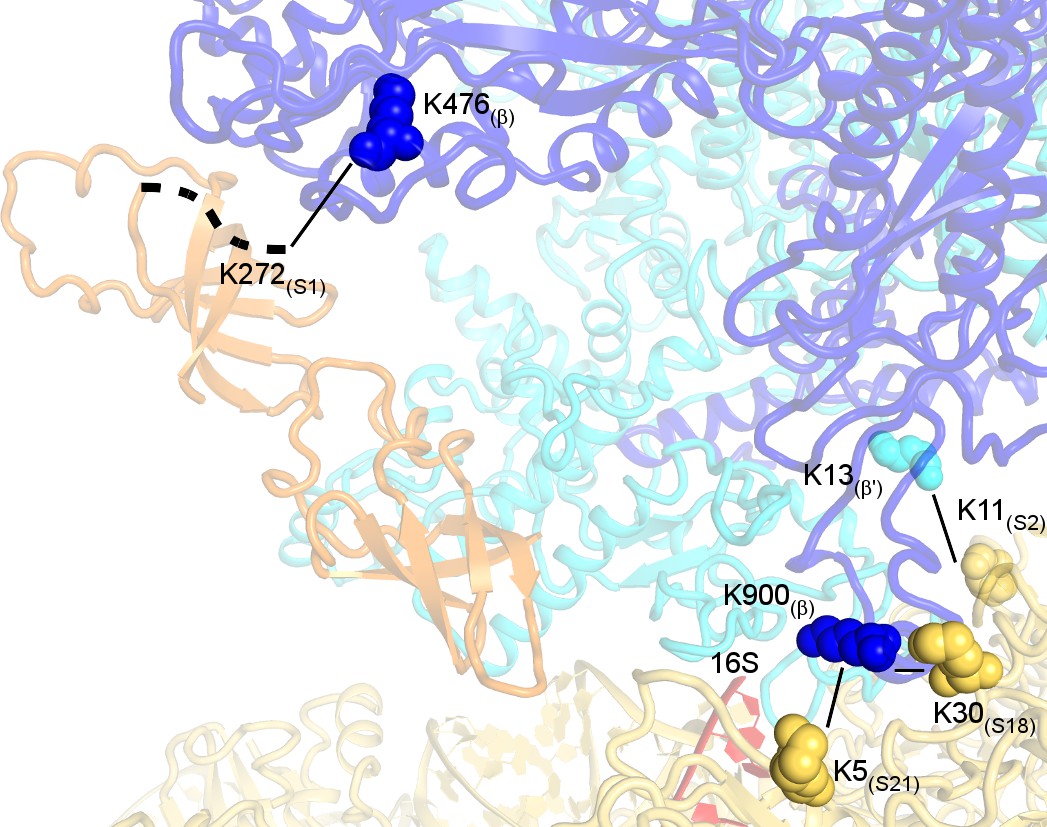
Crosslinked sites mapped on the 30S•RNAP structure.
Crosslinks with e-value <1.0 × 10⁻³ and S1(K272)-β(K476) with e-value = 6.47 × 10⁻³ are shown.
Figure 2—figure supplement 2
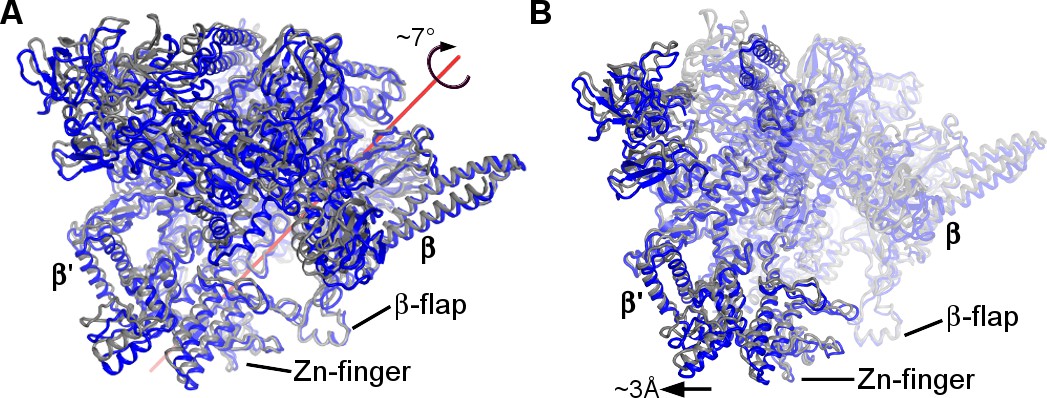
Conformational rearrangements of RNAP between the non-rotated (blue) and rotated (gray) states.
(A) Rotation of RNAP is shown relative to the 30S subunit (30S subunits were aligned). (B) A shift of the β′ subunit relative to the β-subunit (β-subunits were aligned).
Figure 3 with 1 supplement
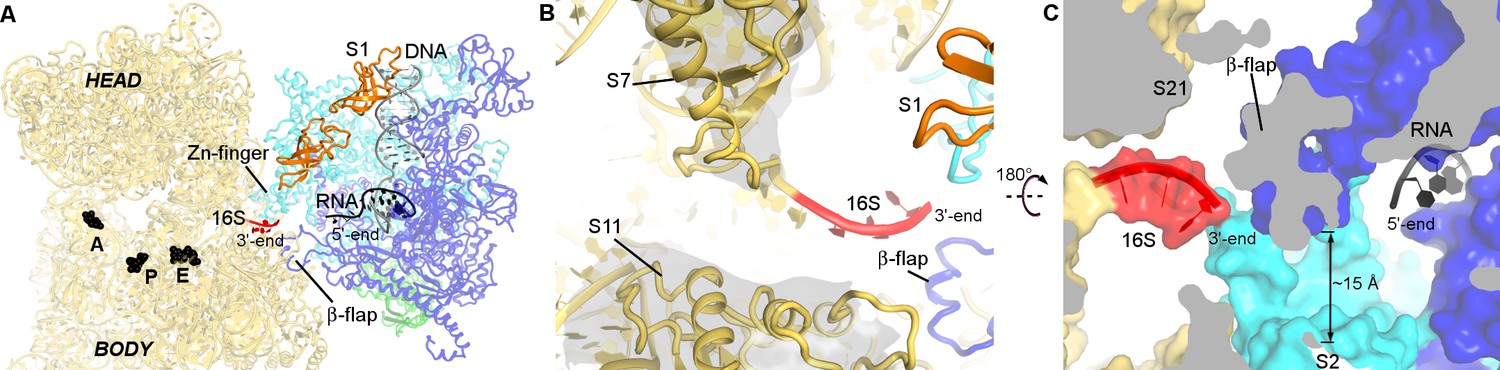
RNA exit region of RNAP is next to the SD-binding site of the 30S subunit.
(A) Positions of DNA and RNA (gray and black), inferred from the elongation complex (Vassylyev et al., 2007a) (PDB 2O5I), relative to the 30S subunit. G530, A790 and G693 of 16S rRNA (black) denote the A, P and E sites on the 30S subunit. (B) The opening between S7 (head) and S11 (platform) of the 30S subunit. Cryo-EM density around S7 and S11 is shown (gray surface, shown at σ = 5). (C) RNA exit of RNAP is near the 3′-end of 16S rRNA. RNA bound to RNAP elongation complex is shown in black.
Figure 3—figure supplement 1
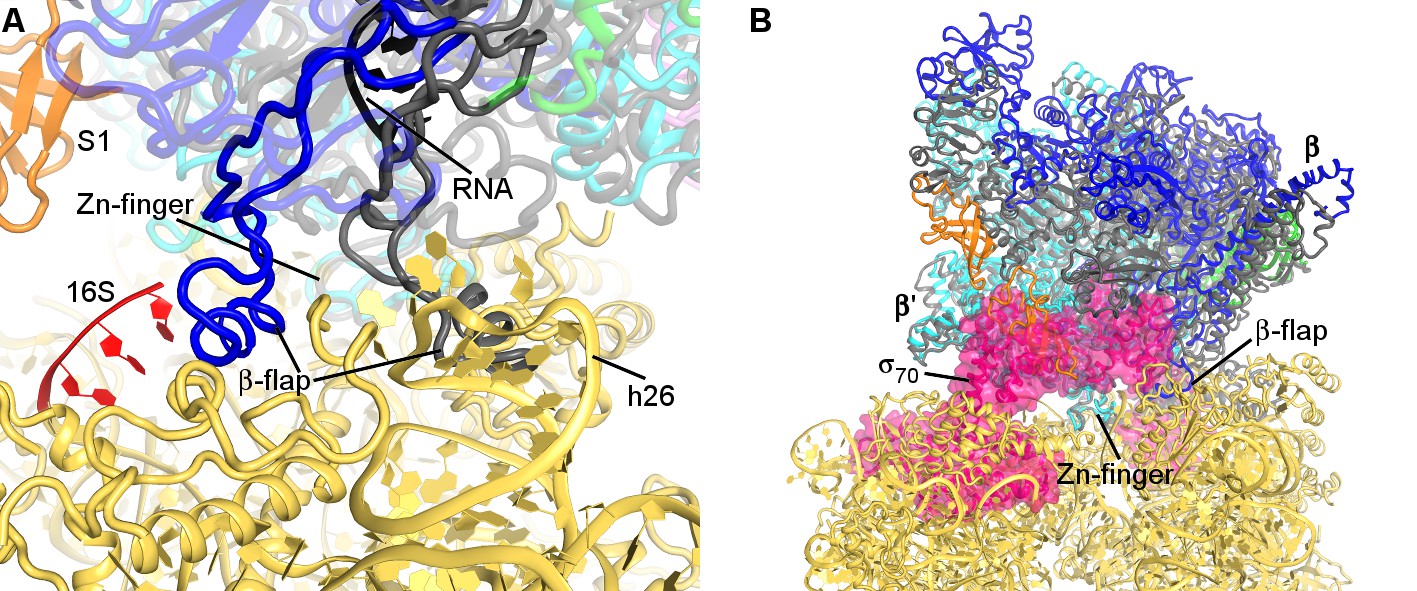
Comparison of RNAP structure in the 30S•RNAP complex with RNAP elongation complex and holoenzyme.
(A) Superposition with the crystal structure of T. thermophilus elongation complex (shown in gray) bound with RNA and DNA (PDB 2O5I) (Vassylyev et al., 2007b) suggests rearrangement of the flexible β-flap helix. (B) Superposition with the crystal structure of E. coli RNAP holoenzyme (PDB 4YG2) (Murakami, 2013) (shown in gray) shows prominent clash of σ70 (pink) with S1 and the 30S head. RNAP from the non-rotated 30S•RNAP structure is shown in both panels. Superposition was achieved by structural alignment of Zn-finger domain of β′-subunits.
Figure 4
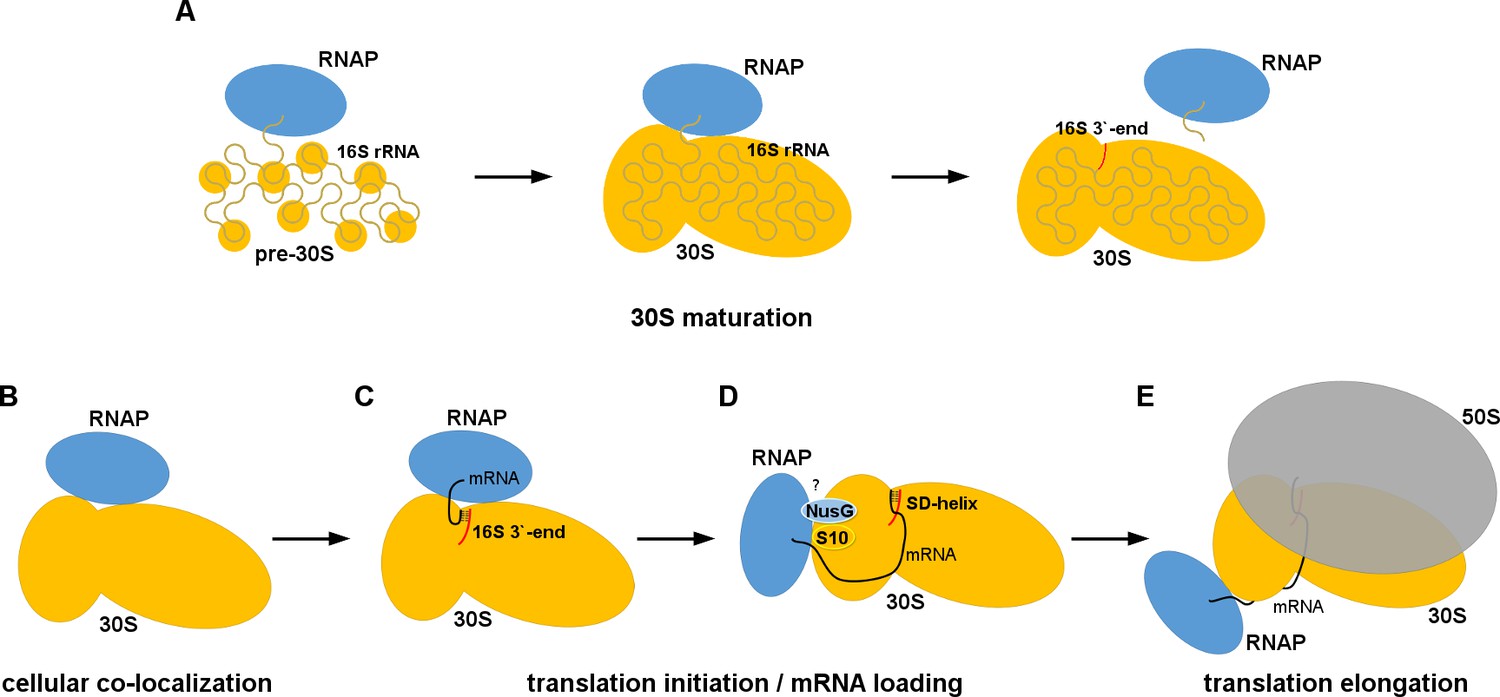
Models for 30S•RNAP complex formation in transcription-translation coupling.
(A) Promotion of co-transcriptional maturation of the 30S subunit. Direct interaction might facilitate 16S rRNA folding, 30S protein assembly or rRNA cleavage. (B-E) Coupling of mRNA transcription with translation. 30S-RNAP binding might co-localize 30S and RNAP or structurally pre-arrange 30S to facilitate mRNA loading onto the 30S subunit for co-transcriptional translation initiation.
Figure 5
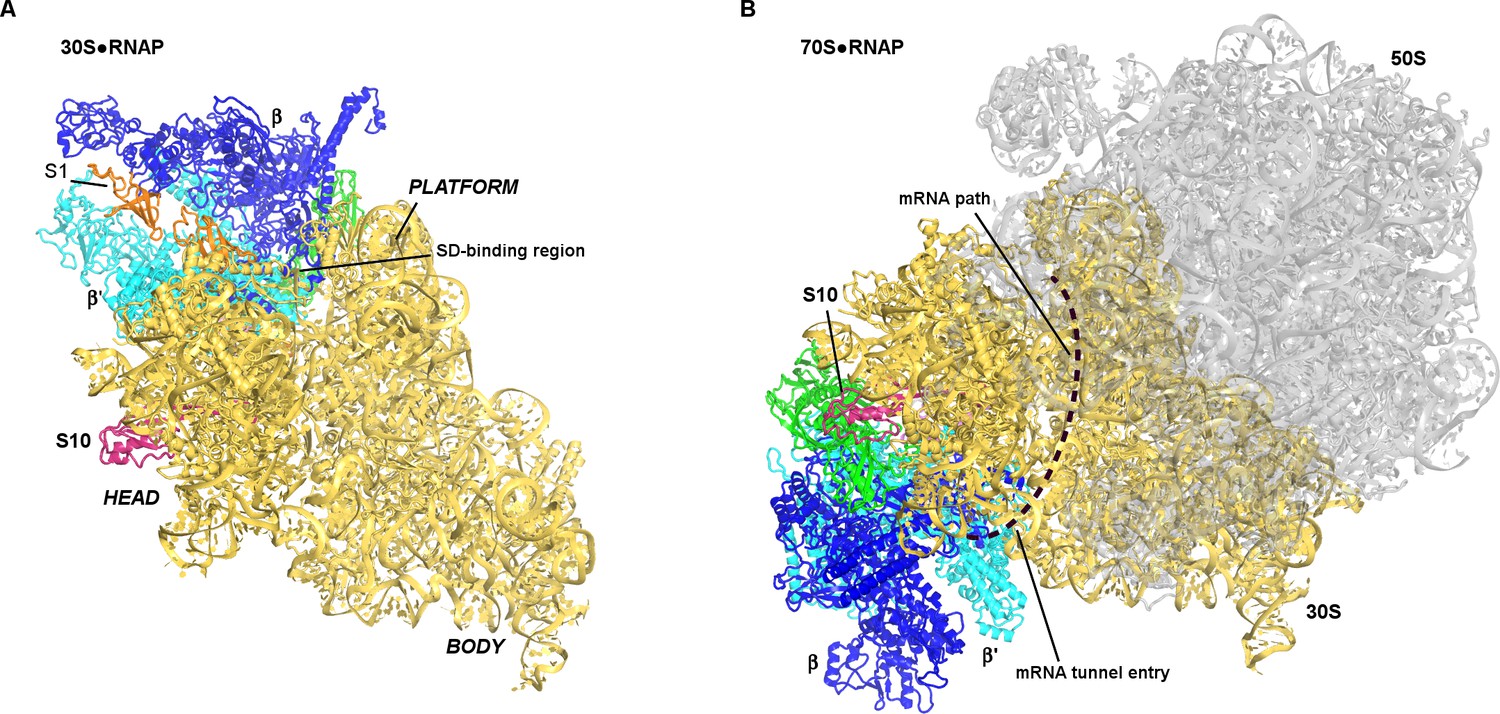
Positions of RNAP on the 30S subunit (this work, panel A) and the 70S elongation complex ([Kohler et al., 2017]; panel B).
The views show similar orientations of the 30S subunit. The 50S subunit for the mRNA-tethered 70S•RNAP structure (PDB 5MYI) (Kohler et al., 2017) is shown in gray and was adapted from a high-resolution 70S structure (PDB 5U9F) (Demo et al., 2017). RNAP domains are colored in green (α-subunits), blue (β-subunit) and cyan (β’-subunit). Protein S10 is shown in pink.
Tables
Table 1
In vitro BS3 X-links between subunits of E. coli RNA polymerase and 30S ribosome subunit.
Positions of X-linked residues are numbered according to full polypeptide sequences of corresponding proteins (column A) or sequences of X-linked peptides (1 being the N-terminal residue of the each peptide) (column C). Lower e-value indicates higher confidence of computational discovery of a given X-link (column B). In cases where several precursors for a given X-link were discovered (column F) the sequence of the X-linked peptide (column C), theoretical mass (column D), and experimental deviation from the theoretical mass (column E) are shown for the precursor with the lowest e-value (column B).
| X-link | Lowest e-value | Sequence of X-linked peptides and location of X-linked residues | Theoretical precursor mass (Da) | Deviation from theoretical mass (Da) | Number of precursors |
|---|---|---|---|---|---|
| RpoB(900) RS1(450) | 4.65E-010 | GETQLTPEEKLLR(10)-KGAIVTGK(1) | 2423.363414 | 0.99628 | 1 |
| RpoC(87) RS1(450) | 2.85E-007 | GVICEKCGVEVTQTK(6)-KGAIVTGK(1) | 2617.381784 | 2.99751 | 1 |
| RpoC(13) RS2(11) | 6.73E-007 | AQTKTEEFDAIK(4)-DMLKAGVHFGHQTR(4) | 3113.560294 | 3.00782 | 1 |
| RpoB(900) RS18(30) | 9.38E-005 | GETQLTPEEKLLR(10)-DIATLKNYITESGK(6) | 3202.697164 | 2.00093 | 1 |
| RpoB(900) RS21(5) | 2.75E-004 | GETQLTPEEKLLR(10)-PVIKVR(4) | 2361.363024 | −0.00541 | 2 |
| RpoC(87) RS4(185) | 1.09E-003 | GVICEKCGVEVTQTK(6)-RKPER(2) | 2529.304204 | 2.00309 | 1 |
| RpoB(265) RS19(29) | 3.12E-003 | VYVEKGRR(5)-KPLR(1) | 1655.983404 | −0.01571 | 2 |
| RpoB(476) RS1(272) | 6.47E-003 | AVKER(3)-QLGEDPWVAIAKR(12) | 2221.221774 | −0.00039 | 1 |
| RpoC(87) RS4(185) | 7.47E-003 | GVICEKCGVEVTQTK(6)-RKPER(2) | 2529.304204 | 2.00389 | 2 |
| RpoC(50) RS21(25) | 1.36E-002 | TFKPER(3)-SCEKAGVLAEVR(4) | 2232.157124 | 0.99497 | 1 |
| RpoB(265) RS19(29) | 1.50E-002 | VYVEKGRR(5)-KPLR(1) | 1655.983404 | −0.01581 | 1 |
| RpoB(909) RS21(25) | 2.25E-002 | AIFGEKASDVK(6)-SCEKAGVLAEVR(4) | 2619.357654 | 1.00524 | 1 |
| RpoC(50) RS1(434) | 8.29E-002 | TFKPER(3)-ISLGVKQLAEDPFNNWVALNK(6) | 3269.744714 | 4.00858 | 1 |
| RpoC(1192) RS16(80) | 8.79E-002 | LVITPVDGSDPYEEMIPKWR(18)-VAALIKEVNKAA(10) | 3707.984664 | 2.00023 | 1 |
Table 2
Cryo-EM data collection and refinement statistics for 30S•RNAP structures
https://doi.org/10.7554/eLife.28560.016| non-rotated | rotated | ΔS1 | |
|---|---|---|---|
| PDB code | 6AWB | 6AWC | 6AWD |
| EMDB code | EMD-7014 | EMD-7015 | EMD-7016 |
| Data collection | |||
| EM equipment | FEI Titan Krios | FEI Titan Krios | FEI Talos Arctica |
| Voltage (kV) | 300 | 300 | 200 |
| Detector | K-2 | K-2 | K-2 |
| Pixel size (Å) | 0.82 | 0.82 | 0.94 |
| Electron dose (e-/Å2) | 40 | 40 | 40 |
| Defocus range (μm) | −0.8 to −3.0 | −0.8 to −3.0 | −0.8 to −3.0 |
| Reconstruction | |||
| Software | Frealign v9.11 | Frealign v9.11 | Frealign v9.11 |
| Number of particles used | 15,012 | 10,090 | 21123 |
| Final resolution (Å) | 6.7 | 7.9 | 8.1 |
| Map-sharpening B factor (Å2) | −198 | −205 | −200 |
| Model composition | |||
| Non-hydrogen atoms | 75316 | 75169 | 76452 |
| Protein residues | 5743 | 5726 | 5573 |
| RNA bases | 1443 | 1443 | 1539 |
| Refinement | |||
| Software | RSRef and Phenix | RSRef and Phenix | RSRef and Phenix |
| Correlation Coeff (%; Phenix) | 75.9 | 76.7 | 78.3 |
| R-factor (RSRef) | 0.250 | 0.251 | 0.257 |
| Validation (proteins) | |||
| MolProbity score | 2.70 | 2.60 | 2.67 |
| Clash score, all atoms | 20.25 | 18.90 | 20.47 |
| Ramachandran-plot statistics (%) | |||
| Favored (overall) | 80.0 | 81.9 | 79.6 |
| Allowed (overall) | 16.2 | 14.6 | 16.3 |
| Outlier (overall) | 3.8 | 3.5 | 4.1 |
| R.m.s. deviations | |||
| Bond length (Å) | 0.005 | 0.004 | 0.004 |
| Bond angle (˚) | 1.097 | 1.111 | 1.027 |
| Validation (RNA) | |||
| Correct sugar puckers (%) | 99.9 | 99.9 | 99.9 |
| Good backbone conformation (%) | 88.2 | 88.6 | 88.2 |
Additional files
-
Transparent reporting form
- https://doi.org/10.7554/eLife.28560.017
Download links
A two-part list of links to download the article, or parts of the article, in various formats.
Downloads (link to download the article as PDF)
Open citations (links to open the citations from this article in various online reference manager services)
Cite this article (links to download the citations from this article in formats compatible with various reference manager tools)
Structure of RNA polymerase bound to ribosomal 30S subunit
eLife 6:e28560.
https://doi.org/10.7554/eLife.28560


