Dynamics of the IFT machinery at the ciliary tip
- University of California, Berkeley, United States
- University of Minnesota, United States
Figures
Figure 1 with 3 supplements
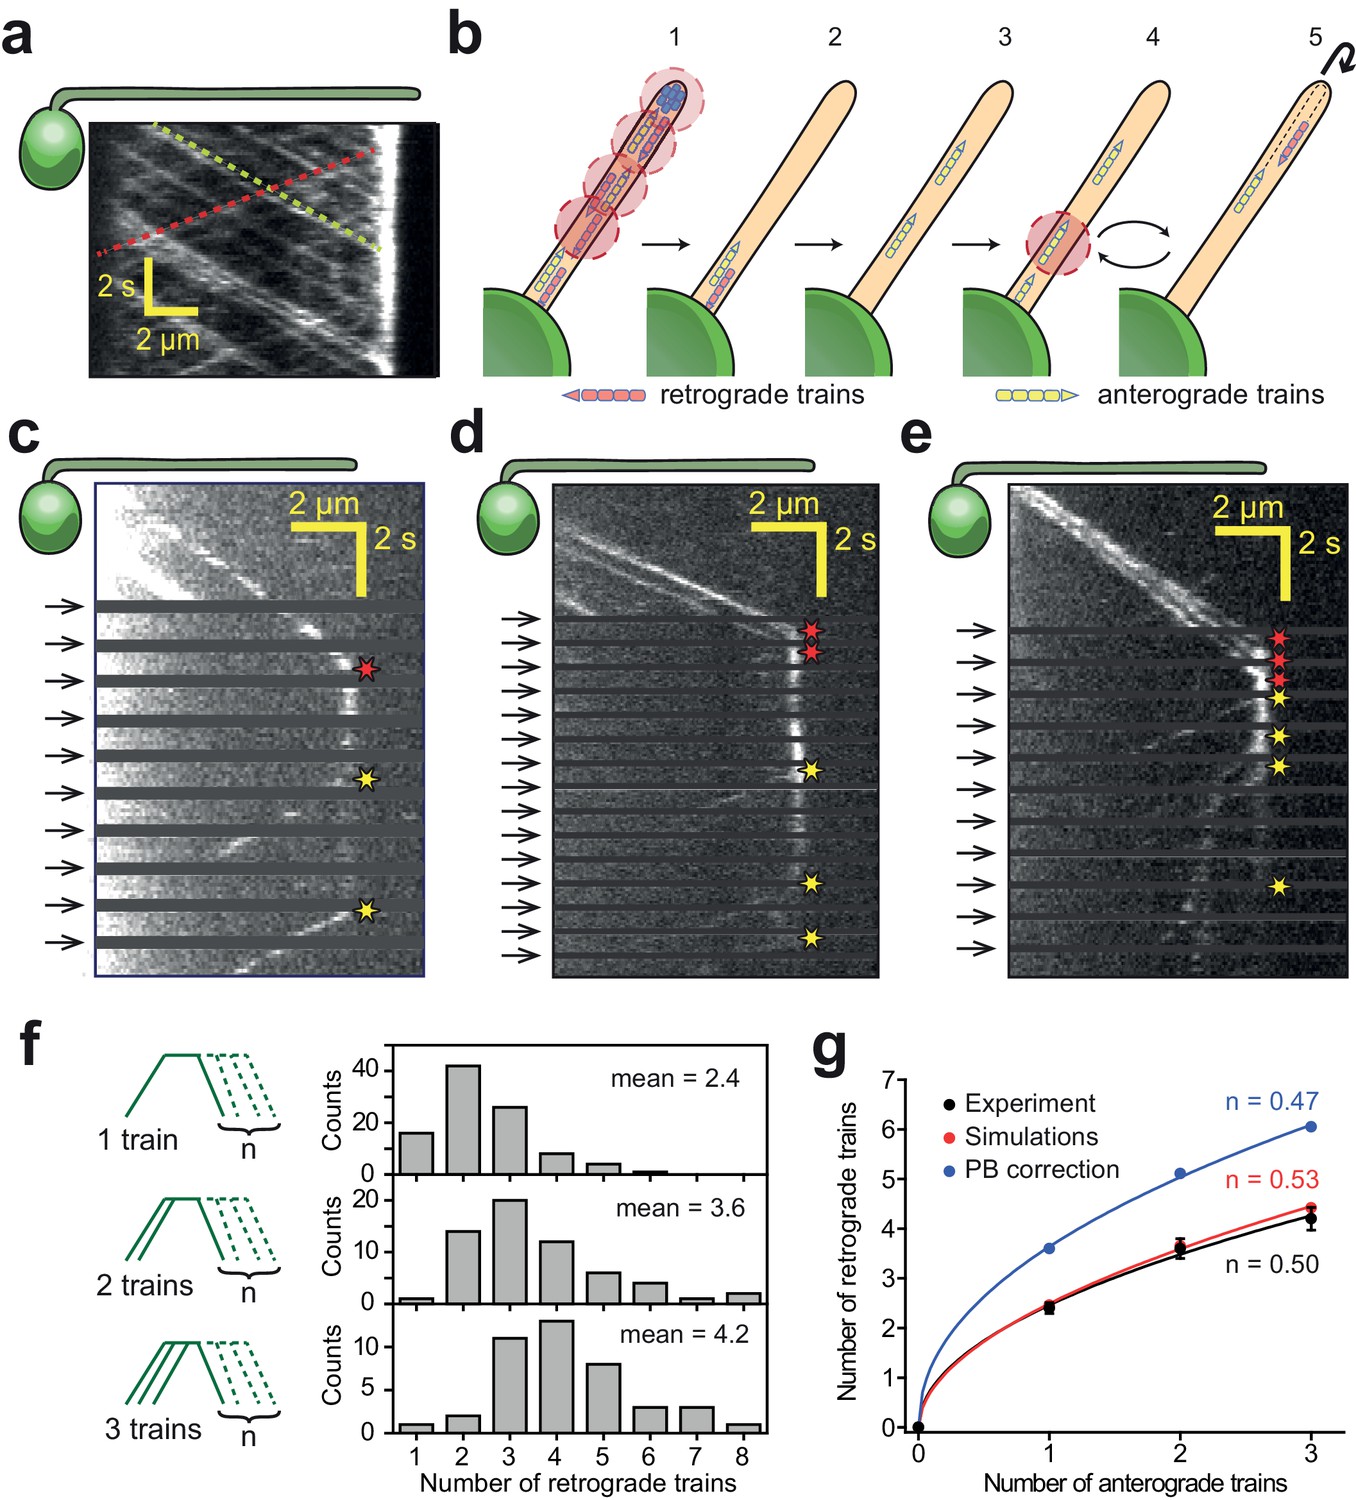
IFT trains split apart and mix with each other at the flagellar tip.
(a) Kymograph of a surface-immobilized pf18 IFT27-GFP strain shows that IFT trains move bidirectionally along the flagellum, only reversing direction at the tip and the base. Multiple IFT trains accumulate at the flagellar tip. Representative anterograde and retrograde trajectories are shown with yellow and red dashed lines, respectively. (b) Schematic representation of the PhotoGate assay. (1) The distal half of the flagellum is prebleached by moving the powerful gate beam from the flagellar tip to near the base of the flagellum. (2–3) The gate beam is turned off to allow a single anterograde train to enter the flagellum without photobleaching. (4) The beam is then repeatedly turned on for 0.2 s to photobleach the successive trains entering the flagellum and (5) turned off for 0.8 s to image the single fluorescent train within the flagellum. Photobleached trains are not shown. (c–e) Kymographs of one (c), two (d) and three (e) fluorescent anterograde trains entering the flagellum. Anterograde trains pause at the flagellar tip and split into multiple retrograde trains that move back to the base. Arrival of fluorescent anterograde trains and departure of retrograde trains at the tip are shown with red and yellow stars, respectively. Arrows represent repetitive bleaching events near the base of the flagellum. (f) (Left) The number of fluorescent retrograde trains was quantified as a function of one, two or three fluorescent anterograde trains entering the flagellum after photobleaching. (Right) The average number of retrograde trains increased sub-proportionally with the number of fluorescent anterograde trains entering the flagellum. N = 97, 60, 42 train events from top to bottom, in 160 cells, from 13 independent experiments. (g) The number of detectable retrograde trains versus the numbers of incoming anterograde trains in PhotoGate experiments and Monte Carlo simulations (PB: photobleaching). Solid lines represent the fit of data to the power law (y = axn). n is less than one under each condition. Error bars represent s.e.m. (N = 10,000 for simulations).
Figure 1—figure supplement 1
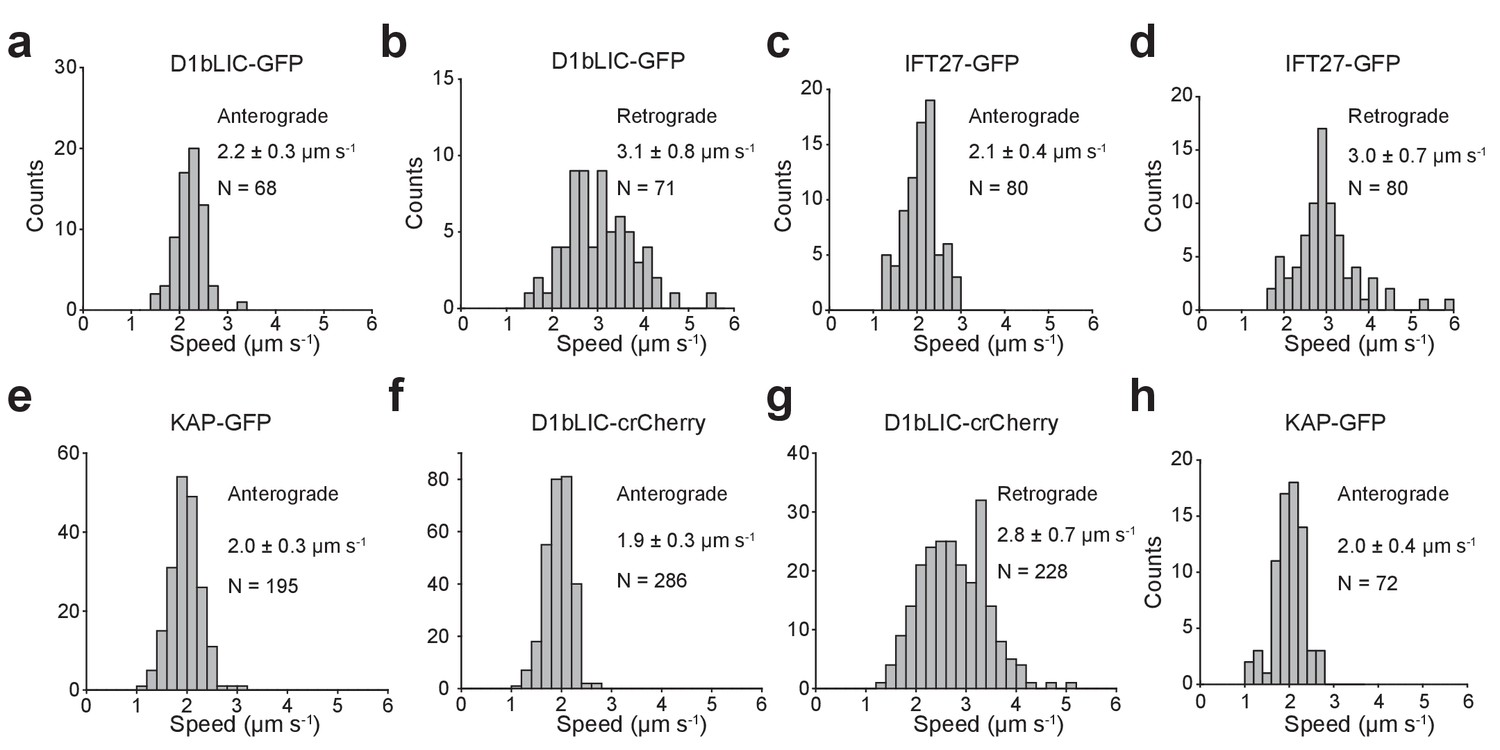
Anterograde and retrograde velocities of epitope-tagged IFT27, KAP, and D1bLIC.
(a,b) Anterograde (a) and retrograde (b) velocities of D1bLIC-GFP in d1blic::D1bLIC-GFP cells. (c, d) Anterograde (c) and retrograde (d) velocities of IFT27-GFP in pf18 IFT-27-GFP cells. (e) Anterograde velocities of KAP-GFP in d1blic::D1bLIC-crCherry KAP-GFP cells. (f, g) Anterograde (f) and retrograde (g) velocities of D1bLIC-crCherry in d1blic::D1bLIC-crCherry KAP-GFP cells. (h) Anterograde velocities of KAP-GFP in fla3::KAP-GFP cells. All velocities are reported as mean ± s.d. N represents the number of trains measured.
Figure 1—figure supplement 2
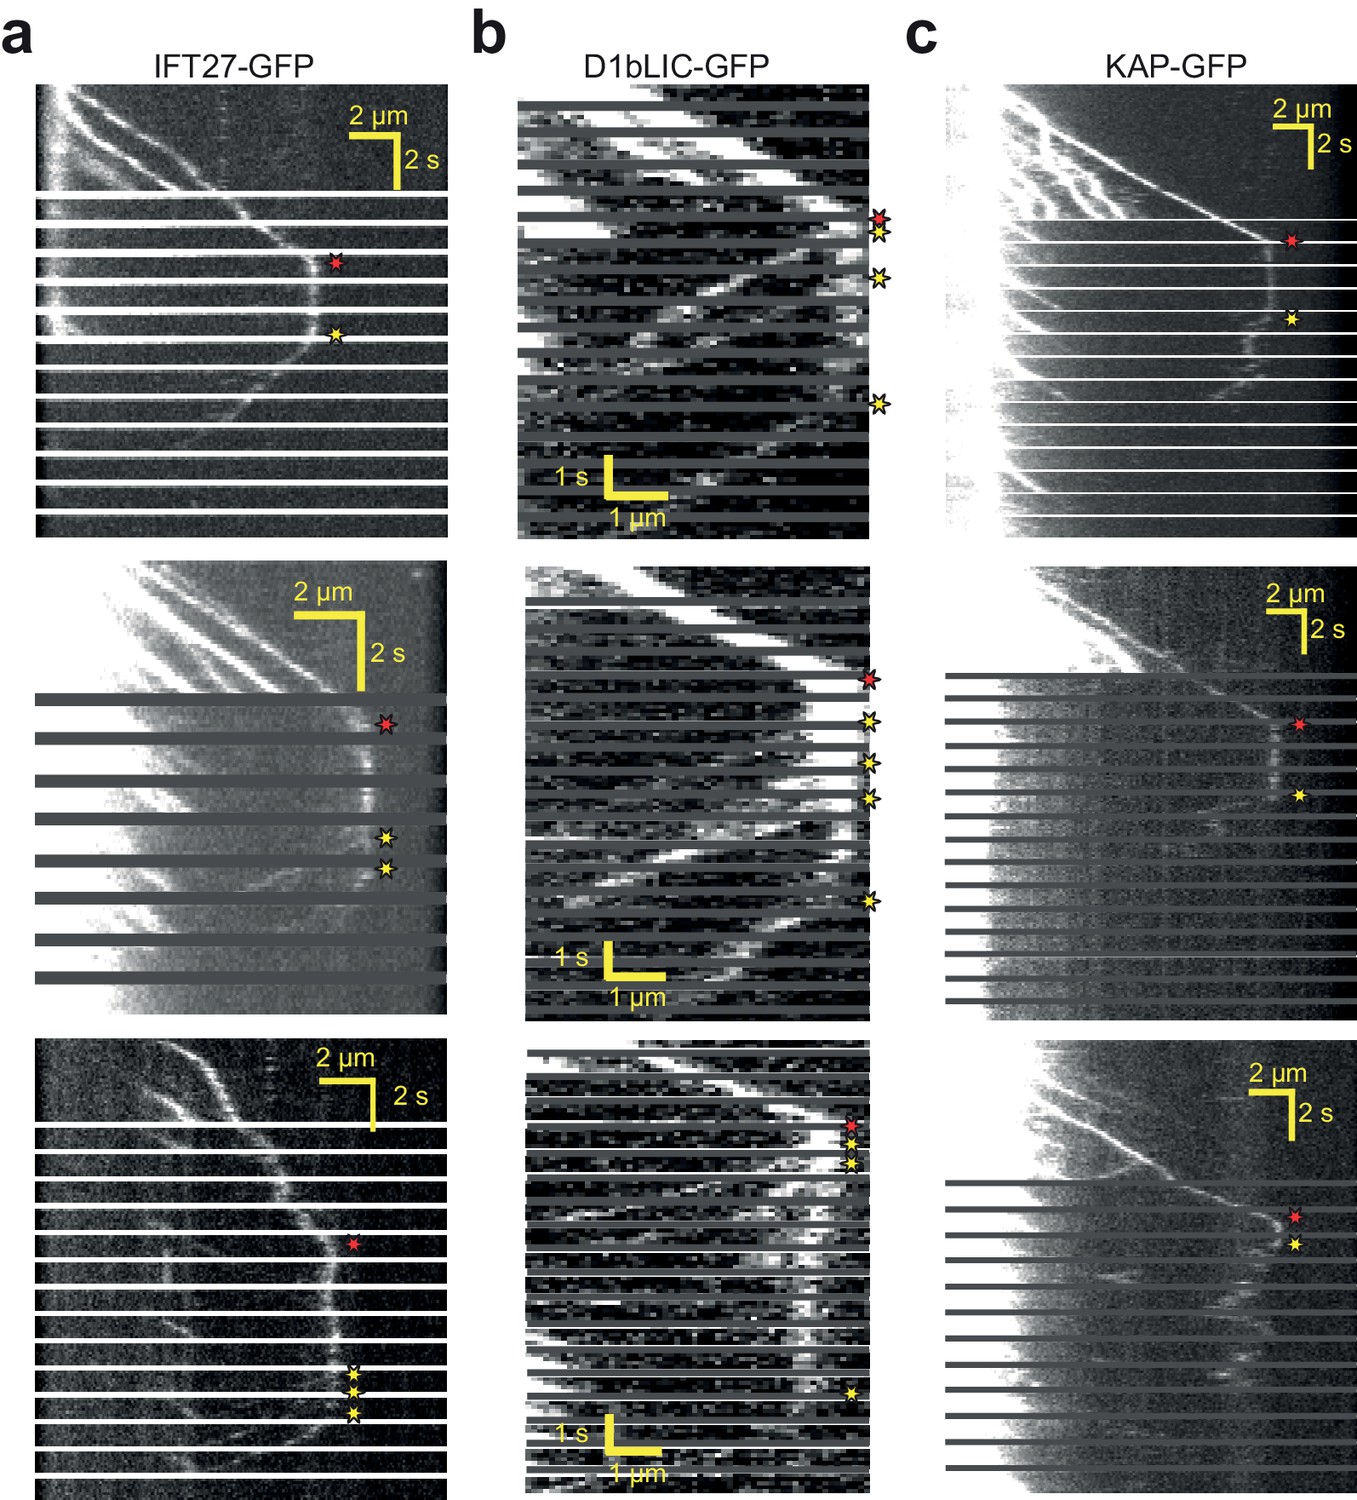
Additional examples for PhotoGate imaging of IFT27, D1bLIC, and KAP.
(a) IFT27 is moved to the tip on anterograde trains, remodels at the tip, and is returned to the flagellar base on retrograde trains. (b) Dynein is moved to the tip on anterograde trains, remodels at the tip, and moves retrogradely to the cell body. (c) Kinesin moves anterograde trains to the flagellar tip, dissociates from the IFT trains at the tip, and diffuses within the flagellum. Red and yellow stars indicate arrival to and departure from the tip, respectively.
Figure 1—figure supplement 3
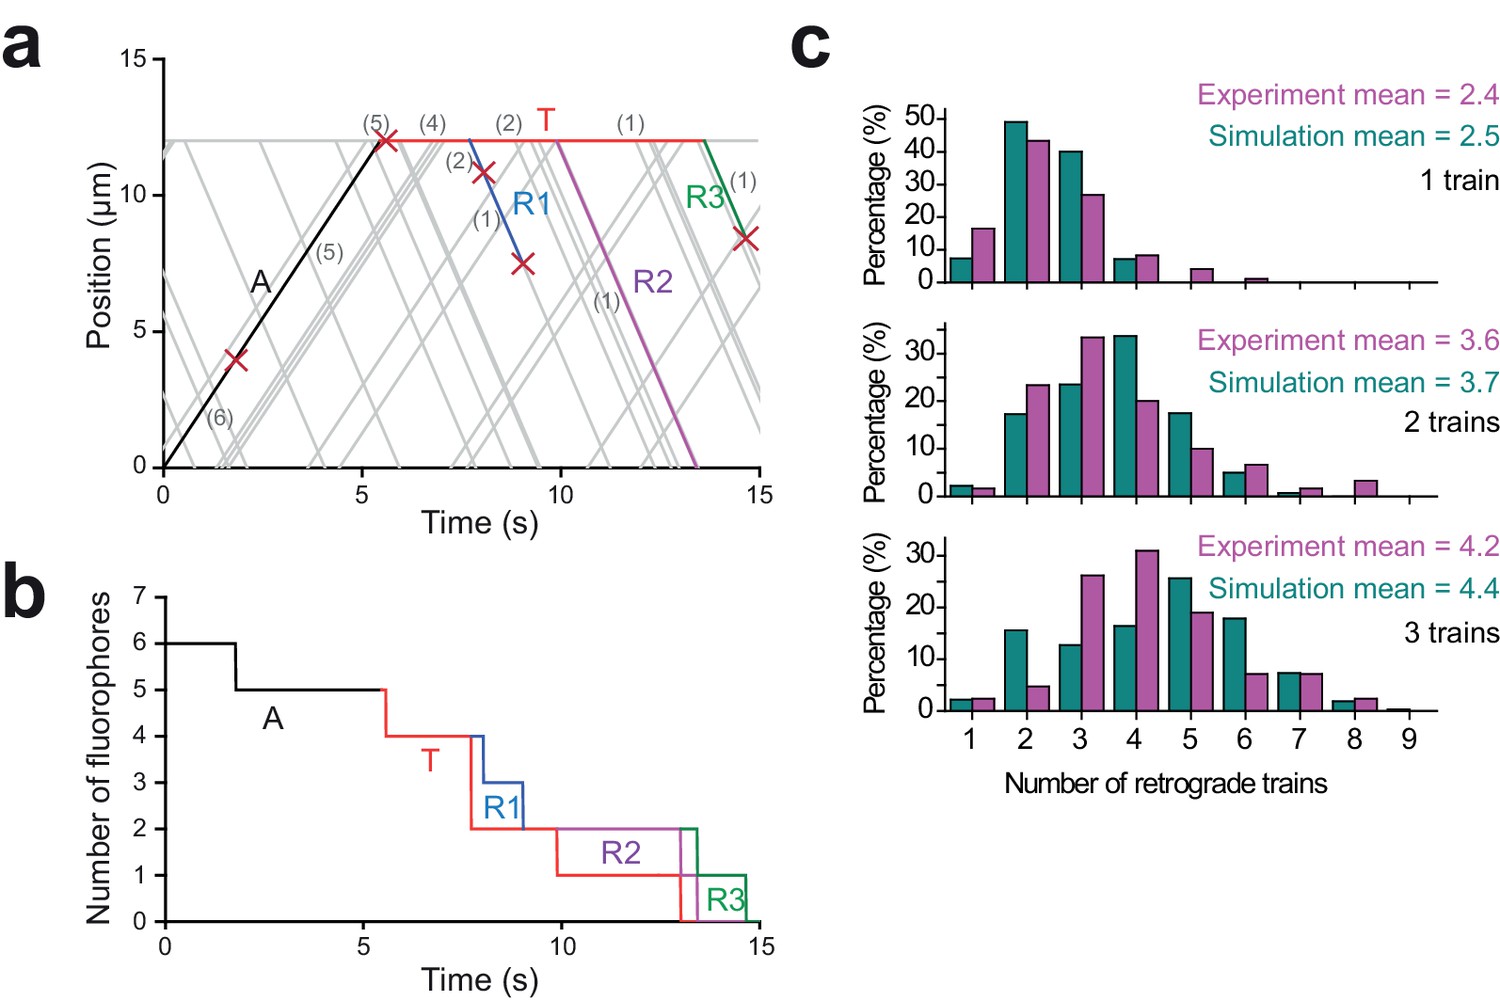
Monte Carlo simulations for the dynamics of IFT trains at the flagellar tip.
(a) A simulated kymograph with one anterograde IFT train (label A, black line) reaching the flagellar tip, joining the pool at the tip (label T, red line), and returning as three retrograde IFT trains (label R1-R3; blue, purple, and green lines). The anterograde train originally carries six bright fluorophores, and each fluorophore either bleaches or returns back to the flagellar base. The number of fluorophores is labeled in grey within parentheses, and each bleaching event is indicated by a red cross. (b) The total number of fluorophores in the anterograde train (label A, black line), at the flagellar tip (label T, red line), and the retrograde trains (label R1-R3, blue line, purple line and green line) are shown as a function of time for the example kymograph shown in (a). Step-by-step reduction in GFP numbers in anterograde and retrograde trains is due to photobleaching of GFPs at 0.07 s−1 under TIR illumination. (c) The number of detectable retrograde trains in PhotoGate assays with one, two, and three fluorescent anterograde trains arriving at the tip in experiments (Figure 1f) and Monte Carlo simulations (N = 10,000 for simulations).
Figure 2 with 1 supplement
Tip turnaround of IFT trains is a multistep process regulated by dynein activity and extracellular Ca2+.
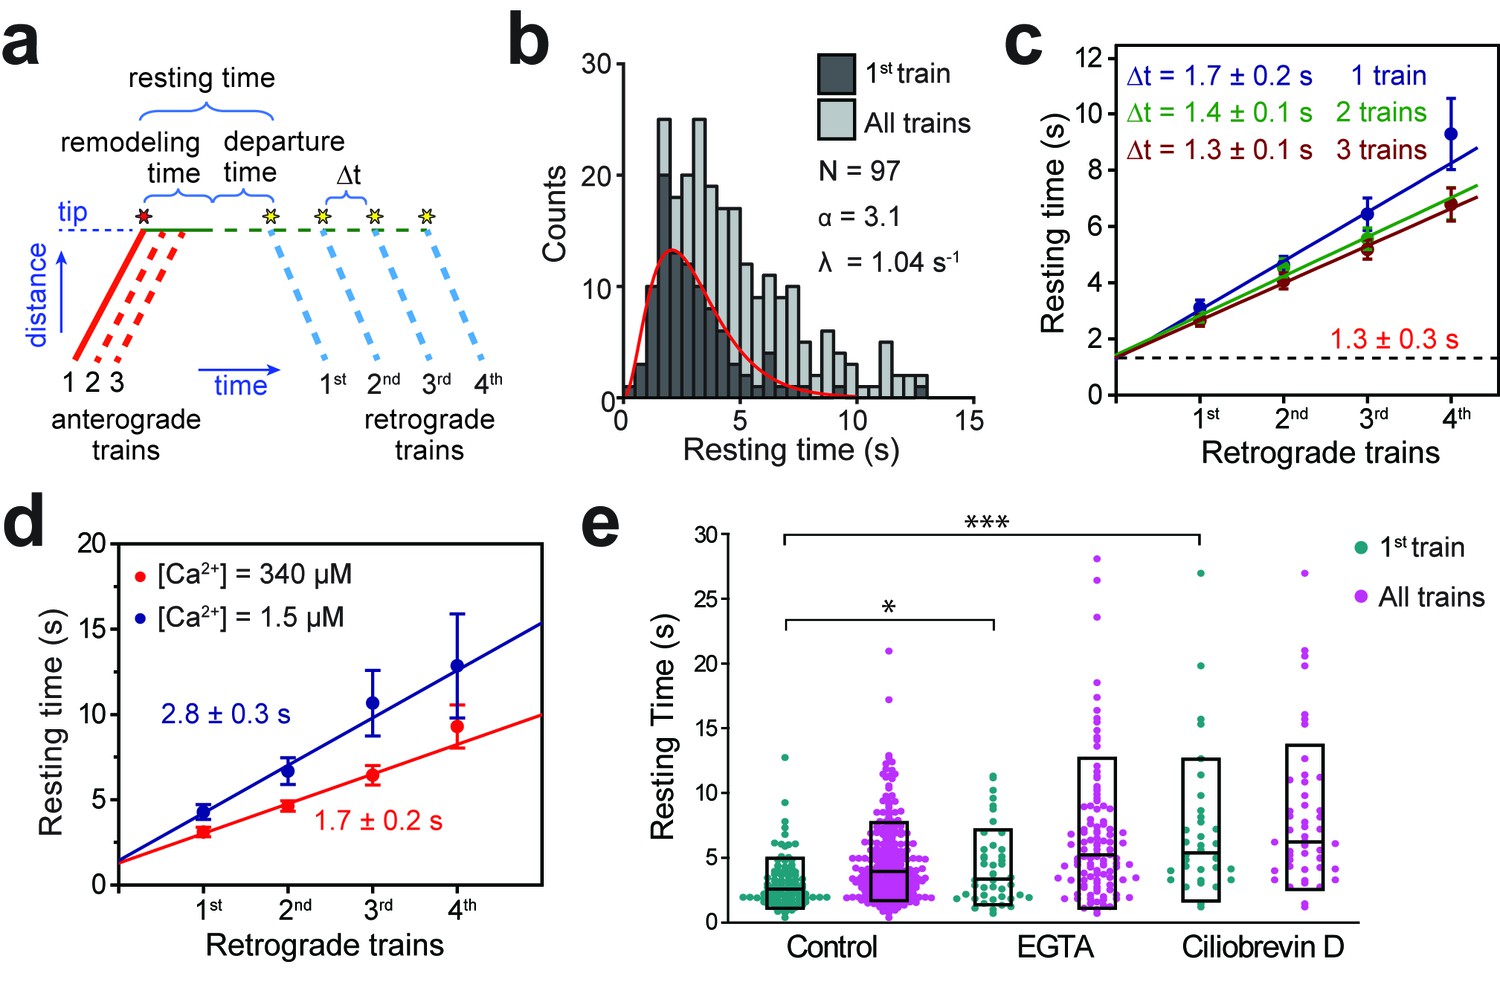
(a) The schematic describes the definition of tip resting time, remodeling time, and departure time measured from the kymographs. Arrival of the first fluorescent anterograde train and the departure of retrograde trains are shown with red and yellow stars, respectively. Tip resting time and departure time are only shown for the first retrograde train. Tip remodeling time is assumed to be the same for each train. Δt represents the time between the departure of successive retrograde trains. (b) The tip resting time histogram of the first retrograde IFT27-GFP train (dark grey) and all of the trains (light grey) emanating from a single anterograde train. The histogram of the first retrograde trains was fitted to a Gamma function (red curve). α and λ are shape and rate parameters, respectively. (c) The linear fit to the average tip resting time reveals Δt between successive trains. The y-intercept (black dashed line) represents the tip remodeling time. Errors represent standard error of the linear fit. (d) Average tip resting times of the first, second, third, and fourth retrograde IFT27-GFP trains coming out of an anterograde train for cells in TAP media (red, N = 97) and calcium-depleted media (blue, N = 44). Errors represent standard error of the linear fit. (e) IFT27-GFP tip resting times in 0.5 mM EGTA and 0.1 mM ciliobrevin D treated cells. The line within the boxplot represents the mean. The outer edges of the box represent standard deviation. N = 97, 241, 44, 109, 34, and 48 retrograde trains from left to right, in a total of 20 independent experiments (Welch’s t-test, *p<0.05, ***p<0.001, as compared to no treatment for first retrograde trains).
Figure 2—figure supplement 1
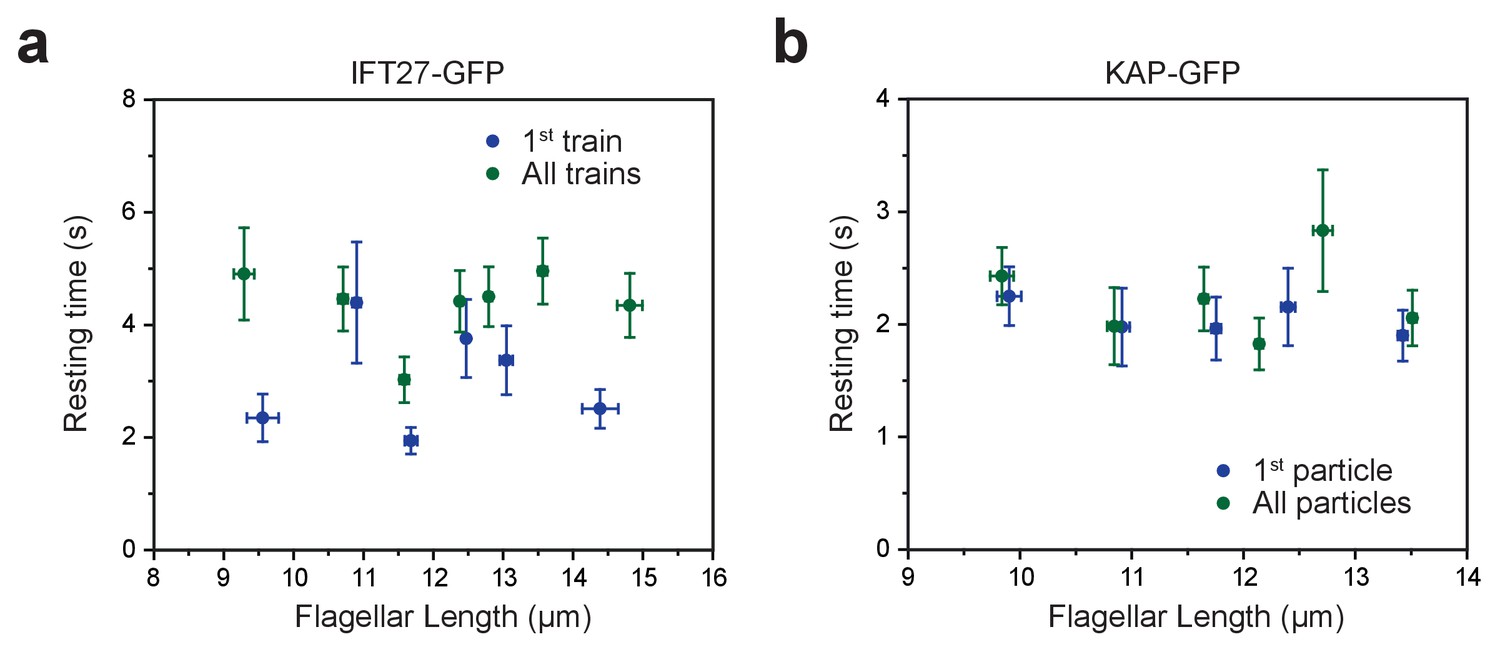
Tip resting time is independent of flagellar length.
(a,b) The average tip resting time of IFT27-GFP trains (a) and KAP-GFP particles (b) at different lengths of steady-state flagella. Error bars in both axes represent s.e.m. For IFT27-GFP, N = 60 (first train) and 136 (all trains). The bin size is 10 particles. For KAP-GFP, N = 95 (first particle) and 111 (all particles). The bin size is 20 particles.
Figure 3 with 2 supplements
PhotoGate reveals the tip turnaround behavior of IFT motors.
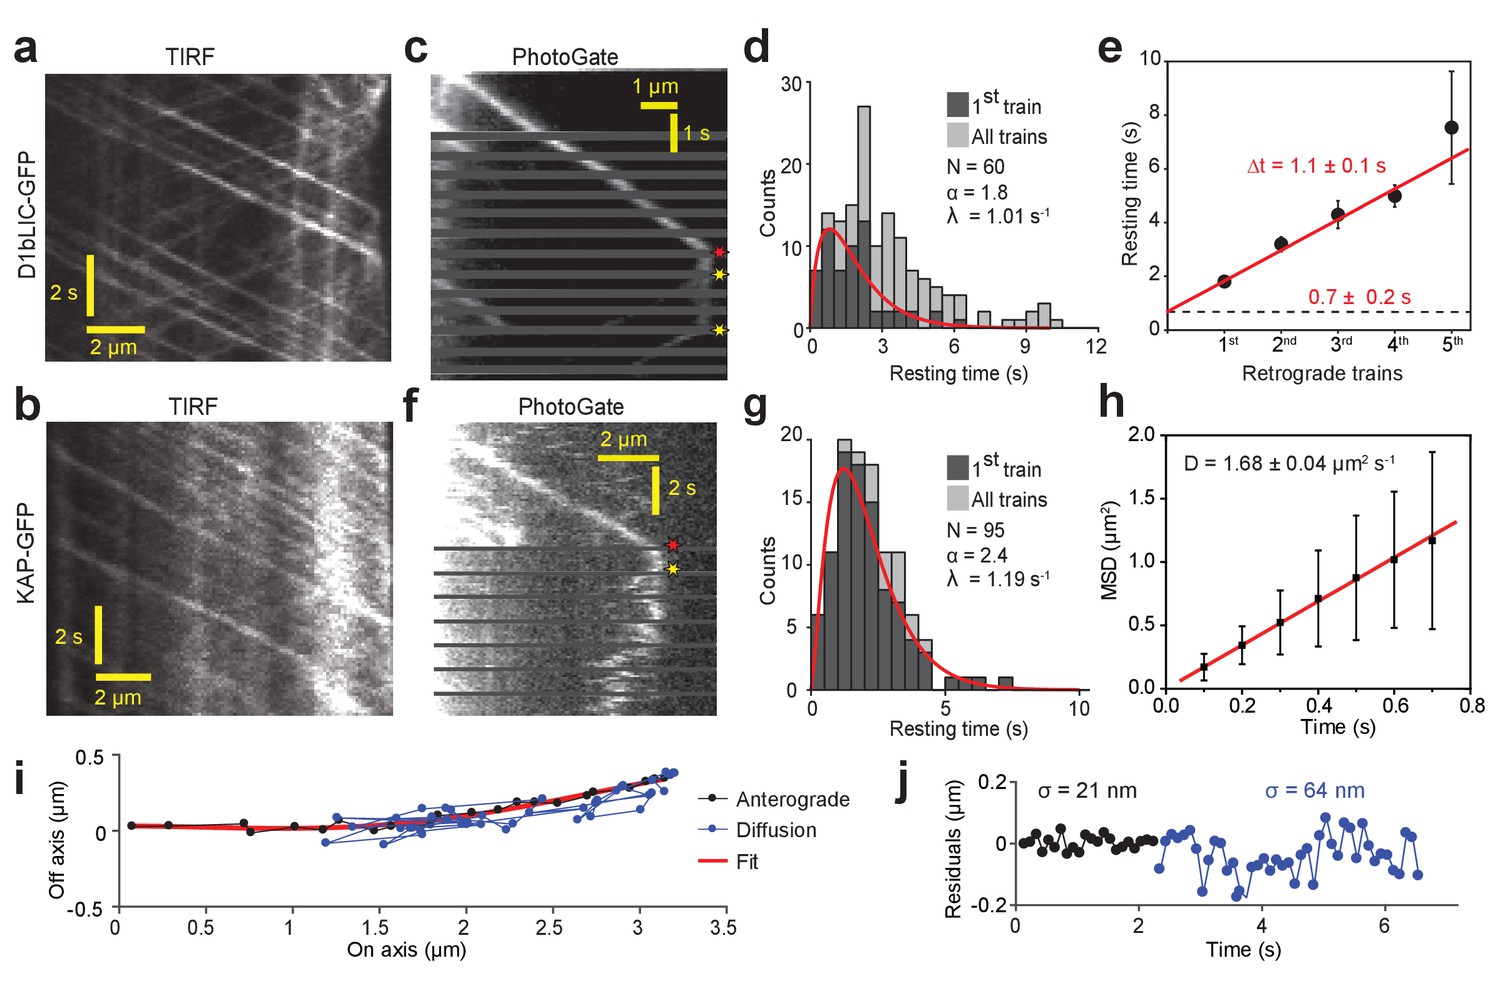
(a) In a conventional TIR assay, anterograde and retrograde D1bLIC-GFP traces were clearly visible, but the tip behavior of individual trains could not be discerned. (b) In a conventional TIR assay, KAP-GFP was observed to move anterogradely, but the retrograde transport of KAP was rarely observed. (c) PhotoGate imaging of D1bLIC-GFP shows that D1bLIC trains move to the tip anterogradely, split into multiple trains, and return to the base retrogradely. Red and yellow stars indicate arrival to and departure of D1bLIC-GFP from the tip, respectively. (d) The tip resting time histogram of D1bLIC-GFP. Tip resting time of the first retrograde trains are fit to a Gamma distribution (red curve; 95% c.i. for α is 1.30–2.52 and for λ is 0.69–1.47 s−1). N = 60 anterograde trains in 60 cells over nine independent experiments. (e) Averaged tip resting time of the first, second, third, and fourth retrograde D1bLIC-GFP particles returning from the tip (mean ± s.e.m.). (f) Kymograph analysis of a KAP-GFP cell imaged by PhotoGate. KAP undergoes active transport in the anterograde direction, pauses at the flagellar tip, and diffuses back to the flagellar base. (g) The tip resting time histogram of KAP-GFP. The red curve represents a fit of first train resting times to a Gamma distribution. N = 95 anterograde trains in 47 cells over four independent experiments (95% c.i. for α is 1.87–3.19 and for λ is 0.88–1.60 s−1). (h) MSD analysis of KAP-GFP diffusion after it leaves the flagellar tip reveals the average diffusion constant (N = 27, mean ± s.e.m.). (i) High-resolution tracking of a KAP-GFP particle reveals the two-dimensional trajectory during anterograde transport and diffusion. The red curve is the polynomial fit to the trace. (j) The residual plot to the trace in (i) reveals lateral fluctuations (σ) during anterograde transport (black) and diffusion (blue).
Figure 3—figure supplement 1
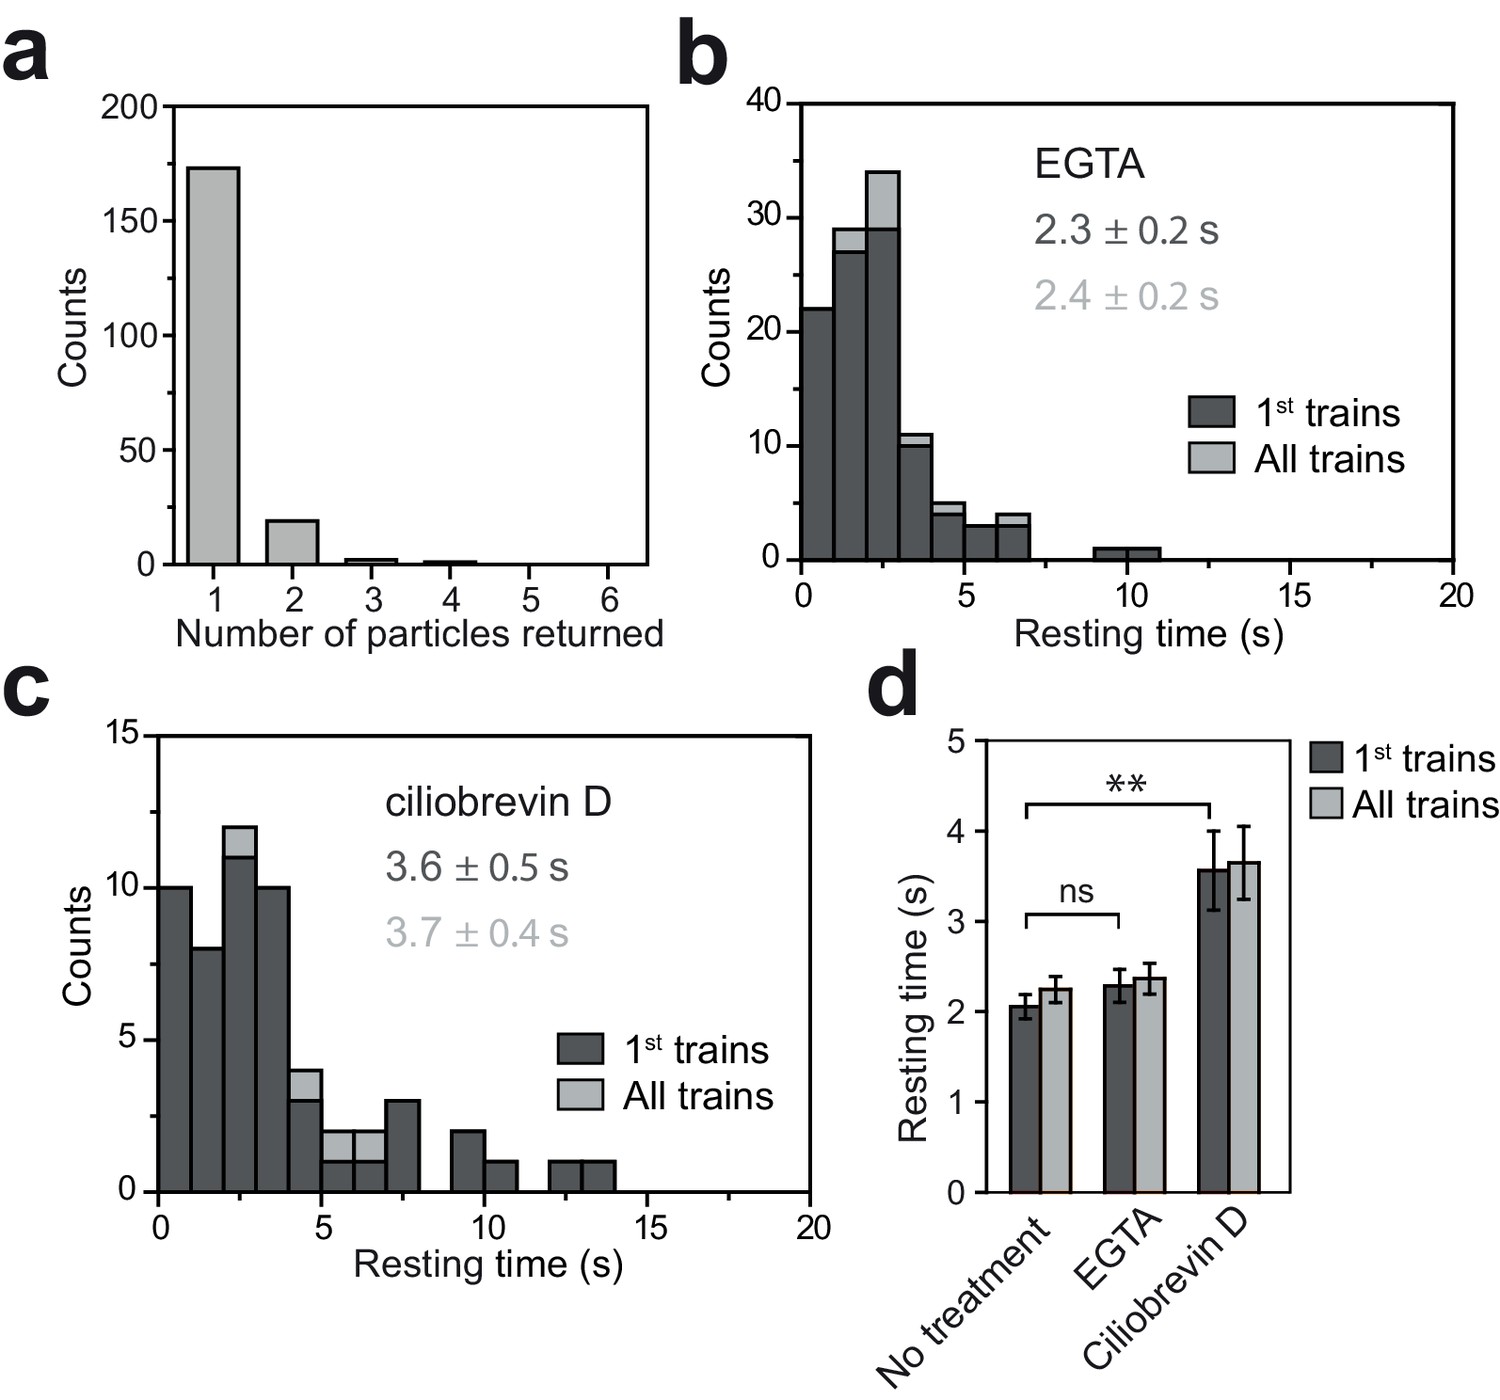
Tip resting time of KAP-GFP under EGTA and ciliobrevin D treatments.
(a) The number of fluorescent KAP particles emanating from a single fluorescent anterograde KAP particle at the tip. N = 195 trains in 106 cells over nine independent experiments. All KAP clusters displayed diffusive movement after leaving the tip. (b) The tip resting time histogram of KAP-GFP with EGTA treatment. N = 100 trains in 59 cells over five independent experiments. (c) Tip resting time histogram of KAP-GFP with ciliobrevin D treatment. N = 52 trains in 37 cells over four independent experiments (mean ± s.e.m.). (d) The average tip resting time for KAP-GFP under EGTA and ciliobrevin D treatments (**p<0.01 as compared to no treatment; ns is non-significant). Error bars represent s.e.m.
Figure 3—figure supplement 2
Example kymograph of KAP particle breaking apart after tip departure.
Kinesin moves anterograde trains to the flagellar tip, dissociates from the IFT trains at the tip, and diffuses within the flagellum. In this example, the KAP particle breaks apart into smaller particles while diffusing. Red and yellow stars indicate arrival to and departure from the tip, respectively.
Figure 4 with 2 supplements
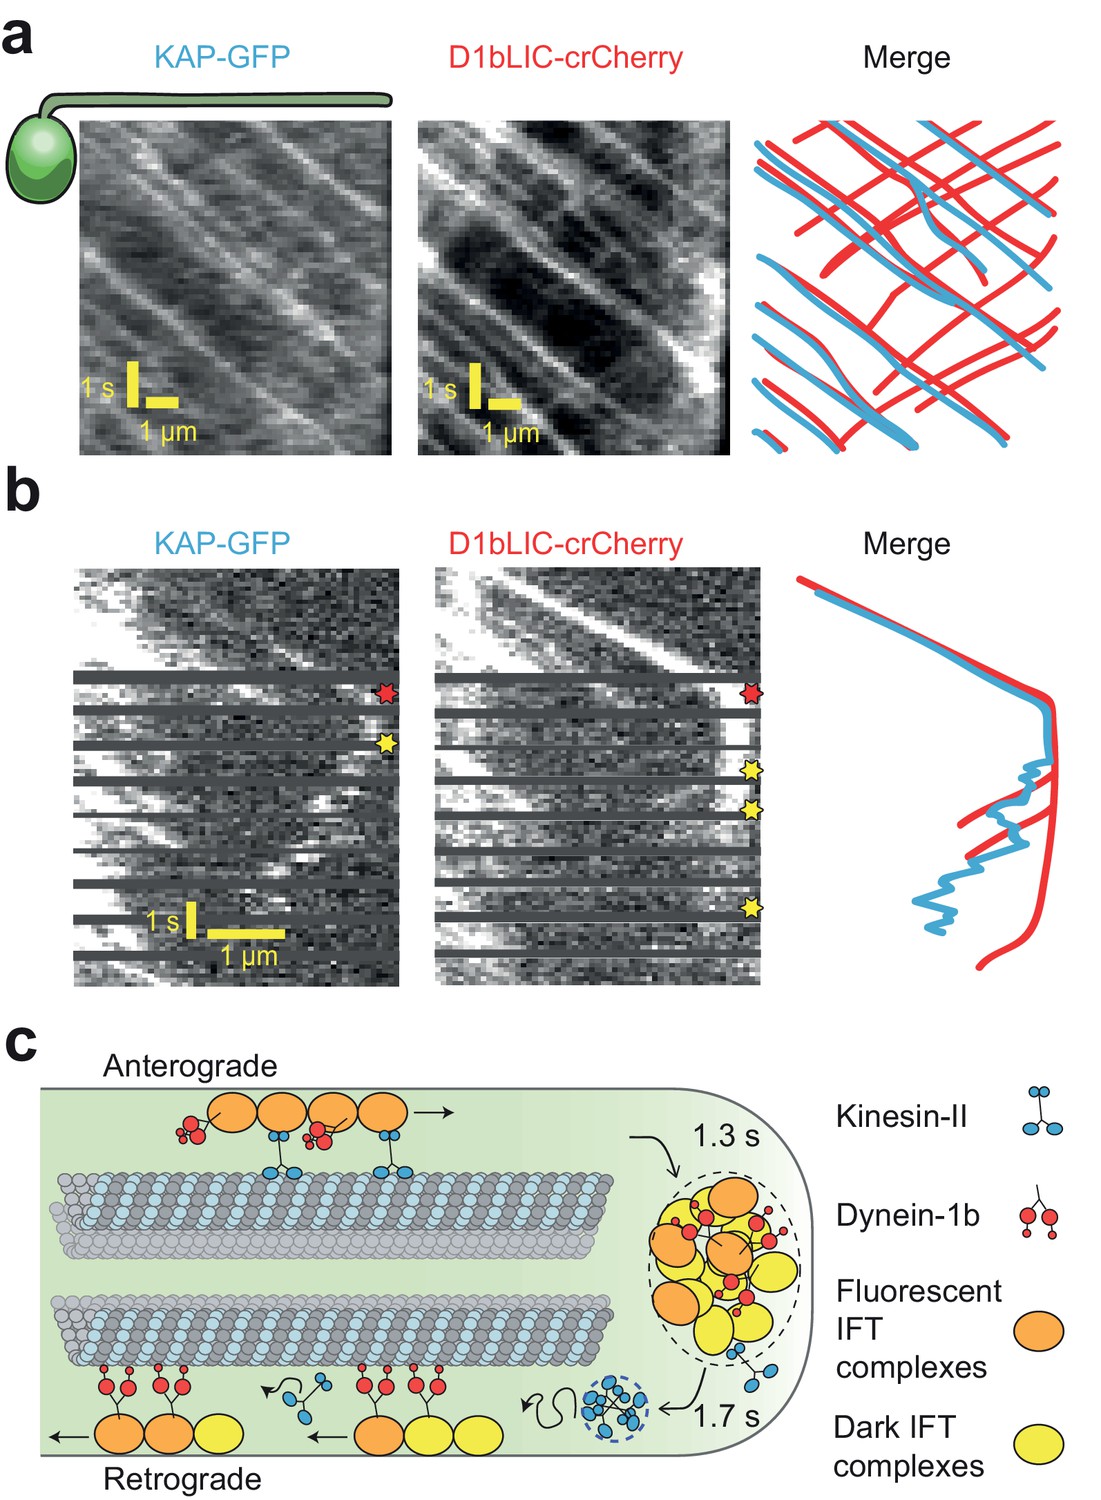
Transport roles of kinesin-II and dynein-1b.
(a) Representative kymographs of KAP-GFP and D1bLIC-crCherry in a d1blic::D1bLIC-crCherry KAP-GFP flagellum. KAP-GFP and D1bLIC-crCherry co-localize on the IFT trains in the anterograde direction. Retrograde tracks are seen in the D1bLIC-crCherry channel, but are rarely visible in the KAP-GFP channel. (b) Example two-color PhotoGate trace of KAP-GFP (left) and D1bLIC-crCherry (middle) in single flagella. KAP-GFP and D1bLIC-crCherry arrive at the tip on the same train. In this example, KAP diffuses away from the tip before the departure of D1bLIC trains (right). Red and yellow stars indicate arrival to and departure from the flagellar tip, respectively. (c) A model for the turnover of IFT trains and motors at the flagellar tip. Kinesin-II motors transport individual anterograde IFT trains to the flagellar tip. Dynein-1b is carried with anterograde trains as an inactive passenger. At the tip, IFT complexes detach from microtubules, disassemble, and mix with the tip protein pool to assemble new trains. These trains are transported retrogradely by dynein-1b. Kinesin-II detaches from IFT trains at the flagellar tip and diffuses back to the base by diffusion either as a cluster (blue dashed circle) or individually.
Figure 4—figure supplement 1
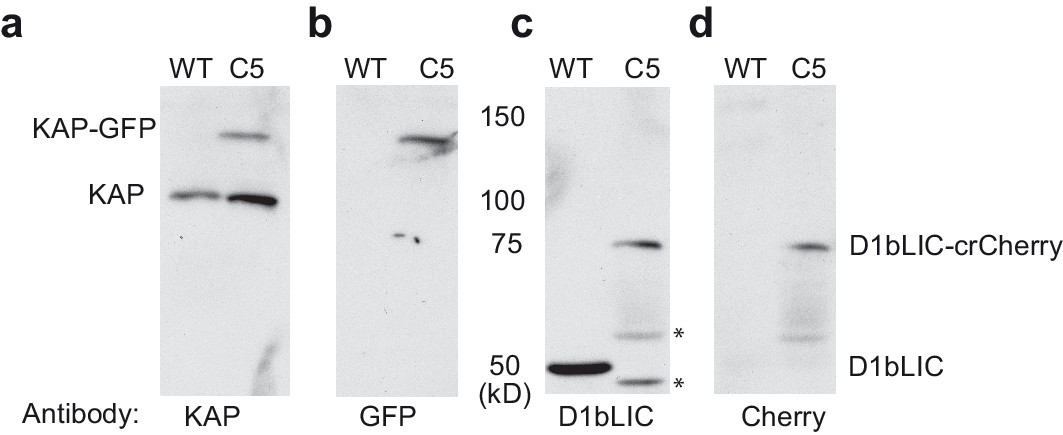
Expression of KAP-GFP and D1bLIC-crCherry in isolated flagella from a double-tagged strain.
. Isolated flagella from wild-type cells (WT) and a d1blic::D1bLIC-crCherry KAP-GFP strain (C5) were analyzed on Western blots probed with antibodies against (a) KAP, (b) GFP, (c) D1bLIC, and (d) Cherry. The endogenous KAP subunit migrates at ~95 kD in both strains (a), and the KAP-GFP subunit migrates at ~122 kD (a, b). The D1bLIC subunit migrates at ~49 kD in WT (c) and the D1bLIC-crCherry migrates at ~75 kD in the C5 rescued strain (c, d). The lower molecular weight bands in the C5 rescued strain represent proteolytic fragments of the D1bLIC-crCherry polypeptide (black asterisks). These bands are variable in preparations of isolated flagella.
Figure 4—figure supplement 2
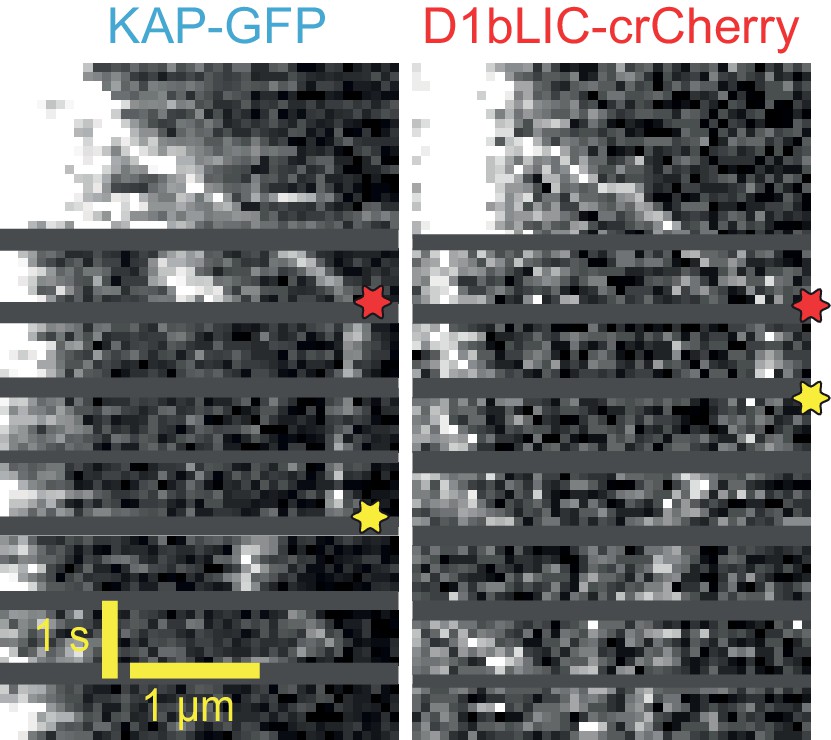
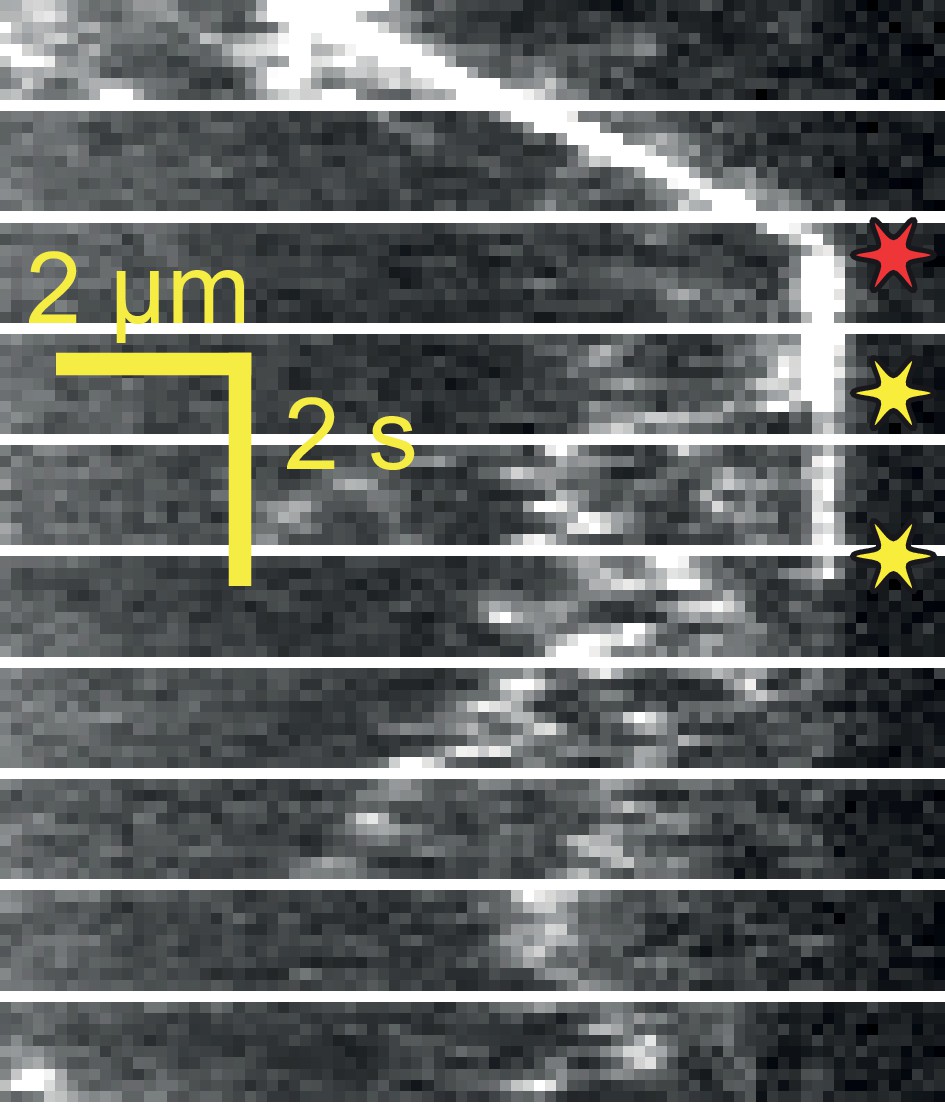
Example two-color PhotoGate trace of KAP-GFP (left) and D1bLIC-crCherry (right) in single flagella.
KAP-GFP and D1bLIC-crCherry arrive at the tip on the same train. In this example, D1bLIC leaves the tip before KAP. Red and yellow stars indicate arrival to and departure from the flagellar tip, respectively.
Figure 5 with 2 supplements
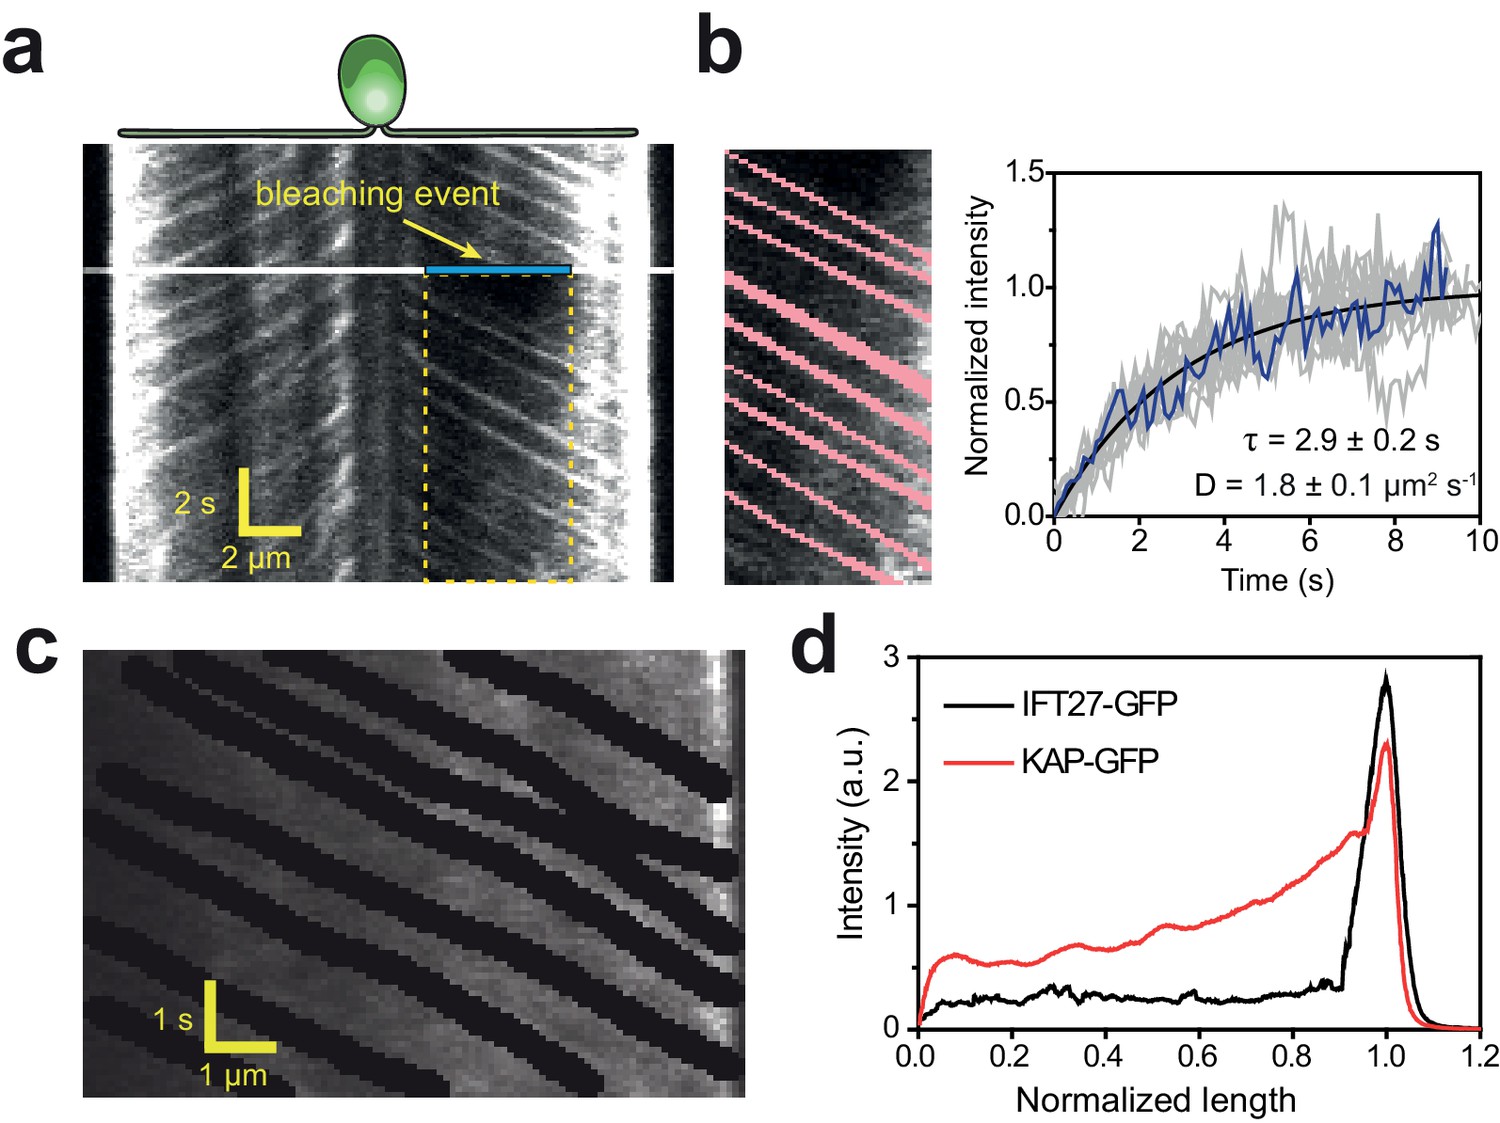
Diffusion of KAP from the flagellar tip leads to a concentration gradient along the flagellum.
(a) Kymograph of KAP-GFP movement before and after photobleaching the middle section of the flagellum (blue area). While fluorescence recovery from the base is through anterograde movement, the recovery from the tip region is due to diffusion. (b) (Left) The GFP signal of anterograde traces (red) was manually subtracted from the rectangular area shown in (a). (Right) The intensity in the photobleached area shows recovery as a function of time (blue line). The average recovery signal of 13 cells (grey lines) was fitted to a one-dimensional diffusion equation (black curve,±95% c.i.). (c) In conventional TIR imaging, anterograde trajectories of KAP-GFP were manually subtracted from the kymograph. (d) The average GFP signal along the length of a flagellum in KAP-GFP and IFT27-GFP cells after the removal of anterograde and retrograde transport traces from the kymographs. Flagellar base and tip positions were normalized to 0 and 1, respectively. N = 11 for both KAP-GFP and IFT27-GFP.
Figure 5—figure supplement 1
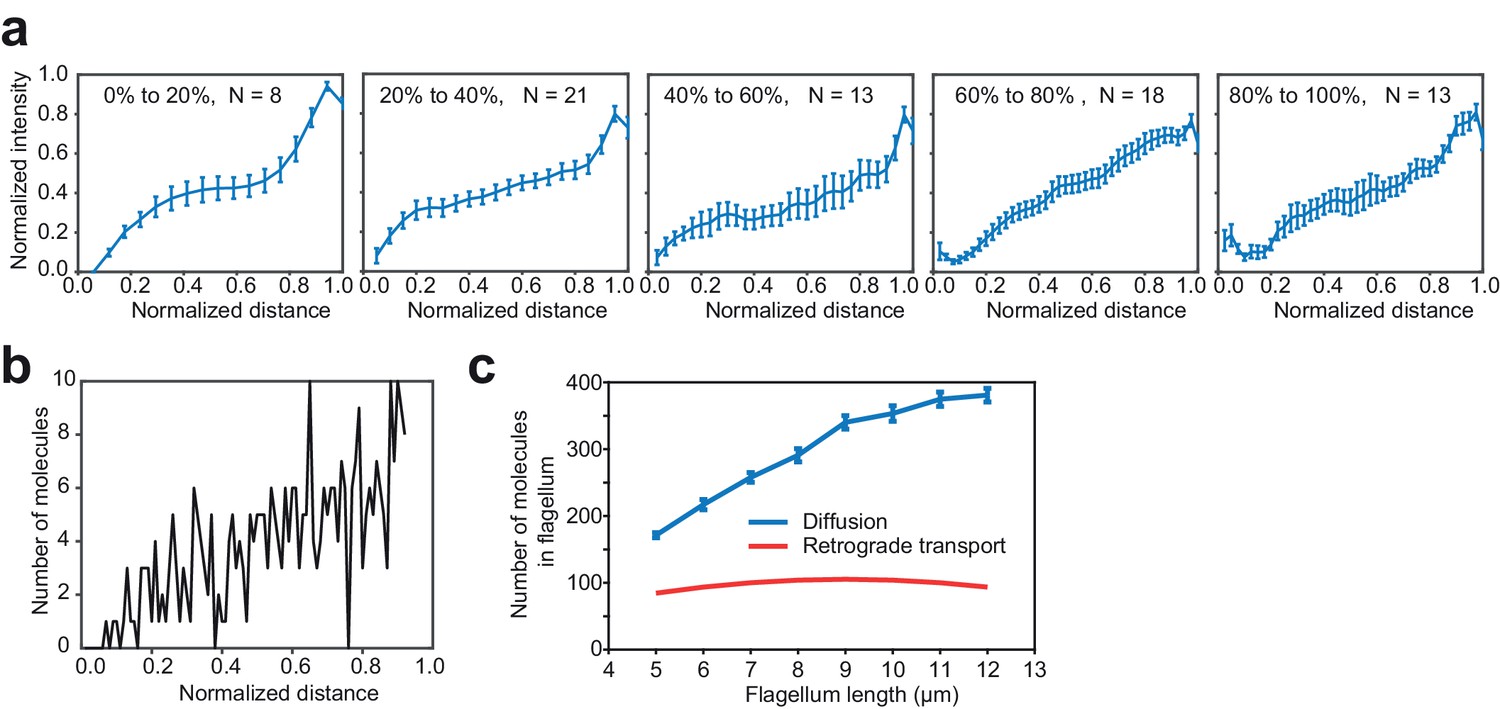
A gradient of KAP-GFP fluorescence along the length of the flagellum exists across all flagellar lengths.
(a) The gradient of KAP-GFP fluorescence is approximately linear over the length of the flagellum for flagella of different lengths. Cells undergoing flagellar regrowth were imaged and split into groups by their flagellar length, as a percentage of full-length flagella. IFT trains were manually removed from kymographs and remaining pixels were time-averaged to calculate the concentration gradient of the KAP-GFP. Error bars represent s.e.m. N = 57 kymographs over five independent experiments. (b) Monte Carlo simulations reveal the flagellar distribution of KAP-GFP diffusing from a source at the tip (right) to a sink at the base (left). (c) Simulations show that return of KAP to the cell body by diffusion leads to a greater accumulation of KAP in the flagellum, in comparison to a hypothetical case where KAP returns to the cell body via retrograde transport. This analysis accounts for both anterogradely moving and diffusing KAP molecules.
Figure 5—figure supplement 2
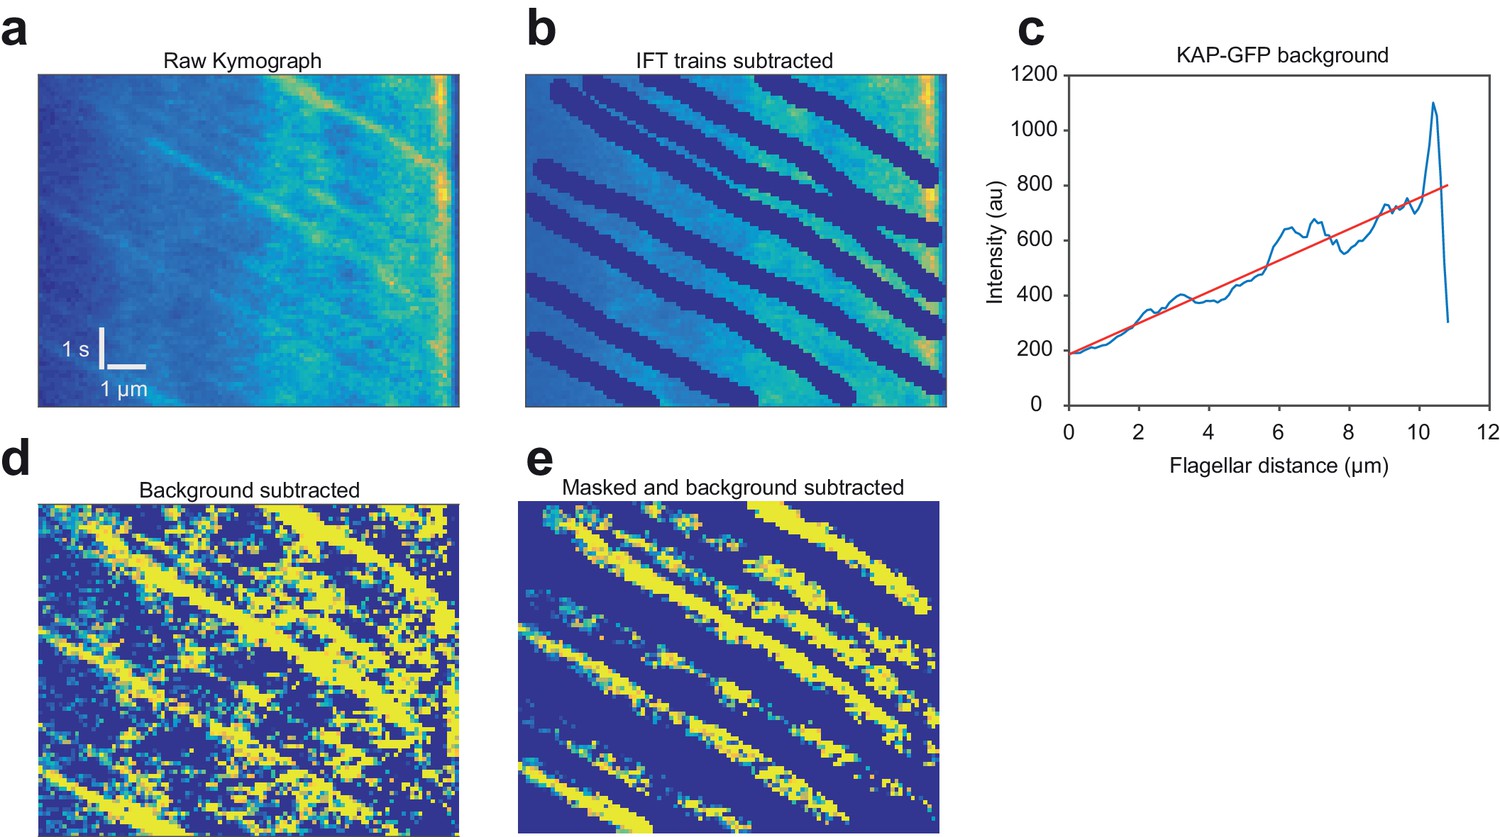
The influx and efflux of KAP-GFP fluorescence in fully grown flagella are equal.
(a) An example kymograph of a fla3::KAP-GFP flagellum imaged with TIR. The flagellar tip is on the right. (b) To calculate the intensity of the fluorescence background, anterograde trajectories of KAP were manually subtracted from the kymograph. (c) Intensities were time-averaged to calculate KAP-GFP background. Efflux was calculated from Fick’s law using the slope of the intensity profile along the flagellar length and the measured diffusion constant (1.7 µm2 s−1). (d) Background was subtracted from original kymograph to get anterograde train intensities. (e) The kymograph was masked for anterograde trains to calculate the average fluorescent counts per train. Influx was calculated by multiplying counts per train with the measured train frequency (1.3 s−1). KAP-GFP influx into the flagellum (1,130 ± 70 counts s−1) was similar to the efflux of KAP from the flagellum (1,170 ± 160 counts s−1). N = 57 kymographs over five independent experiments (mean ± s.e.m.).
Figure 6 with 1 supplement

Kinesin-II accumulates in flagella and is depleted at the basal body during flagellar growth.
(a) Representative confocal images show the distribution of IFT20-GFP and KAP-GFP fluorescence at the basal body region and in the flagella during flagellar regrowth. (b,c) Integrated KAP-GFP (b) and IFT20-GFP (c) fluorescence at the basal body (top), in the flagellum (middle), and in both regions (bottom) at different flagellar lengths. Each black dot represents a single flagellum and the blue line is the running average (± s.e.m.). For KAP-GFP, N = 104 flagella from 70 cells over two independent experiments. For IFT20-GFP, N = 103 flagella from 56 cells over two independent experiments. (d) Integrated KAP-GFP fluorescence at the basal body (left), in the flagellum (middle), and in both regions (right) in control cells was compared to cells treated with 50 mM Li+, and cells that regrow their flagella after cycloheximide treatment. R represents Pearson’s correlation coefficient. Each dot represents a single flagellum. For control cells, N = 66 flagella from 33 cells. For lithium-treated cells, N = 74 flagella from 37 cells. For cycloheximide-treated cells, N = 40 flagella from 20 cells. (e) A model for flagellar length control. When the flagellum is short, IFT trains contain more kinesin-II from the large basal body pool. As flagella elongate, the number of kinesin-II per IFT train decreases because a significant fraction of the kinesin-II unloads at the tip and undergoes diffusion in the flagellar lumen, depleting the kinesin-II pool at the flagellar base. (f) An analogy for kinesin-II loading on IFT trains. Passengers (dynein-1b) travel from the left shore (basal body) to the right shore (flagellar tip) on a boat (IFT trains) with oars (kinesin-II). At the right shore, the passengers get out and walk the boats back to the dock. Oars are left on the water and can only be collected when they randomly float back to the left shore. If the distance between the shores is large, oars build up on the water and are not readily available for new boats at the left shore.
Figure 6—figure supplement 1
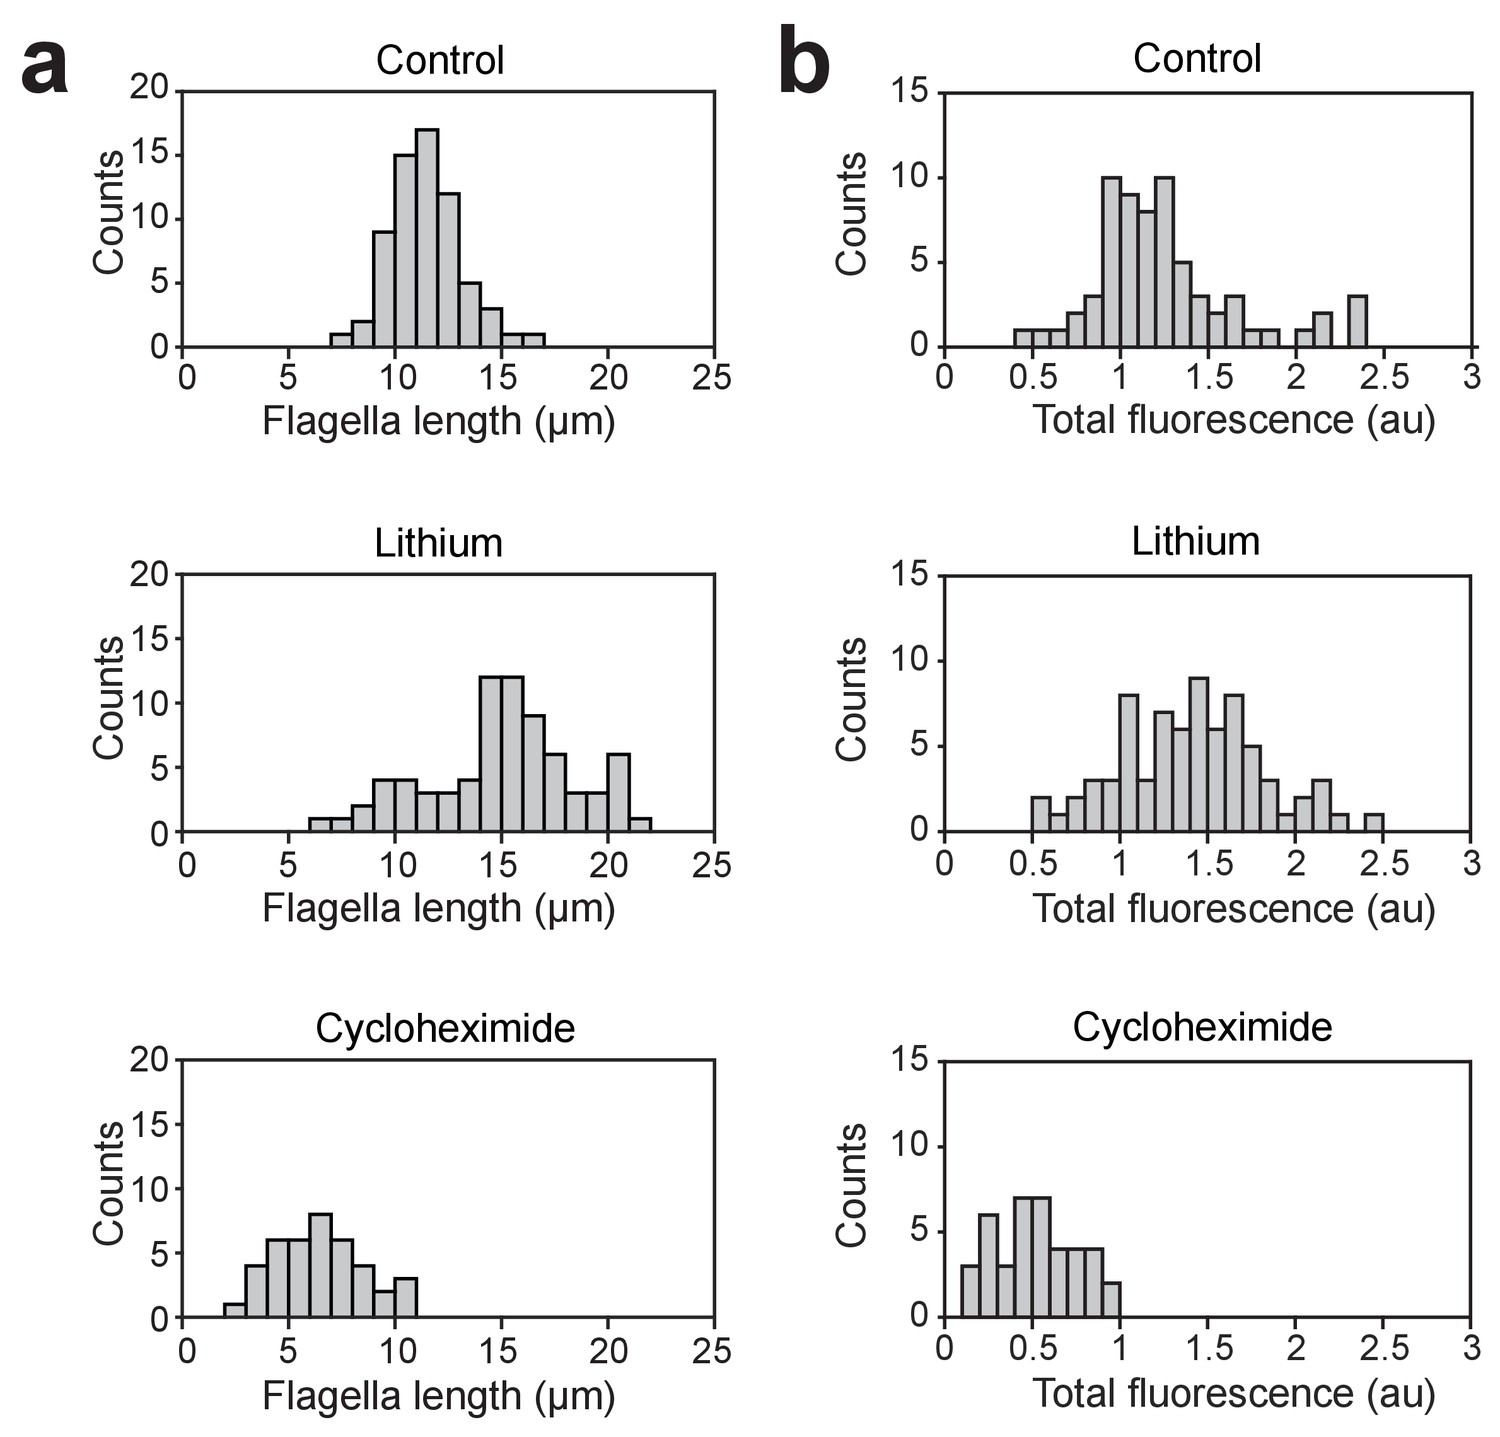
Length and total fluorescence distributions of lithium and cycloheximide-treated cells.
(a) Flagella length distributions for fla3::KAP-GFP cells cultured in TAP media, cells treated with 50 mM LiCl, and cells subjected to pH shock and allowed to regrow flagella in the presence of 1.5 ug/ml cycloheximide. For control cells, N = 66 flagella from 33 cells. For lithium-treated cells, N = 74 flagella from 37 cells. For cycloheximide-treated cells, N = 40 flagella from 20 cells. (b) Histograms show the total fluorescent signal of KAP-GFP localized to the basal body and the flagellum of single cells.
Author response image 1
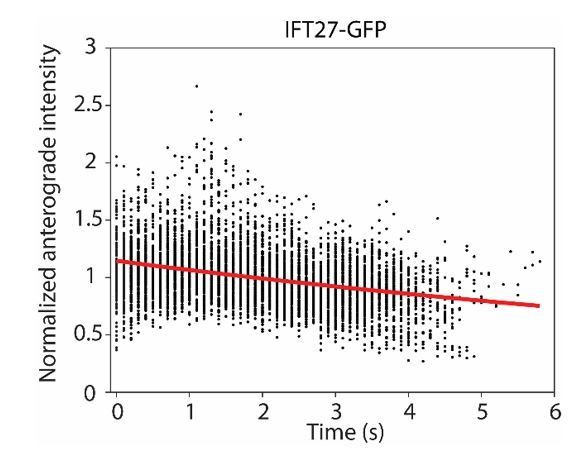
The normalized intensity of anterograde IFT20-GFP particles as they travel from the flagellar base (t = 0 s) to the tip.
A single exponential decay fit (red curve) reveals a photobleaching rate of 0.07 ± 0.01 s-1 ( ± 95% c.i.).
Author response image 2
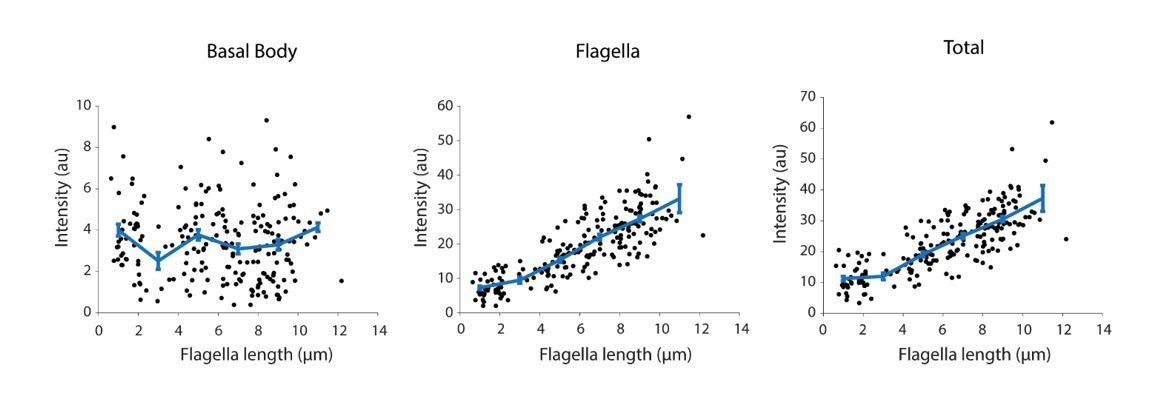
Integrated IFT20-GFP fluorescence at the basal body (left), in the flagellum (middle), and in both regions (right) at different flagellar lengths.
Each black dot represents a single flagellum and the blue line is the running average ( ± s.e.m., N = 214 flagella from 107 cells).
Videos
Video 1
Tracking of individual IFT trains in Chlamydomonas.
IFT movement was visualized by TIR imaging of a surface-adhered pf18 IFT27-GFP cell. Green and blue arrows represent the cell body and flagellar tips, respectively. The size of the window is 15.5 × 27.6 µm. The movie was recorded at 10 frames s−1 and is played in real time. This video corresponds to Figure 1a.
Video 2
Observing the dynamics of single IFT trains at the flagellar tip using the PhotoGate.
The distal half of the flagellum on the right of a surface-adhered pf18 IFT27-GFP cell is photobleached by an intense laser beam. The gate beam is turned off to allow a single anterograde train to enter the bleached region and turned on repeatedly at the base of the flagellum to bleach the subsequent anterograde trains. Two retrograde trains emanate from a single fluorescent anterograde train at the tip. Frames with the gate beam on are removed for illustration purposes. The movie was recorded at 10 frames s−1 and is played in real time. Cyan and magenta arrows represent anterograde and retrograde particles, respectively. Pre-bleaching frames are marked by red borders. The position of the PhotoGate is marked by a red line. This video corresponds to Figure 1c.
Video 3
Tip return dynamics of two fluorescent anterograde trains using the PhotoGate.
A flagellum of a surface-adhered pf18 IFT27-GFP cell is photobleached. Two fluorescent anterograde IFT trains are allowed pass through the gate without photobleaching and subsequent anterograde trains were photobleached by the gate beam. After the anterograde trains reach the tip, three retrograde trains return with fluorescent signal from these trains. The movie was recorded at 10 frames s−1 and is played in real time. Cyan and magenta arrows represent anterograde and retrograde particles, respectively. The position of the PhotoGate is marked by a red line. This video corresponds to Figure 1d.
Video 4
Tip return dynamics of three fluorescent anterograde trains using the PhotoGate.
A flagellum of a surface-adhered pf18 IFT27-GFP cell is photobleached. Three fluorescent anterograde IFT trains are allowed pass through the gate without photobleaching and subsequent anterograde trains were photobleached by the gate beam. The frames in which the gate beam was on were deleted for illustration purposes. After the anterograde trains reach the tip, four retrograde trains return with fluorescent signal from these trains. The movie was recorded at 10 frames s−1 and is played in real time. Cyan and magenta arrows represent anterograde and retrograde particles, respectively. Pre-bleaching frames are marked by red borders. The position of the PhotoGate is marked by a red line. This video corresponds to Figure 1e.
Video 5
Tip return dynamics of D1bLIC-GFP.
In a surface-adhered d1blic::D1bLIC-GFP cell, one D1bLIC-GFP particle is allowed to pass through the gate without photobleaching and two fluorescent retrograde particles return to the base. The size of the window is 30.2 × 31.1 µm. The movie was recorded at 10 frames s−1 and is played in real time. Cyan and magenta arrows represent anterograde and retrograde particles, respectively. Pre-bleaching frames are marked by red borders. The position of the PhotoGate is marked by a red line. This video corresponds to Figure 3c.
Video 6
KAP-GFP dissociates from IFT trains at the tip.
In the fla3::KAP-GFP strain, one fluorescent KAP-GFP particle is allowed to pass through the gate without photobleaching. The KAP-GFP particle undergoes diffusive motion after arriving at the flagellar tip. The size of the window is 26.6 × 16.6 µm. The movie was recorded at 10 frames s−1 and is played in real time. Cyan and magenta arrows represent anterograde and diffusing particles, respectively. The position of the PhotoGate is marked by a red line. This video corresponds to Figure 3f.
Video 7
Diffusing KAP-GFP particles can break apart after leaving the tip.
In the fla3::KAP-GFP strain, one fluorescent KAP-GFP particle is allowed to pass through the gate without photobleaching. The KAP-GFP particle undergoes diffusive motion after arriving at the flagellar tip. While diffusing, the particle breaks further into smaller KAP particles. The size of the window is 30.2 × 31.1 µm. The movie was recorded at 10 frames s−1 and is played in real time. Cyan and magenta arrows represent anterograde and diffusing particles, respectively. The position of the PhotoGate is marked by a red line. This video corresponds to Figure 3—figure supplement 2.
Video 8
Dual color imaging of KAP-GFP and D1bLIC-crCherry.
The movements of KAP-GFP and D1bLIC-crCherry are simultaneously tracked in a surface-adhered d1blic::D1bLIC-crCherry KAP-GFP cell. KAP and D1bLIC co-localize in the anterograde direction. D1bLIC displays retrograde tracks while retrograde transport of KAP is rarely seen. KAP-GFP channel is on the left and D1bLIC-crCherry channel is on the right. The movie was recorded at 8.3 frames s−1 and is played in real time. This video corresponds to Figure 4a.
Video 9
Recovery of KAP-GFP after photobleaching the middle section of a flagellum.
A surface-adhered fla3::KAP-GFP is imaged under TIRF illumination. The middle part of the flagellum is bleached by a 25 kW cm−2 laser beam for 0.1 s, and the cell is imaged under 100 W cm−2 TIRF excitation. The fluorescent signal recovers with different kinetics from each side of the flagellum. The data were collected at 10 frames s−1 and is played in real time. Green and blue arrows represent the cell body and flagellar tips, respectively. The photobleached area is marked by thin red lines. This video corresponds to Figure 5a.
Additional files
-
Transparent reporting form
- https://doi.org/10.7554/eLife.28606.029
Download links
A two-part list of links to download the article, or parts of the article, in various formats.
Downloads (link to download the article as PDF)
Open citations (links to open the citations from this article in various online reference manager services)
Cite this article (links to download the citations from this article in formats compatible with various reference manager tools)
Dynamics of the IFT machinery at the ciliary tip
eLife 6:e28606.
https://doi.org/10.7554/eLife.28606


