Cell volume changes contribute to epithelial morphogenesis in zebrafish Kupffer’s vesicle
- State University of New York, Upstate Medical University, United States
- Syracuse University, United States
Figures
Figure 1
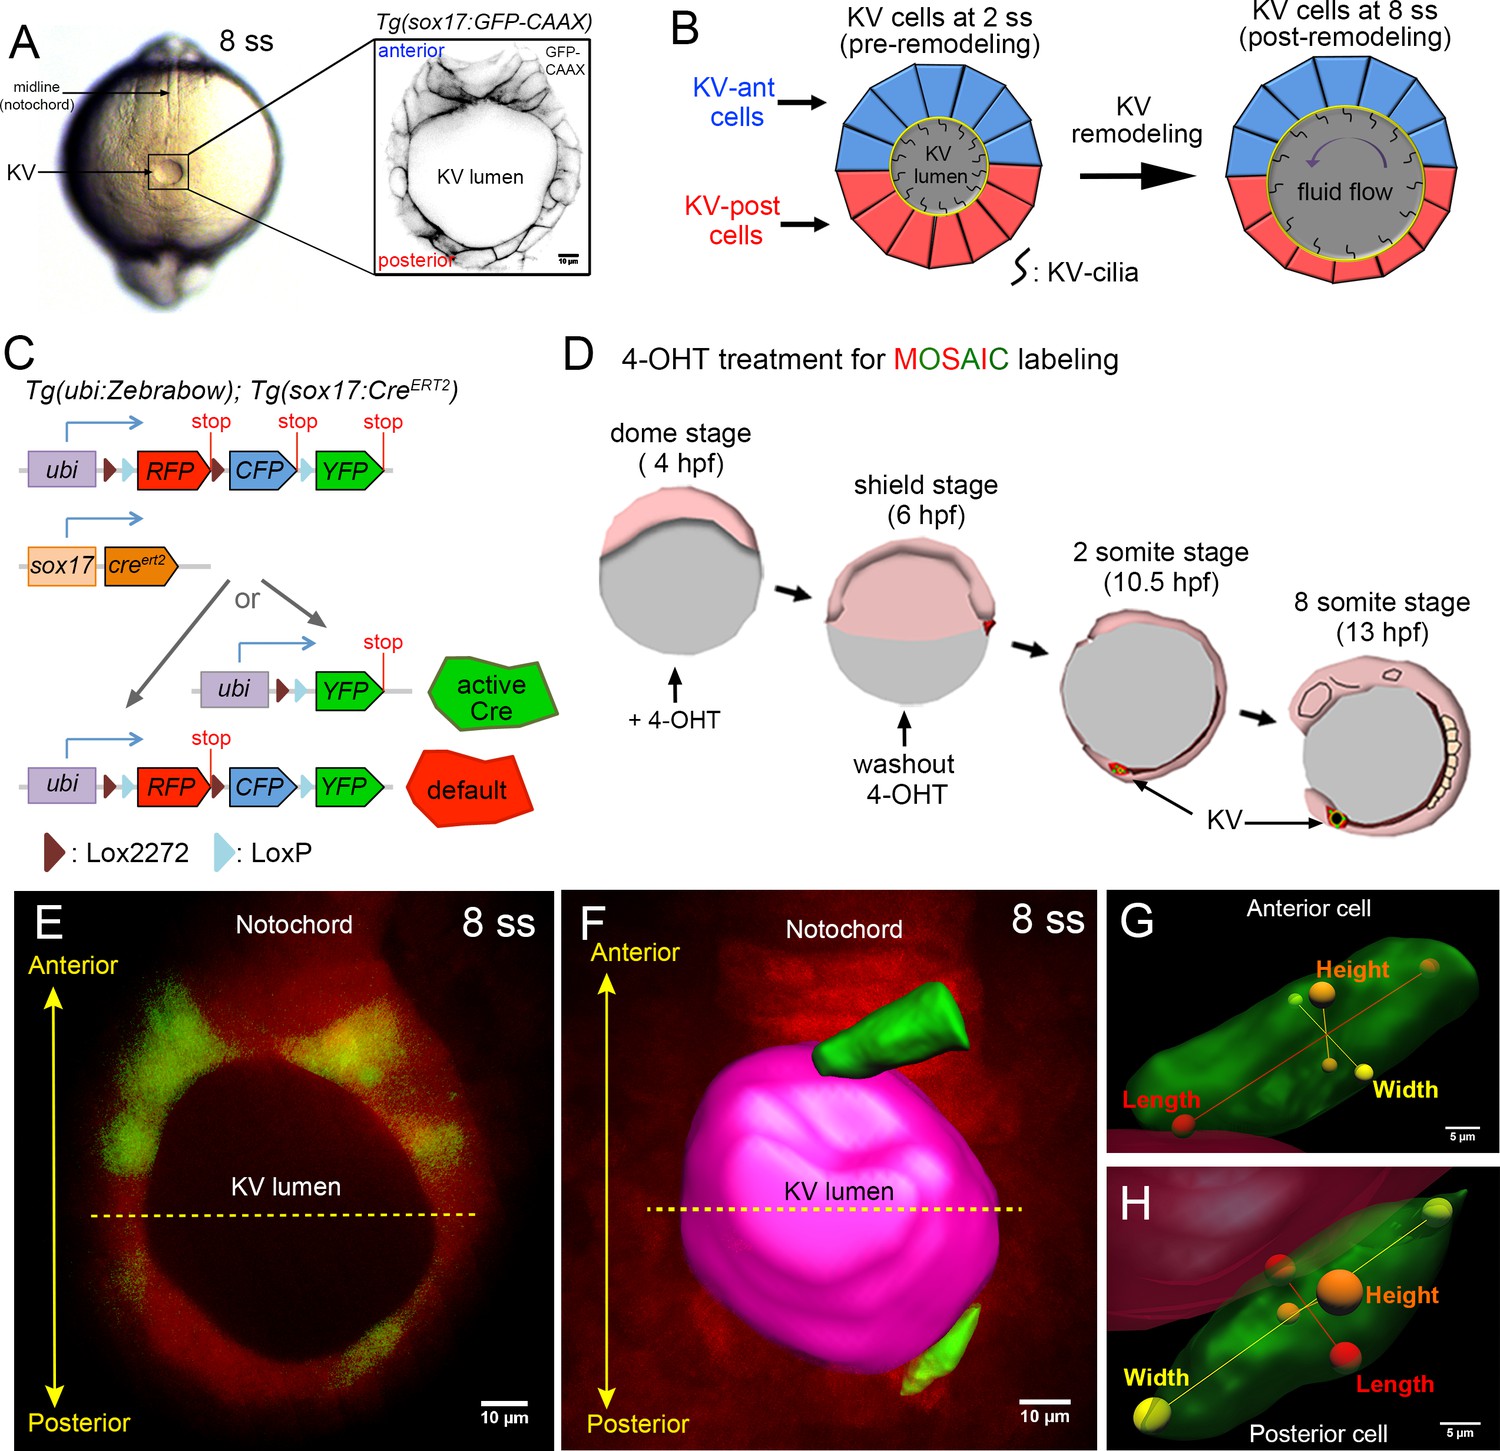
Mosaic labeling of KV cells.
(A) A dorsal view of the tailbud in a live zebrafish embryo at the 8-somite stage (8 ss) of development. Kupffer’s vesicle (KV) is positioned at the end of the notochord. The inset shows GFP-labeled KV cells surrounding the fluid-filled KV lumen in a Tg(sox17:GFP-CAAX) transgenic embryo at 8 ss. This is the middle plane of the KV. Scale = 10 μm. (B) Schematic of cell shape changes during KV remodeling. KV-ant cells (blue) and KV-post cells (red) have similar shapes at 2 ss, but then undergo regional cell shape changes such that KV-ant cells are elongated and KV-post cells are wide and thin by 8 ss. These cell shape changes result in asymmetric positioning of motile cilia that generate fluid flows for left-right patterning. (C) Structure of the ubi:zebrabow and sox17:CreERT2 transgenes and the possible recombination outcomes of the ‘zebrabow’ transgene by Cre recombinase activity in KV cell lineages. (D) Time course of mosaic labeling of KV cells. Brief treatment of double transgenic Tg(sox17:CreERT2); Tg(ubi:Zebrabow) embryos with 4-OHT from the dome stage to the shield stage generates low levels of Cre activity that changes expression of default RFP to expression of YFP in a subset of KV cells. (E) Mosaic labeled YFP+ KV cells at the middle plane of KV at 8 ss. (F) 3D reconstructed KV cells (green) and KV lumen (magenta) at 8 ss. Scale = 10 μm. (G–H) Morphometric parameters of 3D rendered KV-ant (G) and KV-post (H) cells: length = axis spanning from apical to basal side of the cell, height = axis spanning from dorsal to ventral side of the cell, and width = axis connecting lateral sides of the cell. Scale = 5 μm.
Figure 2 with 3 supplements
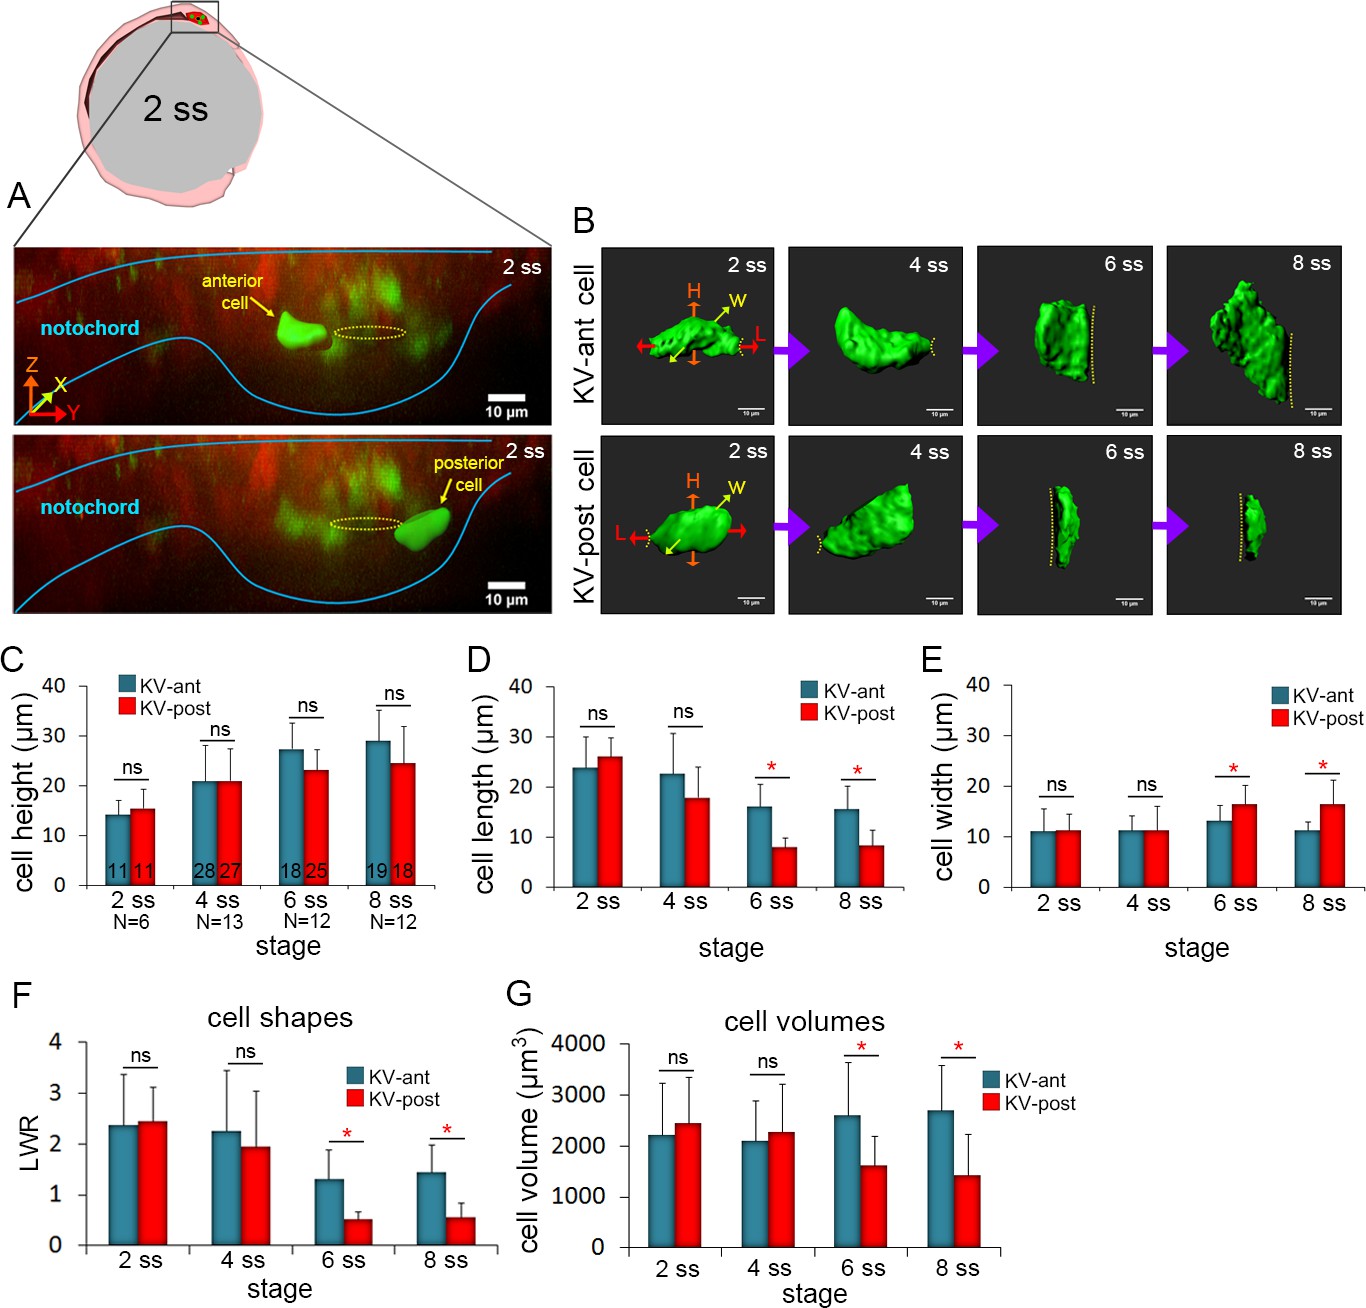
3D morphometric analysis of single cells reveals asymmetric cell volume changes during asymmetric KV cell shape changes.
(A) A lateral view of a mosaic labeled KV in a Tg(sox17:CreERT2); Tg(ubi:Zebrabow) at 2 ss. The embryo diagram represents the orientation of the image. The notochord and KV are outlined in blue. Yellow lines mark the KV lumen. Examples of 3D reconstructed KV-ant and KV-post cells along the middle plane of KV are shown. Scale = 10 μm. (B) Representative snapshots of 3D rendered KV-ant and KV-post cells at different stages of KV development between 2 ss and 8 ss. The parameters including height (H), length (L) and width (W) were used to quantify cell morphology. Yellow lines indicate the KV luminal surface. Scale = 10 μm. (C–E) Quantification of height (C), length (D) and width (E) of individual KV-ant and KV-post cells during development. (F) A length-to-width ratio (LWR) was used to describe KV cell shapes. KV-ant and KV-post cells change shape between 4 ss and 6 ss. (G) Volume measurements of individual KV cells at different stages of development. Similar to cell shapes, KV-ant and KV-post cells change volume between 4 ss and 6 ss. All measurements presented in C-G were made on the same group of reconstructed cells. The number of KV-ant and KV-post cells analyzed is indicated in the graph in C. N = number of embryos analyzed at each stage. Graphs show the mean + SD. Results were pooled from three independent experiments. *p<0.01 and ns = not significant (p>5% with Welch’s T-Test).
Figure 2—figure supplement 1
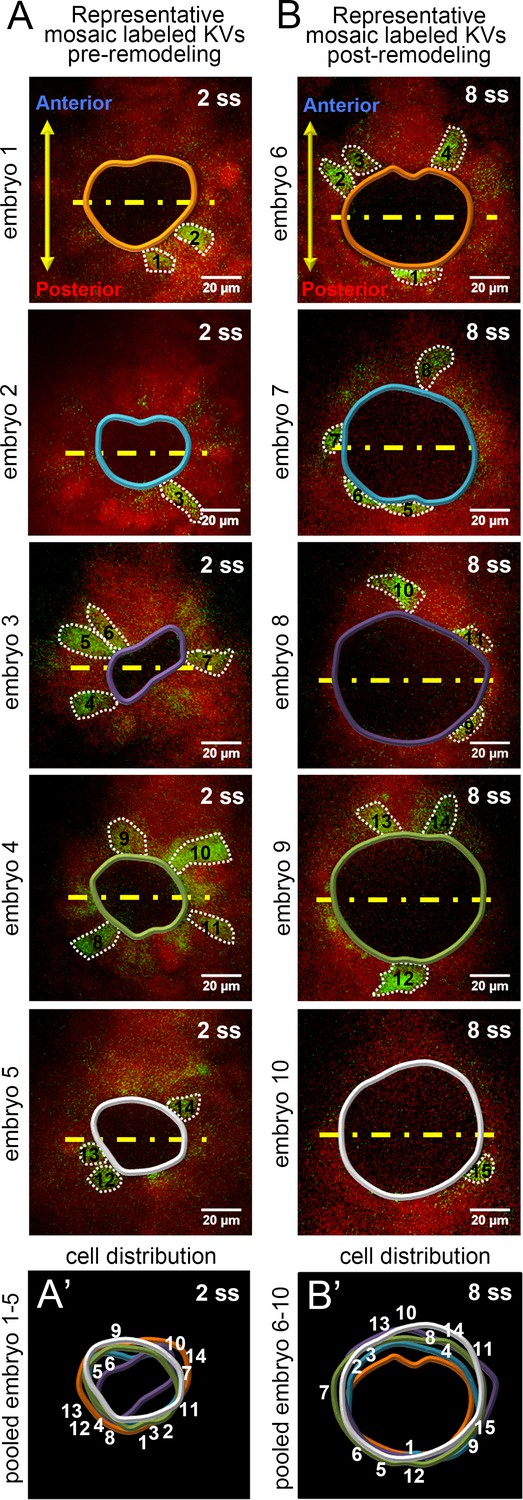
Single KV cells were sampled from all positions along the middle plane of KV for morphometric analysis.
(A,B) Representative mosaic labeled KVs at pre (2 ss) and post-remodeling (8 ss) stages. YFP+ cells along the middle plane of the organ are numbered. KV lumen and cell boundaries are outlined. Yellow lines divide the KV lumen into anterior and posterior halves. (A’,B’) Pooled images of KV lumen boundaries and cell numbers show no bias in the distribution of mosaic labeled cells. Scale = 20 μm.
Figure 2—figure supplement 2
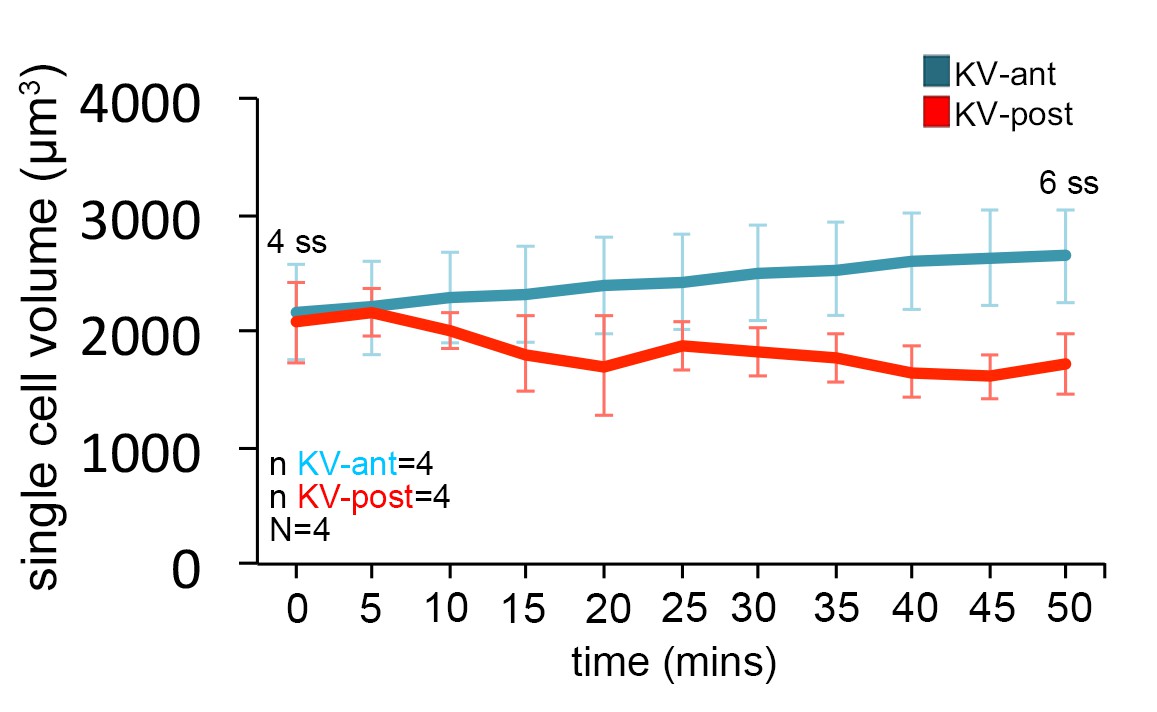
Single KV cell dynamics during 4 ss to 6 ss KV stages.
Dynamic changes in single KV cell volumes from 4 ss to 6 ss (50 min of development). n = number of KV-ant and KV-post cells analyzed. N = number of embryos analyzed. Graph shows the mean ± SD. Results were pooled from 4 independent experiments.
Figure 2—figure supplement 3
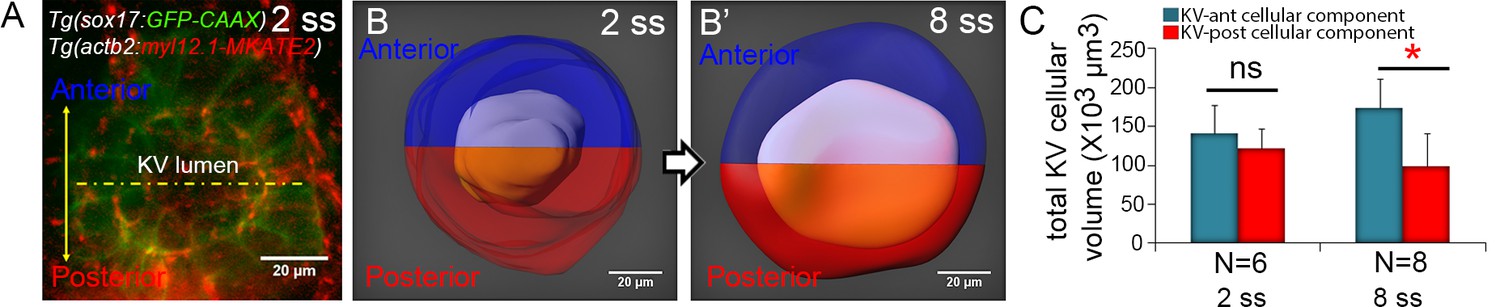
Total changes in KV volume during KV morphogenesis.
(A) A double transgenic Tg(sox17:GFP-CAAX); Tg(actb2:myl12.1-MKATE2) embryo, in which GFP expression marks KV cells and MKATE2 expression marks the KV lumen. (B) 3D reconstruction of the entire KV organ at 2 ss (B) and 8 ss (B’). The KV lumen was split into two equal halves (purple and orange) along anteroposterior axis. This line bisecting the KV was then used to define the anterior (blue) and posterior (red) regions of the cellular component of KV. (C) The graph represents total volumes of anterior and posterior KV cellular components at 2 ss and 8 ss. Shown is the mean + SD. Results are pooled from two independent experiments. N = number of embryos analyzed at each stage. *p<0.01 and ns = not significant (p>5% with Welch’s T-Test).
Figure 3 with 3 supplements
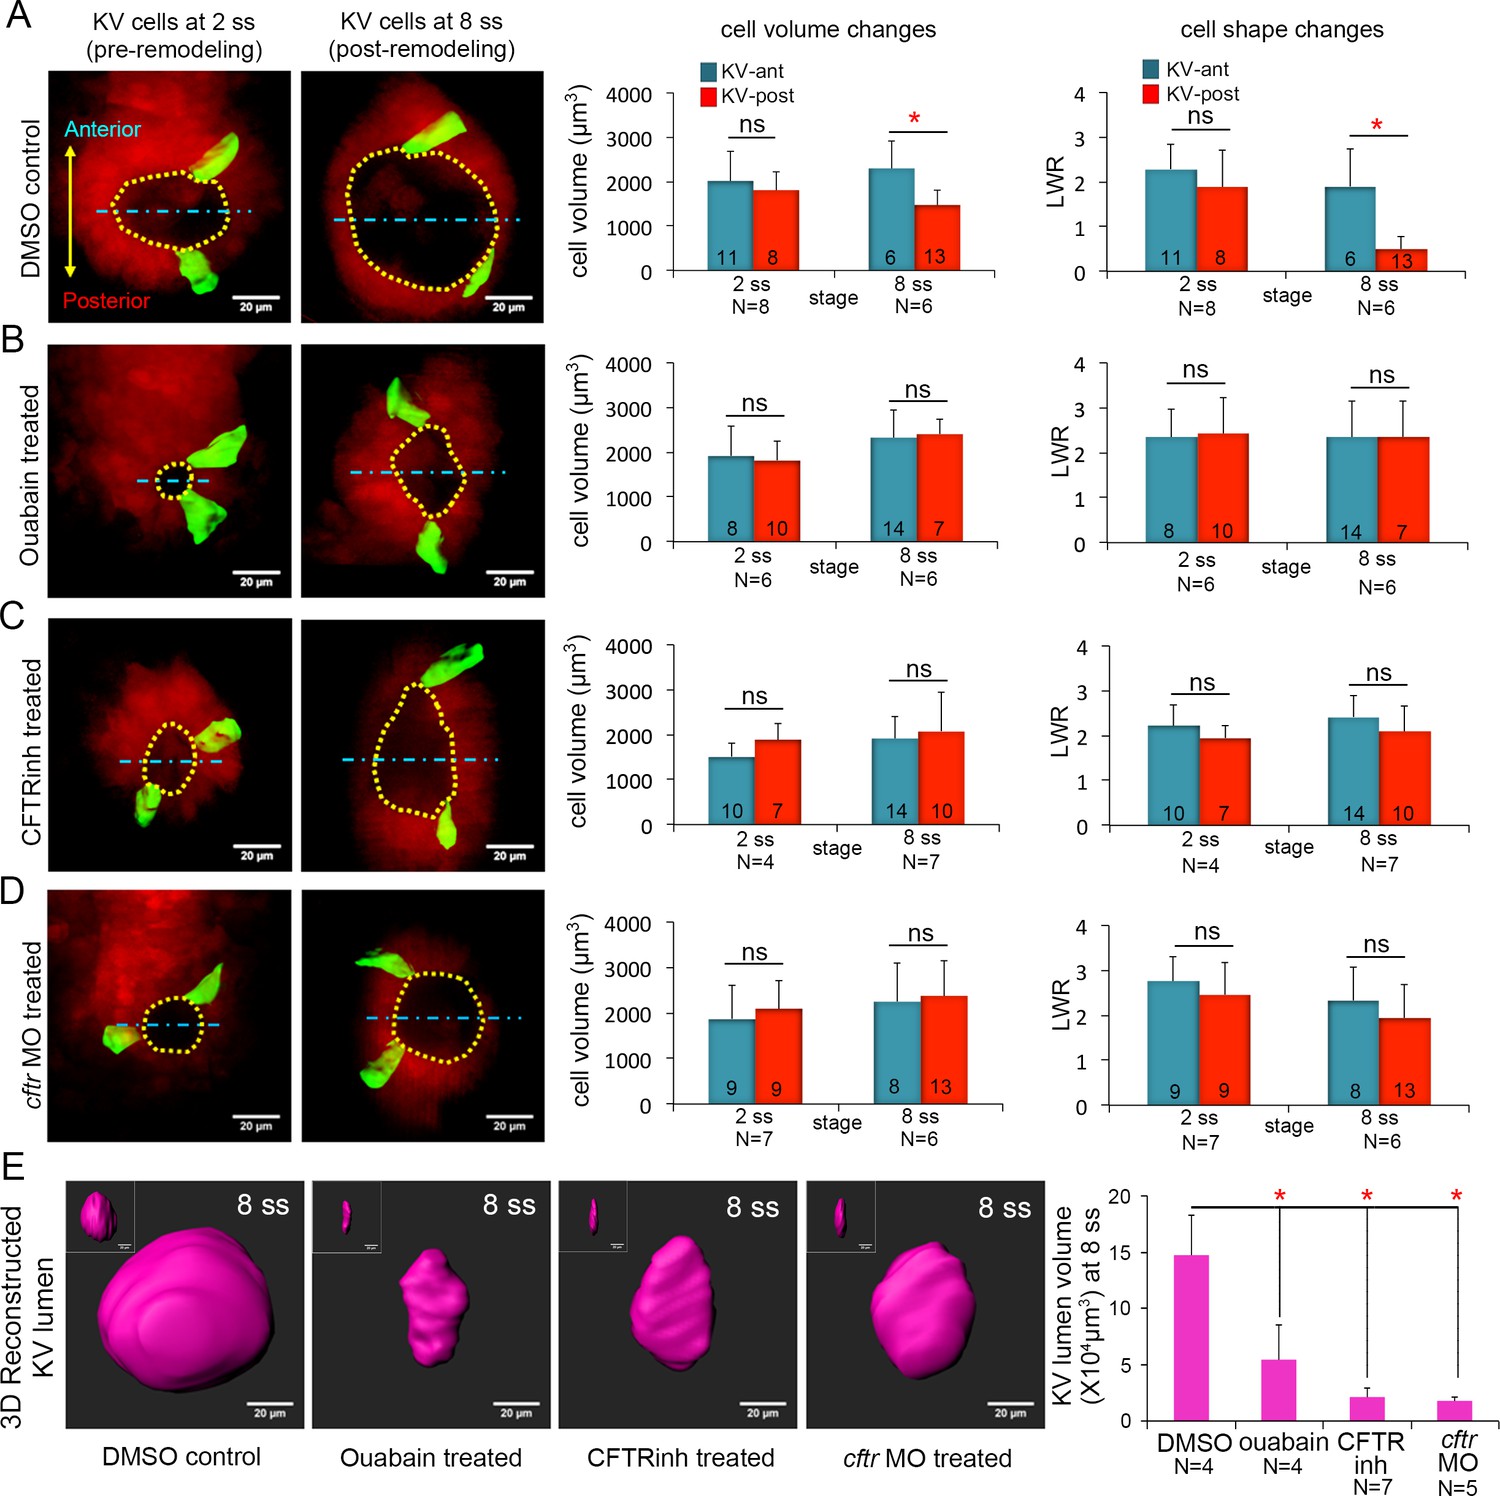
Ion channel activity mediates asymmetric KV cell volume changes, KV lumen expansion and KV cell shape changes.
(A) 3D reconstructed KV-ant and KV-post cells in mosaic labeled Tg(sox17:CreERT2); Tg(ubi:Zebrabow) control embryos (treated with vehicle DMSO) showed asymmetric cell volume changes and asymmetric cell shape changes (length-to-width ratio) between 2 ss and 8 ss. (B) Inhibiting the Na+/K+-ATPase with ouabain treatments reduced KV lumen expansion and disrupted asymmetric cell volume changes. KV cells in ouabain treated embryos did not undergo asymmetric shape changes. (C–D) Interfering with Cftr function using the small molecule inhibitor CFTRinh-172 (C) or cftr MO (D) also blocked KV lumenogenesis and disrupted asymmetric cell volume changes and shape changes of KV cells. (E) Quantification of 3D reconstructed KV lumen volumes (insets depict lumen in YZ axis) in control and treated live embryos at 8 ss. For all quantitative analyses, the mean + SD is shown. The number of KV-ant and KV-post cells analyzed is indicated in the graphs in A-D. N = number of embryos analyzed. Results were pooled from two independent trials. Scale = 20 μm, *p<0.01 and ns = not significant (p>5% with Welch’s T-Test).
-
Figure 3—source data 1
Statistical power analysis for the non-significant AP cell volume and LWR differences in Figure 3A–D.
Here, we show the false negative rate that results from testing against the alternative hypothesis that the true AP difference in a given case was the same as for the DMSO control at 8ss (Figure 3A). The statistical power in each case is .
- https://doi.org/10.7554/eLife.30963.015
Figure 3—figure supplement 1
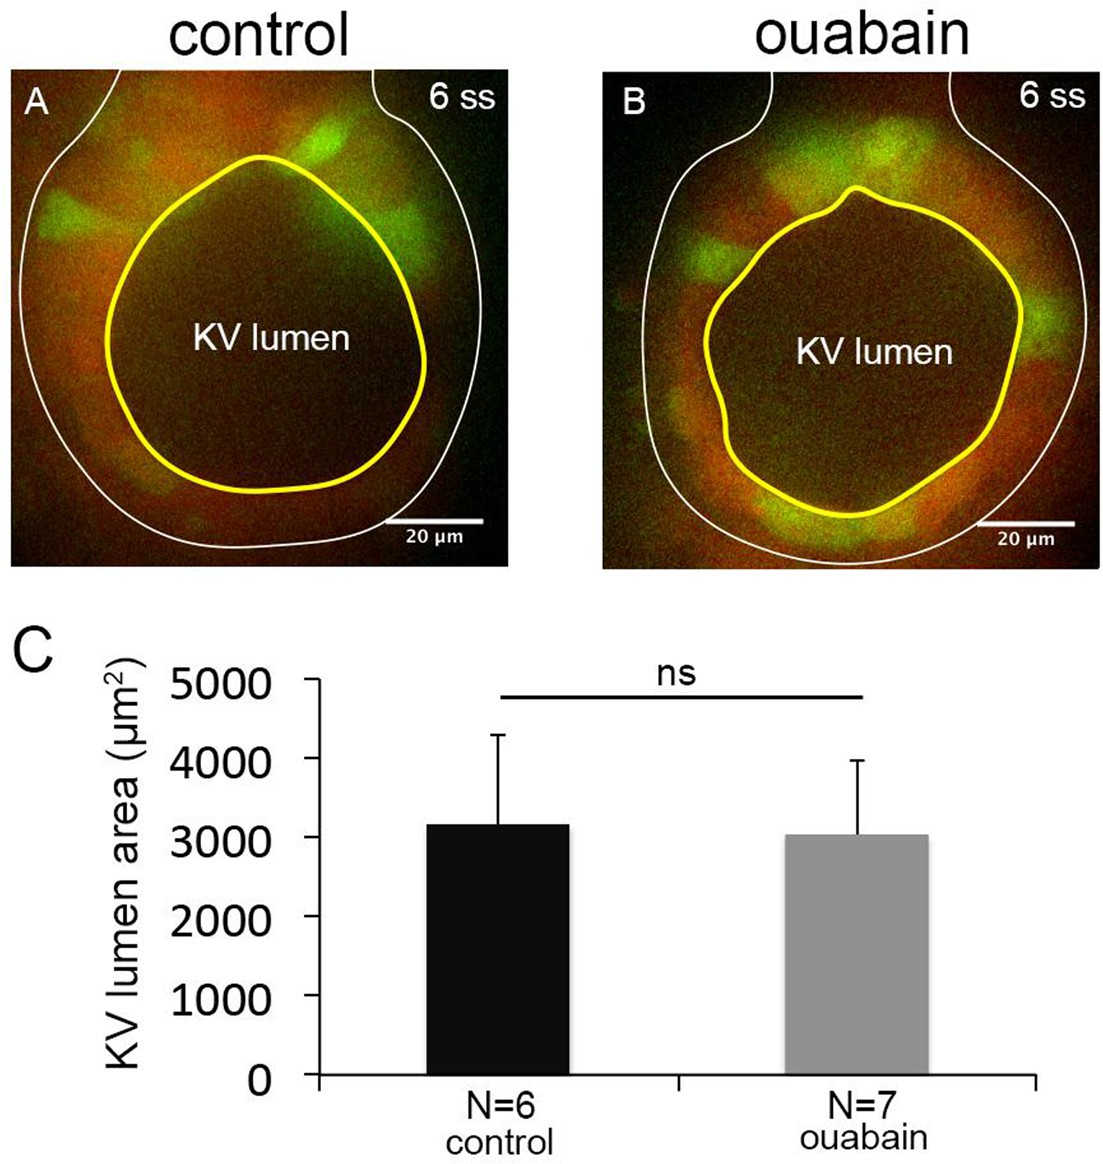
Ouabain treatments between 4–6 ss do not block KV lumen expansion.
(A–B) Mosaic-labeled KV in a control embryo (A) and an embryo treated with ouabain from 4 to 6 ss (B). (C) Measurements of maximum KV lumen area indicated that ouabain treatments between 4–6 ss were not effective at blocking KV lumen expansion. N = number of embryos analyzed. Shown is the mean + SD. ns = not significant (p>5% with Welch’s T-Test).
Figure 3—figure supplement 2
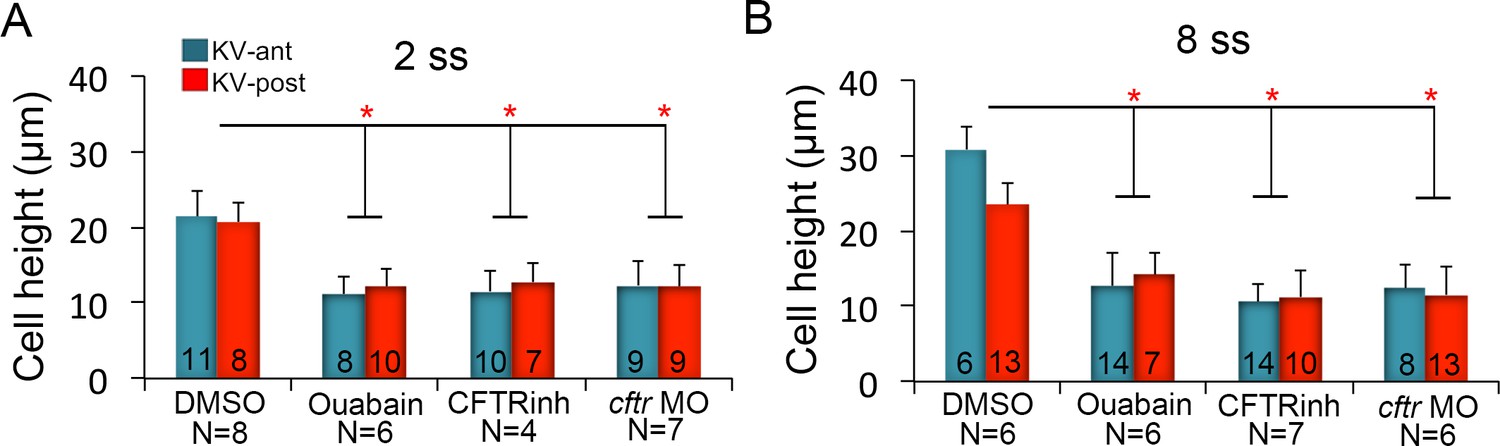
KV cell heights in embryos treated with ion channel inhibitors.
(A–B) Quantification of individual KV-ant and KV-post cell heights from different treatments at 2 ss (A) and 8 ss (B). Results were pooled from two independent experiments at each stage. The number of KV-ant and KV-post cells analyzed is indicated within the graph. N = number of embryos analyzed at each stage. Shown is the mean + SD, *p<0.01 and ns = not significant (p>5% with Welch’s T-Test).
Figure 3—figure supplement 3
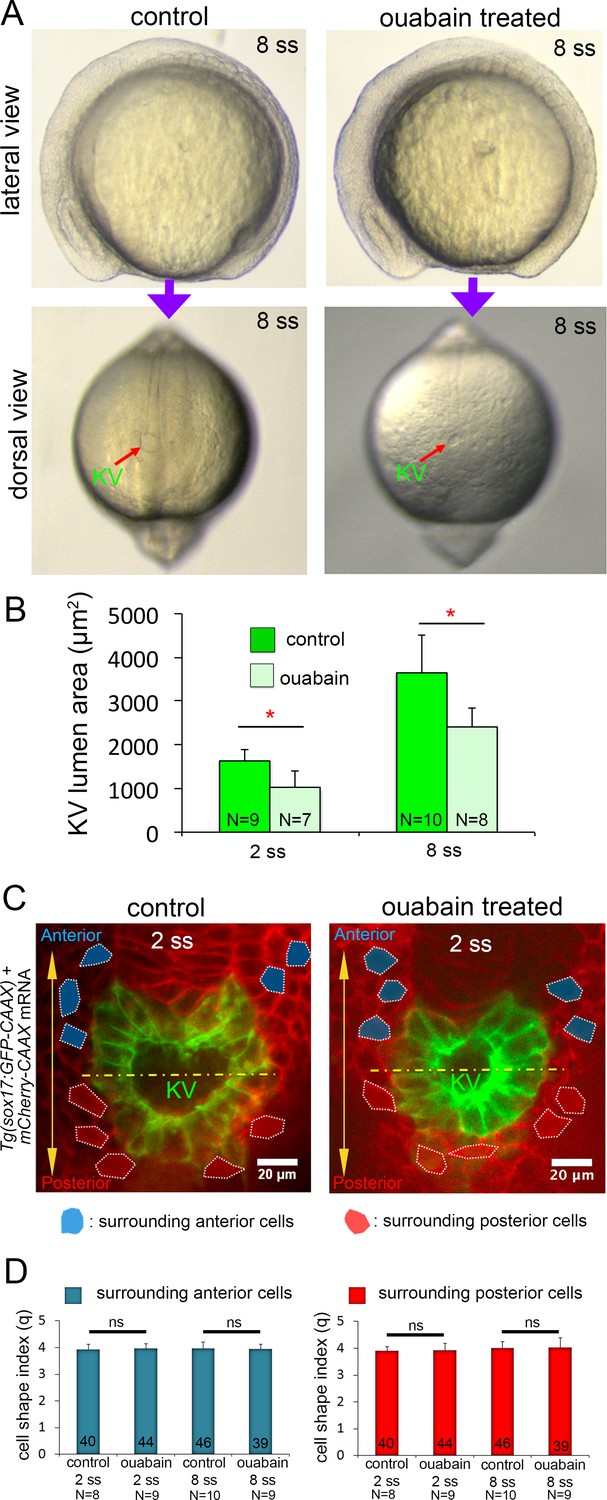
Morphology of external cells surrounding KV in ouabain treated embryos.
(A) Ouabain treatment did not cause gross developmental defects as compared to control embryos, except the KV lumen (arrow) was smaller at 8 ss. (B) Quantification of KV lumen cross-sectional area from the middle focal plane at 2 ss and 6 ss stages from control and ouabain treated Tg(sox17:GFP-CAAX) embryos. N = number of embryos analyzed. Shown is the mean + SD, *p<0.01 (Welch’s T-Test). (C) Ubiquitous expression of membrane-targeted mCherry (mCherry-CAAX) in Tg(sox17:GFP-CAAX) embryo allowed visualization both KV cells at the middle plane of KV and the surrounding external cells in control and ouabain treated embryos. Surrounding cells with clear boundaries were selected for cell shape analysis. Representative surrounding cells at 2 ss in the anterior (blue) or posterior (red) region of KV are shown. Yellow line divides KV lumen into anterior and posterior halves. Scale = 20 μm. (D) Quantitative analysis of cell shape index (q) shows no significant difference in surrounding cells between control and ouabain treated embryos at 2 ss and 8 ss. Results were pooled from two independent experiments at each stage. The number of surrounding anterior cells (blue) and surrounding posterior cells (red) analyzed is indicated in the graph. N = number of embryos analyzed. Shown is the mean + SD. ns = not significant (p>5% with Welch’s T-Test).
Figure 4 with 4 supplements
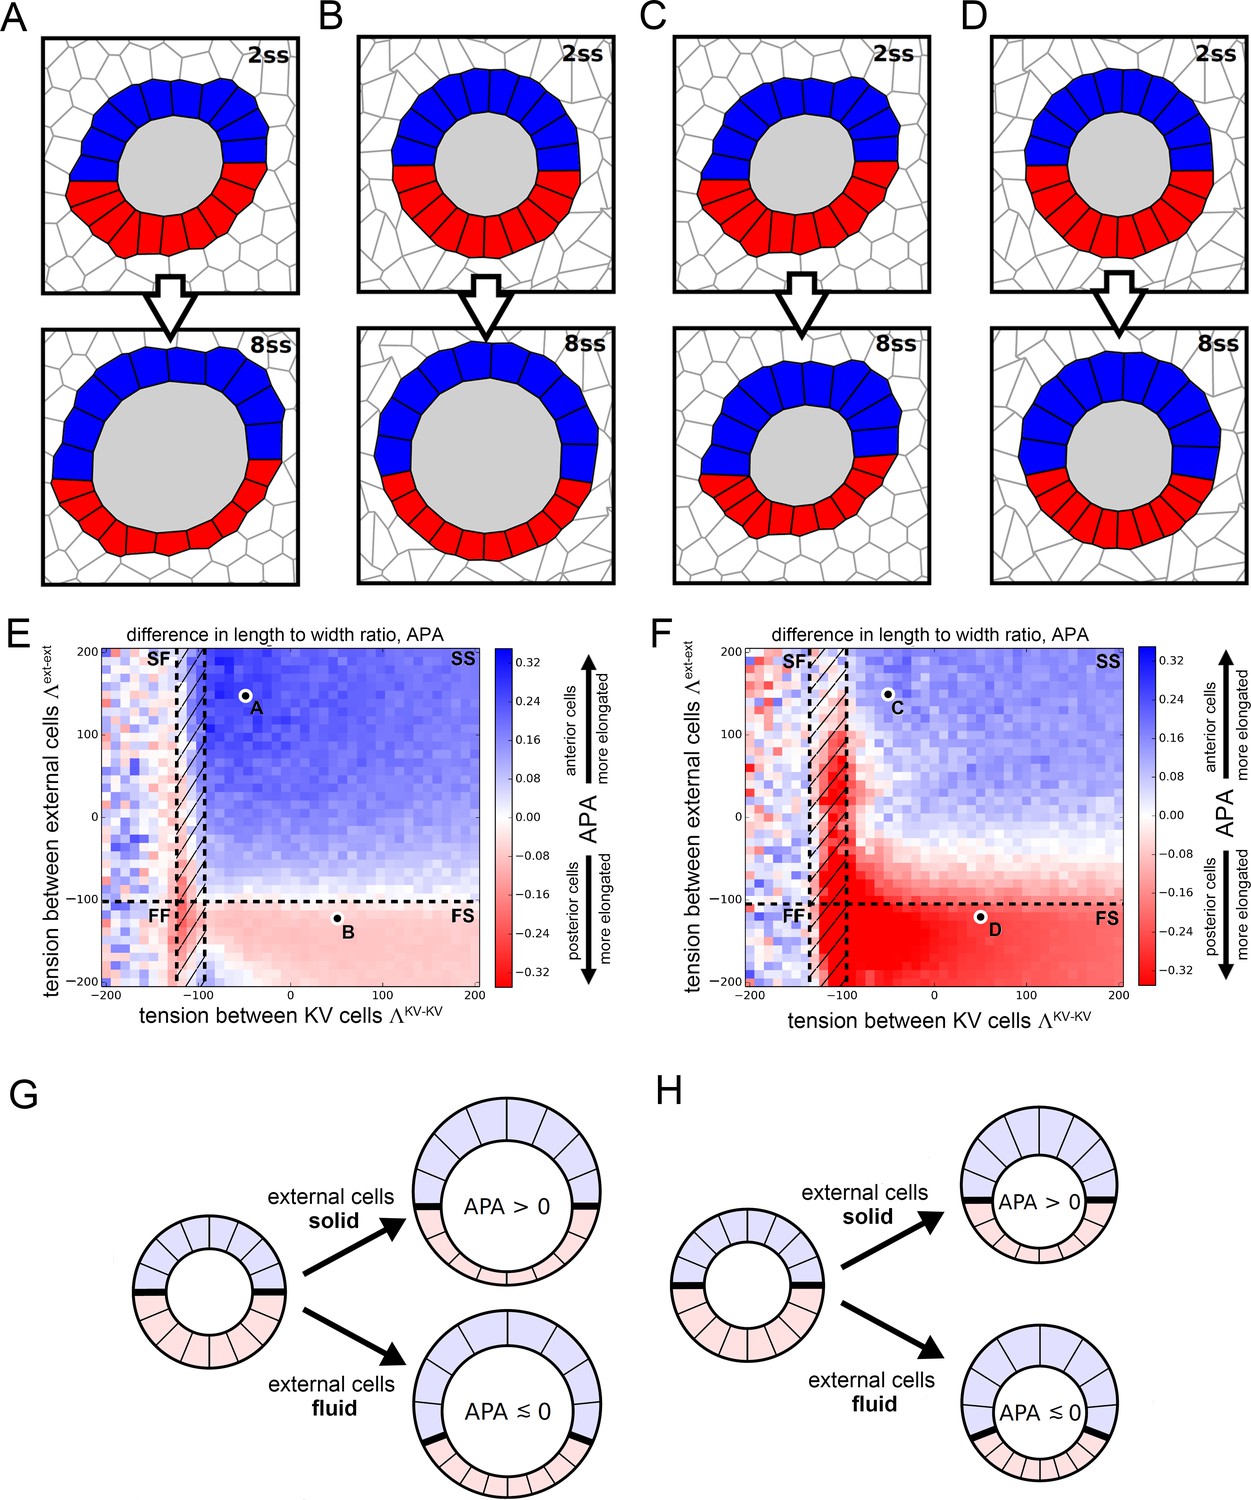
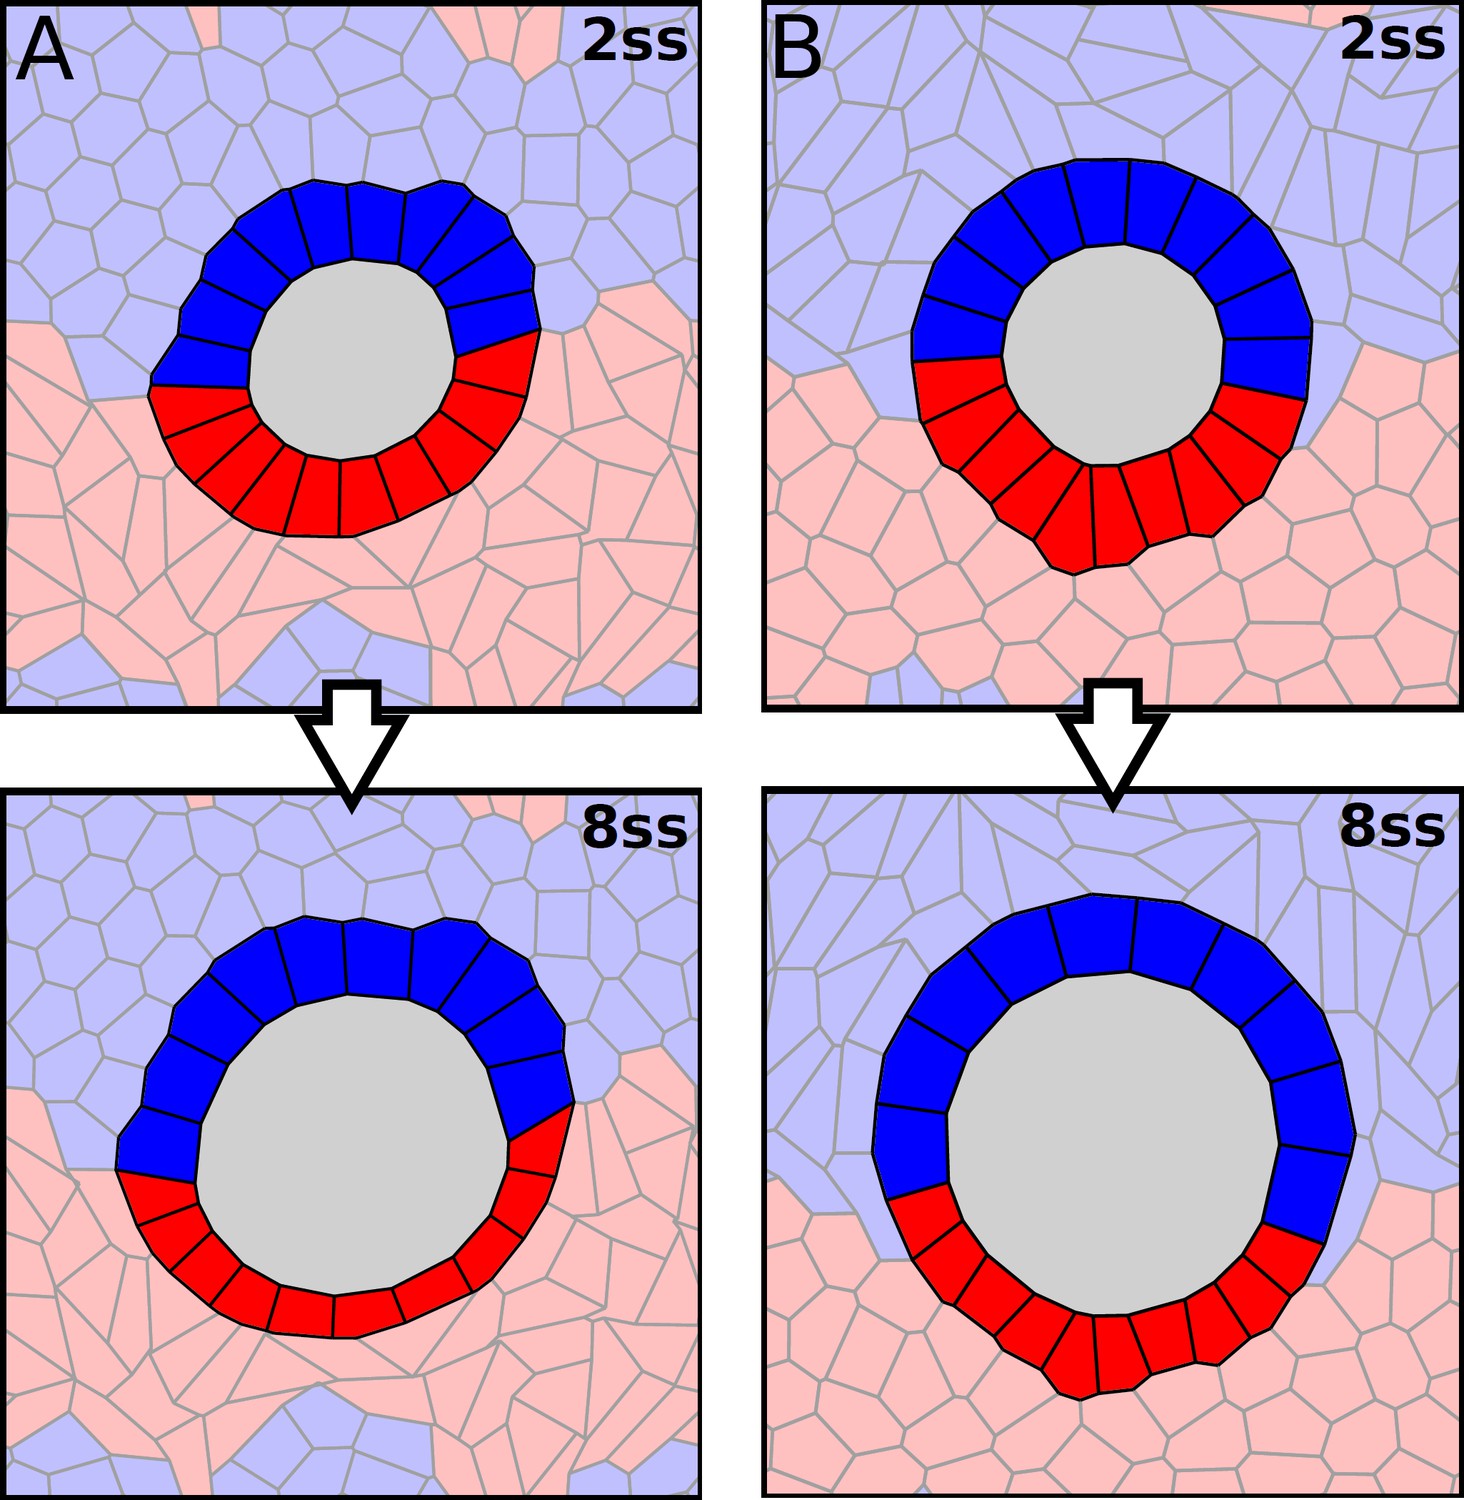
Vertex model simulations for cell shapes during KV remodeling.
(A–D) Vertex model simulations with N = 10 KV-ant and KV-post cells. Upper and lower panels respectively show force-balanced states at 2 ss and 8 ss. All shown simulations start from the same initial cell positions, but the mechanical parameters differ. The full simulation box is cropped in order to focus on the KV. For the example of panel A, Figure 4—figure supplement 1B shows the respective full state. (A) Both KV and external cells are solid-like (interfacial tensions and ), and the lumen cross-sectional area expands according to experimental measurements between 2 and 8 ss. (B) KV cells are solid-like (), external cells are fluid-like (), and the lumen cross-sectional area expands. (C) Both KV and external cells are solid-like ( and ) and the lumen cross-sectional area stays constant between 2 and 8 ss. (D) KV cells are solid-like (), external cells are fluid-like (), and the lumen cross-sectional area is constant. (E,F) Parameter scan for the anterior-posterior asymmetry, APA (LWR-ant - LWR-post), depending on the respective interfacial tensions of KV cells and external cells, which defines whether these cells are solid-like or fluid-like (FS = external cells fluid-like, KV cells solid-like; SS = both external and KV cells are solid-like; FF = both external and KV cells fluid-like; SF = external cells solid-like, KV cells fluid-like; hatched region = KV ant cells solid-like and KV-post cells fluid-like). For each pair of interfacial tensions, the APA was computed from the average of 100 separate simulation runs. When KV cells are solid-like, the standard error of the mean APA is typically on the order of 0.05. However, for fluid-like KV cells standard error of the mean APA can become much larger, which is reflected by the large mean APA fluctuations in this regime. (E) The lumen cross-sectional area changes normally between 2 and 8 ss. (F) The lumen cross-sectional area is fixed at a constant value between 2 and 8 ss. The parameter values corresponding to panels A-D are marked in E,F. For both E and F, a positive APA is robustly obtained only when KV and external cells are both solid-like. (G,H) Illustrations of how mechanical properties of external cells affect APA values in our simulations. For solid external cells, the interface between KV-ant and KV-post cells is prevented from moving posteriorly upon decreasing KV-post cell cross-sectional areas between 2 ss and 8 . As a consequence, the posterior KV cells flatten and obtain a smaller LWR-post value, which results in a positive APA. Conversely for fluid external cells, a decrease in KV-post cell cross-sectional area is accommodated by a posterior sliding of the interface between KV-ant and KV-post cells. Consequently, the APA does not increase and may even decrease. These mechanisms work both for increasing lumen cross-sectional area (G) and for constant lumen cross-sectional area (H).
-
Figure 4—source data 1
Percentage differences of cell volume, cell cross sectional area, and cell height between anterior and posterior cells [(Post – Ant)/Post] at 2 ss and 8 ss for DMSO control embryos.
The cell volume is proportional to the product of cross-sectional area and height. As a consequence, if the AP difference in cell volume was fully due to the difference in the cross-sectional areas, then the percentage differences of both volumes and cross-sectional areas should be the same. Similarly, if the cell volume difference was fully due to the height difference, then the percentage differences of volumes and height should be the same. We find that at 2 ss, the AP differences are not high in all three quantities. However, at 8 ss the AP volume difference is very large and is mostly accounted for by the AP difference in cross-sectional areas, while the height difference stays comparably small.
- https://doi.org/10.7554/eLife.30963.021
-
Figure 4—source data 2
Preferred areas prescribed in our vertex model simulations for the different cell types at 2 ss and 8 ss.
The listed values for lumen and KV cells are experimentally measured average cross-sectional areas from DMSO-treated control embryos. The 2 ss values for the external cells were set to the average of KV-ant and KV-post cells. The preferred area of the external cells at 8 ss is chosen such that the total preferred area stays constant between 2 ss and 8 ss. Note that in Figure 4A,B,E, the lumen area changes between 2 ss and 8 ss (same in Figure 4—figure supplements 2 and 3A,B,E), while in Figure 4C,D,F, the lumen area at 8 ss is set to the value measured at 2 ss (same in Figure 4—figure supplements 2 and 3C,D,F). In order to facilitate comparison with experimental data, we choose micro-meters (μm) as length units for our vertex model simulations.
- https://doi.org/10.7554/eLife.30963.022
Figure 4—figure supplement 1

Definition of the length-width ratio (LWR) in the simulations, and example for full force-balanced state.
(A) The width W is the distance between the midpoints of the respective interfaces with the two adjacent KV cells. The length L is the distance from the midpoint of the interface with the lumen to the midpoint between points P and Q. The LWR is defined by the quotient L/W. (B) Non-cropped force-balanced state for the example case shown in Figure 4A. We use periodic boundary conditions for all our simulations (for details see Materials and methods).
Figure 4—figure supplement 2
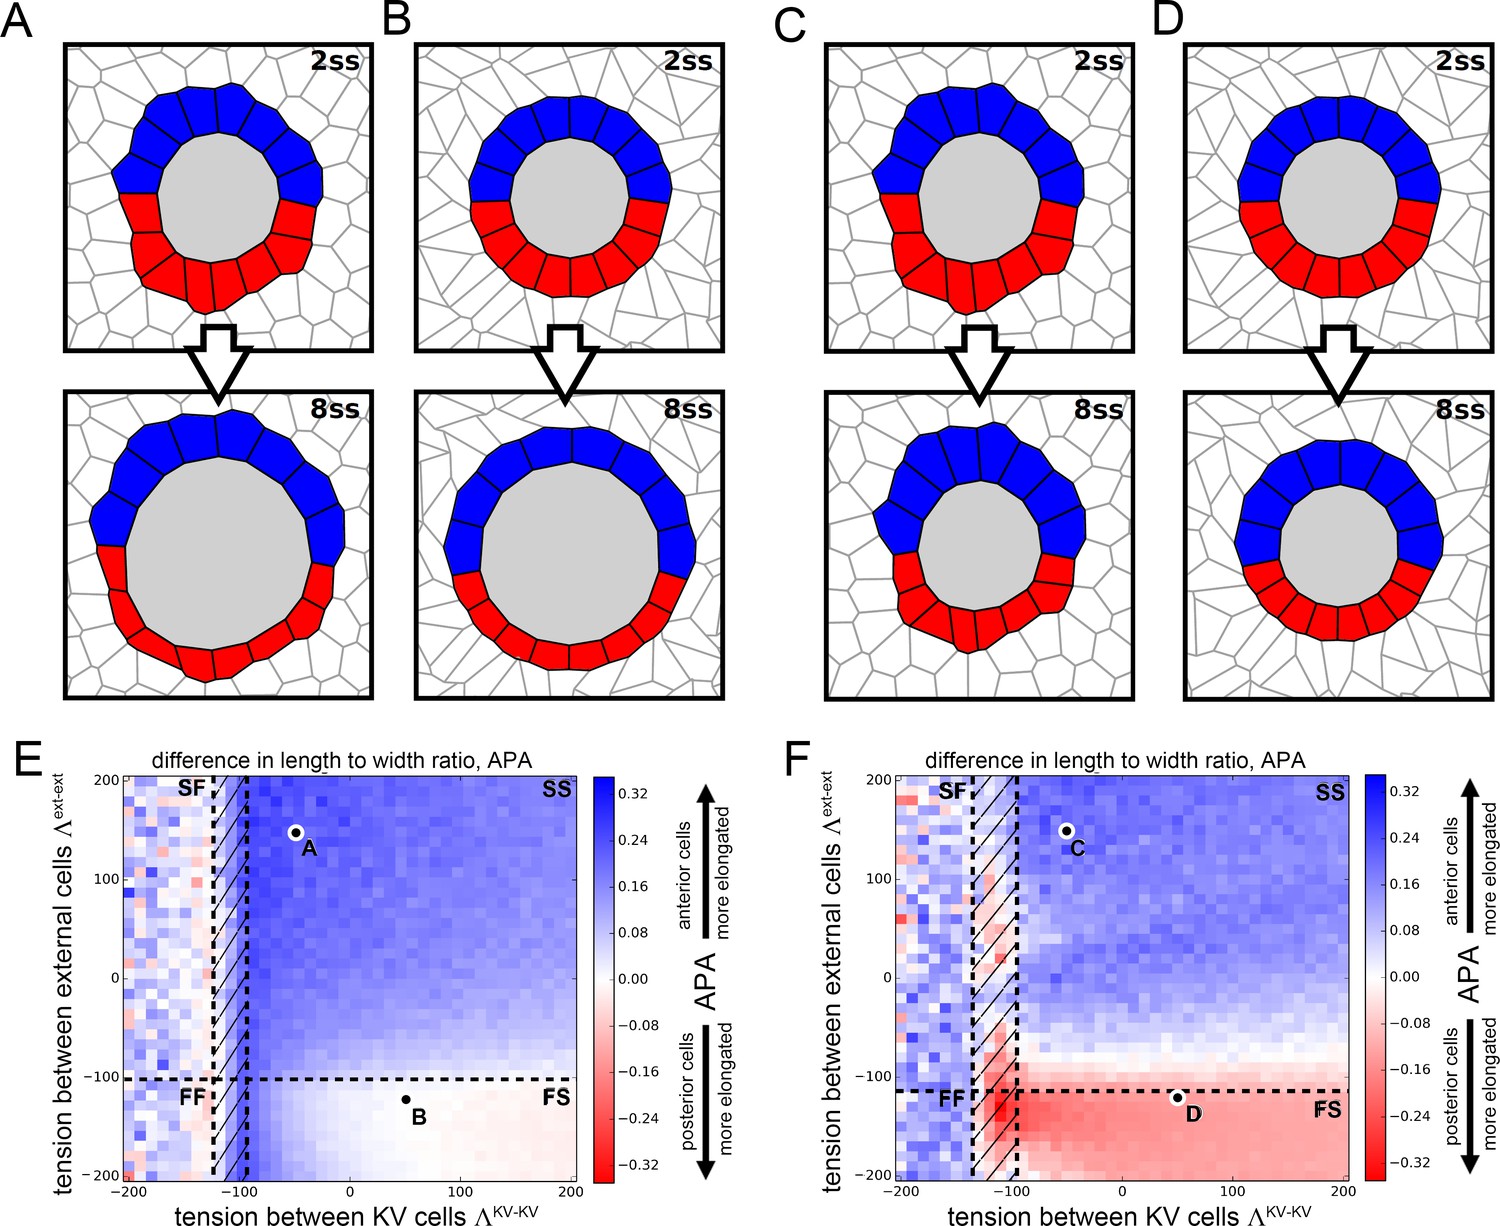
Vertex model simulations for cell shapes during KV remodeling (N = 8).
Results as in Figure 4 for N = 8 KV-ant and KV-post cells.
Figure 4—figure supplement 3
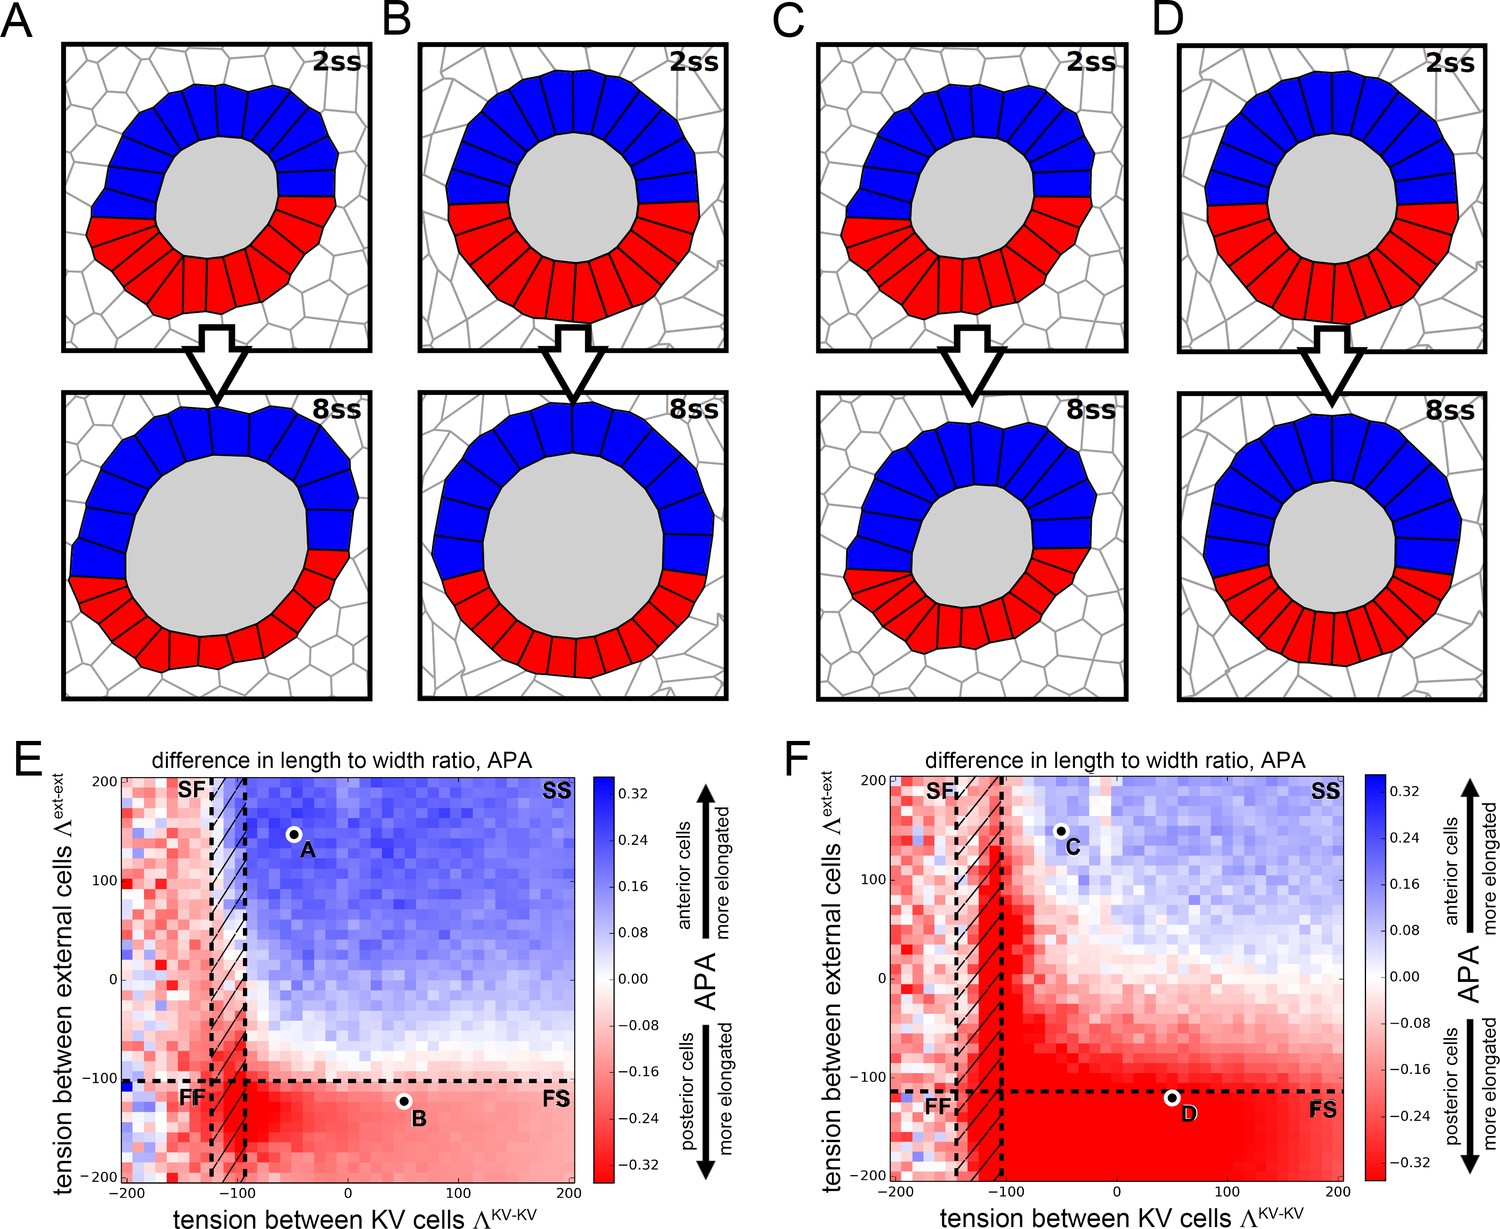
Vertex model simulations for cell shapes during KV remodeling (N = 12).
Results as in Figure 3 for N = 12 KV-ant and KV-post cells.
Figure 4—figure supplement 4
Vertex model simulations with asymmetric properties of the external cells.
(A–B) Vertex model simulations with two populations of external cells. Anterior external cells are shown in light blue and posterior external cells are shown in light red. Anterior cells also show up on the bottom and posterior cells show up on the top because of periodic boundary conditions (see Materials and methods). Similar to Figure 4A–D, upper and lower panels respectively show force-balanced states at 2 ss and 8 ss. The KV cells are solid-like with as in Figure 4A. (A) Anterior external cells are solid-like with , and posterior external cells are fluid-like with . (B) Anterior external cells are fluid-like with , and posterior external cells are solid-like with .
Figure 5 with 3 supplements
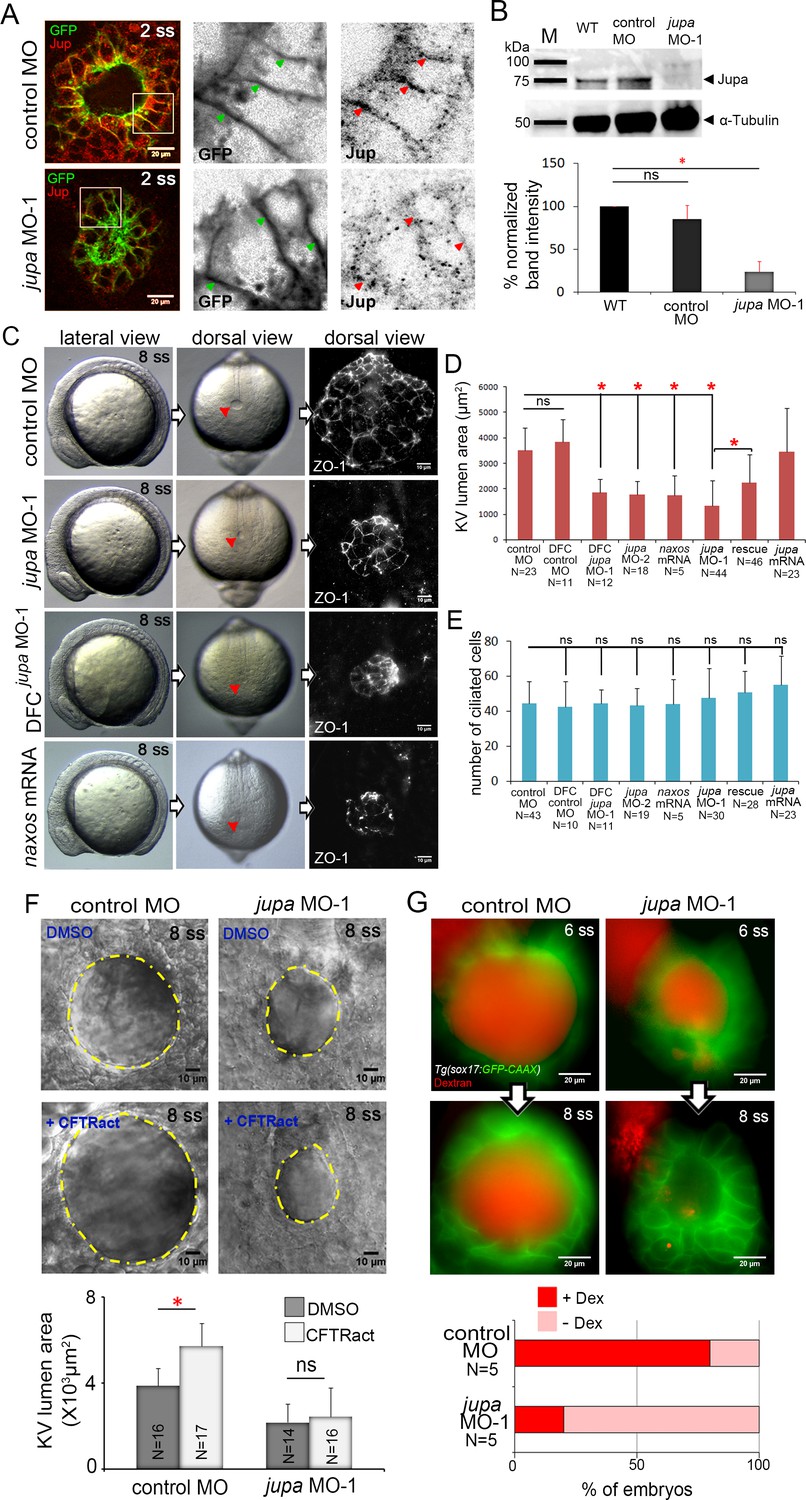
Interfering with Junction plakoglobin inhibits KV lumen expansion.
(A) Immunostaining with Jup antibodies shows Jup enrichment at lateral membranes of KV cells marked by membrane-targeted GFP expression in Tg(sox17:GFP-CAAX) embryos. Embryos injected with jupa MO-1 showed reduced Jup protein levels. Boxes indicate enlarged regions shown as individual channels. Arrows point out representative lateral membranes. Scale = 20 μm. (B) Immunoblotting confirmed reduction in Jup protein level (arrowhead) in jupa MO-1 injected embryos relative to wild-type (WT) and control MO injected embryos. The graph shows normalized Jupa band intensities. Shown is the mean + SD for three independent experiments. (C) At 8 ss, control embryos showed an inflated KV lumen (red arrow) that was labeled using ZO-1 antibody staining. Embryos injected with jupa MO-1 to knockdown Jup expression in all cells (global knockdown) or specifically in DFC/KV cells (DFCjupa MO-1) appeared normal at 8 ss except that the KV lumen failed to expand. Interfering with Jup by injecting JUP-naxos mRNA also inhibited KV lumen expansion. Scale = 10 μm. (D) Quantification of KV lumen area in control and treated embryos at 8 ss. Co-injecting jupa MO-1 with jupa mRNA significantly rescued lumenogenesis defects. Shown are mean + SD for three independent experiments. (E) The number of ciliated KV cells was not different among the treatment groups. Shown is the mean + SD for results pooled from three independent experiments. (F) Representative images of at 8 ss in control and jupa MO injected embryos treated with vehicle (DMSO) or CFTRact-09. The graph shows KV lumen area (outlined by yellow line) in control and treated embryos. Scale = 10 μm. Shown is the mean + SD for two independent experiments.(G) Representative images of KV lumens of contro MO and jupa MO embryos injected with rhodamine-dextran. Scale = 20 μm. The graph shows percentage of embryos retaining and losing the fluorescent dye between 6 ss and 8 ss from two independent trials. N = number of embryos analyzed. *p<0.01 and ns = not significant (p>5% with Welch’s T-Test).
Figure 5—figure supplement 1
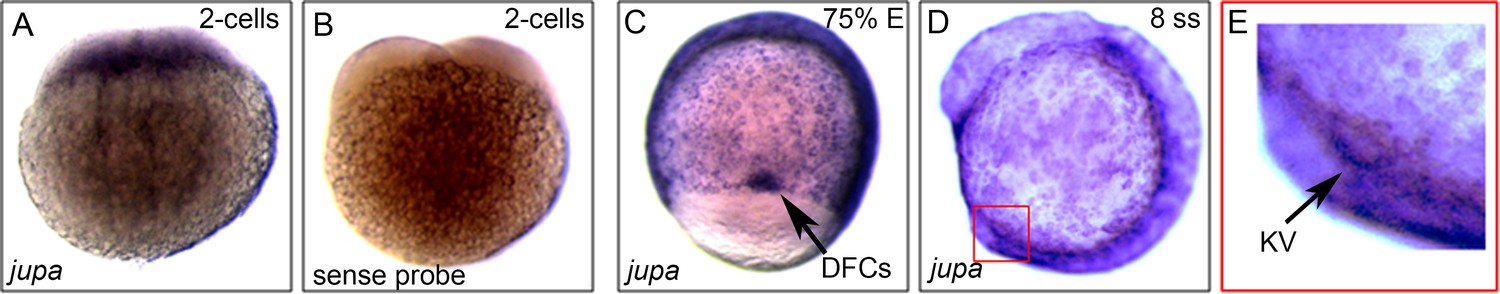
jupa is maternally supplied and enriched in precursor dorsal forerunner cells (DFCs) and KV.
(A–E) RNA in situ hybridizations of jupa during early zebrafish development. (A) Antisense jupa probe revealed maternal jupa mRNA in 2 cell stage embryo. (B) A control jupa sense probe showed no staining. (C–D) jupa mRNA was detected in DFCs (black arrow) and KV cells (red square) during epiboly and early somite stages. (E) Enlarged region depicting jupa staining in KV (black arrow).
Figure 5—figure supplement 2
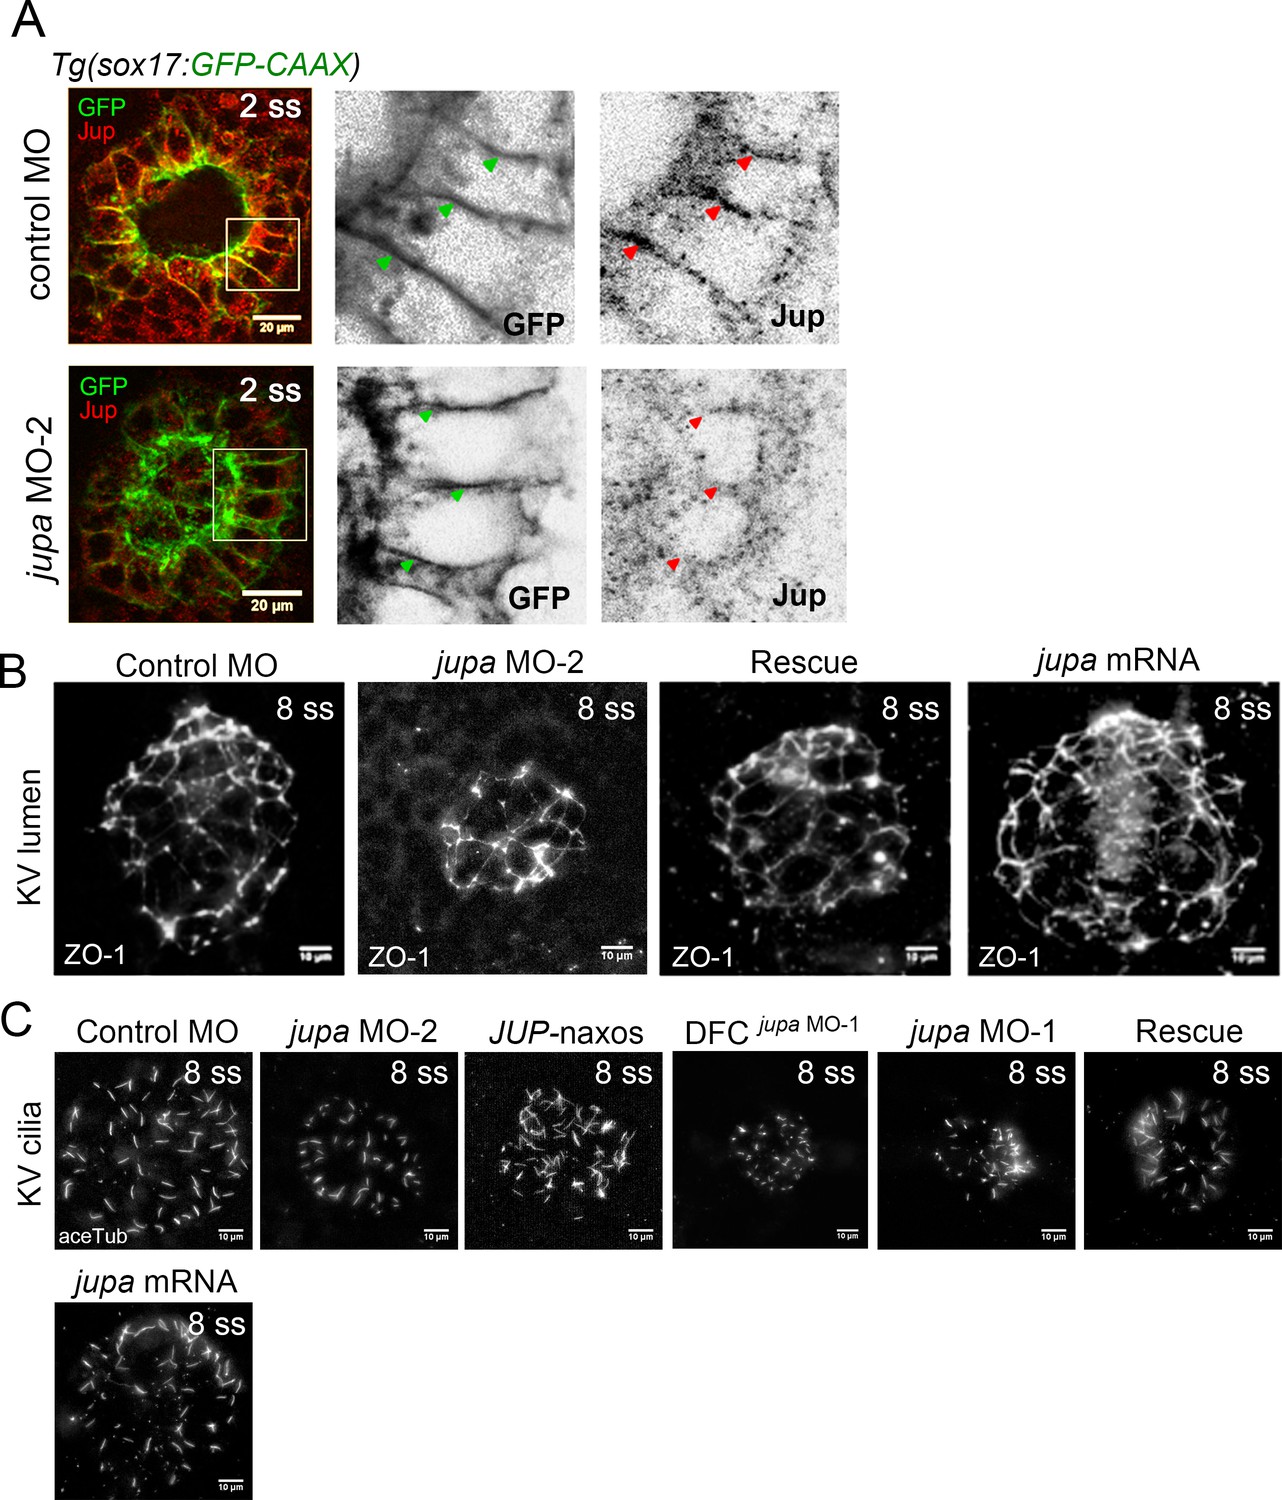
Interfering with Junction plakoglobin inhibits KV lumenogenesis but not ciliated cell number.
(A) Immunostaining with Jup antibodies showed that embryos injected with jupa MO-2 had reduced Jup protein levels in KV relative to control embryos (image of control MO embryo reproduced from Figure 5A for comparison). Boxes indicate enlarged regions shown as individual channels. Lateral membranes of KV cells are marked by membrane-targeted GFP expression in Tg(sox17:GFP-CAAX) embryos. Arrows point out representative lateral membranes. Scale = 20 μm. (B) Representative KV lumens labeled using ZO-1 antibody staining at 8 ss from different treatments. Scale = 10 μm. (C) KV cilia labeled using acetylated-tubulin antibody staining at 8 ss from different treatments. Scale = 10 μm.
Figure 5—figure supplement 3
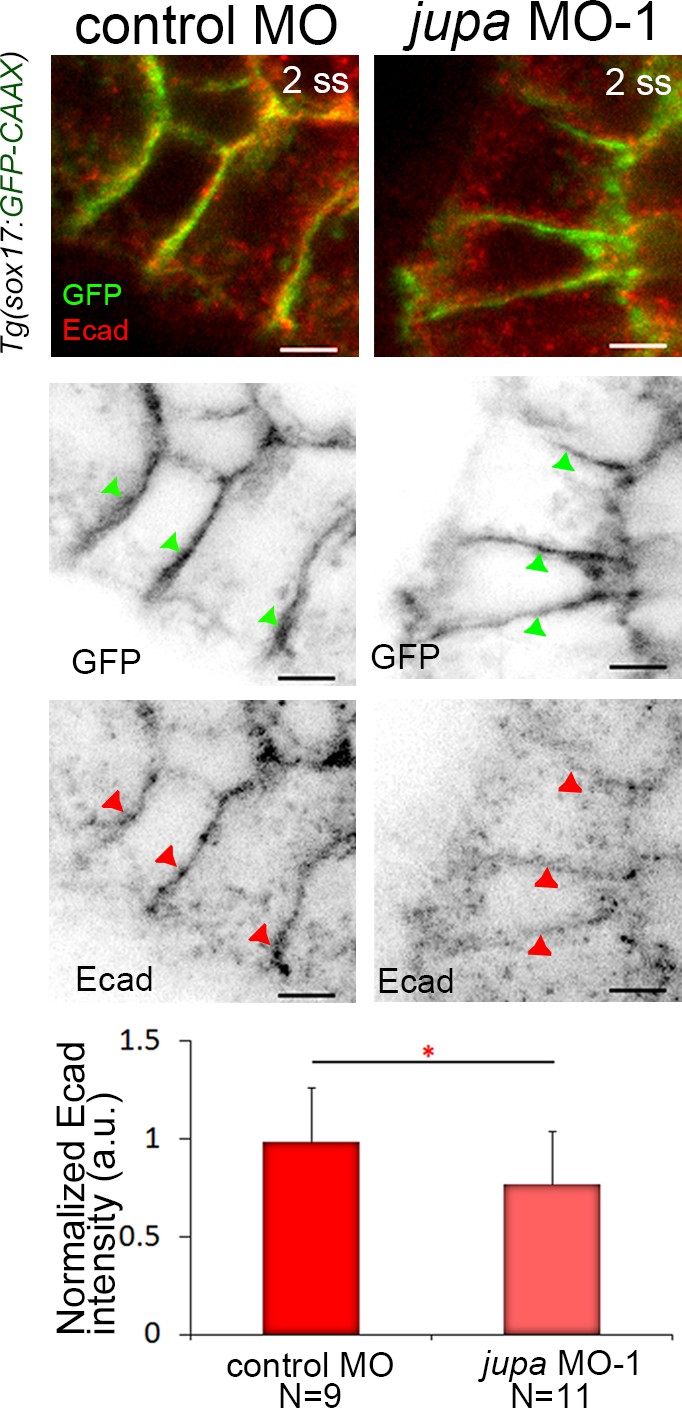
Jupa knockdown results in reduced E-cadherin levels at lateral membranes of KV cells.
Immunostaining with E-cadherin (E-cad) antibodies showed E-cad enrichment at lateral membranes of KV cells marked by membrane-targeted GFP expression in Tg(sox17:GFP-CAAX) embryos. Embryos injected with jupa MO-1 showed a moderate reduction of E-cad protein enrichment at KV membranes. Arrows point to representative lateral membranes in individual channels. The graph represents normalized E-cad intensities from two experiments. N = number of embryos analyzed. Scale = 5 μm. *p<0.05 (Welch’s T-Test).
Figure 6 with 1 supplement
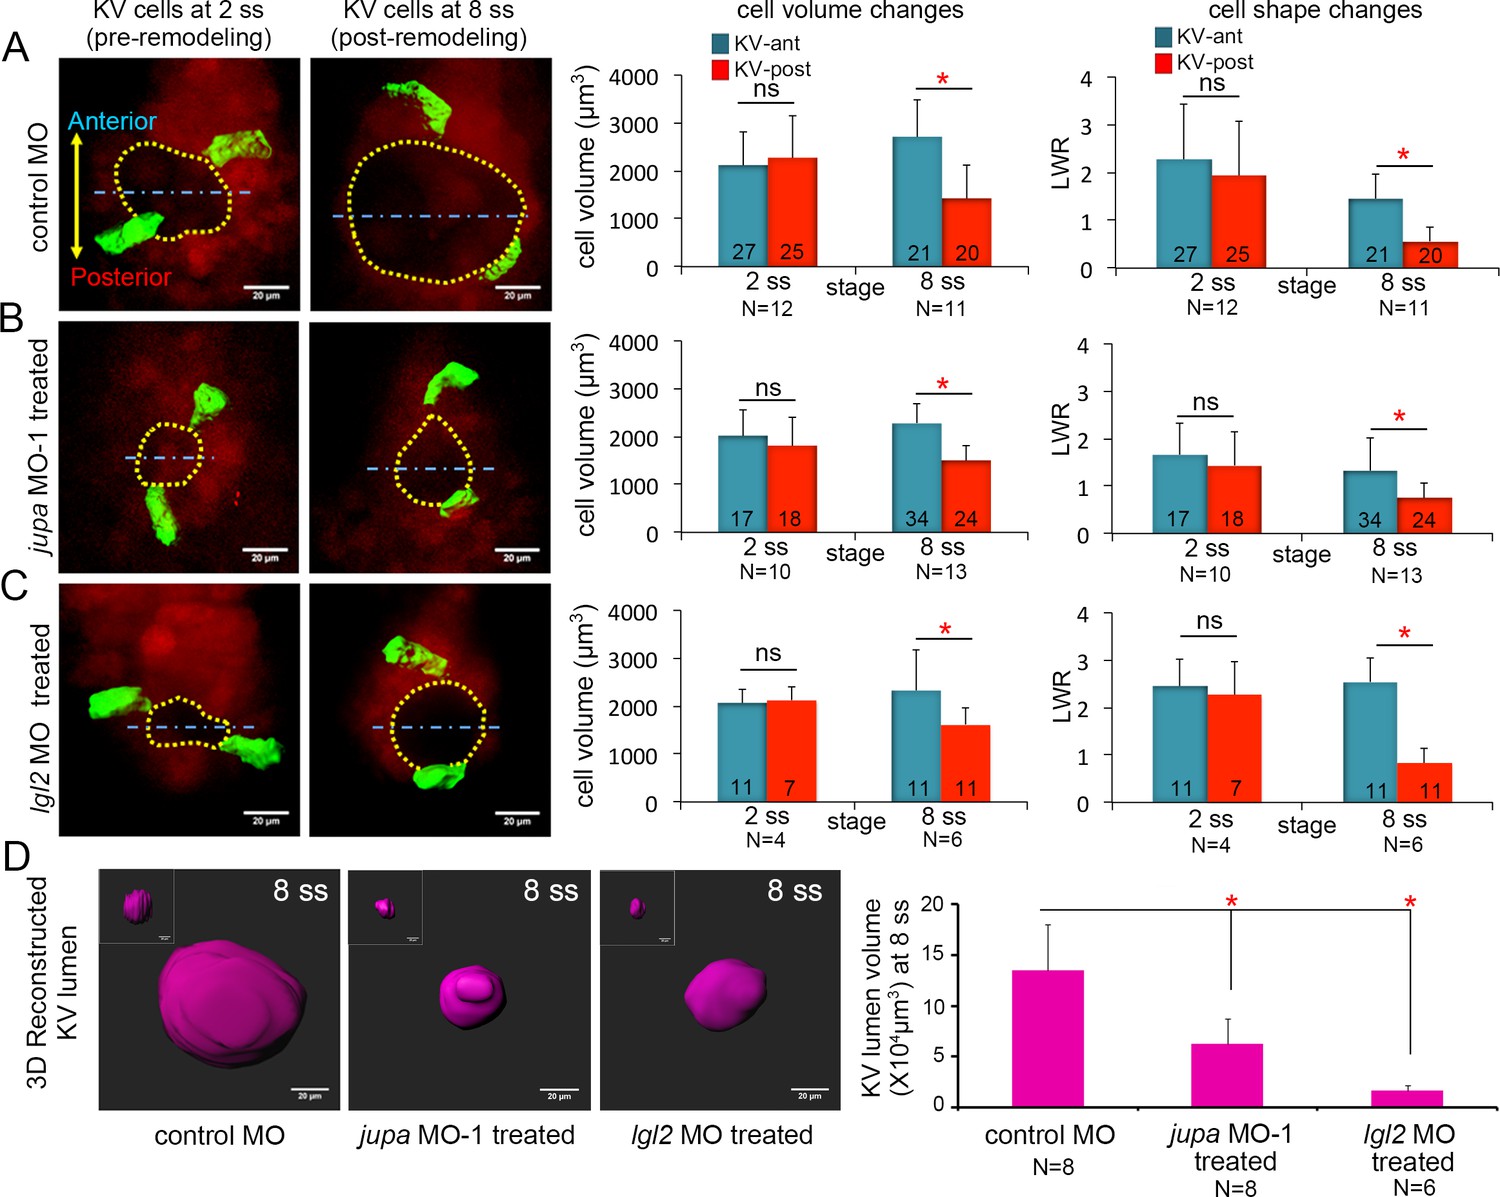
Asymmetric cell shape changes in KV are separable from lumen expansion.
(A) Mosaic labeled KV cells in control MO injected embryos showed asymmetric changes in cell volumes and cell shapes between at 2 ss and 8 ss. (B–C) Perturbing cell-cell junction integrity in KV by interfering with jupa (B) or lgl2 (C) expression inhibited KV lumen expansion, but asymmetric cell volume changes occurred that were similar to controls. In addition, asymmetric KV cell shape changes occurred normally in jupa and lgl2 MO embryos. (D) Quantification of 3D reconstructed KV lumen volumes (insets depict KV lumen in YZ axis) in control and treated live embryos at 8 ss. For quantitative analyses, the mean + SD is shown. The number of KV-ant and KV-post cells analyzed is indicated in the graphs in A-C. N = number of embryos analyzed. Data for control MO and jupa MO experiments are pooled from three independent experiments and lgl2 MO data are pooled from two experiments. Scale = 20 μm. *p<0.01 and ns = not significant (p>5% with Welch’s T-Test).
-
Figure 6—source data 1
Statistical power analysis for the non-significant AP cell volume and LWR differences in Figure 6A–C.
Here, we show the false negative rate that results from testing against the alternative hypothesis that the true AP difference in a given case was the same as for the MO control at 8 ss (Figure 6A). The statistical power in each case is .
- https://doi.org/10.7554/eLife.30963.029
Figure 6—figure supplement 1
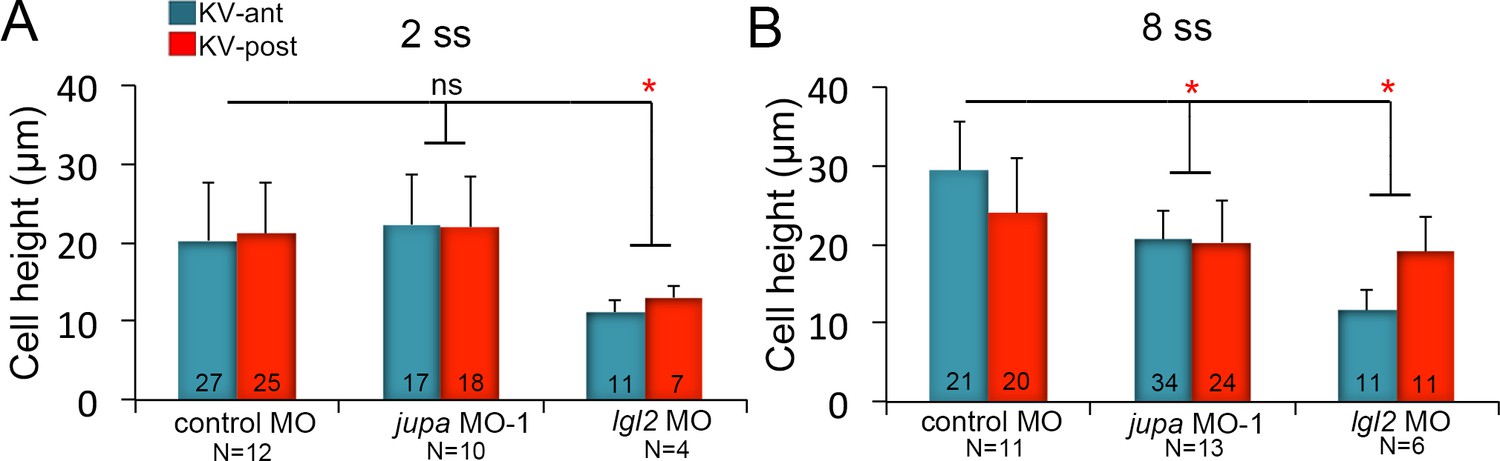
KV cell heights in embryos with KV cell-cell adhesion perturbations.
(A–B) Quantification of individual KV-ant and KV-post cell heights from different treatments at 2 ss (A) and 8 ss (B). Data for control MO and jupa MO experiments are pooled from three independent experiments and lgl2 MO data are pooled from two experiments. The number of KV-ant and KV-post cells analyzed is indicated within the graph. N = number of embryos analyzed at each stage. Shown is the mean + SD, *p<0.01 and ns = not significant (p>5% with Welch’s T-Test).
Figure 7
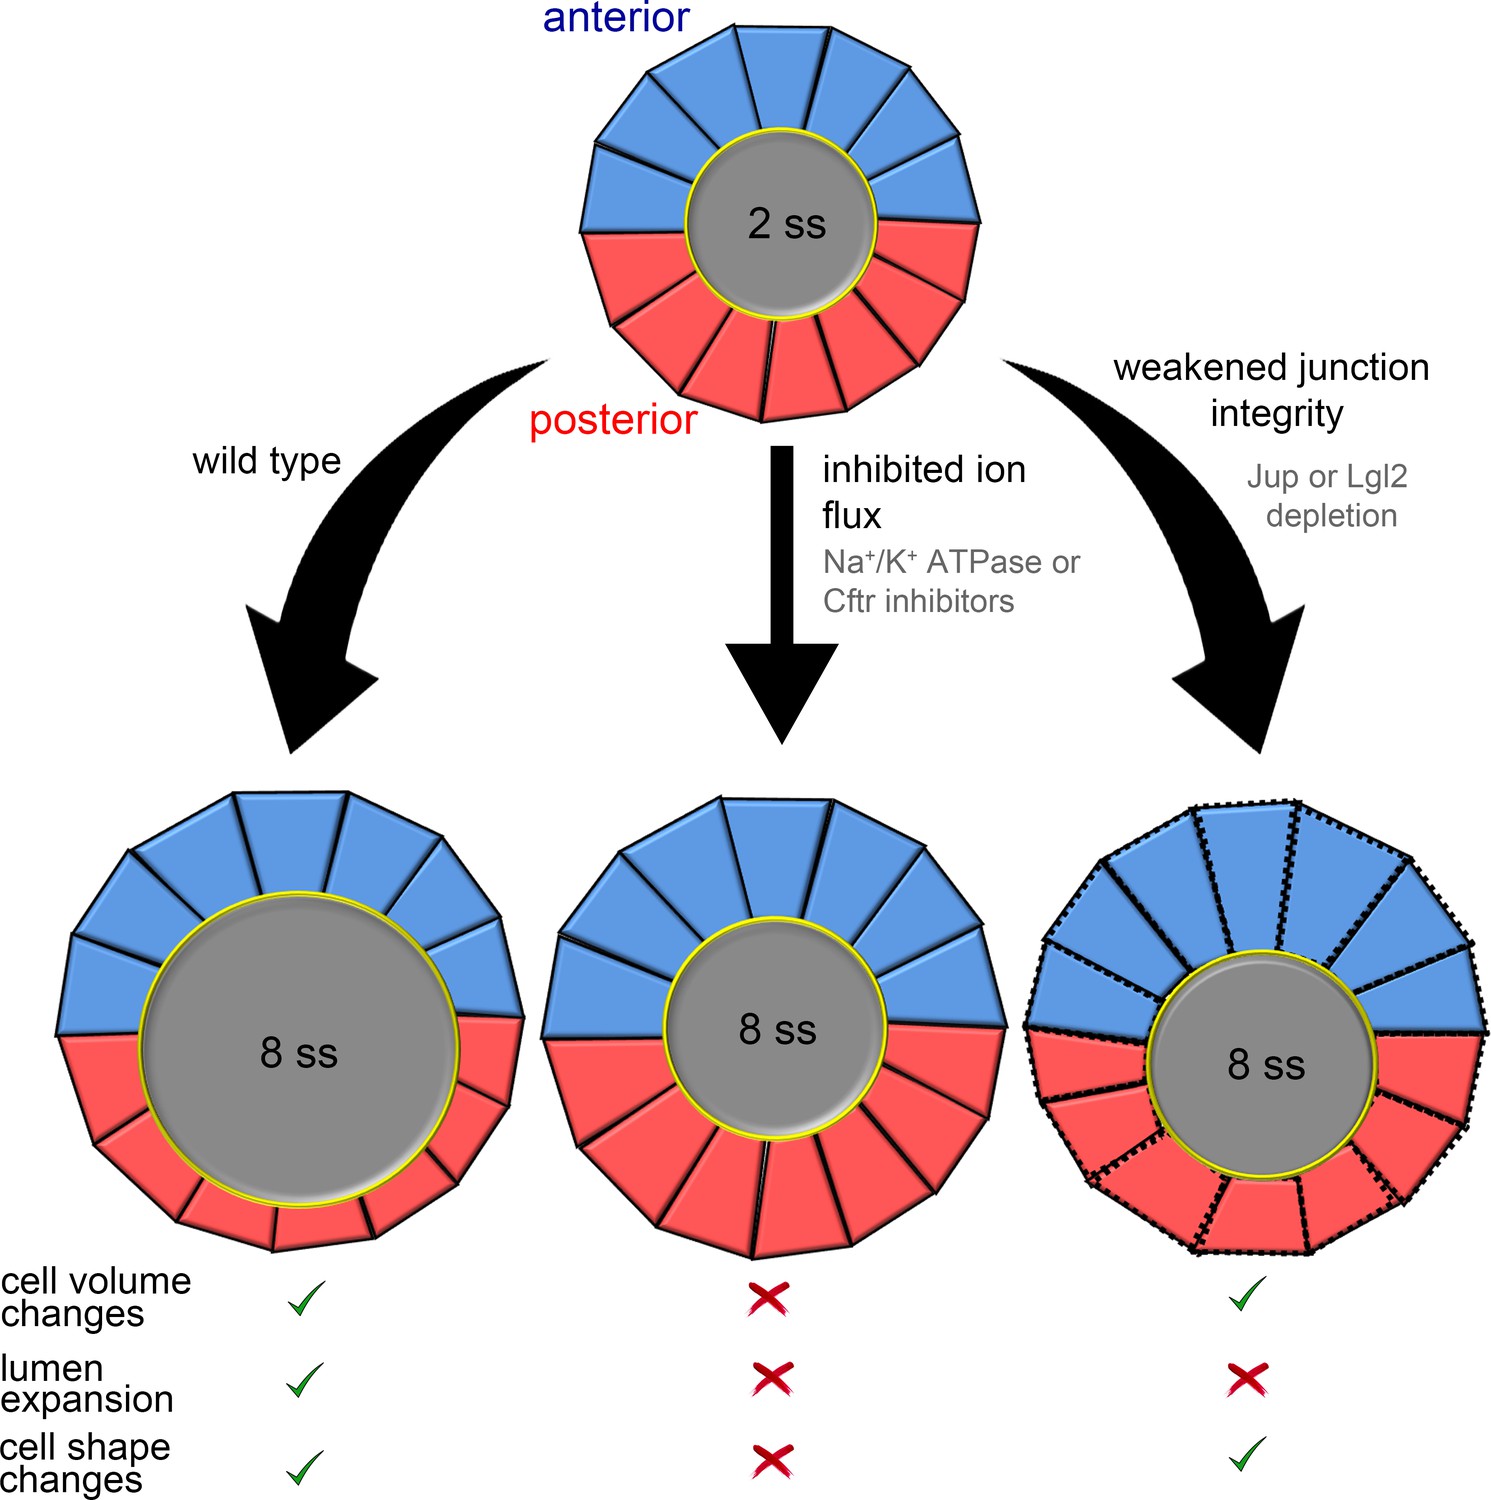
Summary and working model for epithelial cell shape changes during KV morphogenesis.
Results from experiments and modeling suggest AP asymmetric cell volume changes contribute to asymmetric cell shape changes in the KV epithelium. Inhibiting ion flux blocks asymmetric cell volume changes, lumen expansion and shape changes in KV-ant (blue) and KV-post (red) cells. Vertex simulations predict that asymmetric volume (cross-sectional area) changes in KV cells can introduce AP asymmetry in KV cell shapes without lumen expansion. Consistent with this prediction, asymmetric changes in KV volume and shape occurred in the absence of lumen expansion in embryos with weakened KV cell junction integrity. These results suggest a model in which asymmetric cell volume changes contribute to cell shape changes in KV and that this process is separable from lumen growth.
Author response image 1

Ouabain treatments between 4-6 ss do not block KV lumen expansion.
(A-B) Mosaic-labeled KV in a control embryo (A) and an embryo treated with ouabain from 4ss to 6ss (B). (C) Measurements of maximum KV lumen area indicated that ouabain treatments between 4-6 ss were not effective at blocking KV lumen expansion. N=number of embryos analyzed. Error bars=one standard deviation. ns=not significant, (Welch’s T-Test).
Author response image 2
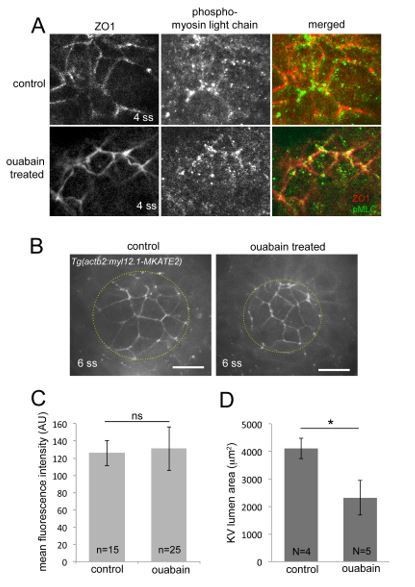
Effect of ouabain treatments on the actomyosin network in KV.
(A) Antibodies that recognize phosphorylated myosin light chain (pMLC) were used to detect active myosin II at the apical cortex of KV cells marked by ZO1 staining. pMLC staining was present in both control and ouabain treated KVs, but this signal proved difficult to quantify. (B) Expression of fluorescent myosin light chain (myl12.1)-mKate2 fusion proteins at the apical cortex of KV cells in live embryos. Dashed yellow lines outline KV lumen. Scale bars=20 mm. (C) Expression intensity of myl12.1-mKate2 measured at cell-cell interfaces was found to be similar between control (n=15 interfaces) and ouabain (n=25 interfaces) treated embryos. (D) Measurements of maximum KV lumen area indicated that ouabain treatments were effective at blocking ion flux and lumen expansion in these embryos. N=number of embryos analyzed. Error bars=one standard deviation. *p=0.001. ns=not significant, (Welch’s T-Test).
Videos
Video 1
KV organ architecture in 3D in a live Tg(sox17:GFP-CAAX) embryo at 8 ss.
The membrane-localized GFP marks all cells in KV. KV is rotating along its anteroposterior (AP) axis. Scale = 20 μm.
Video 2
3D projection of KV in a live mosaic labeled Tg(sox17:CreERT2); Tg(ubi:Zebrabow) embryo at 8 ss.
Stochastic Cre-mediated recombination labels only few cells with YFP expression with clear boundaries that are easily distinguishable from non-recombined RFP+ cells. The KV organ is rotating along its anteroposterior (AP) axis. Scale = 20 μm.
Video 3
Time-lapse imaging of KV cells in a live mosaic labeled Tg(sox17:CreERT2); Tg(ubi:Zebrabow) embryo treated with 4-OHT from dome stage to shield stage.
Images were collected every 5 min from 2 ss to 8 ss. The movie spans 105 min of development. Single 3D rendered KV-ant (blue) and KV-post (red) cells are followed during KV morphogenesis. Scale = 20 μm.
Video 4
Time-lapse imaging of KV cells in a live mosaic labeled Tg(sox17:CreERT2); Tg(ubi:Zebrabow) embryo treated with 4-OHT from dome stage to shield stage.
Images were collected every 5 min from 4 ss to 6 ss. The movie spans 55 min of development. Single 3D rendered KV-ant (blue) and KV-post (red) cells are followed during KV morphogenesis. Scale = 10 μm.
Video 5
3D projection of KV in a fixed Tg(sox17:GFP) embryo stained with anti-fibronectin antibody at 8 ss.
Fibronectin (red) shows enrichment around the notochord and anterior region of the KV (green).. Anterior = top, Posterior = bottom. KV is rotating along its anteroposterior (AP) axis. Scale = 15 μm
Tables
Key resources table
| Reagent type (species) or resource | Designation | Source or reference | Identifiers | Additional information |
|---|---|---|---|---|
| Gene (zebrafish) | junction plakoglobin a (jupa), cystic fibrosis transmembrane conductance regulator (cftr), lethal giant larvae homolog 2 (lgl2) | PMID: 19101534, 23482490,23487313 | ||
| Strain, strain background (zebrafish) | Zebrafish (Danio rerio). Transgenic lines: this study-Tg(sox17:CreERT2), this study-Tg(sox17:GFP-CAAX), Tg(ubi:Zebrabow), Tg(sox17:GFP), this study-Tg(actb2:myl12.1-MKATE2). strain background (TAB) | PMID: 23757414, 17008449 | See Materials and methods | |
| Genetic reagent (zebrafish) | p5E-sox17, pENTR/D_creERT2, pME-GFP-CAAX, pME-myl12.1-MKATE2, p3E-SV40-polyA, pDest-Tol2CG2, JUP-naxos. | PMID: 22945937, 21138979,24920660 | Tol2 Kit V2, See Materials and methods | |
| Antibody | anti-junction plakoglobin, anti-ZO-1, anti-E-cadherin, anti-acetylated tubulin, anti-GFP, anti-fibronectin | PMID: 19101534, 23482490, 28315297 | ||
| Commercial assay or kit | Tol2 Kit V2 | http://tol2kit.genetics.utah.edu/index.php/List_of_entry_and_destination_vectors | ||
| Chemical compound, drug | 4-hydroxy tamoxifen (4-OHT), ouabain, CFTRinh-172 (CFTRinh), CFTRact-09 (CFTRact) | PMID: 25535919, 26442502,26432887 | ||
| Software, algorithm | 2D vertex model | Own code: Ph.D. thesis, Matthias Merkel, Technical University Dresden, 2014 |
Additional files
-
Transparent reporting form
- https://doi.org/10.7554/eLife.30963.032
Download links
A two-part list of links to download the article, or parts of the article, in various formats.
Downloads (link to download the article as PDF)
Open citations (links to open the citations from this article in various online reference manager services)
Cite this article (links to download the citations from this article in formats compatible with various reference manager tools)
Cell volume changes contribute to epithelial morphogenesis in zebrafish Kupffer’s vesicle
eLife 7:e30963.
https://doi.org/10.7554/eLife.30963


