Molecular mechanism to target the endosomal Mon1-Ccz1 GEF complex to the pre-autophagosomal structure
- University of Osnabrück, Germany
- University Medical Center Groningen, University of Groningen, Netherlands
Figures
Figure 1 with 2 supplements
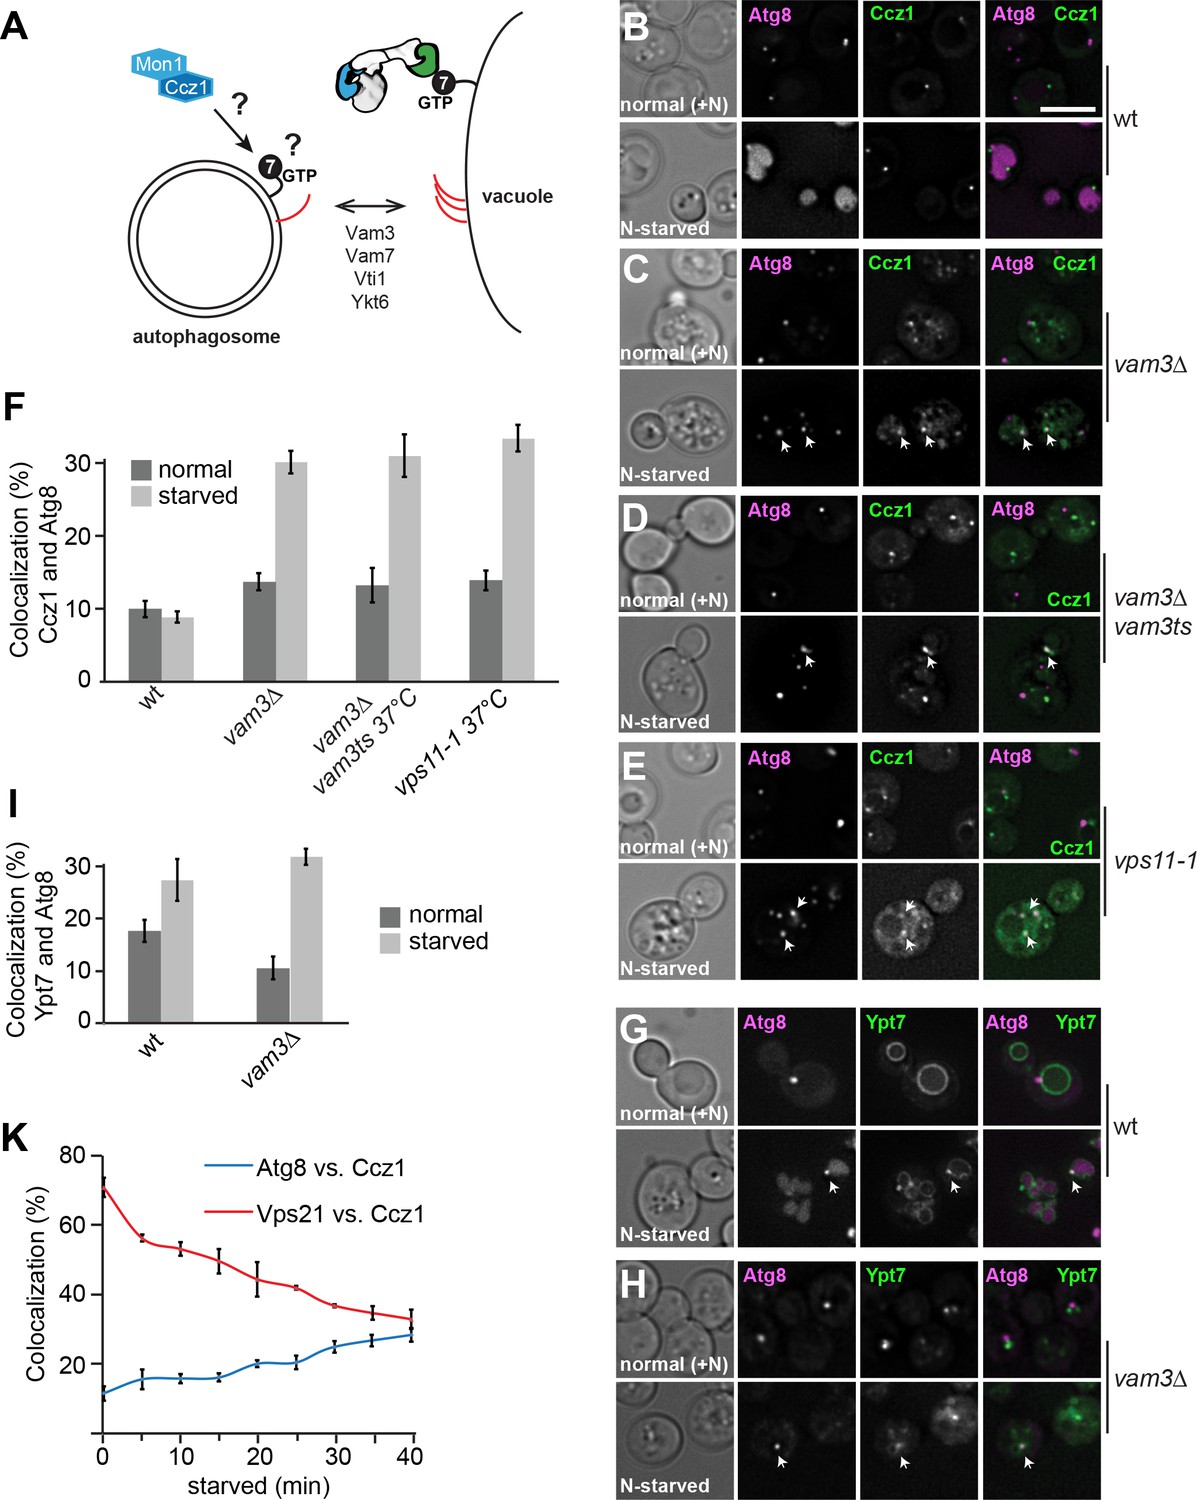
Mon1-Ccz1 and Ypt7 localize to autophagosomes during starvation.
(A) Working model of autophagosome-vacuole fusion. Red lines indicate the involved SNAREs Vam3, Vam7, Vti1, and Ykt6. Ypt7 is shown bound to the HOPS complex. For details see text. (B–H) Localization of Atg8 relative to Ccz1 and Ypt7 during growth and nitrogen starvation. Cells expressing mCherry-tagged Atg8 or GFP-tagged Ccz1 or Ypt7 were grown in YPD (normal, +N) or in synthetic medium without nitrogen (SD-N, labeled as N-starved) for 2 hr and analyzed by fluorescence microscopy and showed via individual slices. Size bar, 5 µm. (F–I) Percentage of Ccz1 puncta (F) or Ypt7 puncta (I) co-localizing with Atg8 under both conditions. Atg8 dots (n ≥ 50), Ccz1 dots (n ≥ 300) and Ypt7 dots (n ≥ 200) were quantified by Image J. Error bars represent standard deviation (SD). (K) Relocalization of Ccz1 during starvation. Time course of mCherry-tagged Vps21 and Atg8 relative to GFP-tagged Ccz1. Error bars represent SD.
-
Figure 1—source data 1
Quantification of percentage of Ccz1 puncta or Ypt7 puncta co-localizing with Atg8 during growth and nitrogen starvation for Figure 1F,I.
- https://doi.org/10.7554/eLife.31145.006
-
Figure 1—source data 2
Quantification of percentage of Ccz1 puncta co-localizing with Atg8 or Vps21 during growth and nitrogen starvation in different time points for Figure 1K.
- https://doi.org/10.7554/eLife.31145.007
-
Figure 1—source data 3
Quantification of ALP activity for nitrogen starvation 2 hr and 4 hr in wild-type and vps21∆ cells.
- https://doi.org/10.7554/eLife.31145.008
Figure 1—figure supplement 1
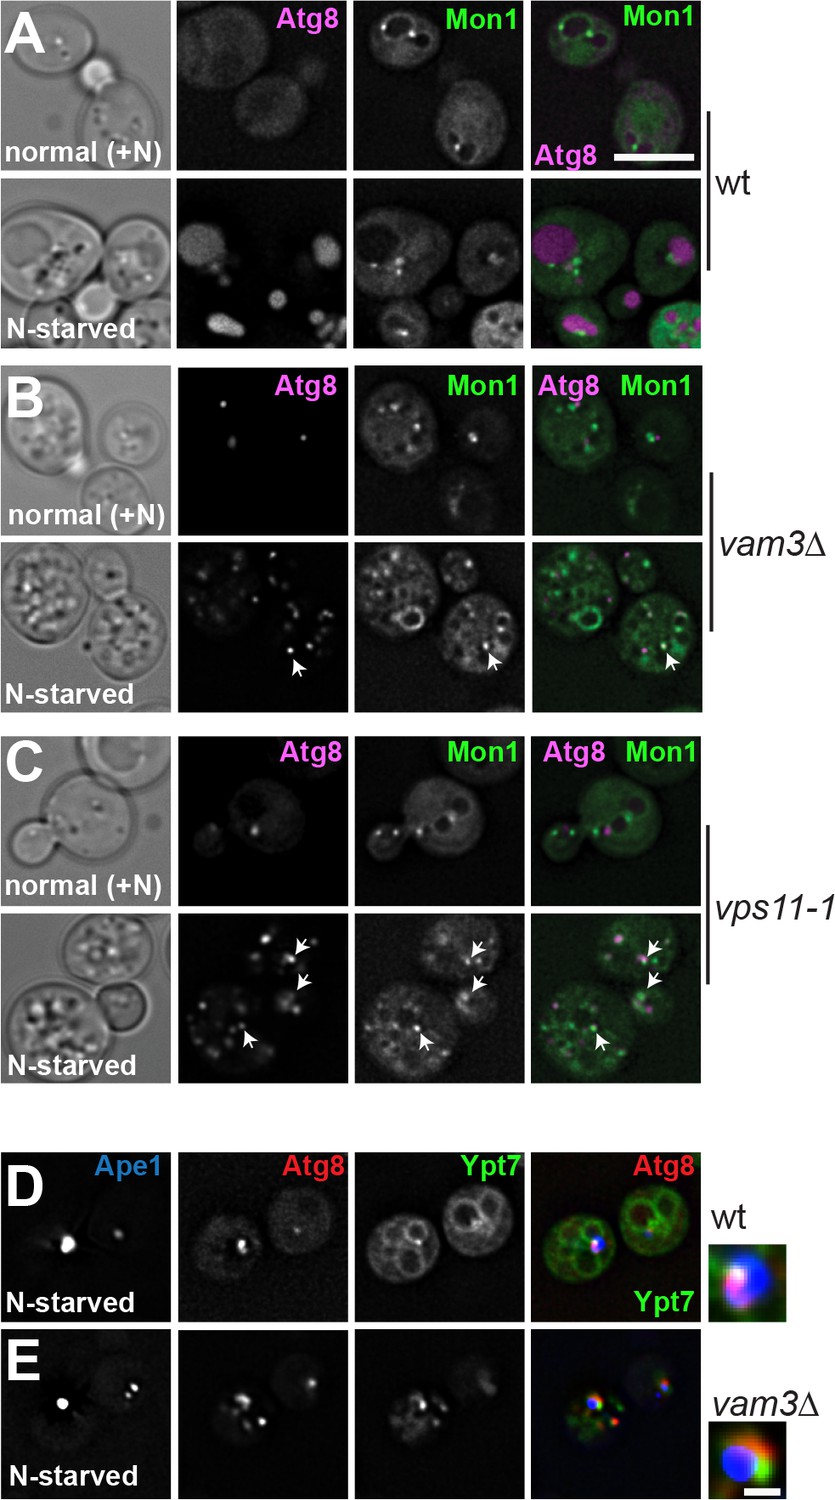
Mon1 localizes to autophagosomes during starvation.
(A–C) Localization of Atg8 relative to Mon1 during growth and starvation. Cells expressing mCherry-tagged Atg8 or GFP-tagged Mon1 were grown in YPD or in SD-nitrogen starvation medium for 2 hr and analyzed by fluorescence microscopy. Size bar, 5 µm. (D–E) Cells expressing mCherry-tagged Atg8 and GFP-Ypt7 carrying plasmid pRS315-CUP1pr-BFP-APE1 were grown in SDC medium containing CuSO4 and starved for 1 hr. Size bar, 1 µm.
Figure 1—figure supplement 2
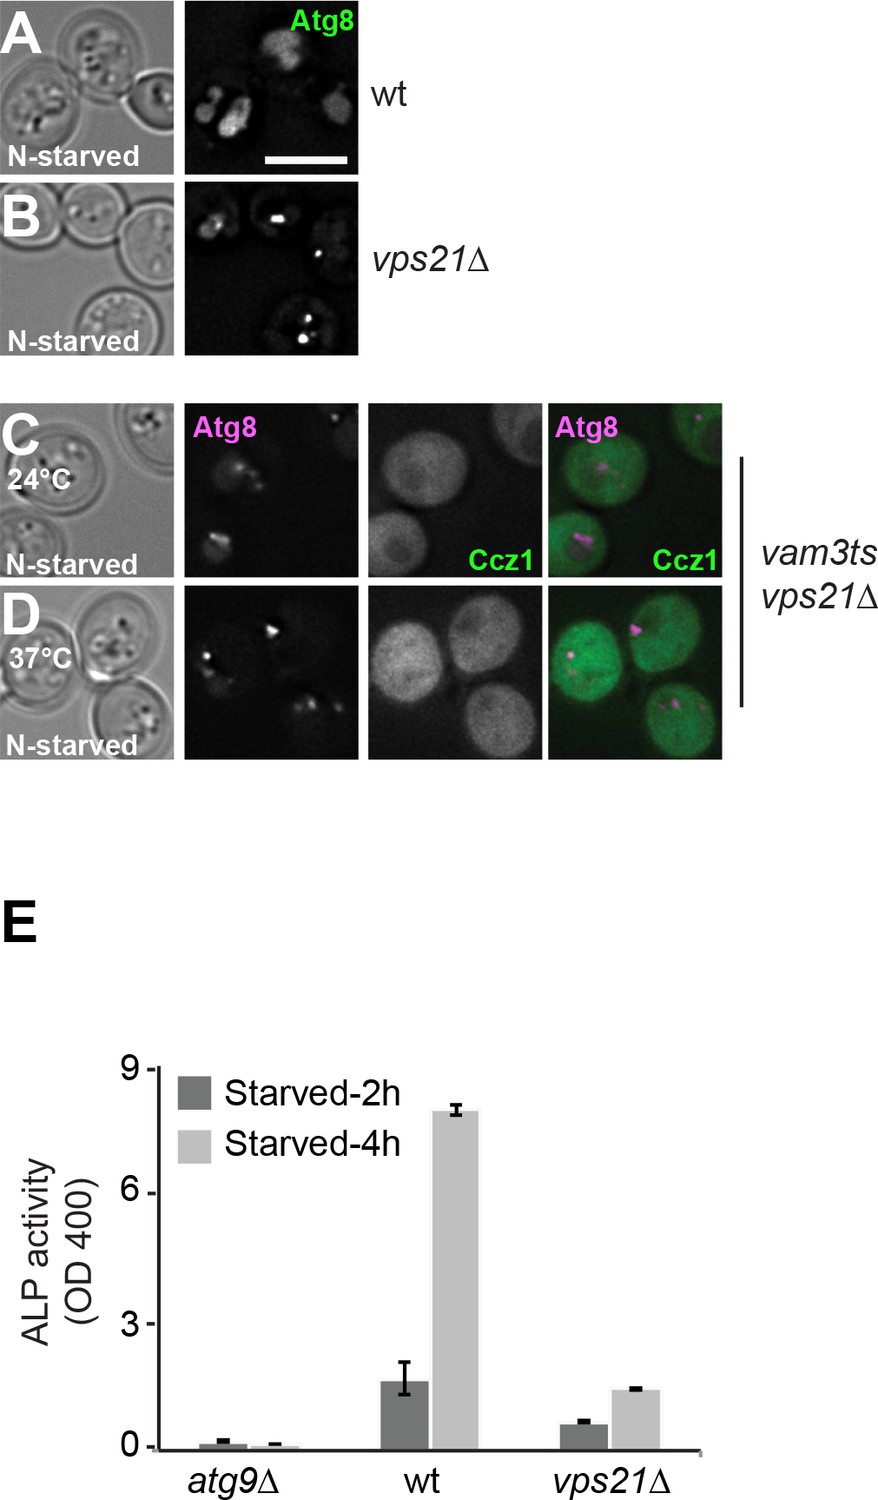
Deletion of the Rab5 like Vps21 results in autophagy defects.
(A–D) Effect of the vps21 mutant on Ccz1 localization and autophagy. Atg8 was deleted from wild-type and vps21 deletion background strains, and subsequently transformed with a CEN plasmid expressing GFP-Atg8 driven by the endogenous promoter. Cells were grown in rich medium and shift to SD-N medium for 2 hr (A–B). Cells expressing mCherry-tagged Atg8 or GFP-tagged Ccz1 were grown at 24°C in rich medium and then shifted to SD-N for 2 hr at 24°C or 37°C, and analyzed as in Figure 1—figure supplement 1 (C–D). Size bar, 5 µm. (E) Cells were grown in rich medium and then starved 2 hr or 4 hr to induce autophagy, and their autophagic activities were detected by an alkaline phosphatase (ALP) assay (Guimaraes et, al., 2015). Error bars represent standard deviation.
Figure 2 with 3 supplements
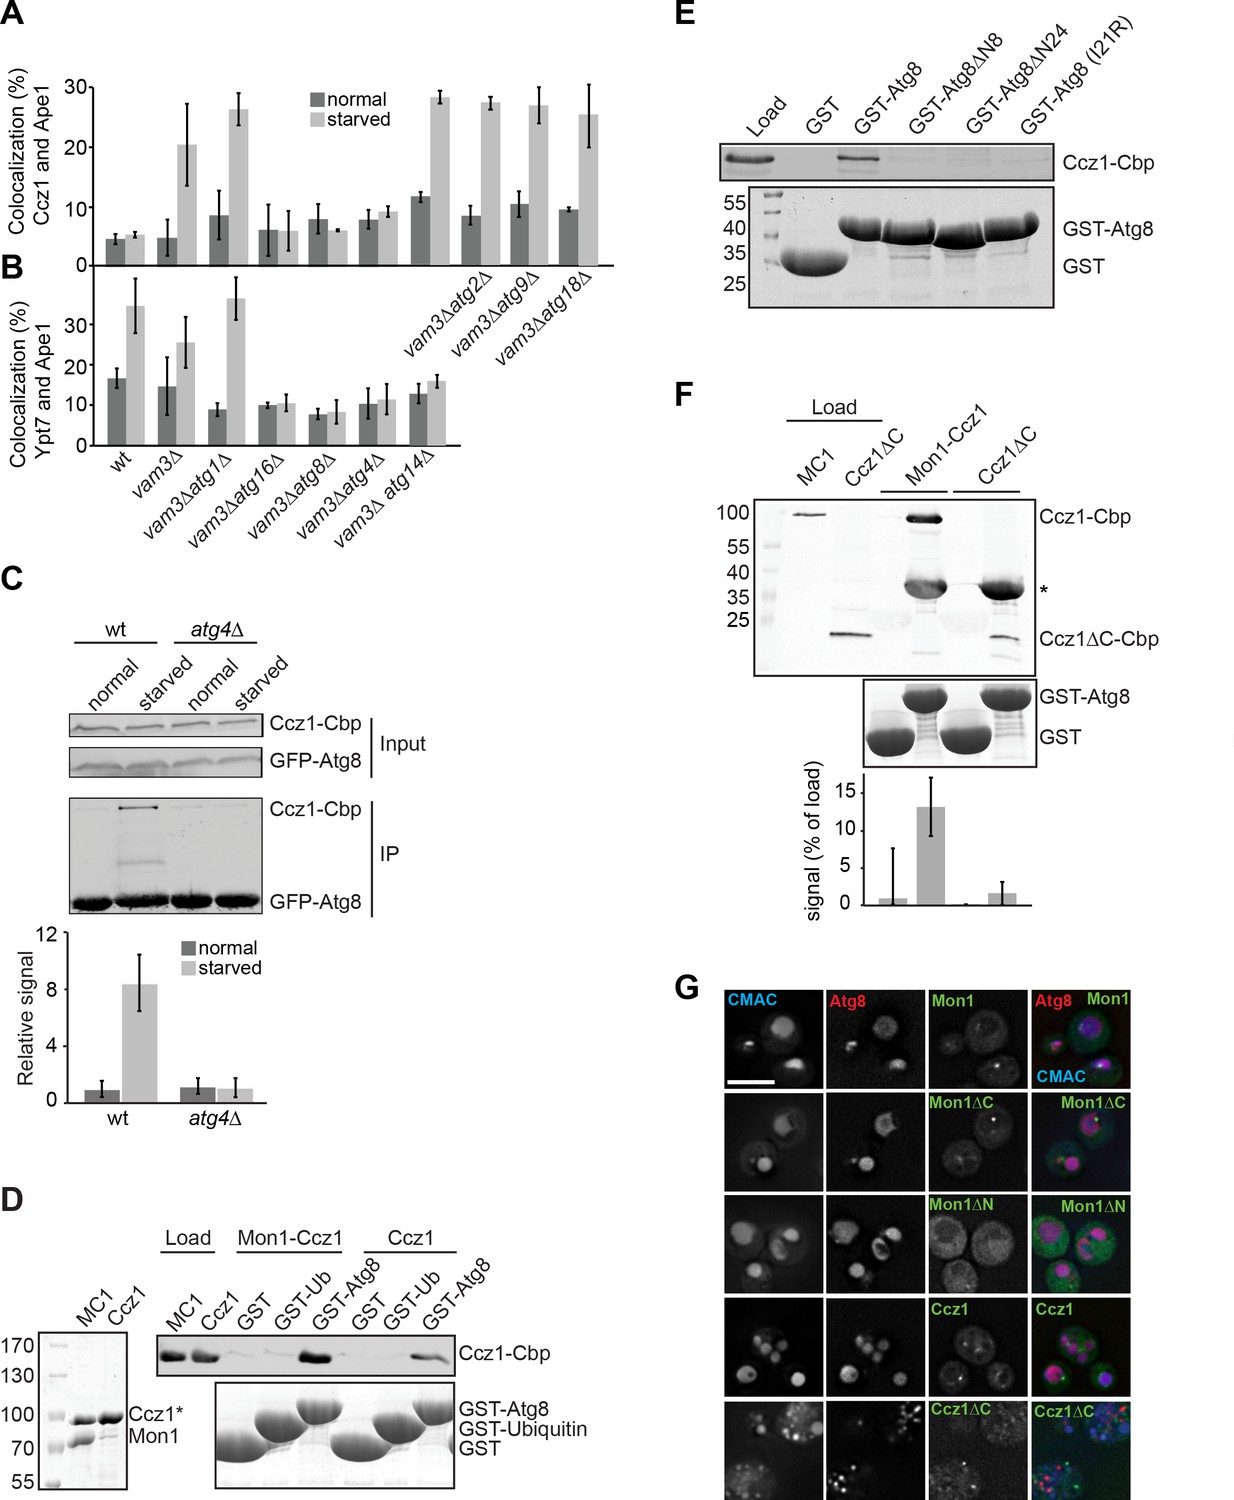
Atg8 binds to Mon1-Ccz1 via the Ccz1 C-terminal part.
(A–B) Atg8 is required for localization of Ccz1 to autophagosomes. Graphs show percentage of colocalization of Ccz1 puncta (A) or Ypt7 puncta (B) relative to Ape1 puncta in wild-type and the different mutants. Cells were grown and analyzed as in Figure 1. Ape1 dots (n ≥ 50), Ccz1 dots (n ≥ 300), and Ypt7 dots (n ≥ 200) were quantified by Image J. Error bars represent SD. (C–E) Interaction analysis of Atg8 with Mon1-Ccz1. (C) Immunoprecipitation of TAP-tagged Ccz1 from wild-type and atg4∆ strain co-expressing GFP-Atg8. The strain was grown in YPD or in SD-N for 3 hr before preparing cell extracts. GFP-Atg8 was subsequently immunoprecipitated using GFP-trap beads. Finally, immunoprecipitates were analyzed by Western blotting against GFP and CbP-tag. The graph is the quantification of three independent experiments, where the interaction observed in unstarved cells from wild-type is set as 1. Error bars are SD. (D) Interaction of Atg8 with Mon1-Ccz1 or purified Ccz1. TAP-tagged proteins (shown as purified proteins on Coomassie stained gels to left) were incubated with GST, GST-ubiquitin, and GST-Atg8 immobilized on GSH-Sepharose. Eluted proteins were resolved by SDS-PAGE and analyzed by Western blotting against the CbP-tag (top) or by Coomassie staining (bottom). Load, 10%. (E) Interaction of Atg8 mutants with Mon1-Ccz1. Analysis was done as in (D) with the indicated GST-tagged Atg8 truncation mutants. (F) Interaction of Mon1-Ccz1∆C with Atg8. Mon1-Ccz1∆C was purified as wild-type and analyzed for interaction with GST-tagged Atg8 as before. Top, Western blot against the CbP tag. A star indicates the additional decoration of GST-Atg8 by the antibody; bottom, Coomassie staining and quantification of three experiments. (G) Requirements of Mon1 and Ccz1 domains for autophagy. The indicated truncations were analyzed in cells expressing mCherry-tagged Atg8. Vacuoles were stained with CMAC, and cells grown in SD-N medium were then analyzed by fluorescence microscopy as in Figure 1B. Size bar, 5 µm.
-
Figure 2—source data 1
Quantification of percentage of Ccz1 puncta or Ypt7 puncta co-localizing with Ape1 during growth and nitrogen starvation for Figure 2A,B.
- https://doi.org/10.7554/eLife.31145.013
-
Figure 2—source data 2
Quantification of the interaction between Atg8 and Mon1-Ccz1 during growth and nitrogen starvation from wild-type and atg4∆ cells for Figure 2C.
- https://doi.org/10.7554/eLife.31145.014
-
Figure 2—source data 3
Quantification of interaction of Mon1-Ccz1∆C with Atg8 for Figure 2F.
- https://doi.org/10.7554/eLife.31145.015
-
Figure 2—source data 4
Quantification of ALP activity for nitrogen starvation 3 hr in wild-type and Atg8 I21R mutant cells.
- https://doi.org/10.7554/eLife.31145.016
Figure 2—figure supplement 1
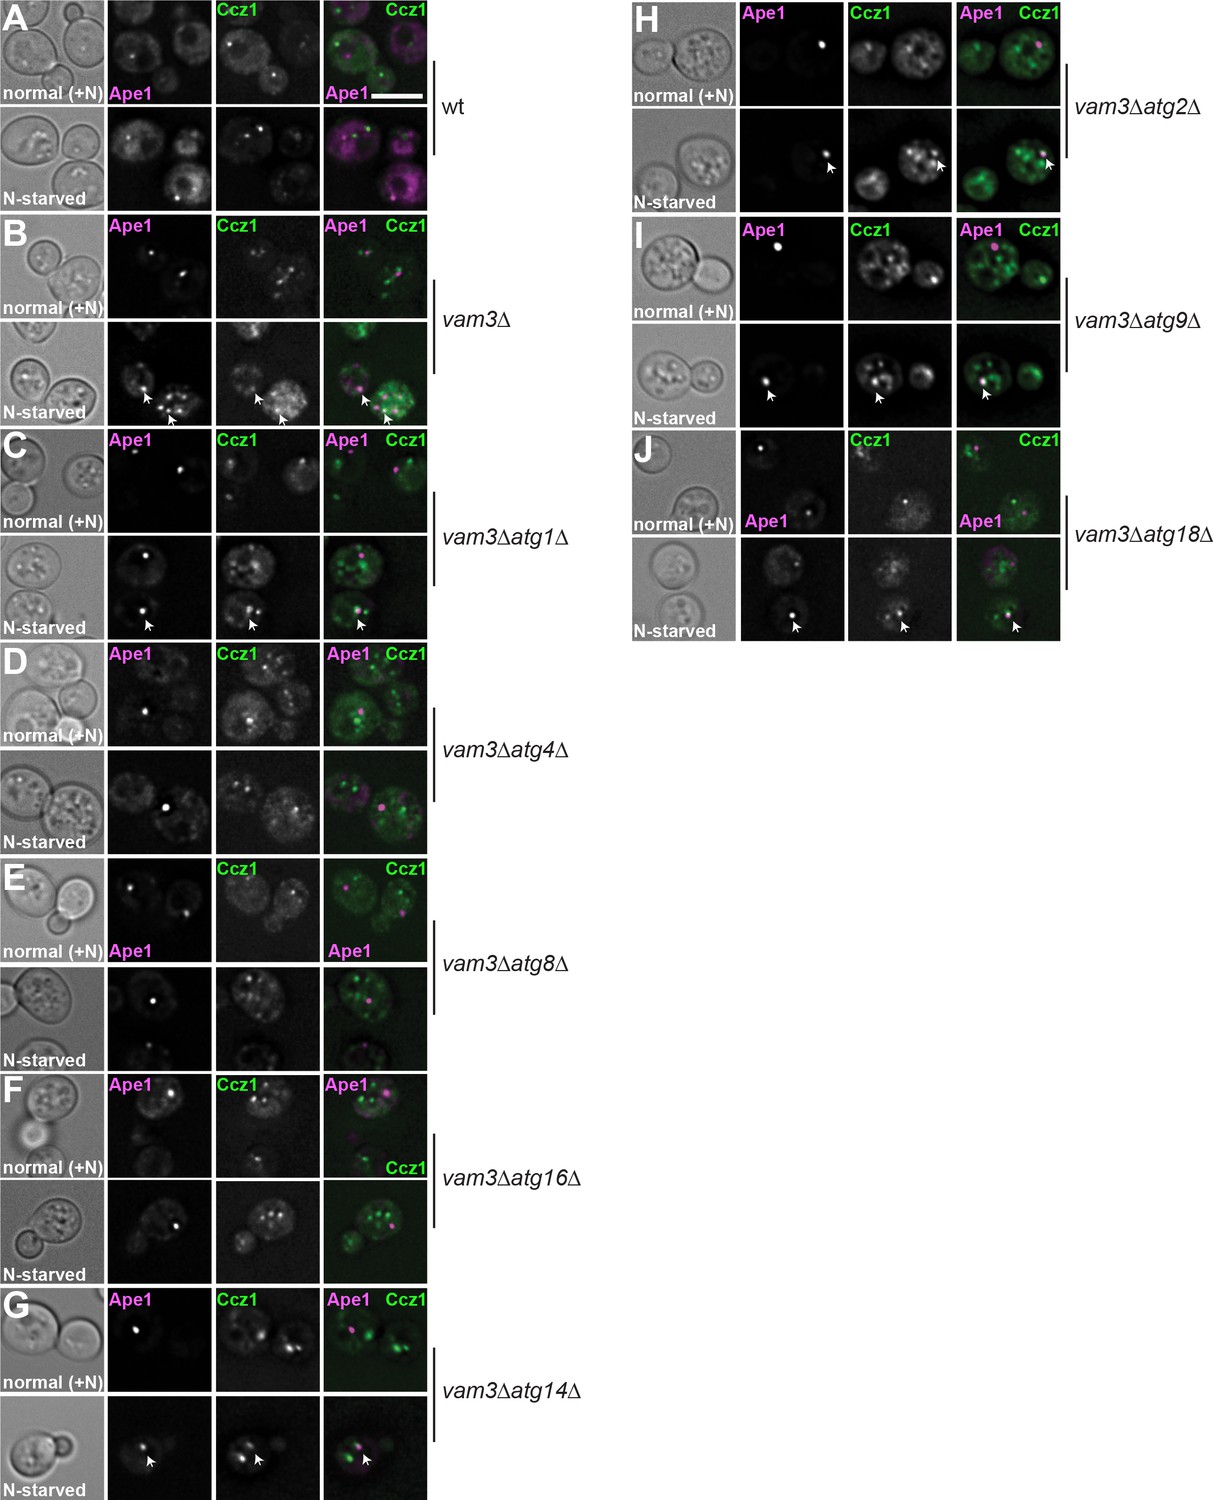
Ccz1 fails to localize to autophagosomes during starvation in mutants that lack Atg8 or the conjugation system.
Wild-type (A) or the respective mutant cells (B–J) expressing mCherry-tagged Ape1 and GFP-tagged Ccz1 were grown and analyzed as in Figure 1—figure supplement 1. Size bar, 5 µm.
Figure 2—figure supplement 2
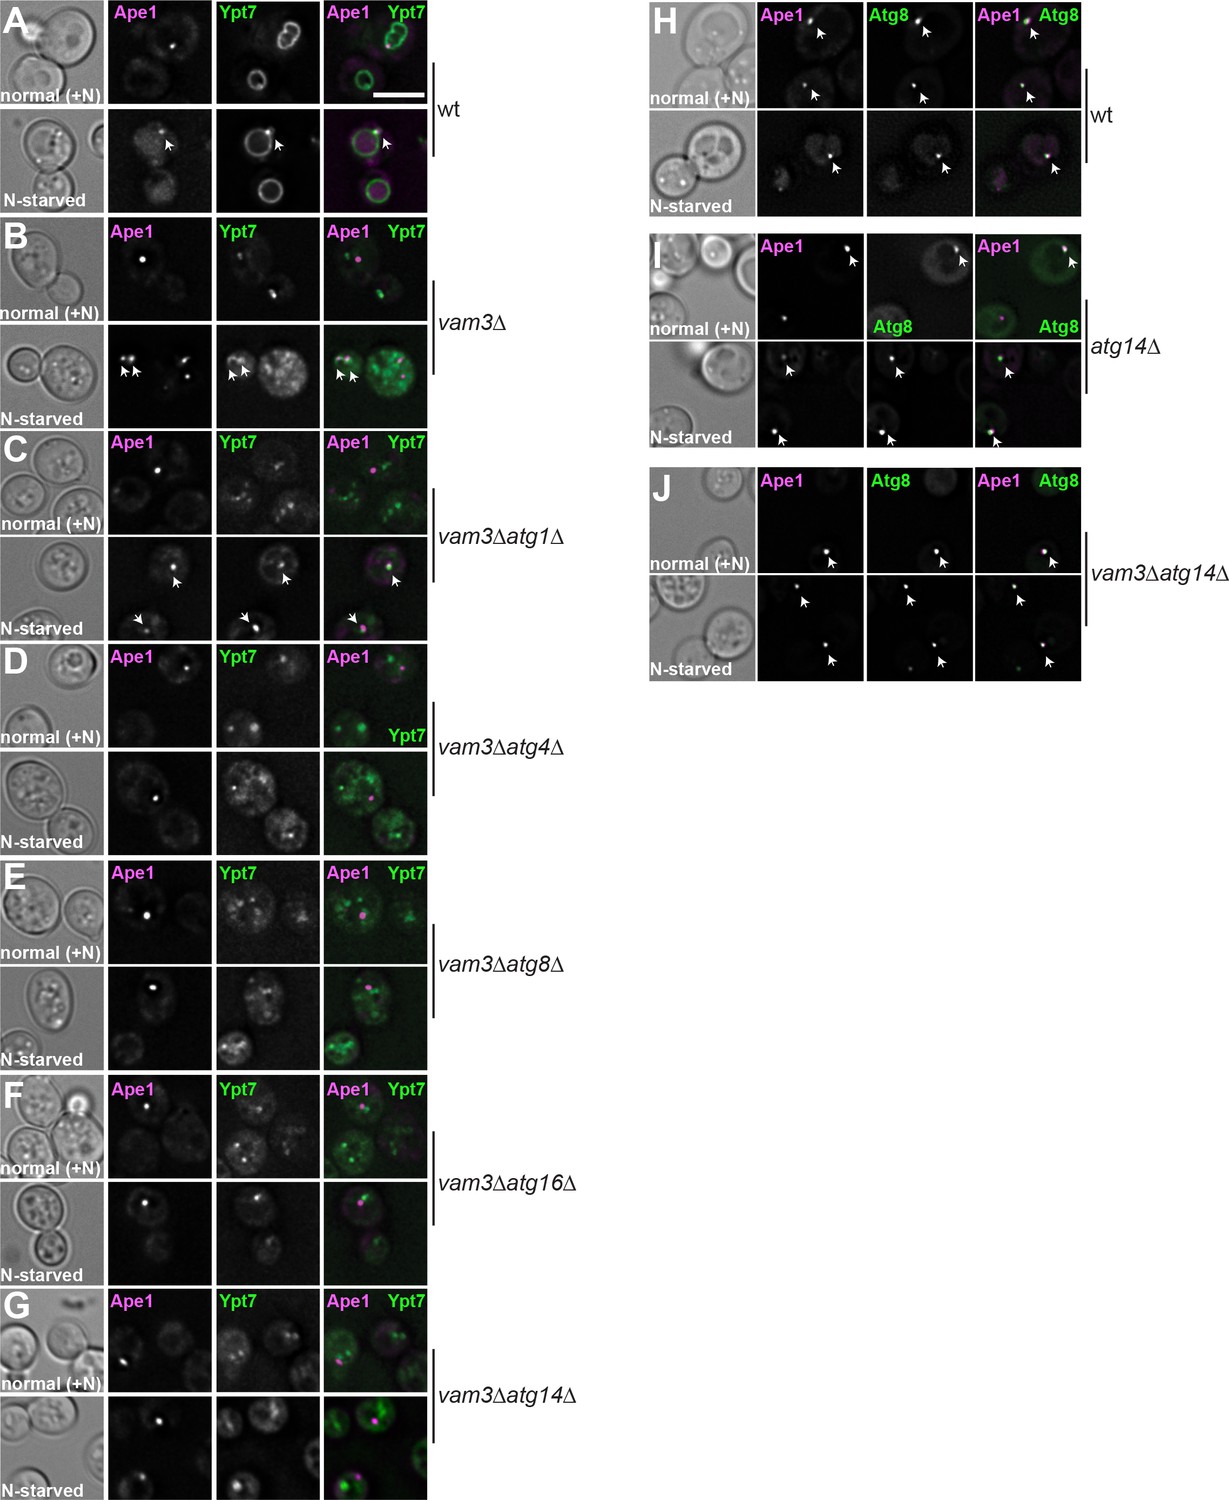
Analysis of Ypt7 and Atg8 localization relative to Ape1 in wild-type and mutant strains.
Cells expressing mCherry-tagged Ape1 or GFP-tagged Ccz1 or Atg8 were grown and analyzed as in Figure S1. Localization of Ape1 relative to Ypt7 (A–G) or to Atg8 (H–J) in the indicated strains. Size bar, 5 µm.
Figure 2—figure supplement 3
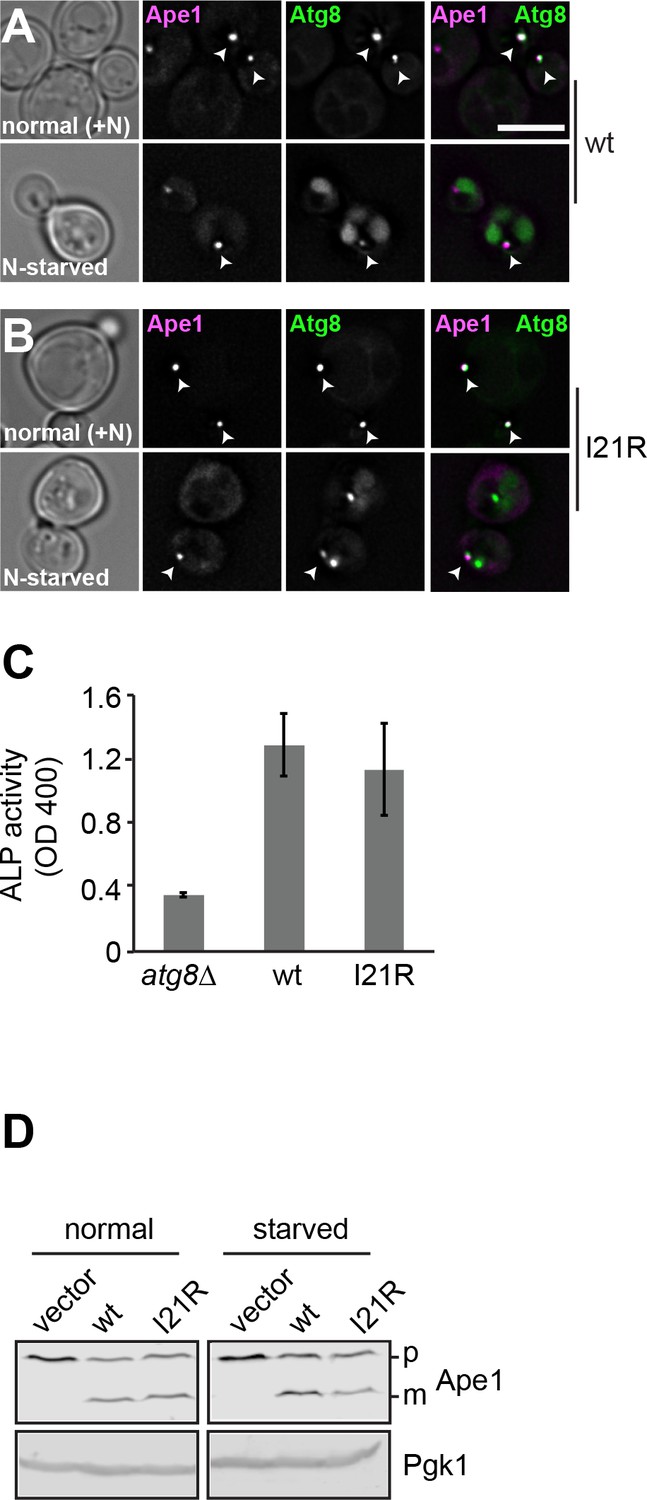
The Atg8 I21R mutant shows impaired selective autophagy.
(A–B) Analysis of the colocalization between Atg8 and Ape1 in wild-type and mutant cells. Cells expressing mCherry-tagged Ape1 or GFP-tagged Atg8 were grown and analyzed as in Figure 1—figure supplement 1. (C) ALP activity of wild-type and mutant cells. Cells expressing the truncated and thus cytosolic Pho8∆60 construct were grown in rich medium and then starved 3 hr to induce autophagy, and their autophagic activities were detected by monitoring ALP assay. Error bars represent standard deviation. (D) Ape1 transport in wild-type and mutant cells. Cells were grown in rich medium and then starved 1 hr to induce autophagy.
Figure 3

Identification of the LIR motifs in Ccz1 required for function.
(A) Schematic representation of potential LIR motifs of the C-terminal part of Ccz1. Blue and red indicates all LIR motifs analyzed, red the motifs that also impair Ccz1 localization. (B) Alignments of the potential Ccz1 LIR motifs Mm: Mus musculus, Hs: Homo sapiens, Cg: Candida glabrata, Lt: Lachancea thermotolerans, Nd: Naumovozyma dairenensis, Ka: Kazachstania Africana. (C–D) Effect of LIR mutants on localization, autophagy and vacuole morphology. Analysis was done as in Figure 1B–H. CMAC staining was done for 15 min before analysis. Cells were grown either at 30°C or 37°C during growth or starvation. Size bar, 5 µm. (E) Quantification of Atg8 dots per cell from images in (C–D). Error bars represent SD. (F) Analysis of autophagy over time. Cells were grown at 30°C and incubated in starvation medium for the indicated time periods, then harvested, and proteins were analyzed by SDS-PAGE and Western blotting against GFP.
-
Figure 3—source data 1
Quantification of Atg8 dots per cell from Ccz1 wild-type and LIR mutants for Figure 3E.
- https://doi.org/10.7554/eLife.31145.018
Figure 4
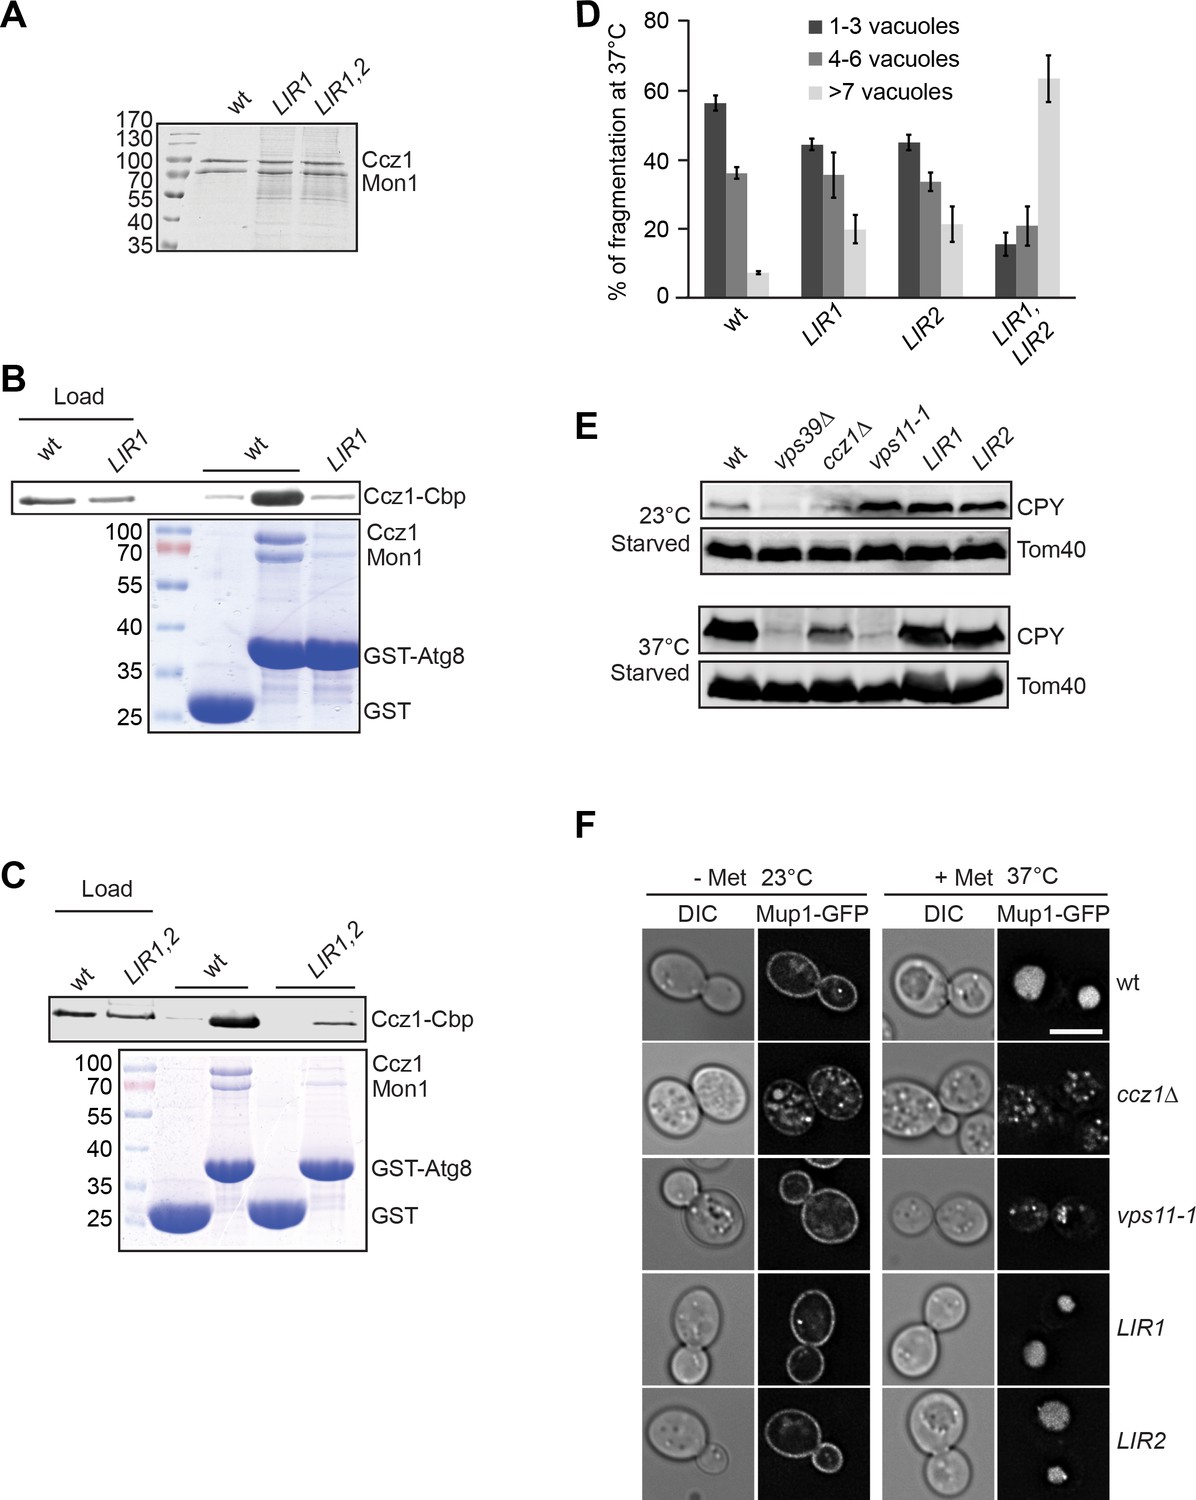
LIR motifs in Ccz1 are required for Atg8 binding, but not for the endocytic pathway.
(A–C) Interaction of Ccz1 LIR mutants with Atg8. (A) Analysis of purified Mon1-Ccz1 wild-type and mutant complex by SDS-PAGE and Coomassie staining. All of strains were grown at 30°C for purification. (B–C) Mutations in the LIR motifs impair Mon1-Ccz1 interaction with Atg8. Interaction analysis was done as in Figure 2D, and proteins were analyzed by Western blotting (top) and Coomassie staining (bottom). (D) Comparison of vacuole morphology in LIR mutant cells. Cells were grown at 30 or 37°C in starvation medium, and vacuoles were then stained with CMAC. The number of vacuoles per cell was quantified as indicated. Error bars, SD. (E) Effect of LIR mutants on sorting of vacuolar hydrolases. The indicated cells were grown in starvation medium at the indicated temperature for 2 hr. Total cell lysates were generated and proteins were resolved on SDS-PAGE. Western blots were decorated against CPY and Tom40 (as loading control). (F) Endocytosis analysis in LIR mutants. The indicated cells expressing Mup1-GFP were grown in the absence (-Met) of methionine in minimal medium to an OD600 of 1.0 at the 23°C. Where indicated, methionine was added after the temperature shift to 37°C, and cells were analyzed by fluorescence microscopy after 1 hr. Size bar, 5 µm.
-
Figure 4—source data 1
Quantification of vacuole morphology in LIR mutant cells for Figure 4D.
- https://doi.org/10.7554/eLife.31145.020
Figure 5
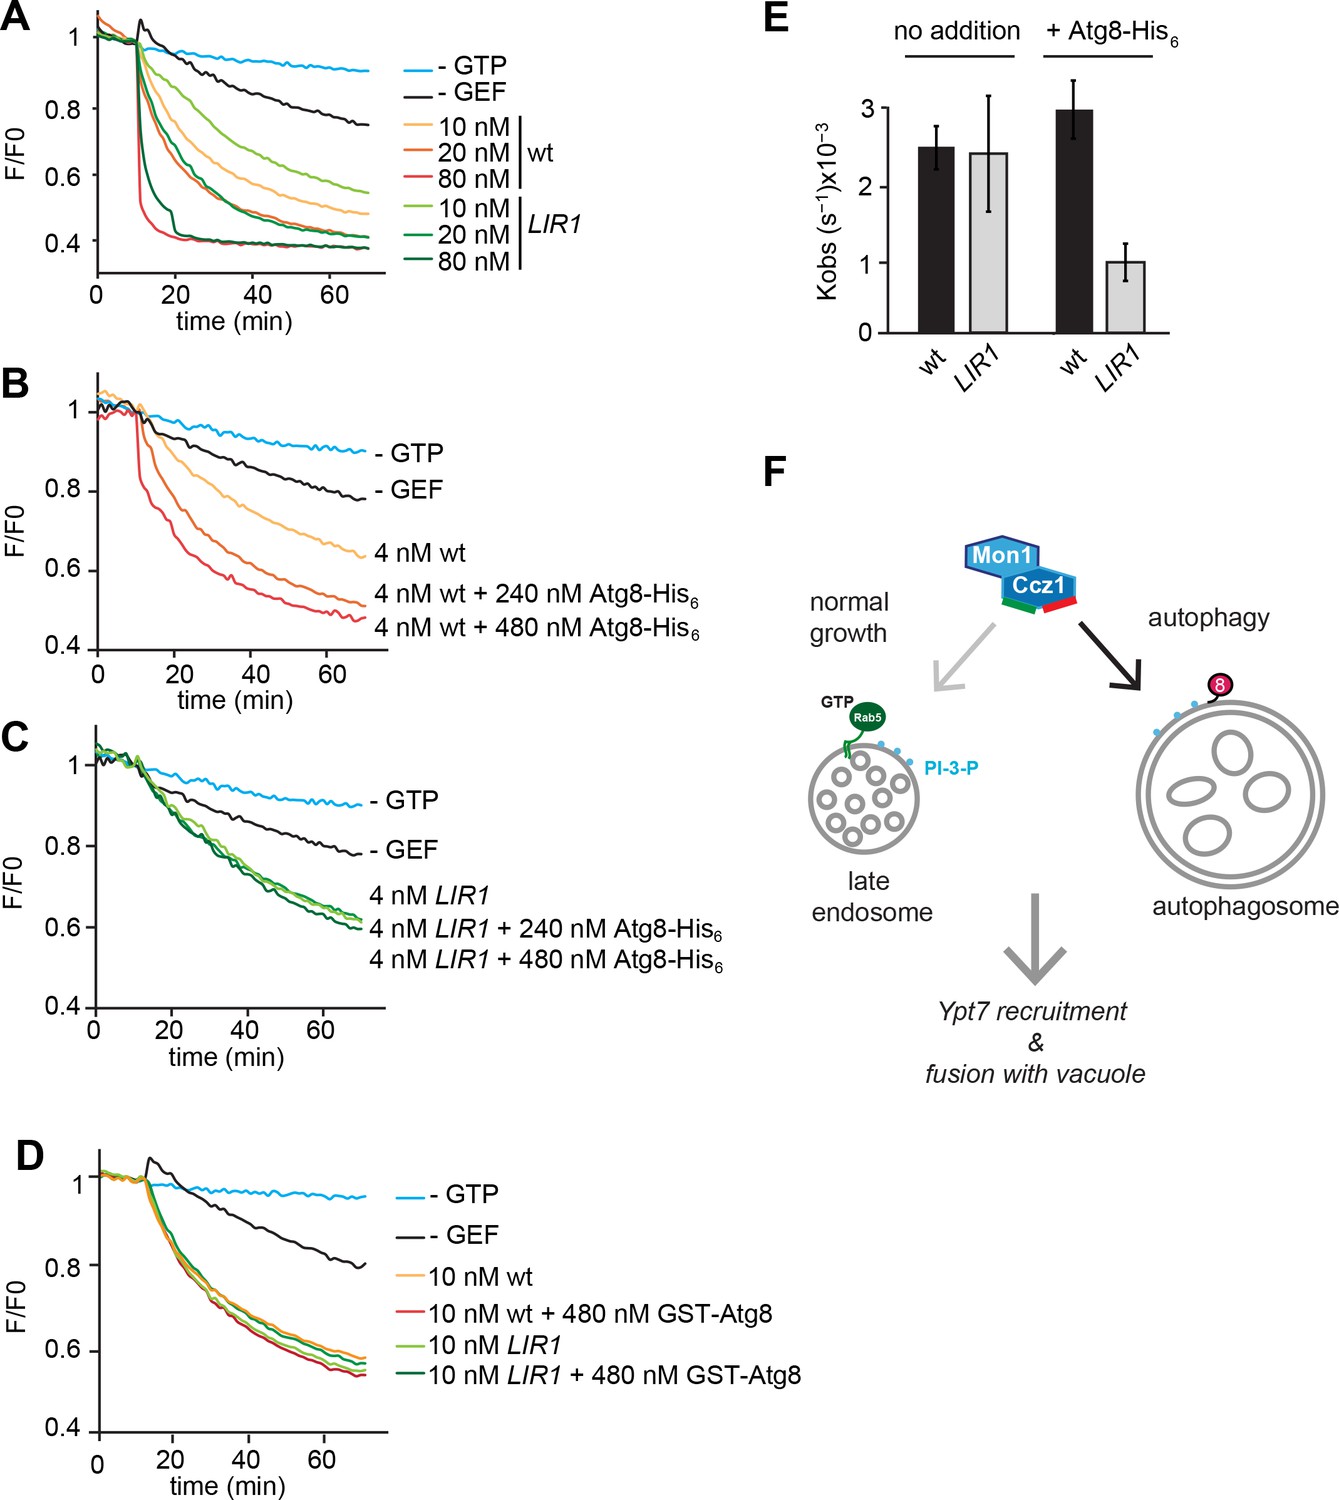
Functional reconstitution of Atg8-dependent GEF activity of Mon1-Ccz1.
(A) GEF activity of wild-type and mutant Mon1-Ccz1 complex. GEF activity was monitored by displacement of MANT-GDP from Ypt7 using a microplate reader (see Materials and methods). Assay was carried out with liposomes capable of binding His-tagged Ypt7 (Cabrera et al., 2014). Without GTP, blue line; without GEF, black line; wt refers to different concentrations of Mon1-Ccz1, LIR1 to the Mon1-Ccz1 mutant complex. (B–D) Effect of membrane-bound Atg8 or soluble Atg8 on GEF activity. Analysis was carried out as in (A) with reduced Mon-Ccz1 concentrations and upon addition of His-tagged Atg8 at the indicated concentrations. (E) Quantification of the rate constants of wild-type and mutant Mon1-Ccz1 complex in the presence and absence of Atg8 for Figure 5B–C. Rate constants were calculated based on the initial slope of the GEF curve (n = 3) (Kiontke et al., 2017; Langemeyer et al., 2014). Error bars, SD. (F) Model of Mon1-Ccz1 recruitment to the autophagosome and endosomes. For details see text.
-
Figure 5—source data 1
GEF activity of wild-type and mutant Mon1-Ccz1 complex for Figure 5A.
- https://doi.org/10.7554/eLife.31145.022
-
Figure 5—source data 2
Effect of membrane-bound Atg8 on GEF activity for Figure 5B,C.
- https://doi.org/10.7554/eLife.31145.023
-
Figure 5—source data 3
Effect of soluble Atg8 on GEF activity for Figure 5D.
- https://doi.org/10.7554/eLife.31145.024
-
Figure 5—source data 4
Quantification of the rate constants of wild-type and mutant Mon1-Ccz1 complex in the presence and absence of Atg8 for Figure 5E.
- https://doi.org/10.7554/eLife.31145.025
Author response image 1

Interaction of Atg8 mutants with Mon1-Ccz1.
Purification of TAP-tagged Mon1-Ccz1 was
Author response image 2
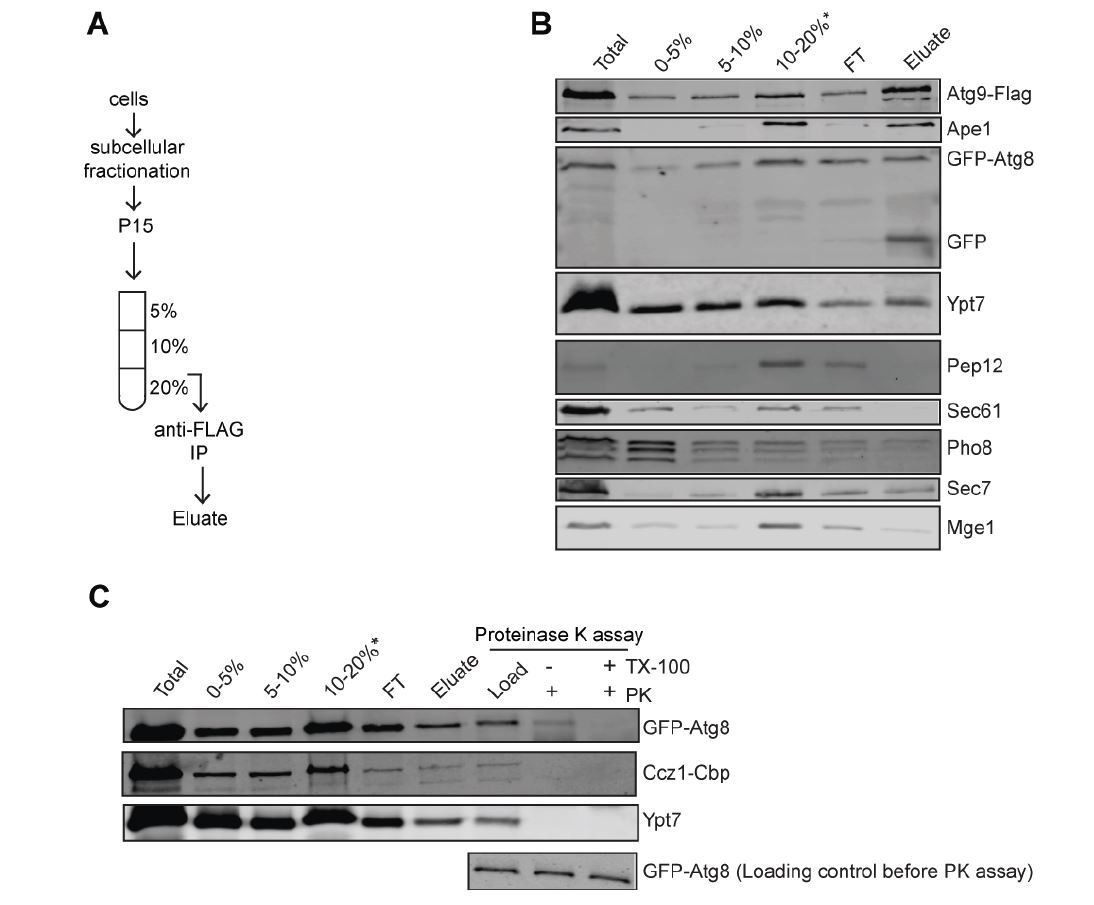
Biochemical Method for Obtaining an Autophagosome-enriched Fraction.
(A) Scheme of the purification of autophagosomes from yeast. (B) Total cell lysates from cells grown in YPD medium and starved in SD-N medium for 3 hours. The 15,000 g pellet (P15) fraction from vam3Δ (Atg9-3xFlag, GFP-Atg8) were subjected to density gradient centrifugation and incubated with flag beads to pull down autophagosomes. (C) Detection of Mon1-Ccz1 and Ypt7 on autophagosomes by proteinase K-protection assay. Autophagosomes were collected as described in part B. Equal fractions were then treated with 1 mg/ml proteinase K (PK) in the absence or presence of 1% Triton X-100 (TX).
Additional files
-
Supplementary file 1
Strains used in this study.
- https://doi.org/10.7554/eLife.31145.026
-
Supplementary file 2
Plasmids used in this study.
- https://doi.org/10.7554/eLife.31145.027
-
Transparent reporting form
- https://doi.org/10.7554/eLife.31145.028
Download links
A two-part list of links to download the article, or parts of the article, in various formats.
Downloads (link to download the article as PDF)
Open citations (links to open the citations from this article in various online reference manager services)
Cite this article (links to download the citations from this article in formats compatible with various reference manager tools)
Molecular mechanism to target the endosomal Mon1-Ccz1 GEF complex to the pre-autophagosomal structure
eLife 7:e31145.
https://doi.org/10.7554/eLife.31145


