The conformation of the histone H3 tail inhibits association of the BPTF PHD finger with the nucleosome
- Carver College of Medicine, University of Iowa, United States
- Illinois Institute of Technology, Illinois
Figures
Figure 1 with 5 supplements
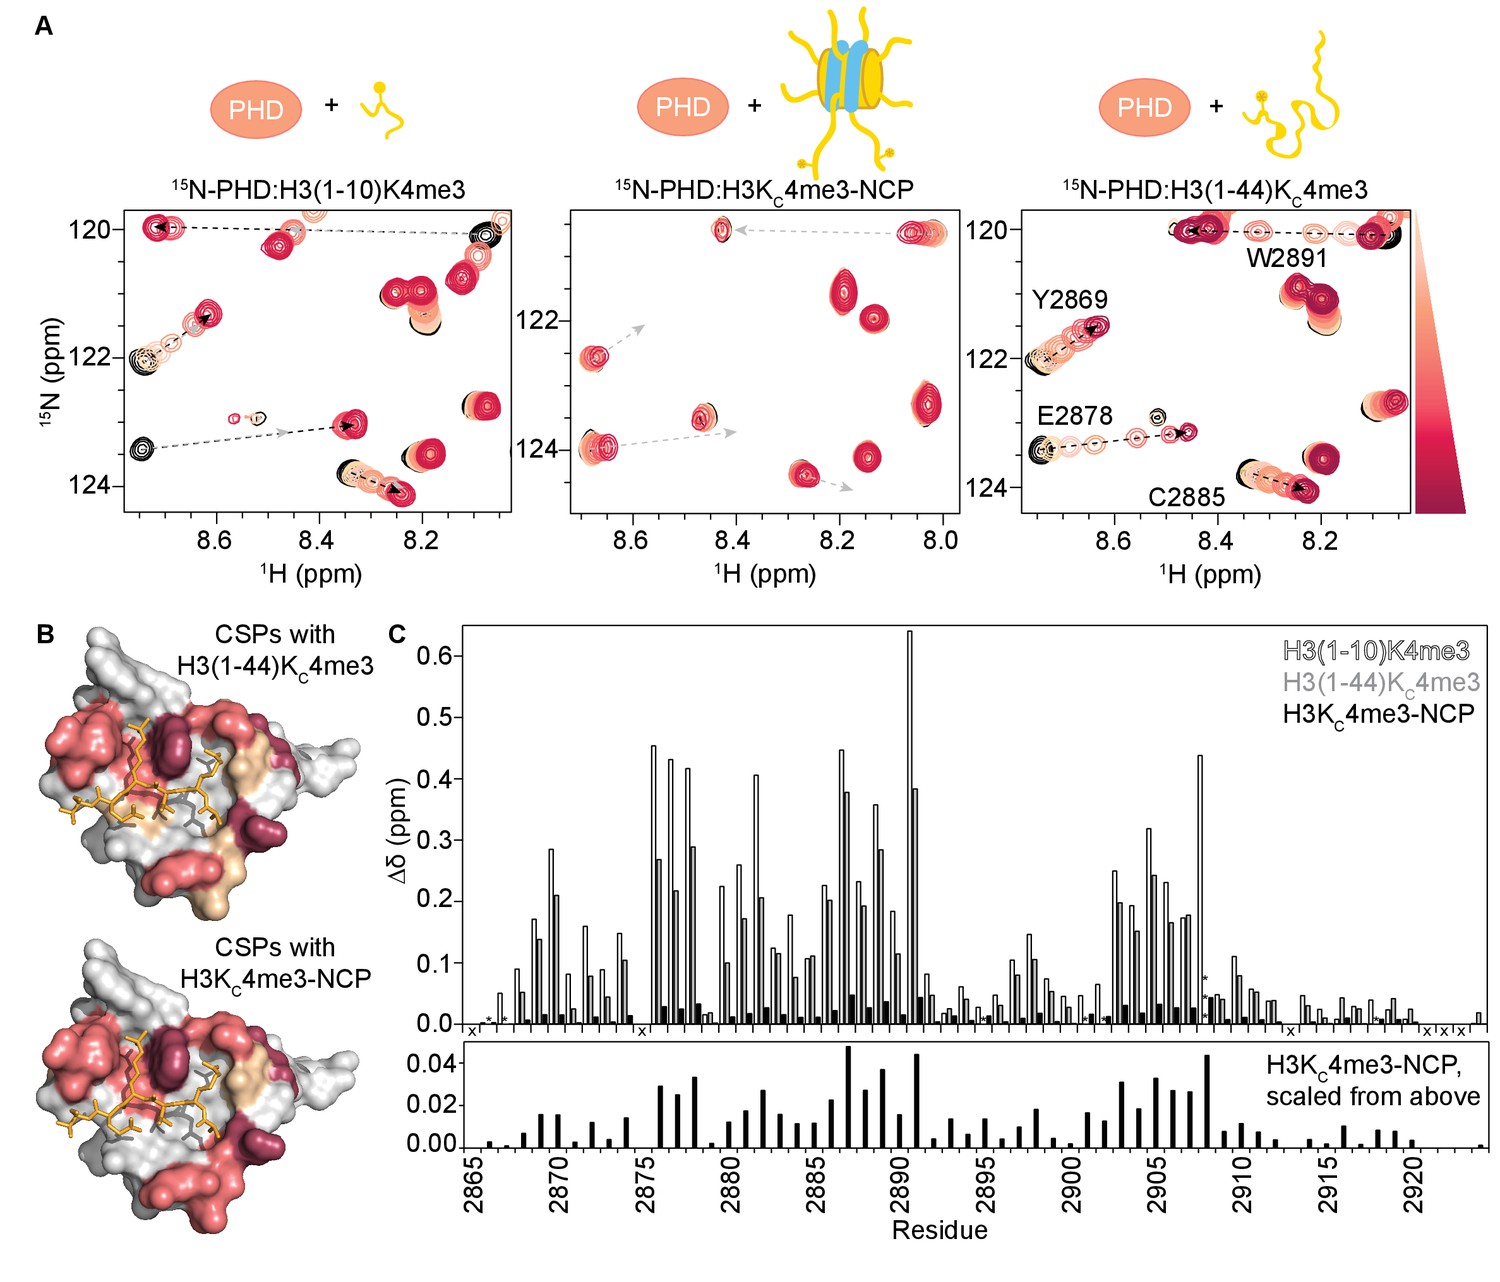
Binding of the BPTF PHD finger to H3K4me3 is inhibited in the context of the nucleosome.
(A) Overlay of a region of the 1H-15N HSQC (or TROSY-HSQC) spectra of 50 μM 15N-BPTF PHD upon titration of H3(1–10)K4me3 (left), H3KC4me3-NCP (center), or H3(1–44)KC4me3 (right). Spectra are color-coded according to ligand concentration, with apo spectra in black and shades of salmon for increasing concentrations of ligand. Spectra were collected at molar ratios (PHD:total H3KC4me3 mark) of: 1:0, 1:0.1, 1:0.25, 1:0.5, 1:1, 1:2, and 1:5 for H3(1–10)K4me3, 1:0, 1:0.2, 1:0.5, 1:1, 1:2, 1:4 and 1:6 for H3KC4me3-NCP, and 1:0, 1:0.1, 1:0.25, 1:0.5, 1:1, 1:2, 1:5 and 1:10 for H3(1–44)KC4me3. Dashed arrows track the trajectory between the apo and bound states for the two peptide titrations (in black). The H3(1–44)KC4me3 trajectories are shown (in grey) to compare titration trajectories. To account for the TROSY effect, the displayed region for the NCP titration is shifted by JNH/2 Hz. Data was collected at 37°C in 150 mM KCl. (B) Surface representation of the structure of H3K4me3-bound BPTF PHD finger (PDB ID 2F6J) with residues that are significantly perturbed upon binding to H3(1–44)KC4me3 or H3KC4me3-NCP colored in shades of salmon (average +2, +1, +1/2 standard deviations colored in raspberry, deep salmon, and wheat, respectively). The H3 tail peptide is colored pale gold and shown in stick representation. (C) CSPs (Δδ) corresponding to (A) are plotted as a function of residue for H3(1–10)K4me3 (open bars), H3KC4me3-NCP (filled black bars), or H3(1–44)KC4me3 (grey bars) for the highest ligand concentration reached in each of the titrations. As expected, the largest CSPs were observed for residues within and neighboring the aromatic cage (Y2876-E2878, F2881, Y2882, and W2891) where the K4me3 group binds, and the binding pockets for H3A1 (D2908) and H3R2 (R2887-Q2889). Note that the titration with H3KC4me3-NCP did not reach saturation. The * indicates a residue that broadens beyond detection in the fully bound state. The *** indicates a residue that is significantly perturbed along the course of the titration but broadens beyond detection in the fully bound state. An ‘X’ indicates that a residue is either not observable or not assigned. The Δδ for the H3KC4me3-NCP titration is shown re-scaled below for ease of visualization.
Figure 1—figure supplement 1
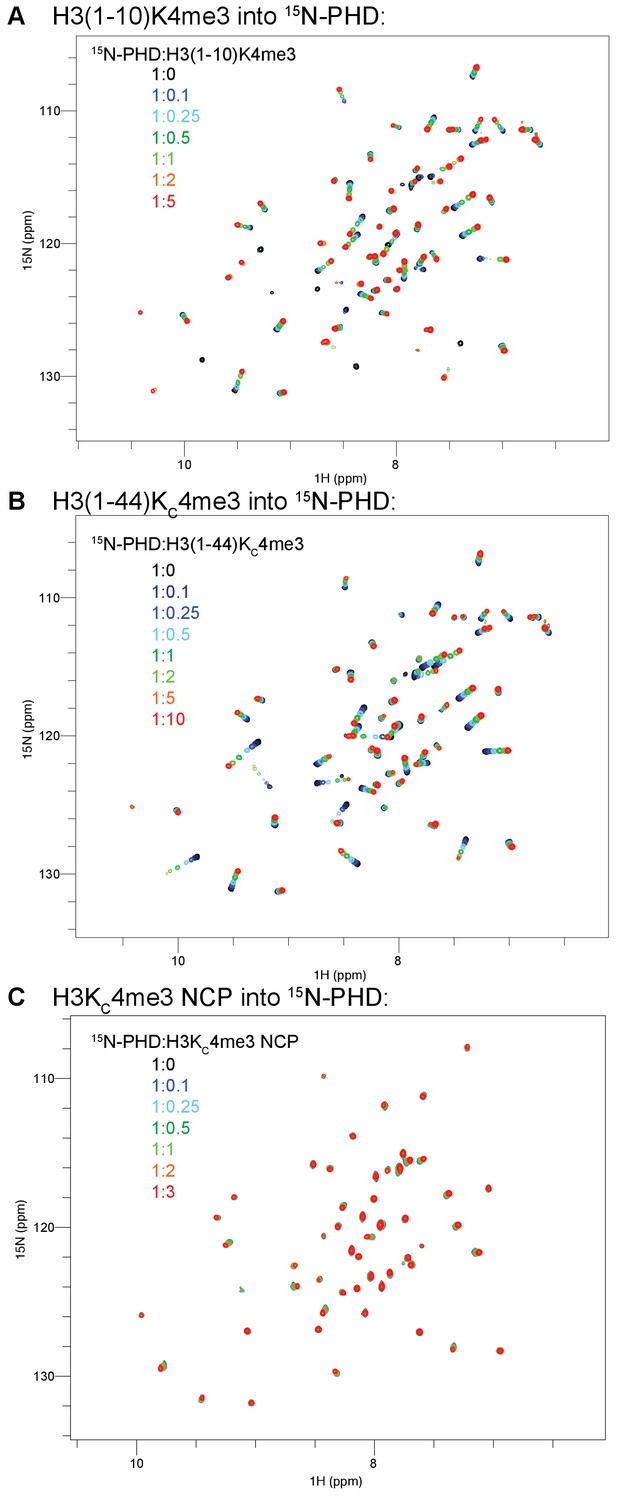
Full spectra of the H3 tail peptide and NCP titrations into 15N-BPTF PHD.
The full titrations from Figure 1 are shown for H3(1–10)K4me3 (A), H3(1–44)KC4me3 (B), and H3KC4me3-NCP (C). The coloring guide is displayed on the spectra. Note that the ligand ratios are listed with respect to NCP concentration in this figure but the concentration of the H3KC4me3 mark in the main text figures.
Figure 1—figure supplement 2
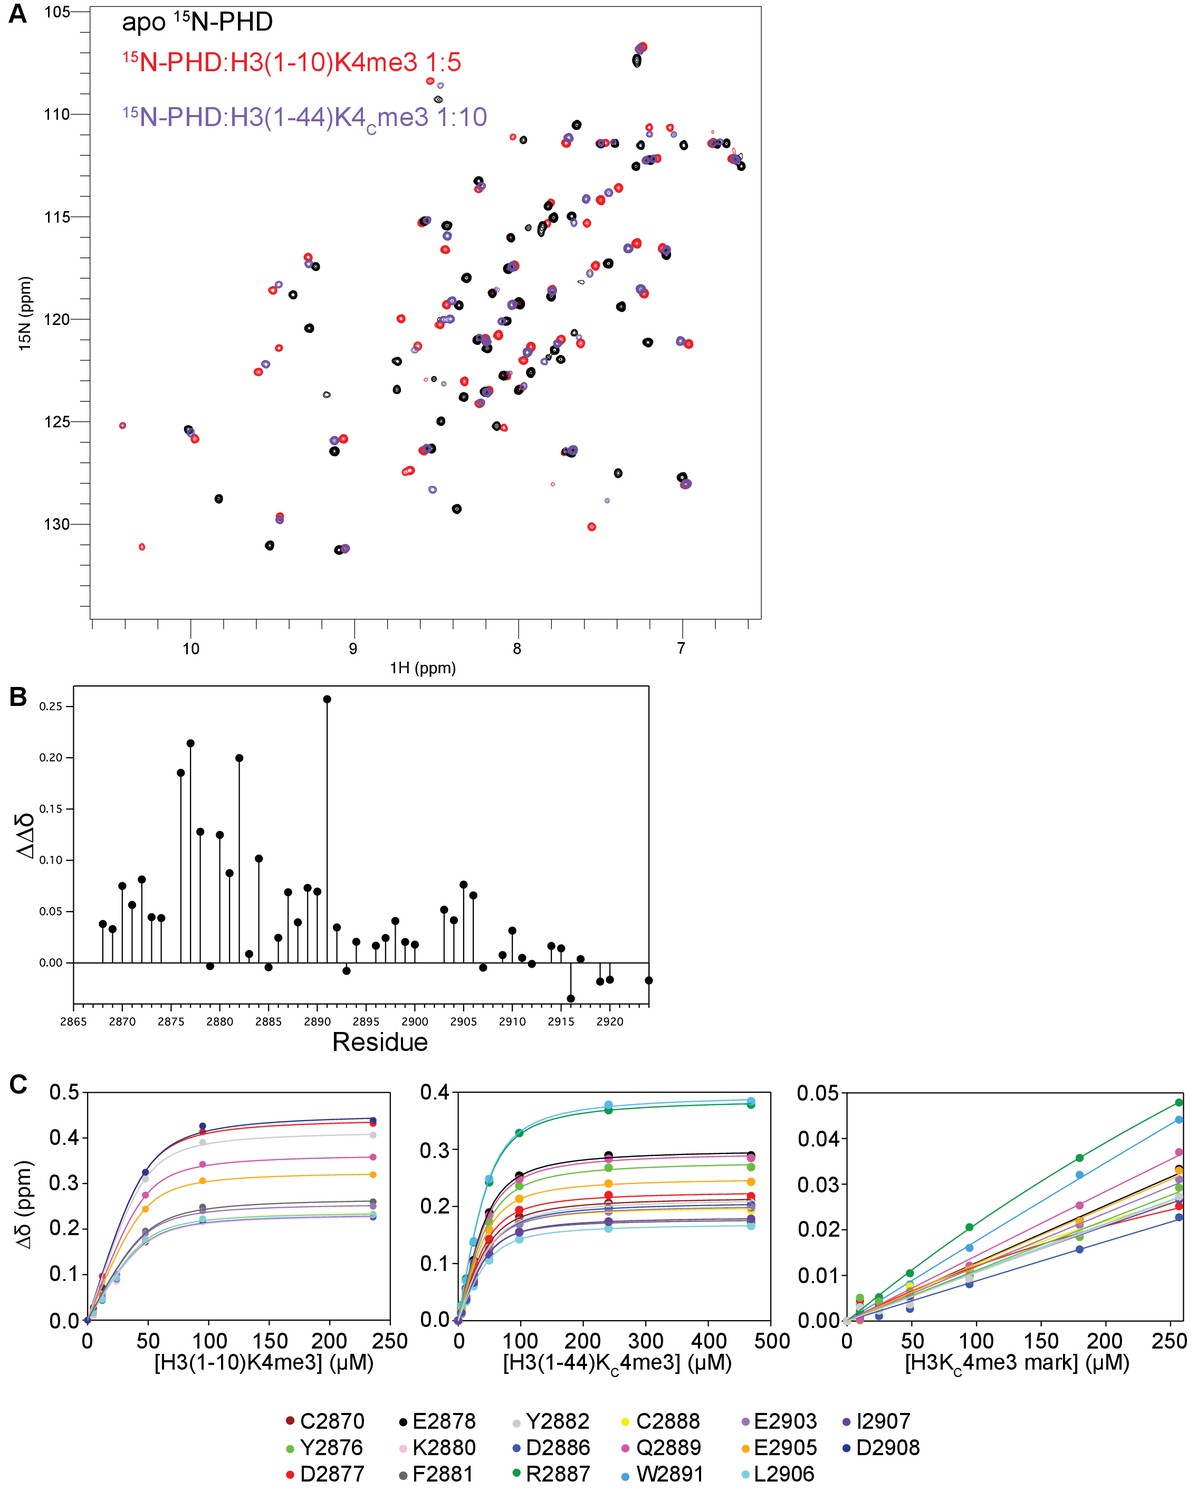
Further characterization of BPTF PHD finger binding to H3 tail peptides and NCP.
(A) Overlay of 1H-15N HSQC spectra of 15N-BPTF PHD apo (black) and saturated with H3(1–10)K4me3 (red) or H3(1–44)KC4me3 (purple). (B) Differences between CSPs (ΔΔδ) for 15N-BPTF PHD binding to H3(1–10)K4me3 or H3(1–44)KC4me3 as a function of PHD finger residue. For the majority of residues, the chemical shift difference between the apo and bound states is larger for H3(1–10)K4me3-bound than H3(1–44)KC4me3-bound PHD. (C) Representative binding curves for NMR titrations of 15N-BPTF PHD with H3(1–10)K4me3, H3(1–44)KC4me3, and H3KC4me3-NCP. For the H3(1–10)K4me3 titration, these are the significant residues with signal visible in ≥6 of the seven collected titration points. For the H3(1–44)KC4me3 and H3KC4me3-NCP titrations, these are the significant residues that were used to fit binding constants.
Figure 1—figure supplement 3
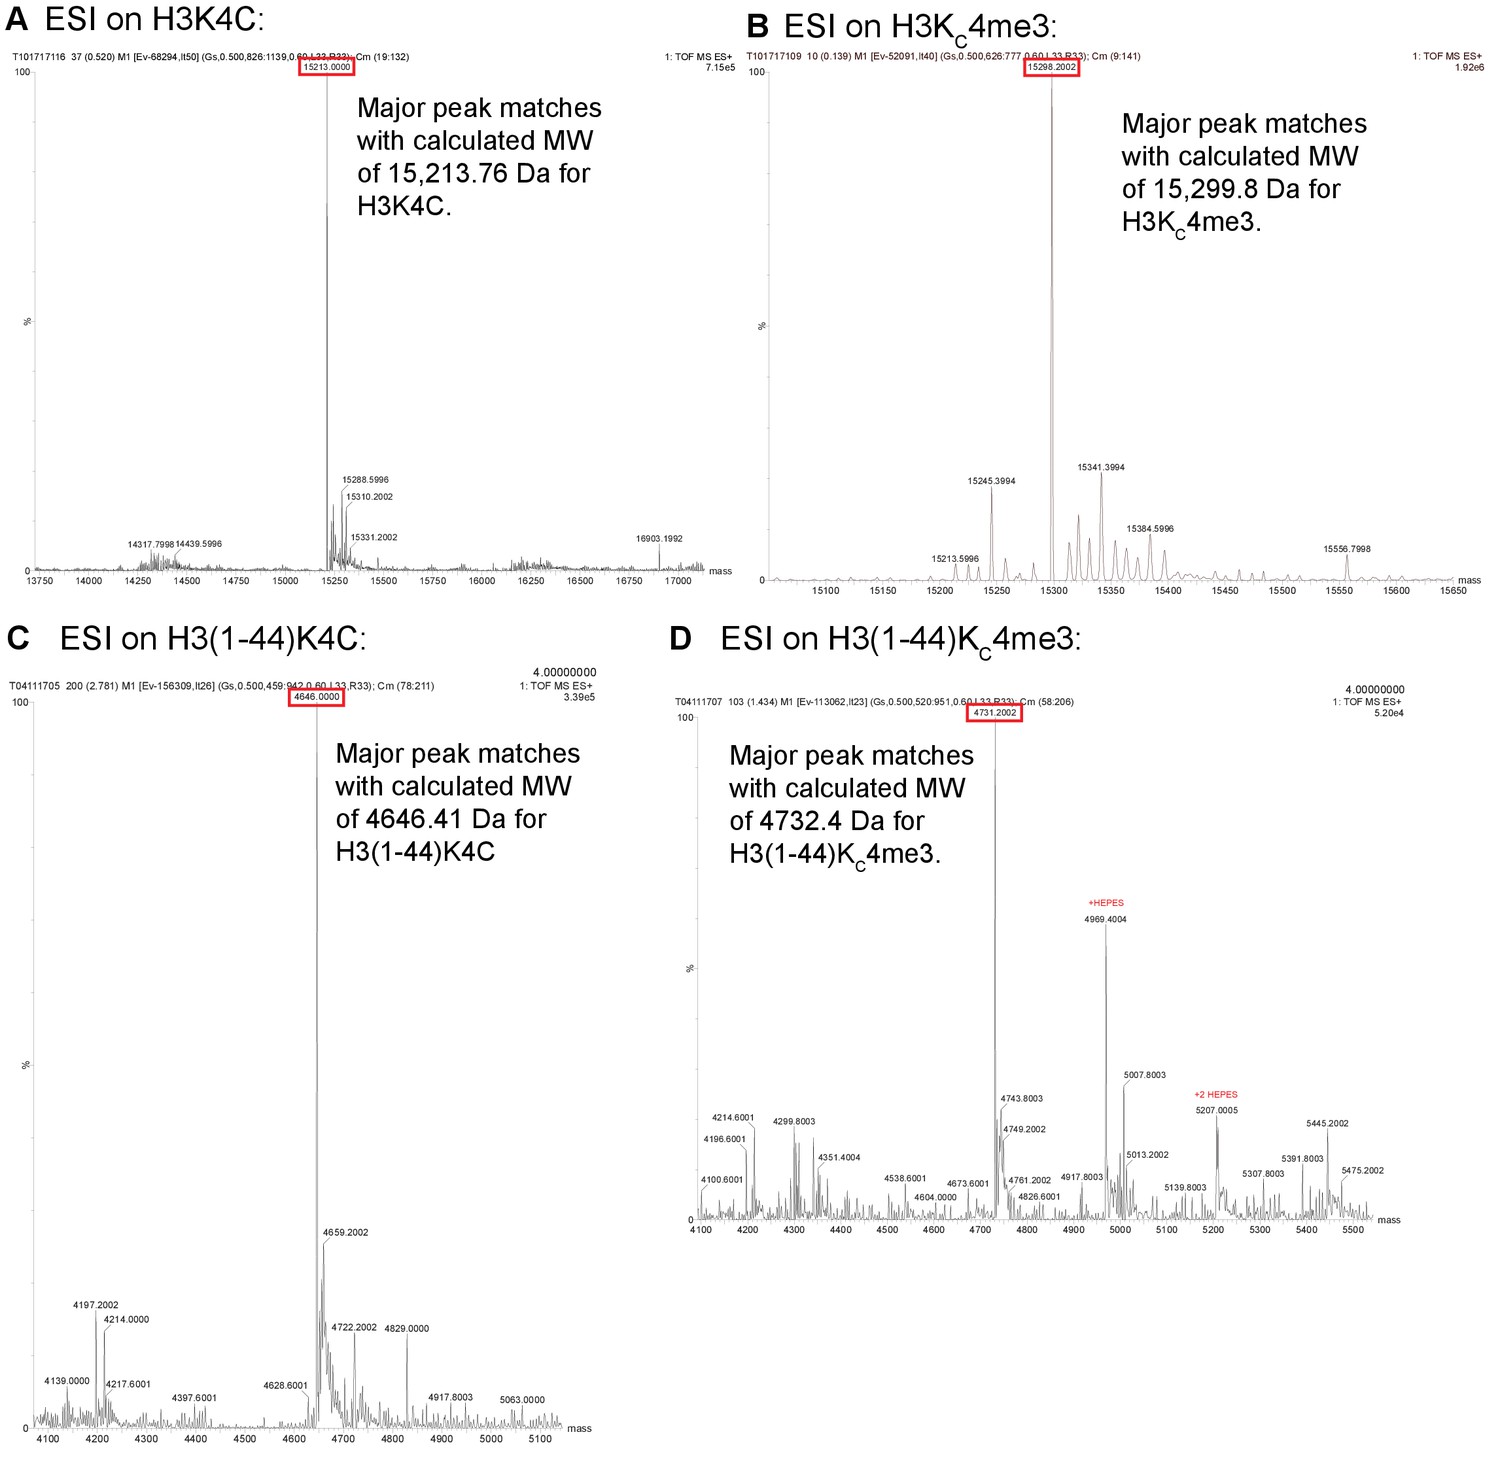
ESI data for histone constructs.
ESI mass spectrometry data is shown for unmodified and alkylated versions of histone H3 to confirm the lack of carbamylation and the proper alkylation for the MLA. The constructs are: unalkylated and alkylated full length H3K4C (A,B) and unalkylated and alkylated H3(1–44) K4C (C,D). After the alkylation reaction, the full-length histone was dialyzed into H2O + 2 mM β-ME after running over PD-10 desalting columns to remove trace salts and buffer components after the alkylation reaction. Due to the smaller size of the H3(1–44), desalting after alkylation was more difficult. The H3 peptide was de-salted using a Superdex 75 10/300 GL column, taking only fractions with minimal conductivity reading. Small amounts of HEPES buffering component remained in these samples, which shows up much stronger in the ESI mass spectrometry. The lower intensity charged states of the peptide were detected among the HEPES cluster ions, and this allowed for the determination of the alkylated H3 peptide molecular weight.
Figure 1—figure supplement 4
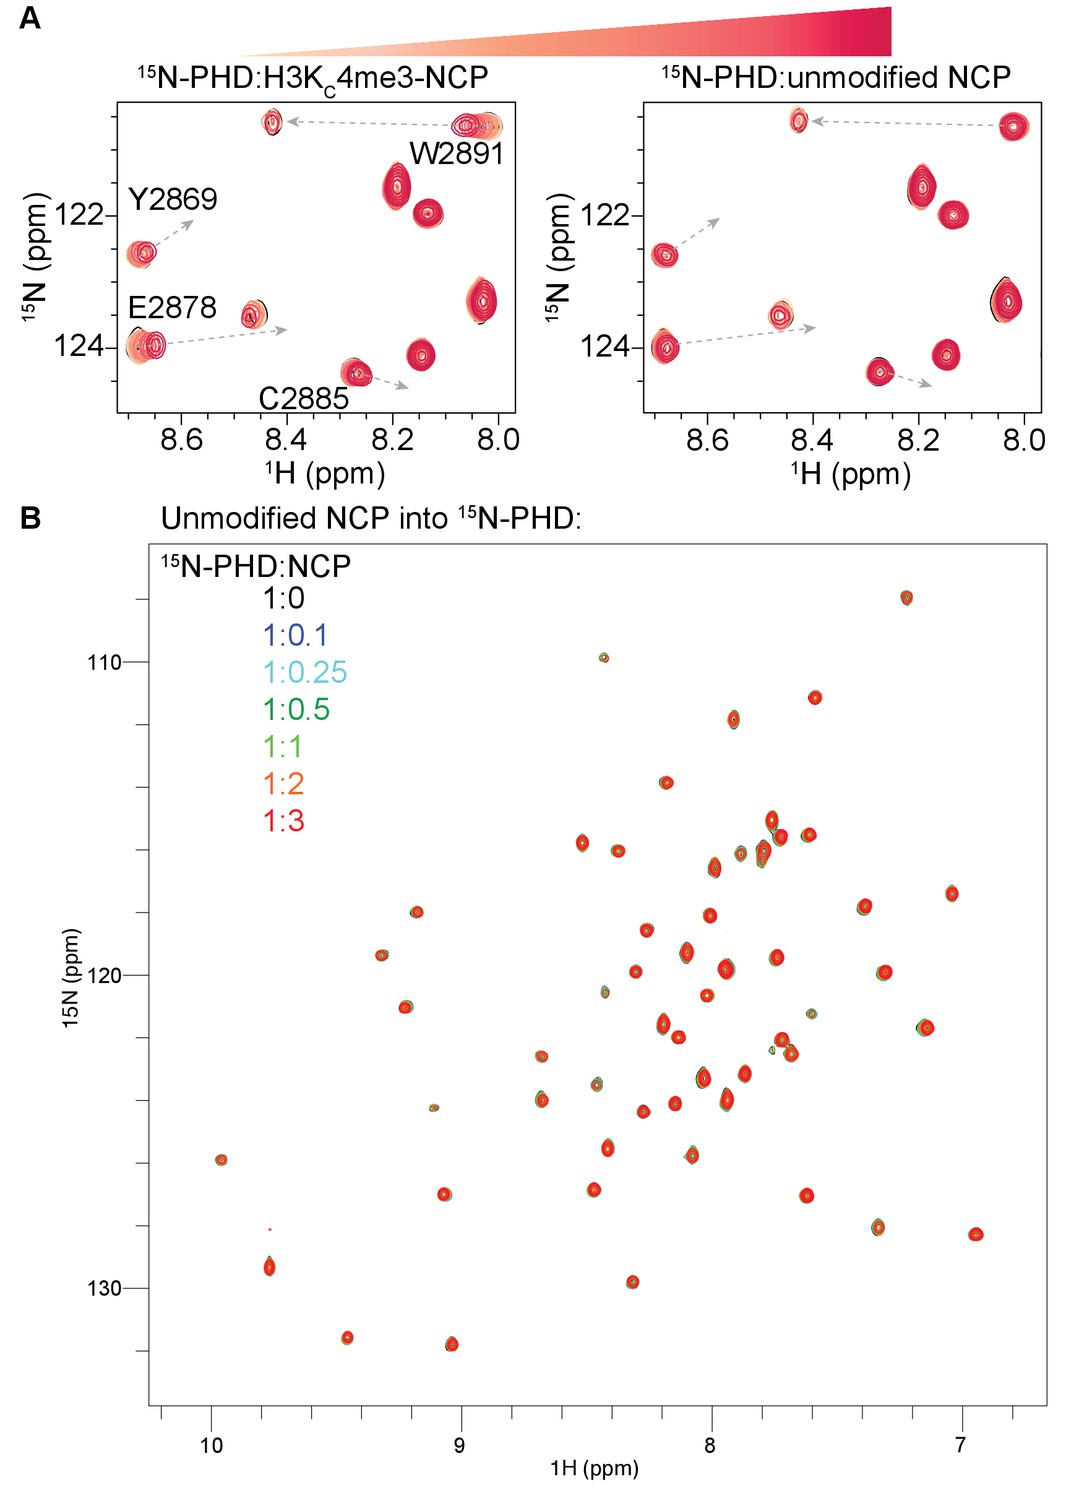
BPTF PHD finger does not bind to NCP in the absence of H3KC4me3.
(A) Overlay of a region of the 1H-15N TROSY-HSQC spectra of 50 μM 15N-BPTF PHD upon titration of H3KC4me3-NCP (left, same as in Figure 1A for direct comparison) or unmodified NCP (right). Spectra are color-coded according to ligand concentration, with apo spectra in black and shades of salmon for increasing concentrations of ligand. Spectra were collected at molar ratios (PHD:NCP) of 1:0, 1:0.1, 1:0.25, 1:0.5, 1:1, 1:2, and 1:3. The H3(1–44)KC4me3 trajectories are shown (in dashed grey arrows) to compare titration trajectories as in Figure 1A. Data was collected at 37°C in 150 mM KCl. (B). Full spectra for the titration of unmodified NCP in (A).
Figure 1—figure supplement 5
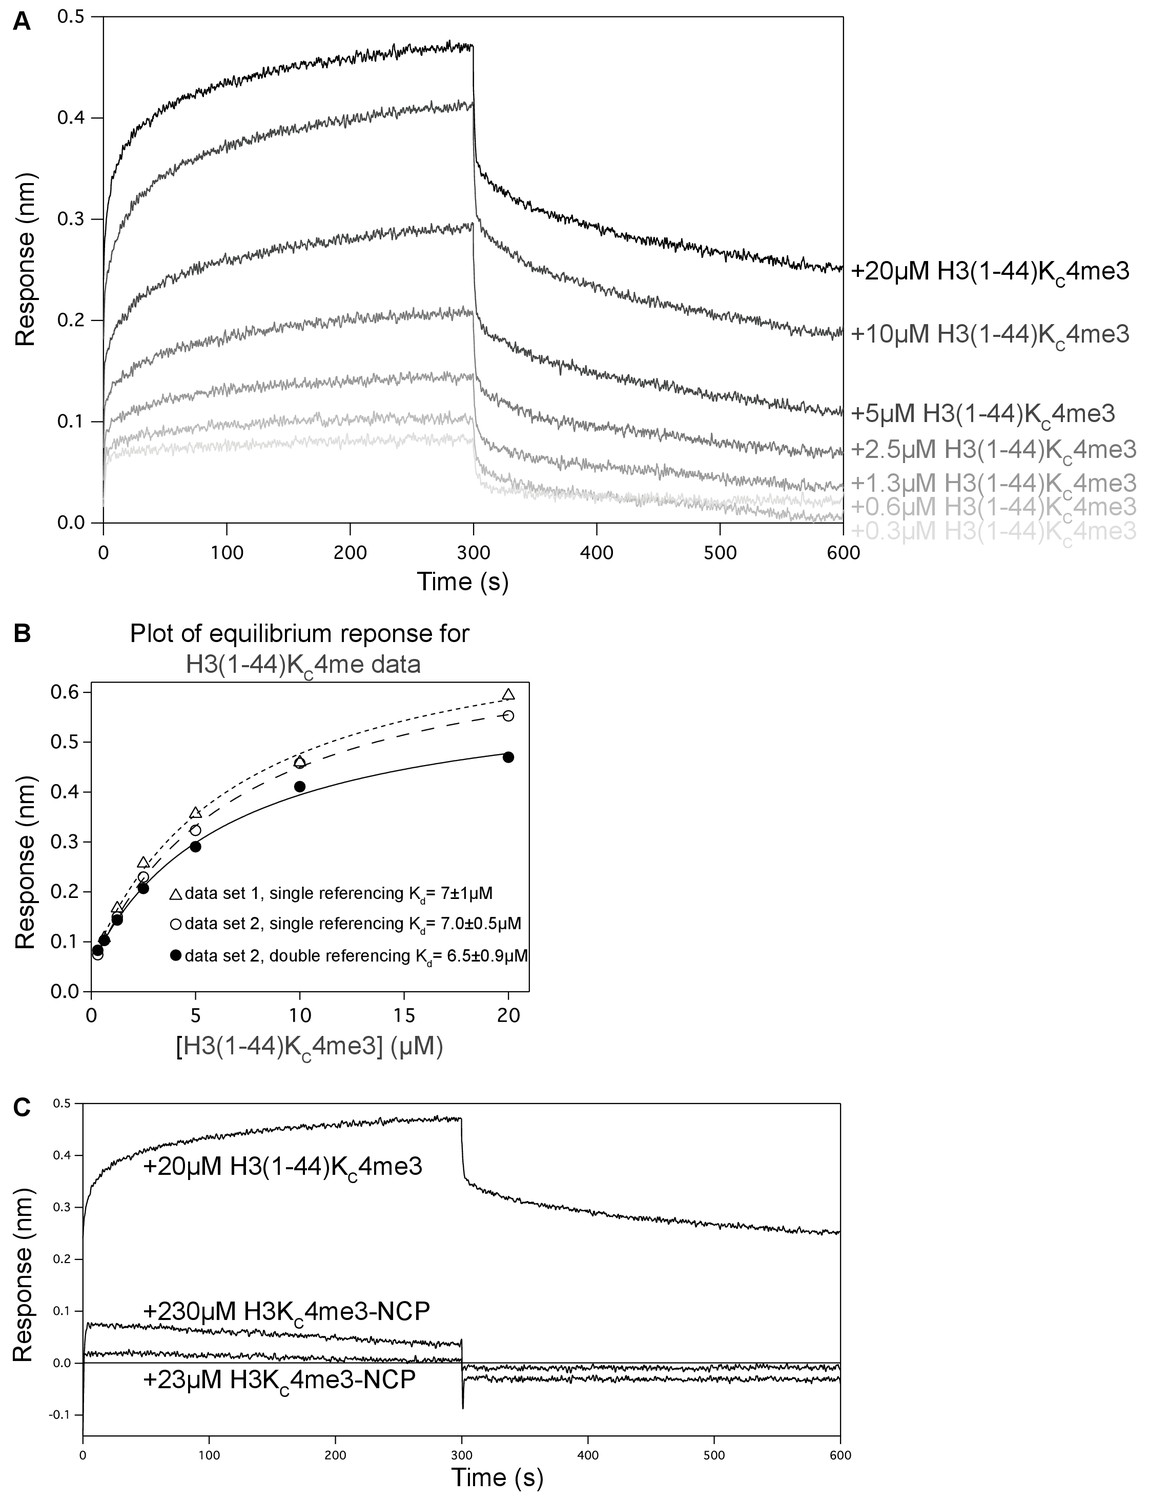
BLI data to measure the interaction between BPTF PHD finger and H3 tail in the context of peptide or NCP.
(A) Processed BLI data set for experiment conducted using avitag-PHD loaded onto streptavidin-coated sensor. The association and dissociation phases are displayed for increasing concentrations of H3(1–44)KC4me3. The data were collected with a double reference set of ‘loading’ only buffer onto the sensor (no avitag-PHD) and collecting association/dissociation data with the sample peptide wells, which was subtracted. (B) The average of 20 s (275–295 s shown in (A)) near the end of the association phase was taken to represent the equilibrium response. This equilibrium response was plotted as a function of peptide concentration and fit to determine an estimated equilibrium Kd value, displayed with the error in the fit. (C) A data set was collected similar to in (A) but using H3KC4me3-NCP as the ligand (or ‘analyte’ in BLI terminology). These data were also collected with a double reference set of ‘loading’ buffer-only, which was subtracted. The NCP solution causes a change in response signal when sensors loaded with either avitag-PHD or buffer-only are dipped into the NCP sample wells, which becomes very large with the 230 μM NCP. This was interpreted as a change in the optical properties of the solution, which was likely caused by the viscosity of NCP samples. The double-referenced BLI data collected with avitag-PHD-loaded sensors associating with 20 μM H3(1–44)KC4me3 is overlaid. At ~20 μM, H3(1–44)KC4me3 shows significant association and dissociation curves. At the same ‘analyte’ concentration, H3KC4me3-NCP (which should result in a significantly larger BLI response signal upon binding due to the significantly larger size) elicits minimal response. At 10-fold higher concentration of H3KC4me3-NCP, there is still minimal response signal. This is consistent with binding that is too weak to be measured via the given technique under the given conditions. All data displayed in this figure were collected at 37°C.
Figure 2 with 1 supplement
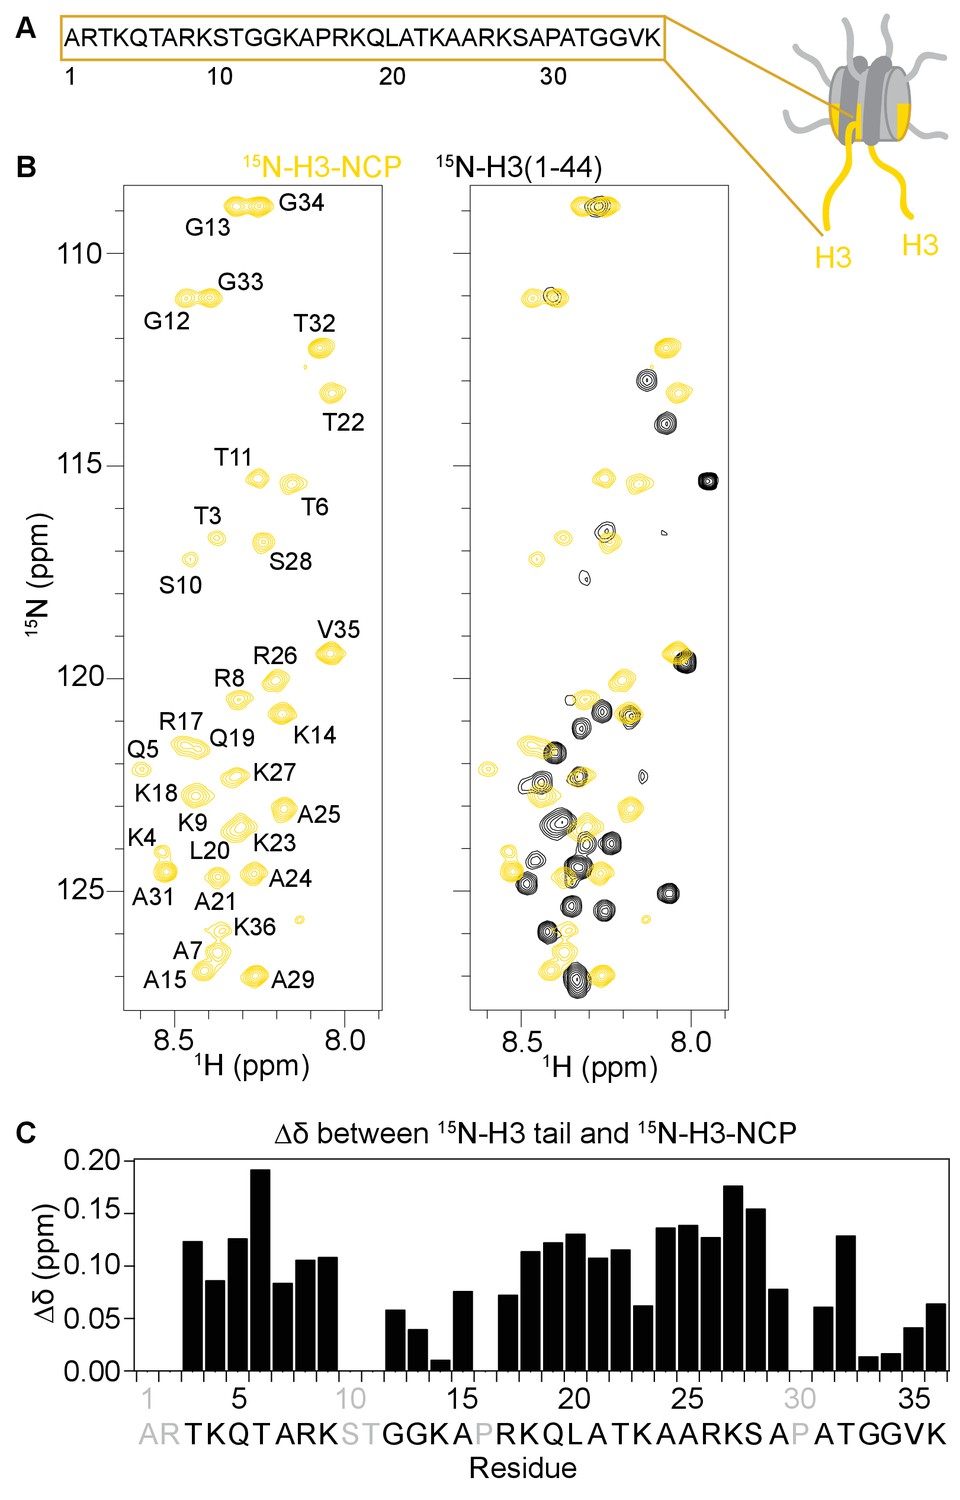
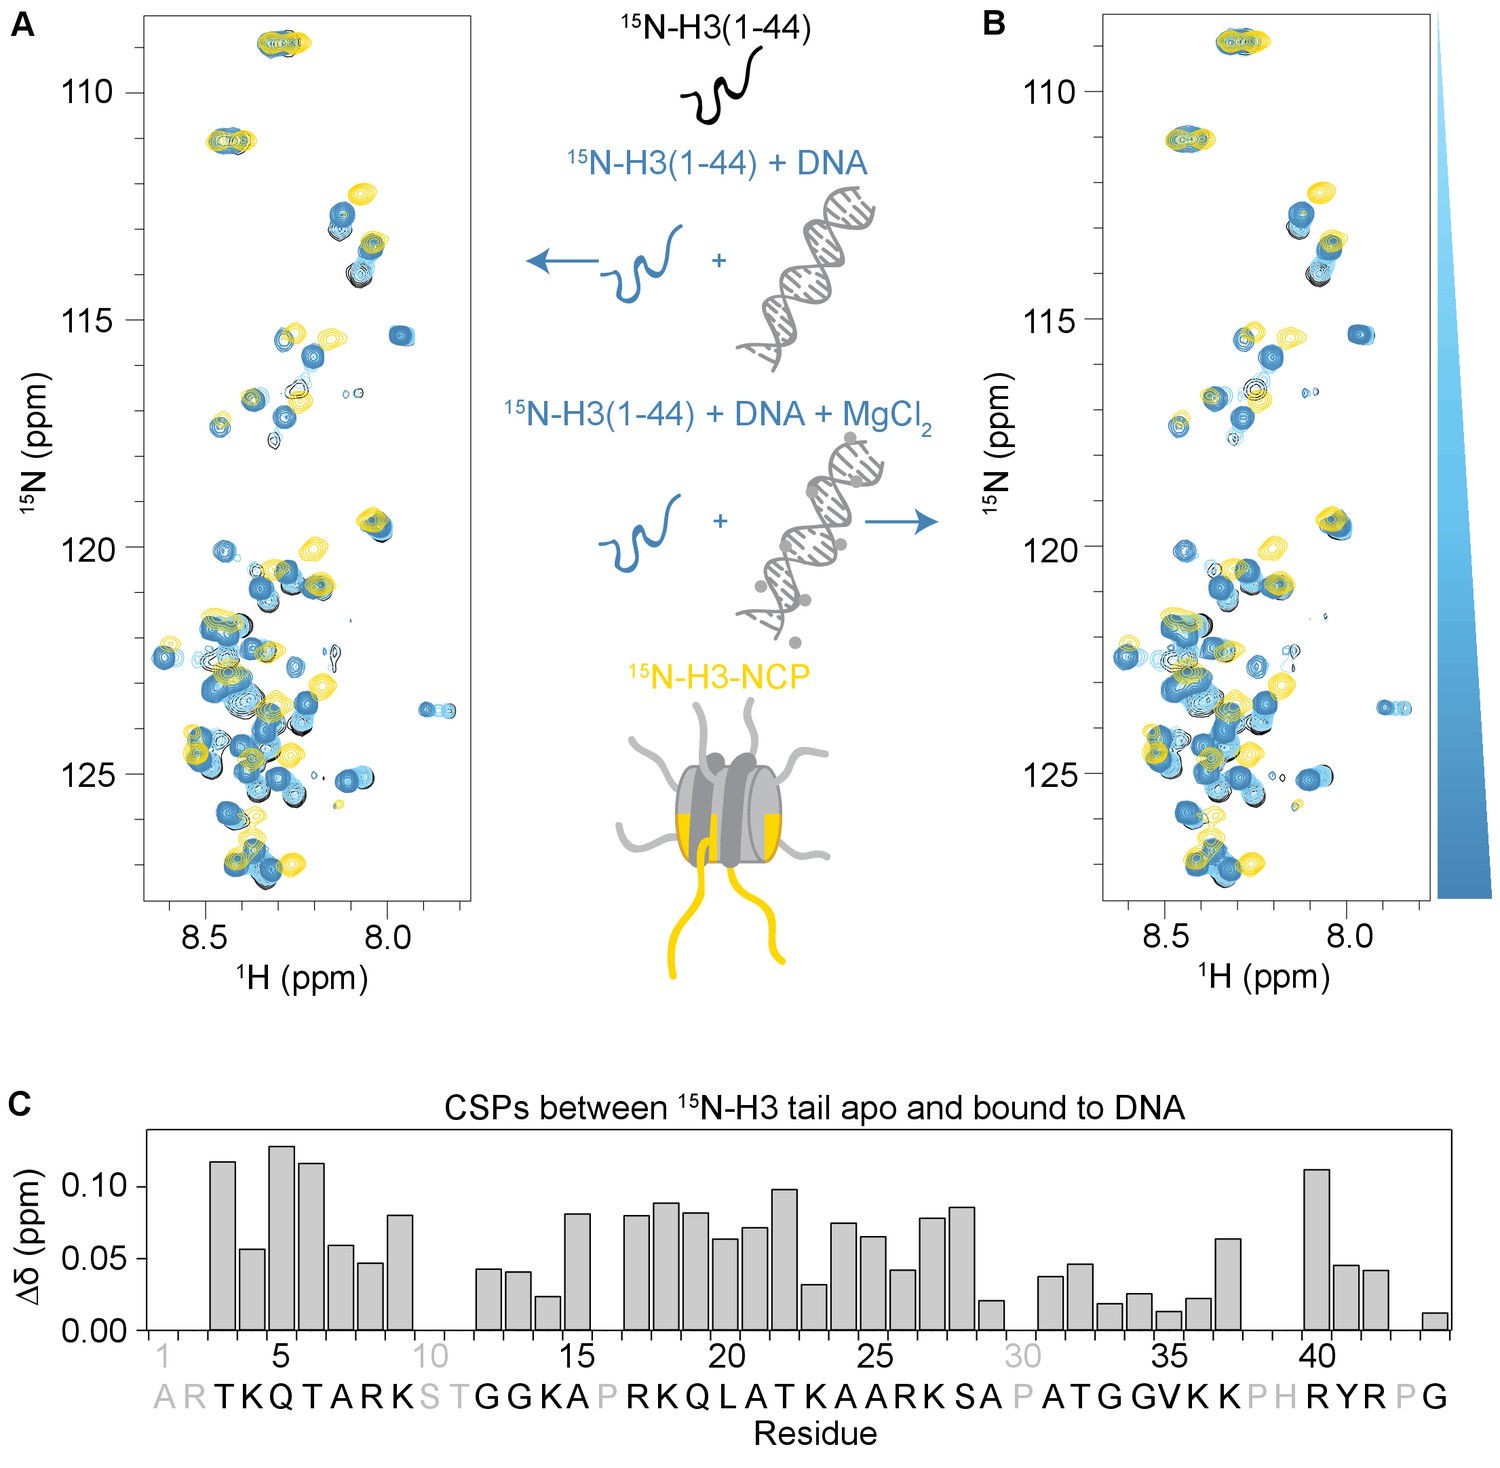
The H3 tail adopts distinct conformation(s) in the context of the nucleosome.
(A) Cartoon depiction of the NCP with extended histone tails. H3 is colored gold, and the sequence for the H3 tail is displayed. (B)1H-15N HSQC or SOFAST HMQC spectra of 15N-H3-NCP (in gold) shown on the left and overlaid with 15N-H3(1–44) (black) shown on the right. Spectra were collected at 25°C in 150 mM KCl. (C) Chemical shift differences (Δδ) between the H3 tail in the context of the NCP and the isolated peptide, shown as a function of H3 tail residue. Residues labeled in grey are not observable in the 1H-15N HSQC/HMQC, either because they correspond to proline or are otherwise unobservable. Though differences in chemical shift are expected for residues at the C-terminus of the tail just adjacent to the core, significant chemical shift differences are seen for the vast majority of observable residues along the entire length of the tail. Chemical shift values for both the peptide and the NCP are consistent with an intrinsically disordered conformation, suggesting that the change is not one of secondary structure. Notably, differences are largest around tandem arginine-lysine as well as serine and threonine residues.
Figure 2—figure supplement 1
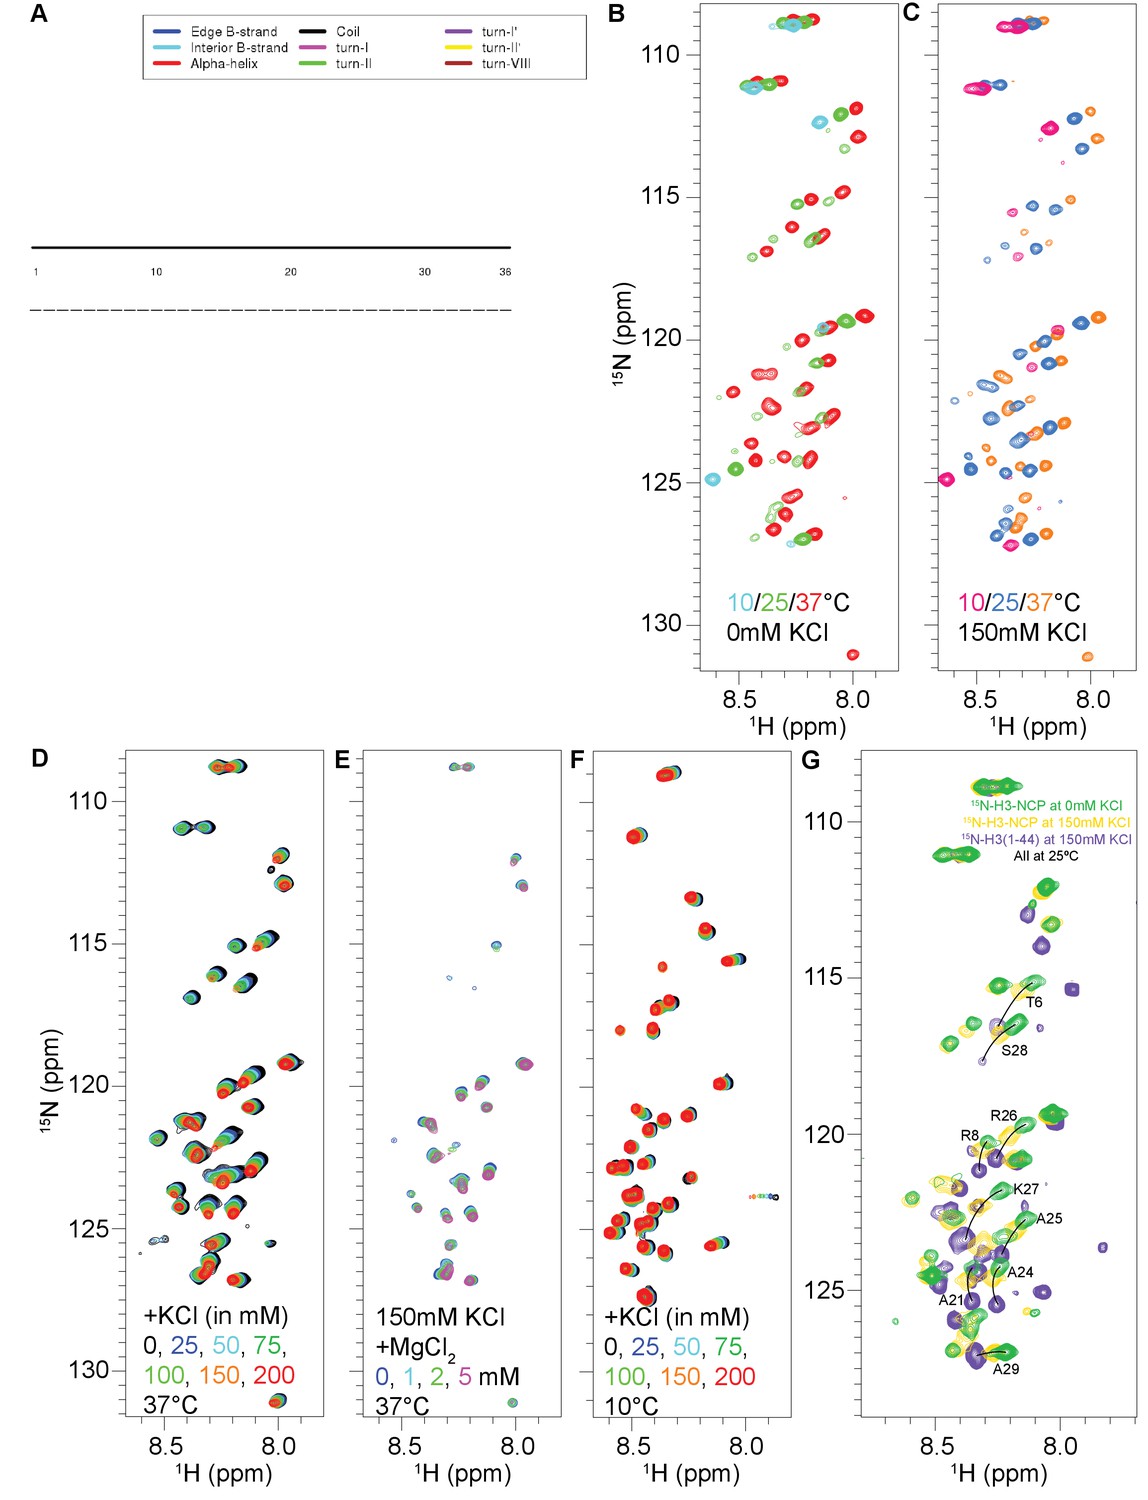
Additional characterization of the H3 tail in the context of the NCP and peptide.
(A) Plot of the secondary structure for the H3 tail predicted by CSI3.0 as entirely random coil based on chemical shift values. (B) 1H-15N HSQC spectra collected on 55 μM 15N-H3-NCP at 10 (blue), 25 (green), and 37°C (red) at 0 mM added KCl. (C) 1H-15N HSQC spectra collected on 55 μM 15N-H3-NCP at 10 (red), 25 (blue), and 37°C (orange) at 150 mM added KCl. (D) 1H-15N HSQC spectra collected on 55 μM 15N-H3-NCP at 37°C in the presence of increasing concentrations of KCl, color coded according to legend. (E) 1H-15N HSQC spectra collected on 55 μM 15N-H3-NCP at 37°C and 150 mM KCl in the presence of increasing concentrations of MgCl2, color coded according to legend. The initial spectrum (0 mM MgCl2) was collected with 2 mM EDTA. (F) 1H-15N SOFAST HMQC spectra collected on 110 μM 15N-H3(1–44) at 10°C. Spectra were collected at increasing concentrations of added KCl, as indicated in the figure. The titration was carried out at 10°C because the peptide signal is significantly attenuated at 25 and especially 37°C. (G) Overlay of 1H-15N HSQC/HMQC spectra for 15N-H3-NCP at 0 mM (green) and 150 mM (gold) added KCl and 15N-H3(1–44) at 150 mM added KCl (purple). These spectra were all collected at 25°C to bridge the KCl titrations shown in (D) and (F). There are several confounding factors (e.g. temperature and salt-sensitivity of the free and bound states and differential amide exchange rates) that complicate these spectral overlays, but comparison of these three spectra at 25°C shows a number of residues that are consistent with the idea that KCl can shift the population of collapsed vs. extended tails. An increase in salt concentration is expected to cause an increase in the population of nucleosomal H3 tails that are released (or partially released) from the core DNA. Some of these residues are labeled, with arcs connecting the three states.
Figure 3 with 3 supplements
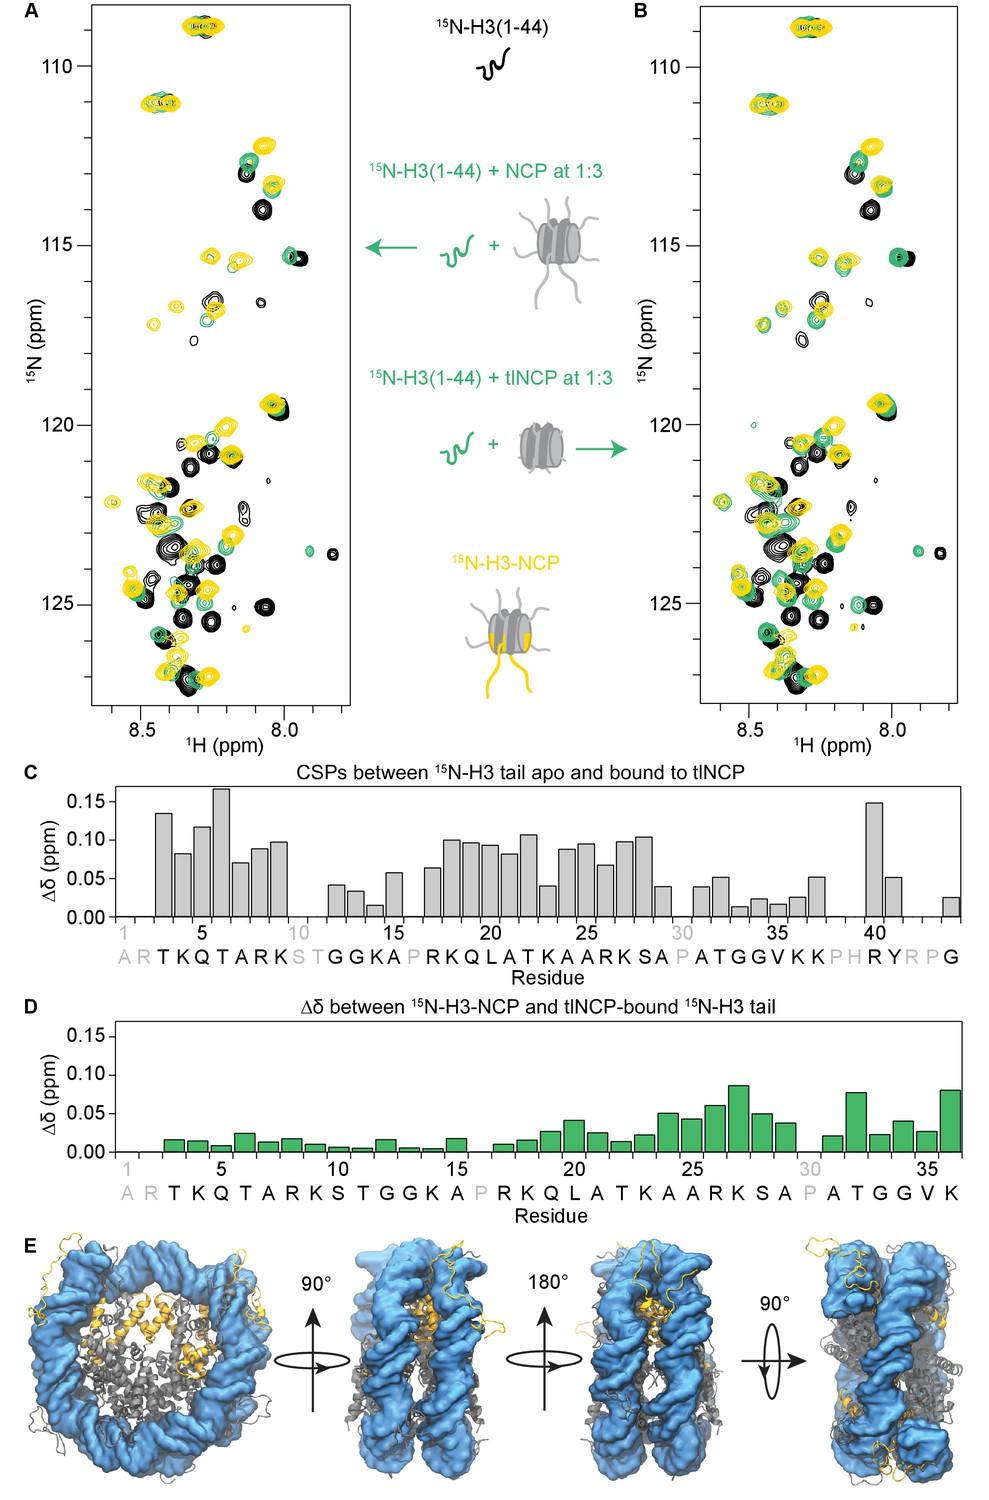
The H3 tail binds the nucleosome core.
(A) Overlay of 1H-15N HSQC or SOFAST HMQC spectra for 70 μM 15N-H3(1–44) (black), 70 μM 15N-H3(1–44) in the presence of unlabeled NCP at a 1:3 ratio (green), and 55 μM 15N-H3-NCP (gold). (B) Same as in (A), except that the 15N-H3(1–44) is bound to unlabeled tlNCP at a 1:3 ratio (green). These spectra indicate that H3(1–44) binds to the nucleosome core in-trans. (C) CSPs (Δδ) as a function of H3 tail residue corresponding to the difference between 15N-H3(1–44) apo and bound to tlNCP. (D) Chemical shift differences (Δδ) as a function of H3 tail residue corresponding to the difference between the native, nucleosomal H3 tail and H3(1–44) peptide bound to tlNCP. In (C) and (D), residue letters colored in grey are not observable in the 1H-15N HSQC/HMQC, either because they correspond to proline or are otherwise unobservable. (E) Representative snapshot from one of the NCP simulations showing the H3 tails (gold), as well as the remaining histone tails (grey), collapsed onto the core DNA surface (blue).
Figure 3—figure supplement 1
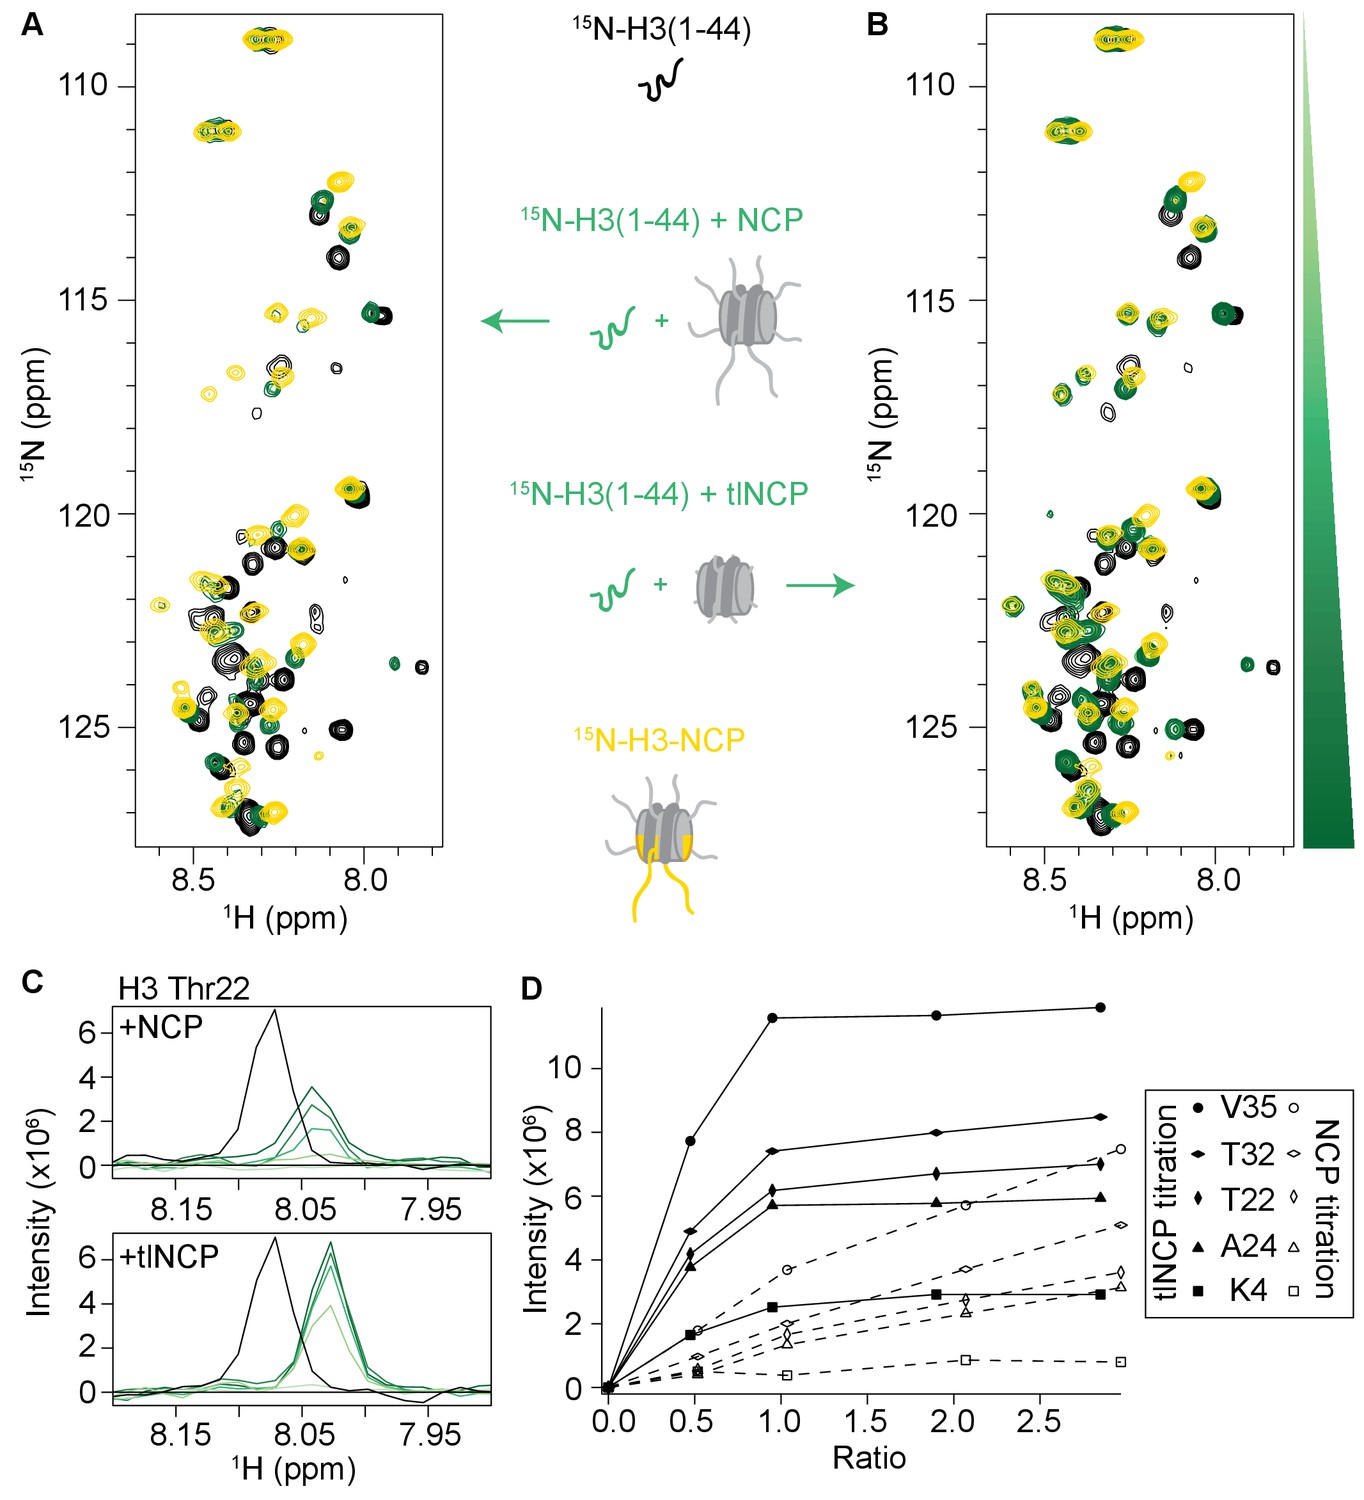
Full data sets for the titration of NCP and tlNCP into 15 N-H3(1–44).
Overlay of 1H-15N SOFAST HMQC spectra of 70 μM 15N-H3(1–44) apo and upon addition of NCP (A) or tlNCP (B). Spectra are color-coded according to protein:NCP molar ratio, with apo spectra in black and shades of green for increasing concentrations of NCP/tlNCP. Spectra were collected at molar ratios (PHD:NCP/tlNCP) of 1:0, 1:0.2, 1:0.5, 1:1, 1:2 and 1:3. 1H-15N HSQC of 55 μM 15N-H3-NCP is overlaid in gold for comparison. Spectra were collected at 25°C in 150 mM KCl. Upon addition of NCP/tlNCP, signal initially disappears and then reappears at the bound state chemical shift and increases in intensity upon further addition of ligand. (C) 1D 1H spectra extracted from 1H-15N SOFAST HMQC spectra of 15N-H3(1–44) apo and at increasing concentration of NCP/tlNCP in (A) and (B) for residue Thr22. These spectra are slices taken through the 15N-center of the apo (point 714) and bound (point 734) states and overlaid to compare the peak intensity as a function of 15N-H3(1–44):NCP/tlNCP ratio. (D) Resonance intensity as a function of NCP/tlNCP ratio for residues K4 (squares), T22 (tall diamonds), A24 (triangles), T32 (squat diamonds), and V35 (circles). Closed symbols and solid lines correspond to titration of tlNCP while open symbols and dashed lines correspond to titration of NCP.
Figure 3—figure supplement 2
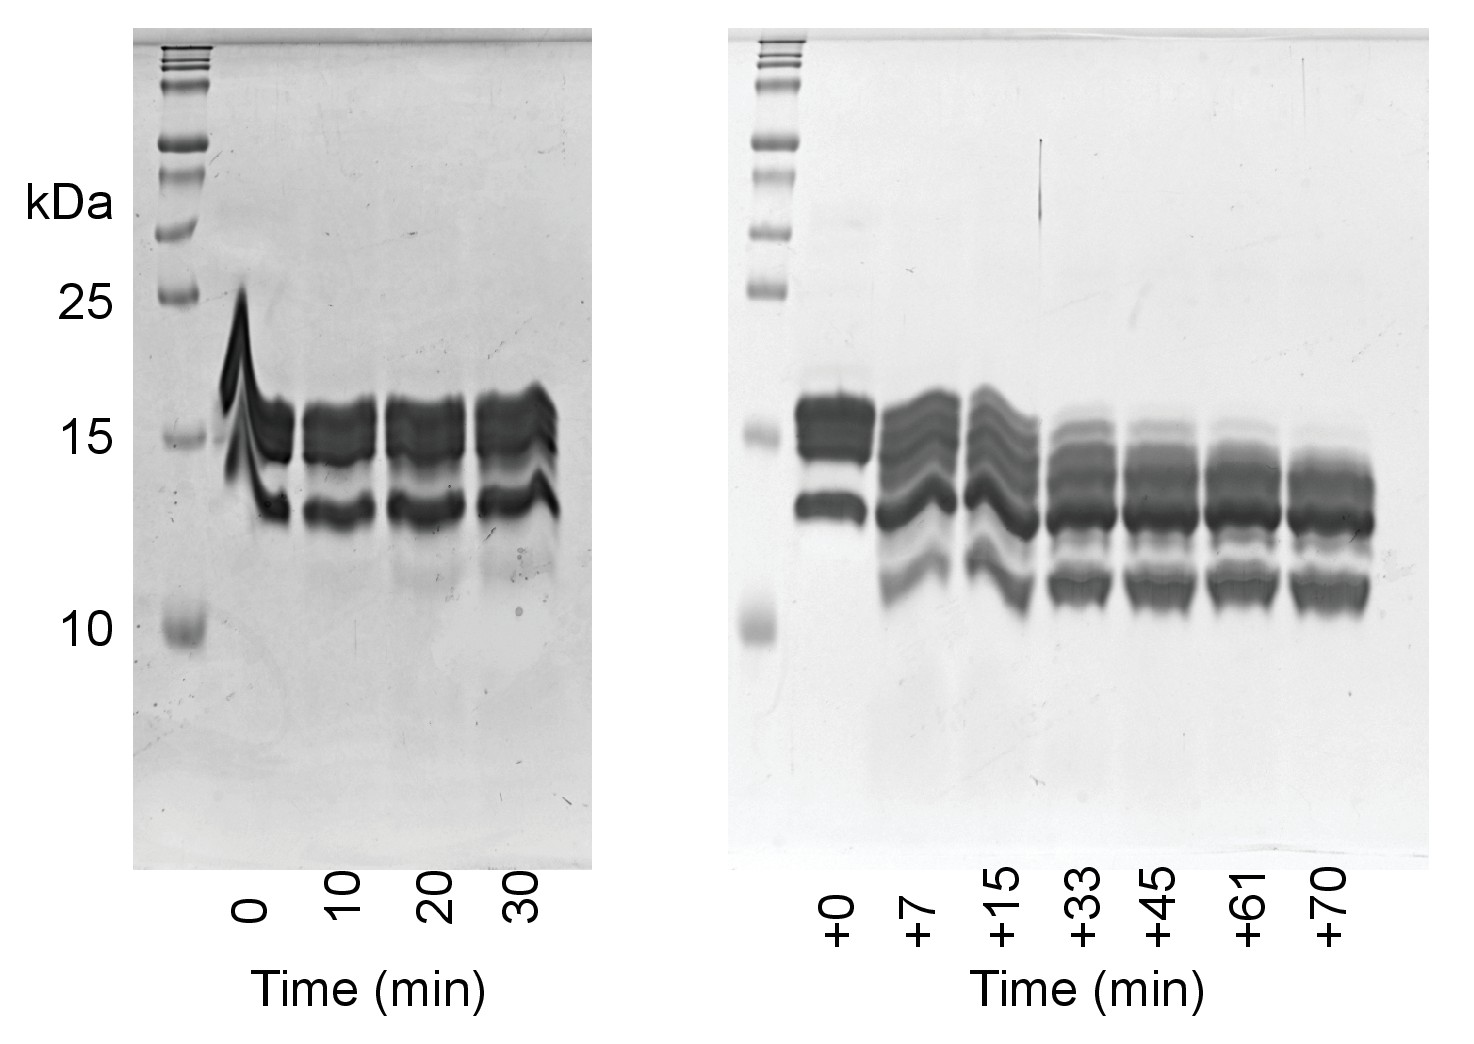
Generation of tlNCPs via trypsin digest.
Time points of the trypsin digest of reconstituted NCPs were run on 18% SDS-PAGE gels. NCPs were first incubated with TPCK Trypsin immobilized on magnetic beads at room temperature for 30 min in 0.5xTE, which resulted in little digestion (left gel). The sample was then incubated for an additional 70 min with 75 mM KCl (right gel).
Figure 3—figure supplement 3
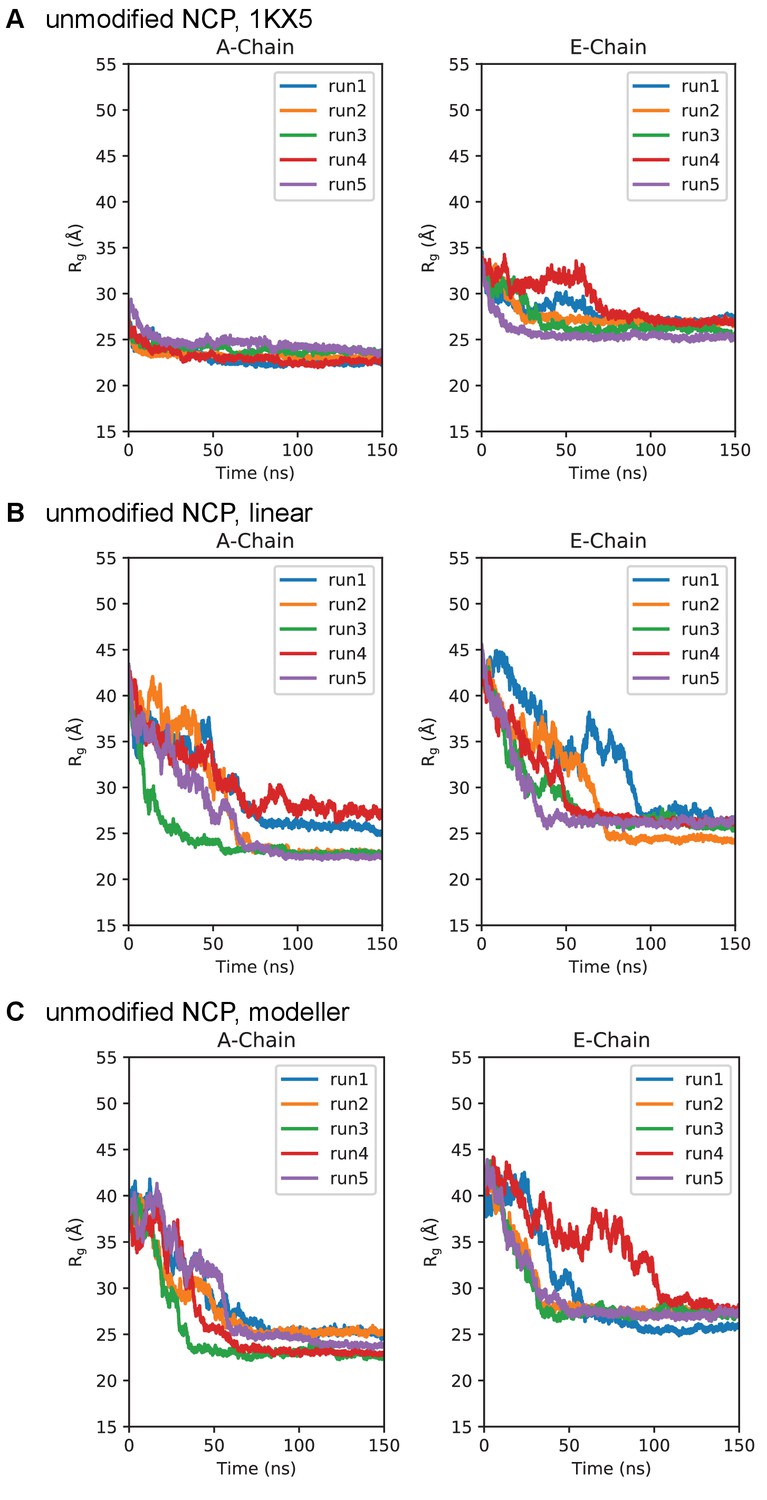
Simulation time course of H3 tails within unmodified NCP.
Radius of gyration timeseries for the unmodified NCP initialized in the (A) 1KX5, (B) linear, and (C) MODELLER-predicted tail conformations. Plots are separated between the 1KX5 nomenclature of the two H3 chains, A-chain (left) and E-chain (right).
Figure 4 with 1 supplement

The NCP- and DNA-bound states of the H3 tail peptide mirror the H3 tail conformation in the context of the nucleosome.
(A) Overlay of 1H-15N HSQC or SOFAST HMQC spectra of 15N-H3(1–44) (black), 15N-H3(1–44) bound to DNA (blue) or tlNCP (green), and 15N-H3-NCP (gold). Expanded regions of the overlay are shown for selected residues for comparison of histone tail states. Arrows connect the apo 15N-H3(1–44) to the native 15N-H3-NCP. (B) Chemical shift differences (Δδ) as a function of H3 tail residue corresponding to the difference between the native, nucleosomal H3 and H3(1–44) either apo (black), DNA-bound (blue), or tlNCP-bound (green). Residue letters colored in grey are not observable in the 1H-15N HSQC/HMQC, either because they correspond to proline or are otherwise unobservable. The * indicates that a residue is unobservable.
Figure 4—figure supplement 1
The H3 tail binds DNA.
(A) Overlay of 1H-15N SOFAST HMQC spectra of 110 μM 15N-H3(1–44) apo and at increasing concentrations of 21 bp dsDNA. Spectra are color-coded according to ligand concentration, with apo spectra in black and shades of blue for increasing concentrations of DNA. Spectra were collected at molar ratios (PHD:DNA) of 1:0, 1:0.1, 1:0.25, 1:0.5, 1:1, 1:2 and 1:4. 1H-15N HSQC of 55 μM 15N-H3-NCP is overlaid in gold for comparison. Significant CSPs are observed in this titration. Saturation is reached at a 1:1 molar ratio, indicating robust binding. (B) Same as (A), but in the presence of 1 mM MgCl2. Comparison of the titrations in (A) and (B) indicates that 1 mM MgCl2 does not have an effect on the interaction between DNA and H3(1–44). (C) CSPs (Δδ) as a function of H3 tail residue corresponding to the difference between H3(1–44) apo and bound to DNA. This plot reveals that residues along the entire H3 tail are perturbed by binding. Residues labeled in grey are not observable in the 1H-15N HMQC, either because they correspond to proline, are unassigned, or are otherwise unobservable.
Figure 5 with 2 supplements

The H3 tails adopt a heterogeneous ensemble of DNA bound states.
Three-dimensional probability distribution of the locations of heavy atoms within H3 N-terminal tails for the unmodified (A) and H3K4me3-NCP (B) simulations, superimposed upon the crystal structure (PDBID 1KX5). Histones are shown in gold and DNA is shown in blue. Darker regions represent areas of higher probability, and lighter regions depict areas of lower probability. (C) MM-GBSA analysis of the per-residue contributions to DNA binding of H3 tail residues in the unmodified (gold) and H3K4me3 (raspberry) NCP simulations. (D) Overlay of 1H-15N HSQC spectra of 15N-H3-NCP (gold) and 15N-H3KC4me3-NCP (raspberry), which indicates that the MLA installed at K4 only causes local perturbations to the H3 tail. Residues are labeled based on assignments for 15N-H3-NCP.
Figure 5—figure supplement 1
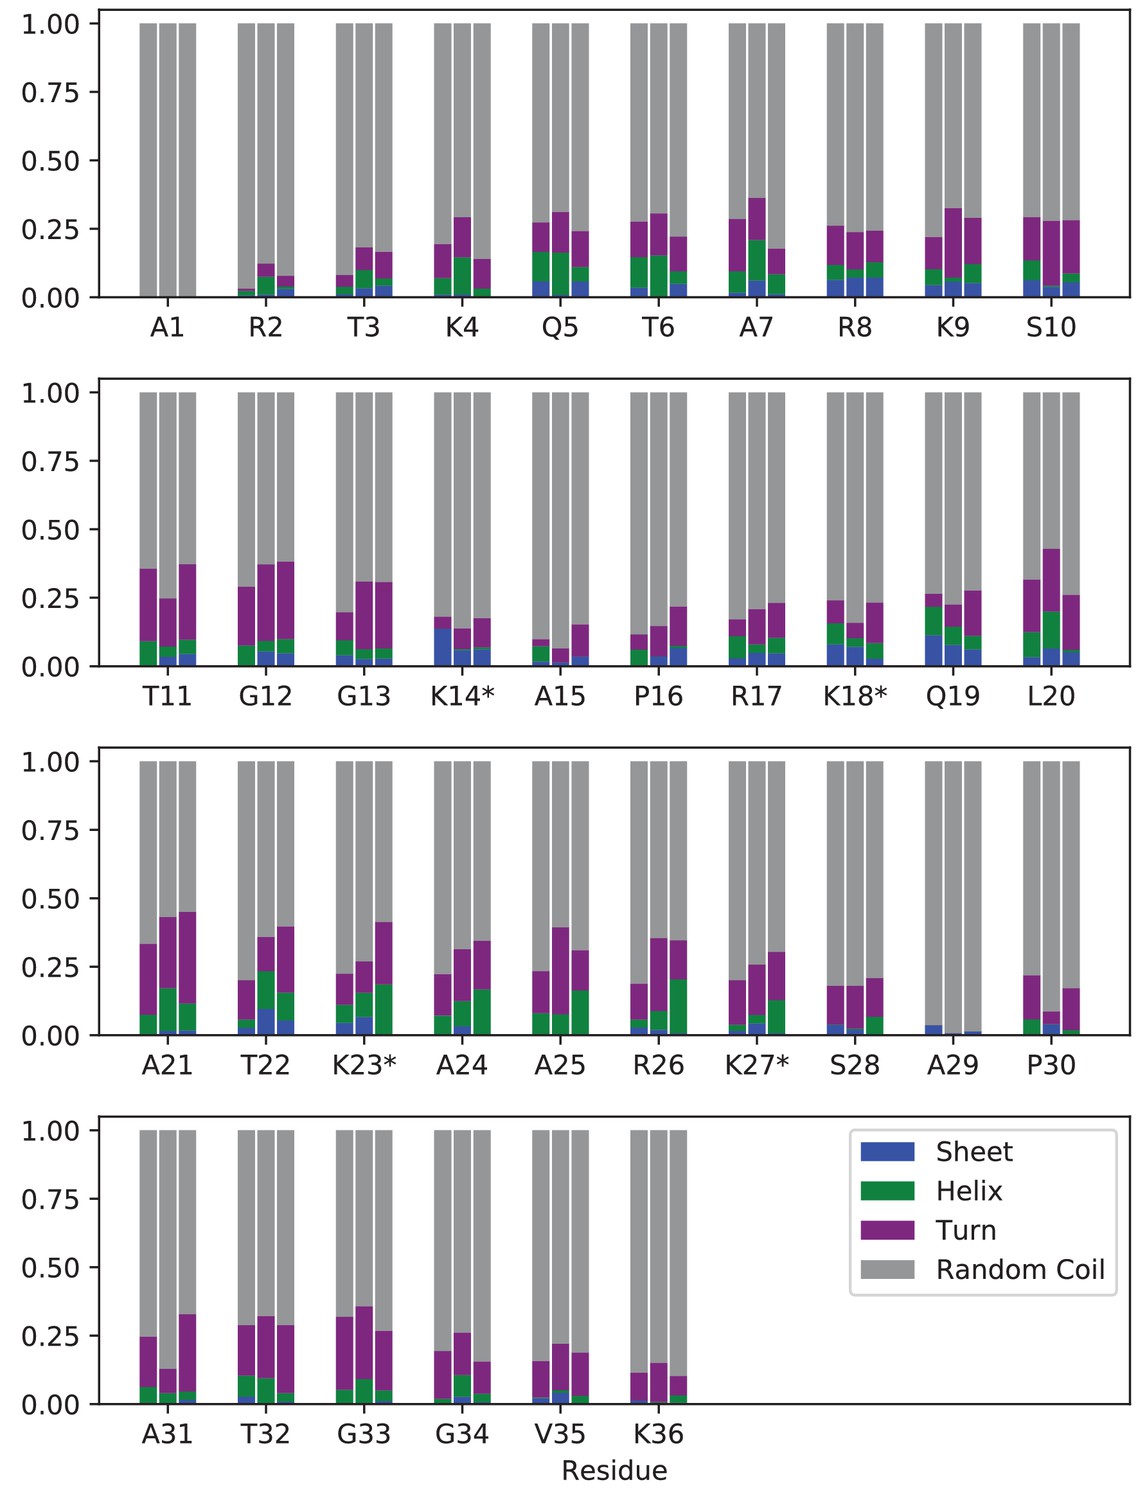
Secondary structure analysis of unmodified or acetylated H3 tails within the NCP.
Percentage of simulation frames where each residue is in β-sheet (blue), α-helix (green), turn (purple), or random coil (grey) configurations. For each residue, results are shown for (left to right): un-NCP, quadAc-NCP, and 4xK-Q-NCP. Locations of modifications/mutations are identified by ‘*”. Every residue was in a random coil configuration in over 50% of simulated frames, regardless of chemical composition.
Figure 5—figure supplement 2
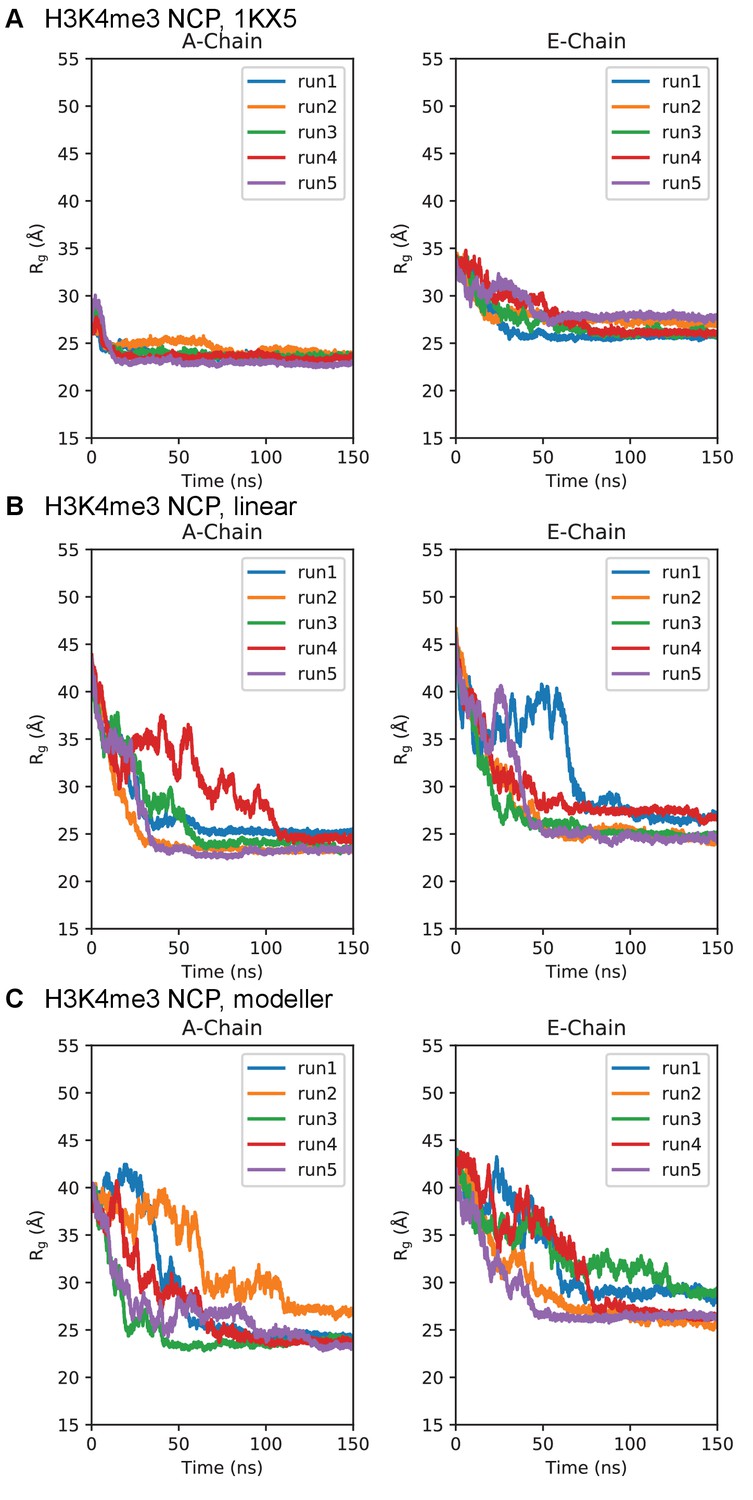
Simulation time course of H3 tails within H3K4me3-NCP.
Radius of gyration timeseries for the H3K4me3-NCP initialized in the (A) 1KX5, (B) linear, and (C) MODELLER-predicted tail conformations. Plots are separated between the 1KX5 nomenclature of the two H3 chains, A-chain (left) and E-chain (right).
Figure 6
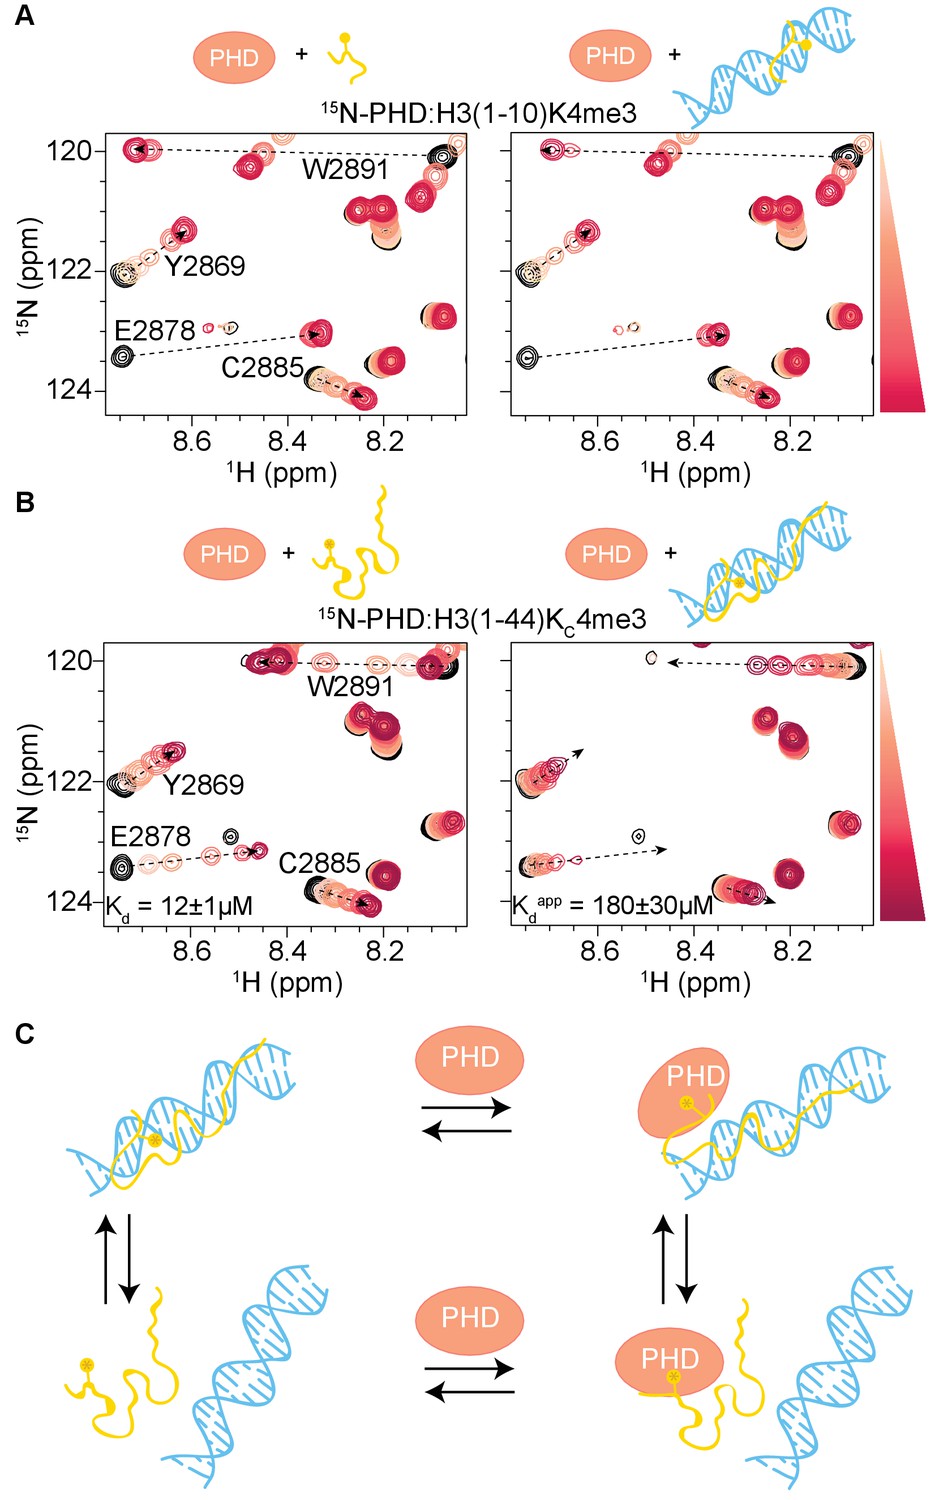
H3 tail-DNA interactions inhibit PHD finger binding.
(A) Overlay of a region of the 1H-15N HSQC spectra of 50 μM 15N-BPTF PHD upon titration of H3(1–10)K4me3 (left, as shown in Figure 1A), or H3(1–10)K4me3 pre-bound to DNA at a ratio of 1:2 (right). (B) Same as in (A) but for the H3(1–44)KC4me3 peptide. Spectra are color-coded according to peptide concentration, with apo spectra in black and shades of salmon for increasing concentrations of peptide. Spectra are shown for molar ratios (PHD:peptide) of: 1:0, 1:0.1, 1:0.25, 1:0.5, 1:1, 1:2, and 1:5 for H3(1–10)K4me3 and 1:0, 1:0.25, 1:0.5, 1:1, 1:2, 1:5 and 1:10 for H3(1–44)KC4me3. Dashed arrows track the trajectory between apo and bound states for peptide alone and are shown as visual aids for titrations where peptide was pre-bound to DNA. Binding affinities determined from the NMR data as described in Materials and methods are displayed. (C) Cartoon model to depict the linked equilibria of H3 tail peptide-DNA binding and PHD finger-H3 tail peptide binding. It is possible that the H3 tail could partially release from DNA and interact with the PHD finger, but the existence of this type of ternary complex is not conclusively shown from the data. The competitive H3 tail peptide-DNA binding is significantly greater with the longer tail peptide.
Figure 7 with 7 supplements
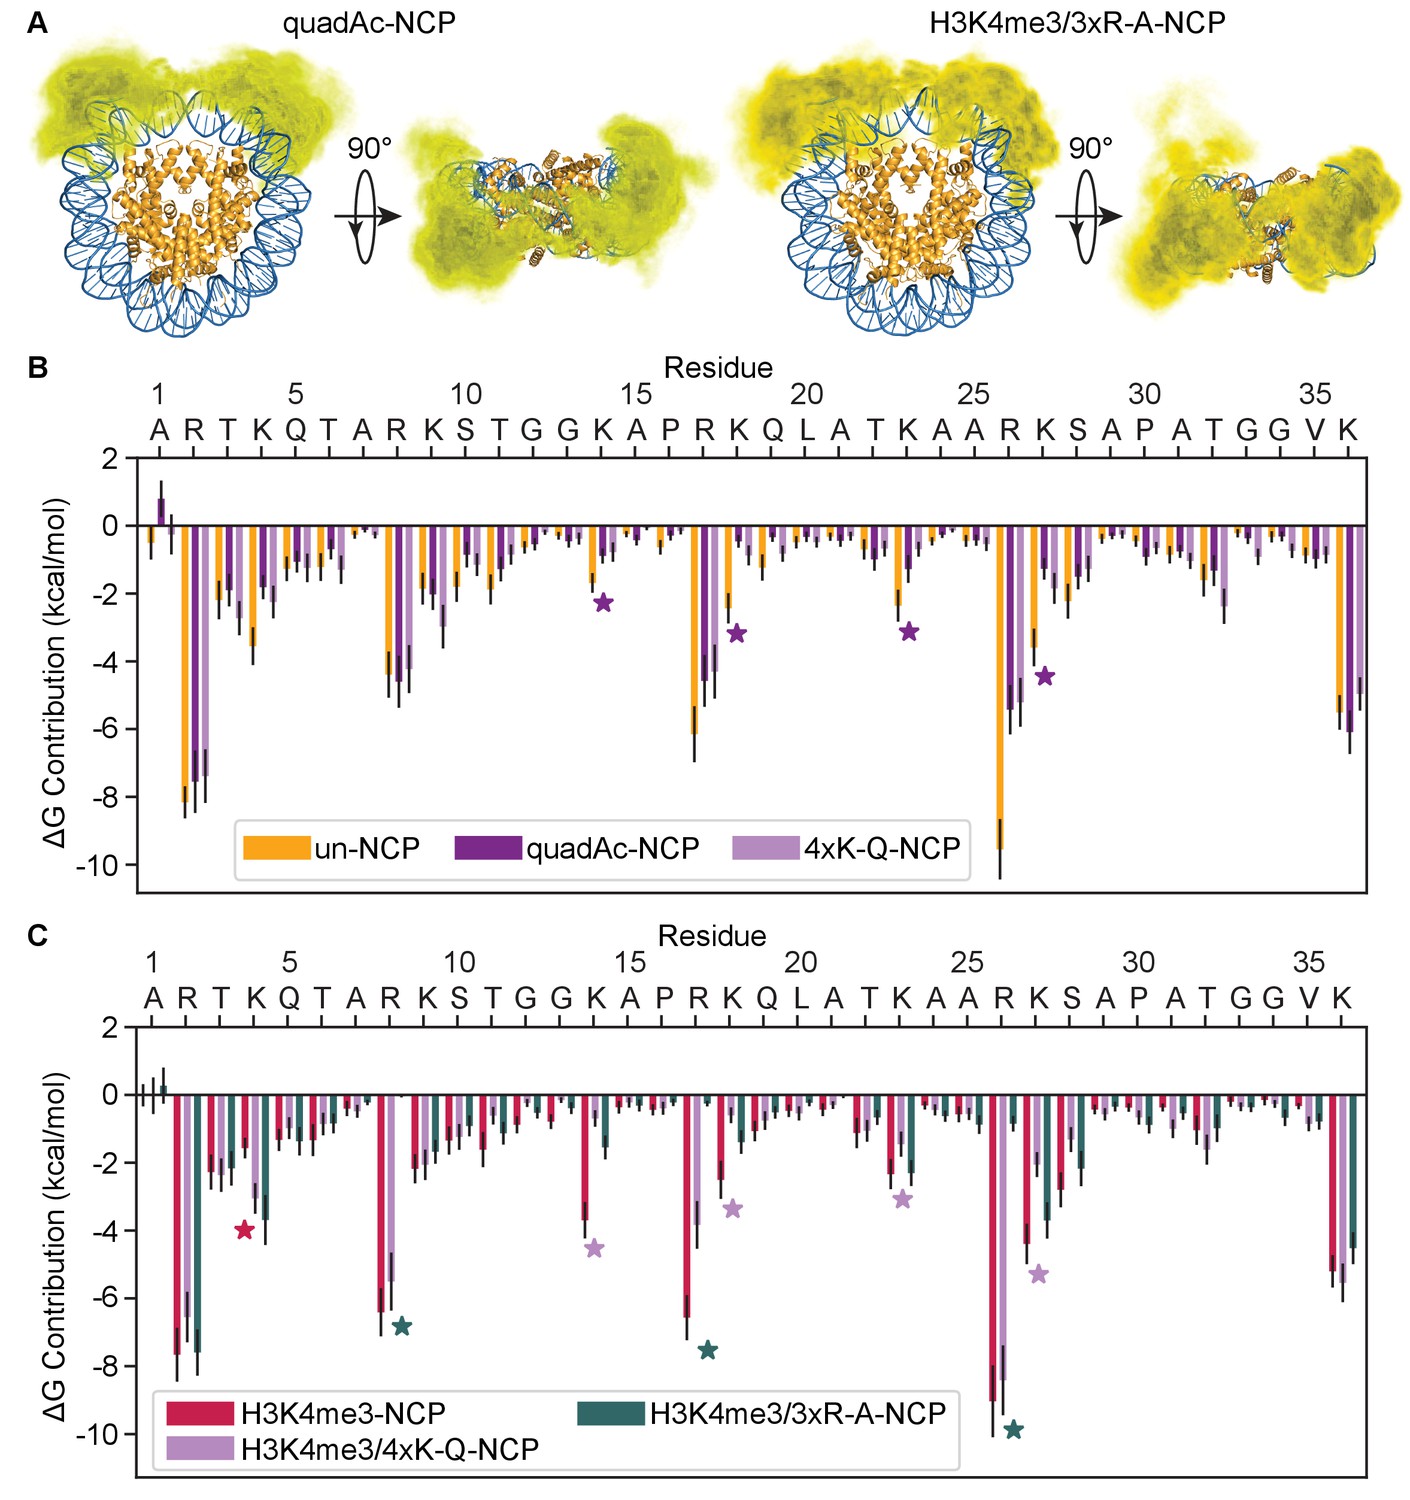
Modification and mutation of the H3 tails leads to a partial release from nucleosomal DNA.
(A) Three-dimensional probability distribution of the locations of heavy atoms within H3 N-terminal tails for the quadAc-NCP (left) and H3K4me3/3xR-A-NCP (right) simulations, superimposed upon the crystal structure (PDBID 1KX5). Histones are shown in gold and DNA in blue. Darker regions represent areas of higher probability, and lighter regions depict areas of lower probability. (B) MM-GBSA analysis of the per-residue contributions to DNA binding of H3 N-terminal tail residues in the unmodified (gold), quadAc (dark purple), and 4xK-Q (lavender) NCP simulations. (C) MM-GBSA analysis of the per-residue contributions to DNA binding of H3 N-terminal tail residues in the H3K4me3 (raspberry), H3K4me3/4xK-Q (lavender), and H3K4me3/3xR-A (dark green) NCP simulations.
Figure 7—figure supplement 1
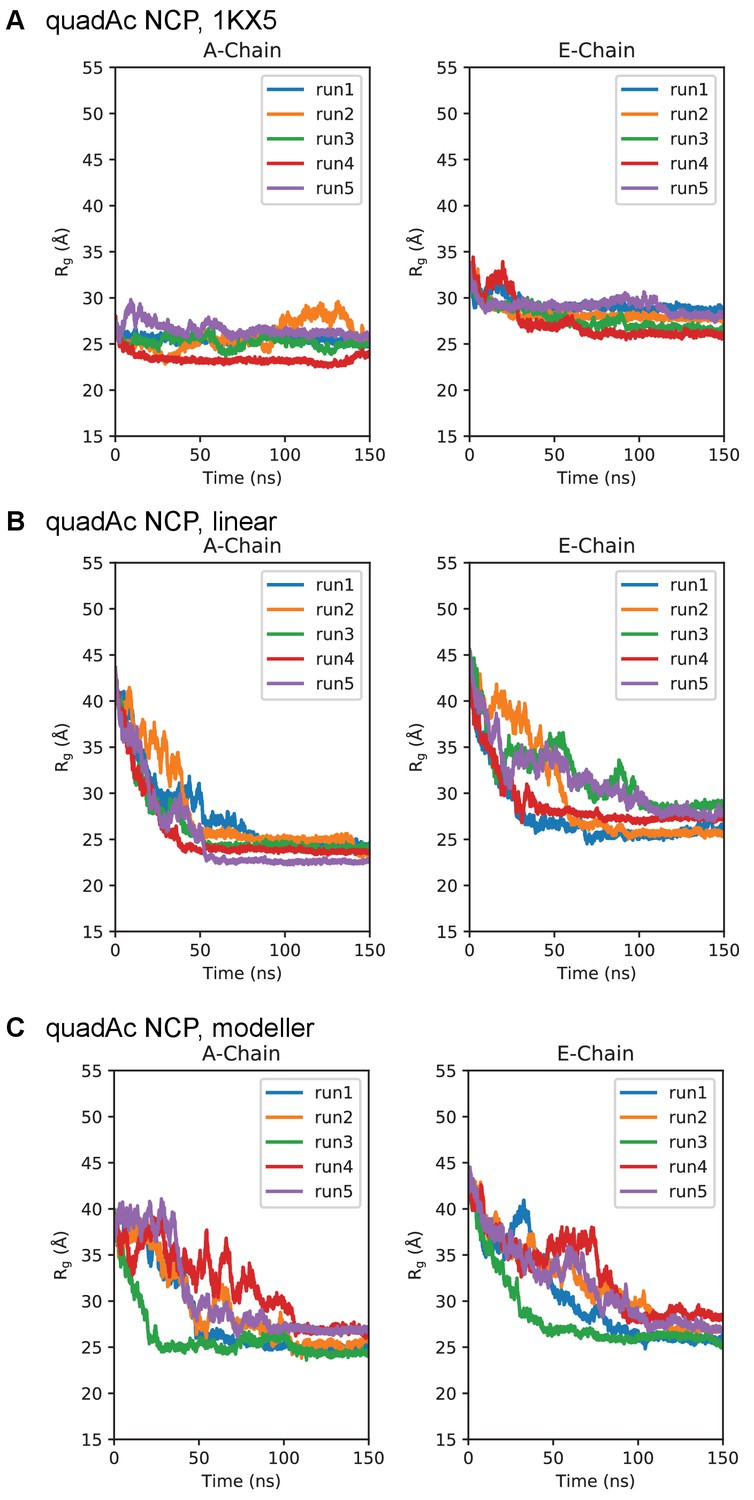
Simulation time course of H3 tails within quadAc-NCP.
Radius of gyration timeseries for the quadAc-NCP initialized in the (A) 1KX5, (B) linear, and (C) MODELLER-predicted tail conformations. Plots are separated between the 1KX5 nomenclature of the two H3 chains, A-chain (left) and E-chain (right).
Figure 7—figure supplement 2
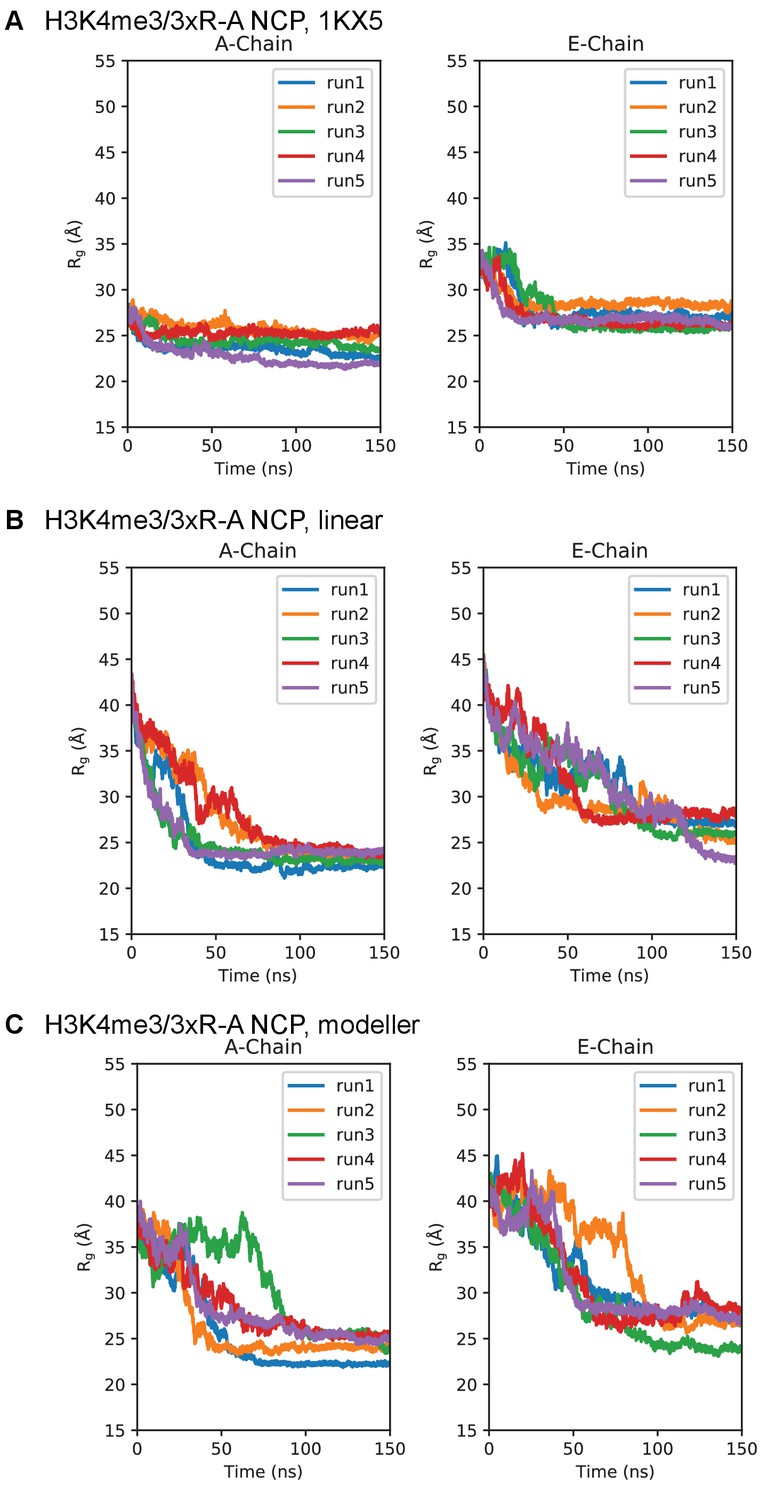
Simulation time course of H3 tails within H3K4me3/3xR-A-NCP.
Radius of gyration timeseries for the H3K4me3/3xR-A-NCP initialized in the (A) 1KX5, (B) linear, and (C) MODELLER-predicted tail conformations. Plots are separated between the 1KX5 nomenclature of the two H3 chains, A-chain (left) and E-chain (right).
Figure 7—figure supplement 3
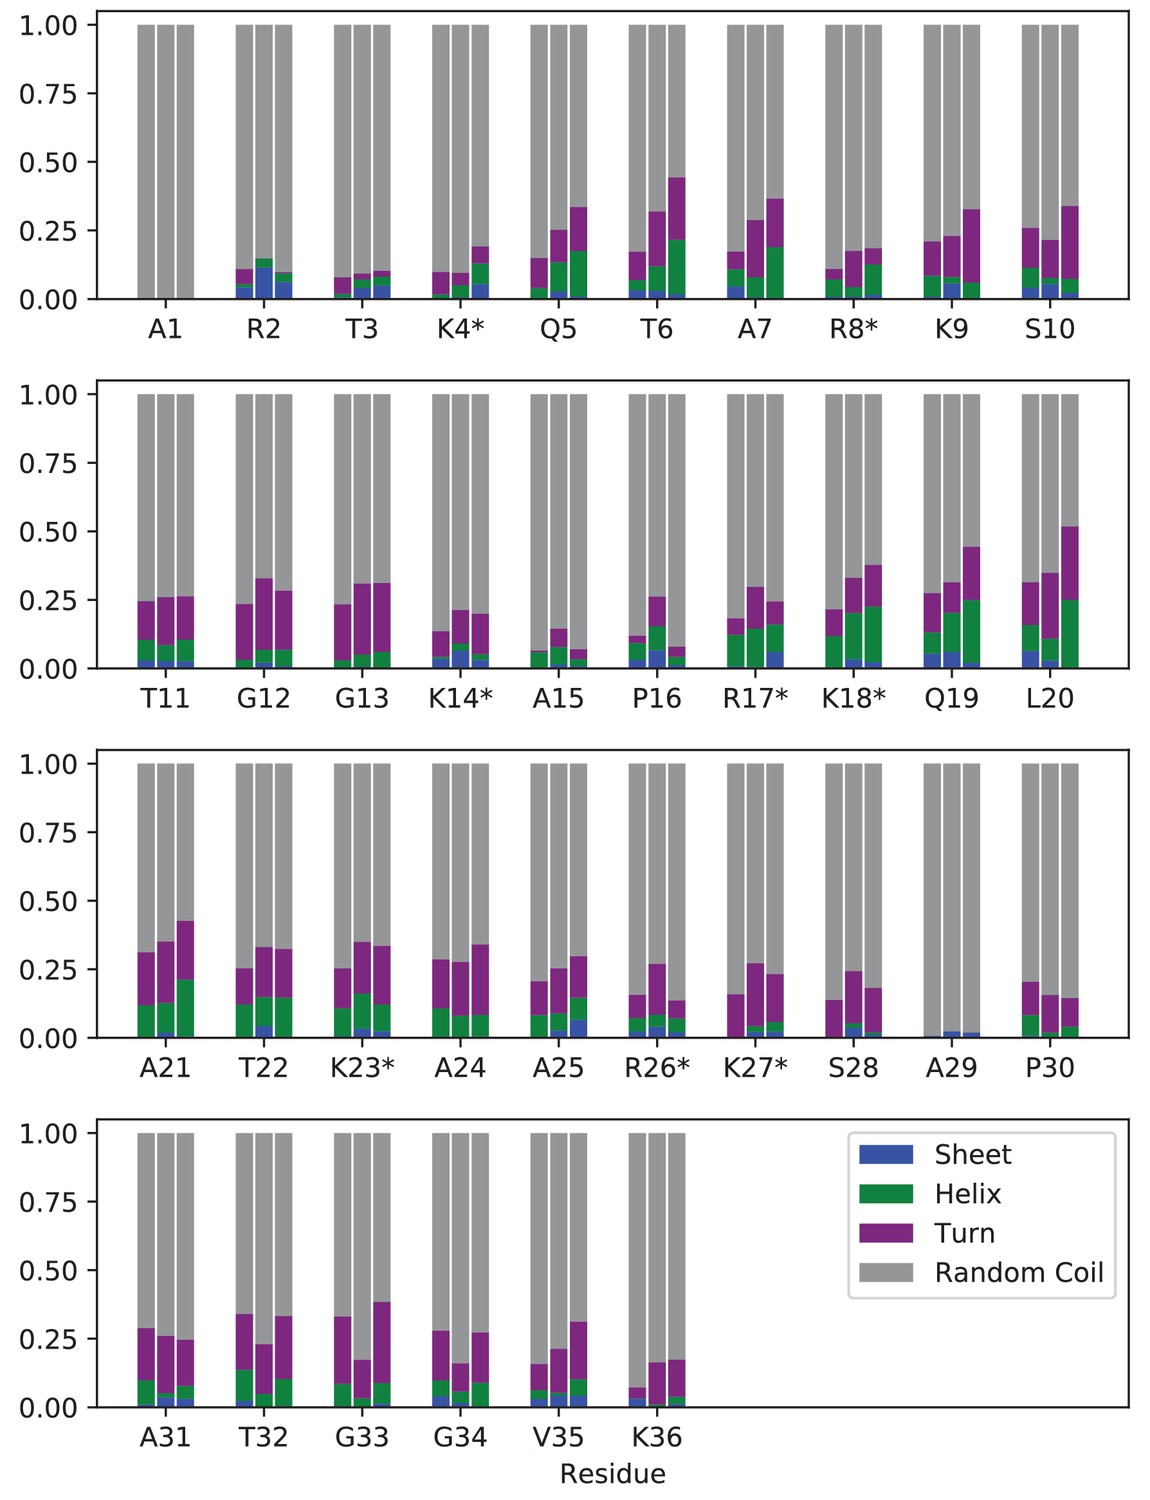
Secondary structure analysis of modified/mutated H3 tails within the NCP.
Percentage of simulation frames where each residue is in β-sheet (blue), α-helix (green), turn (purple), or random coil (grey) configurations. For each residue, results are shown for (left to right): H3K4me3-NCP, H3K4me3/4xK-Q-NCP. H3K4me3/3xR-A-NCP. Locations of mutations are identified by ‘*”. Every residue was in a random coil configuration in over 50% of simulated frames, regardless of chemical composition.
Figure 7—figure supplement 4
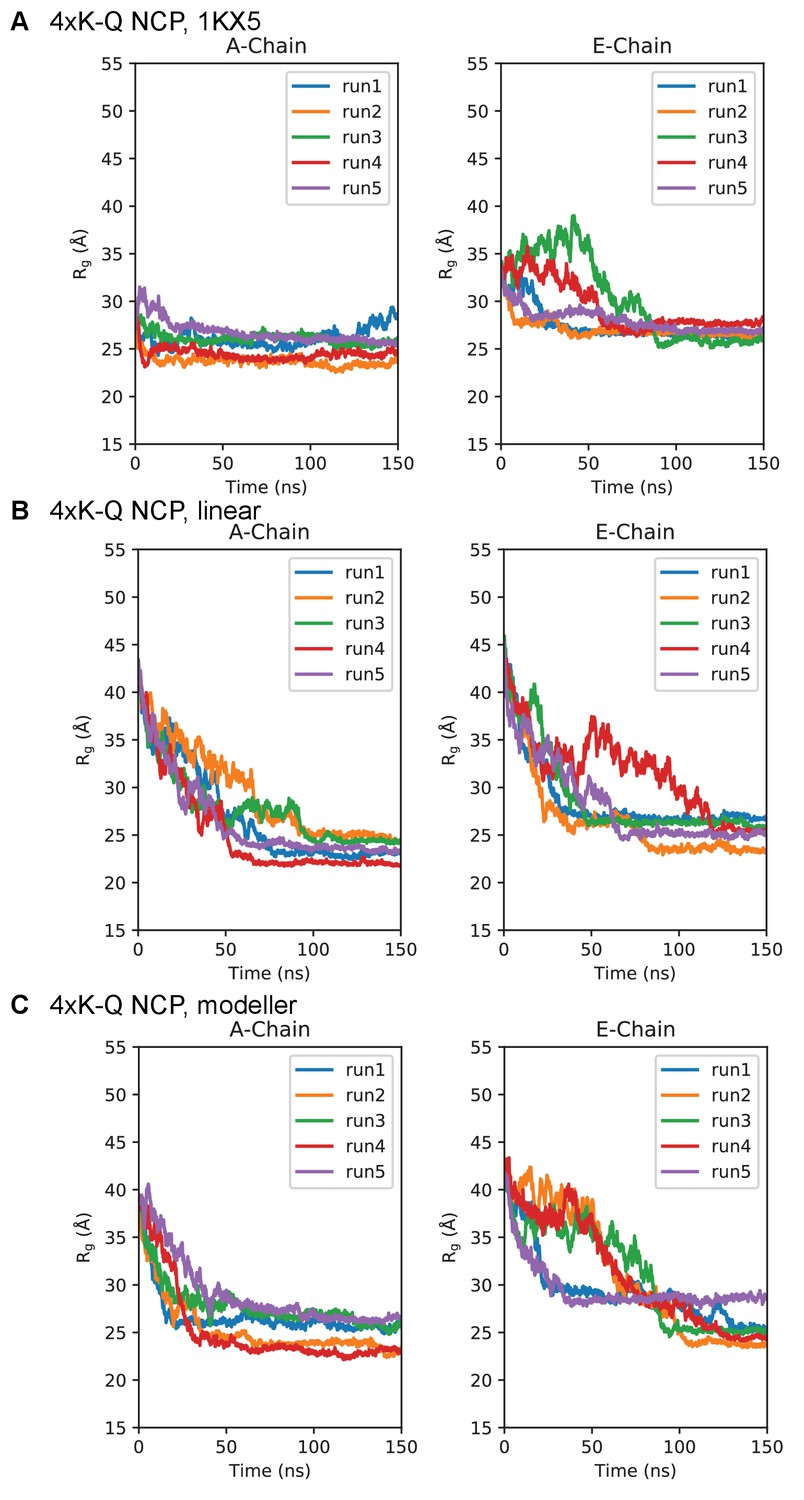
Simulation time course of H3 tails within 4xK-Q-NCP.
Radius of gyration timeseries for the 4xK-Q-NCP initialized in the (A) 1KX5, (B) linear, and (C) MODELLER-predicted tail conformations. Plots are separated between the 1KX5 nomenclature of the two H3 chains, A-chain (left) and E-chain (right).
Figure 7—figure supplement 5
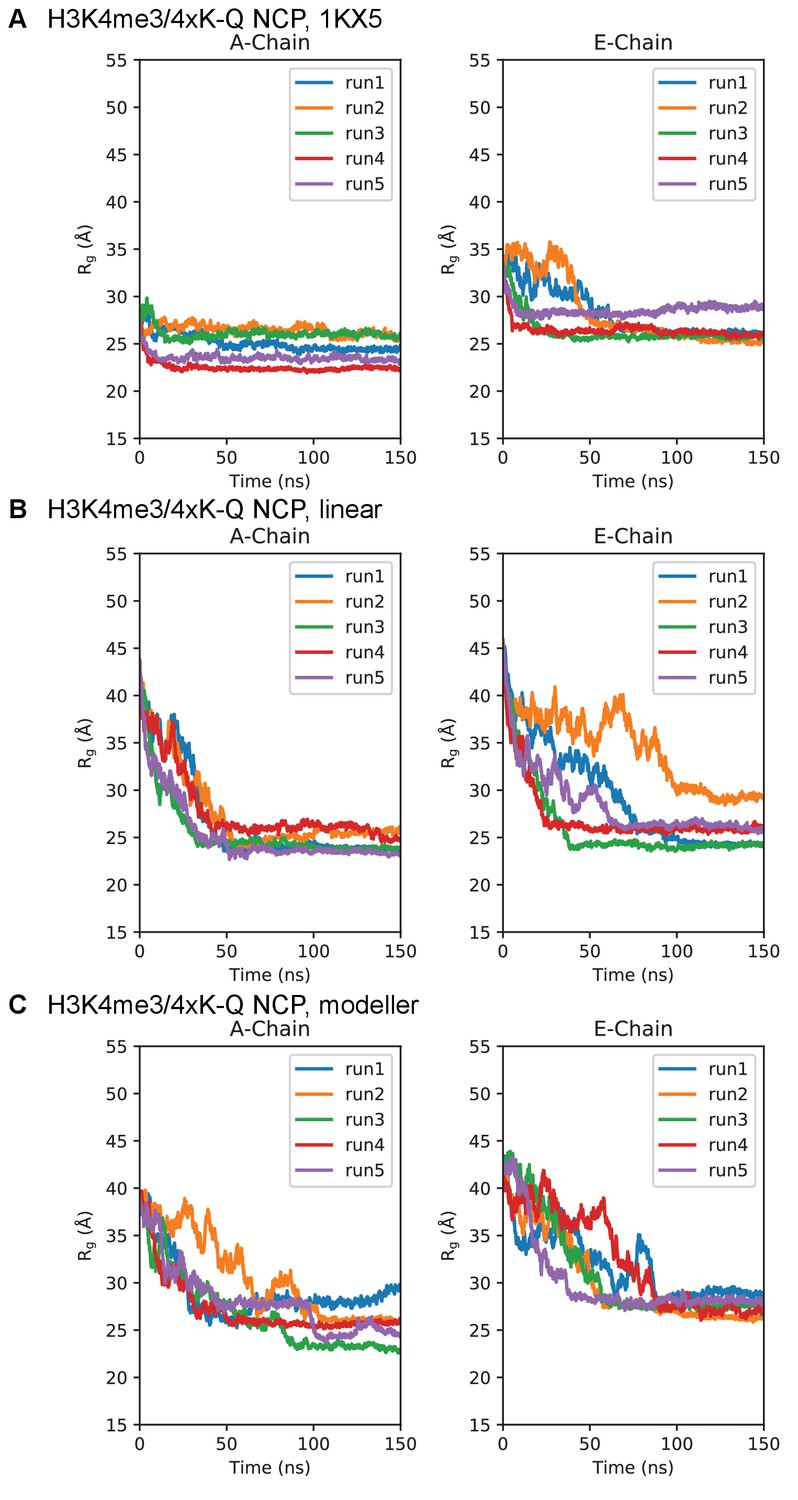
Simulation time course of H3 tails within H3K4me3/4xK-Q-NCP.
Radius of gyration timeseries for the H3K4me3/4xK-Q-NCP initialized in the (A) 1KX5, (B) linear, and (C) MODELLER-predicted tail conformations. Plots are separated between the 1KX5 nomenclature of the two H3 chains, A-chain (left) and E-chain (right).
Figure 7—figure supplement 6
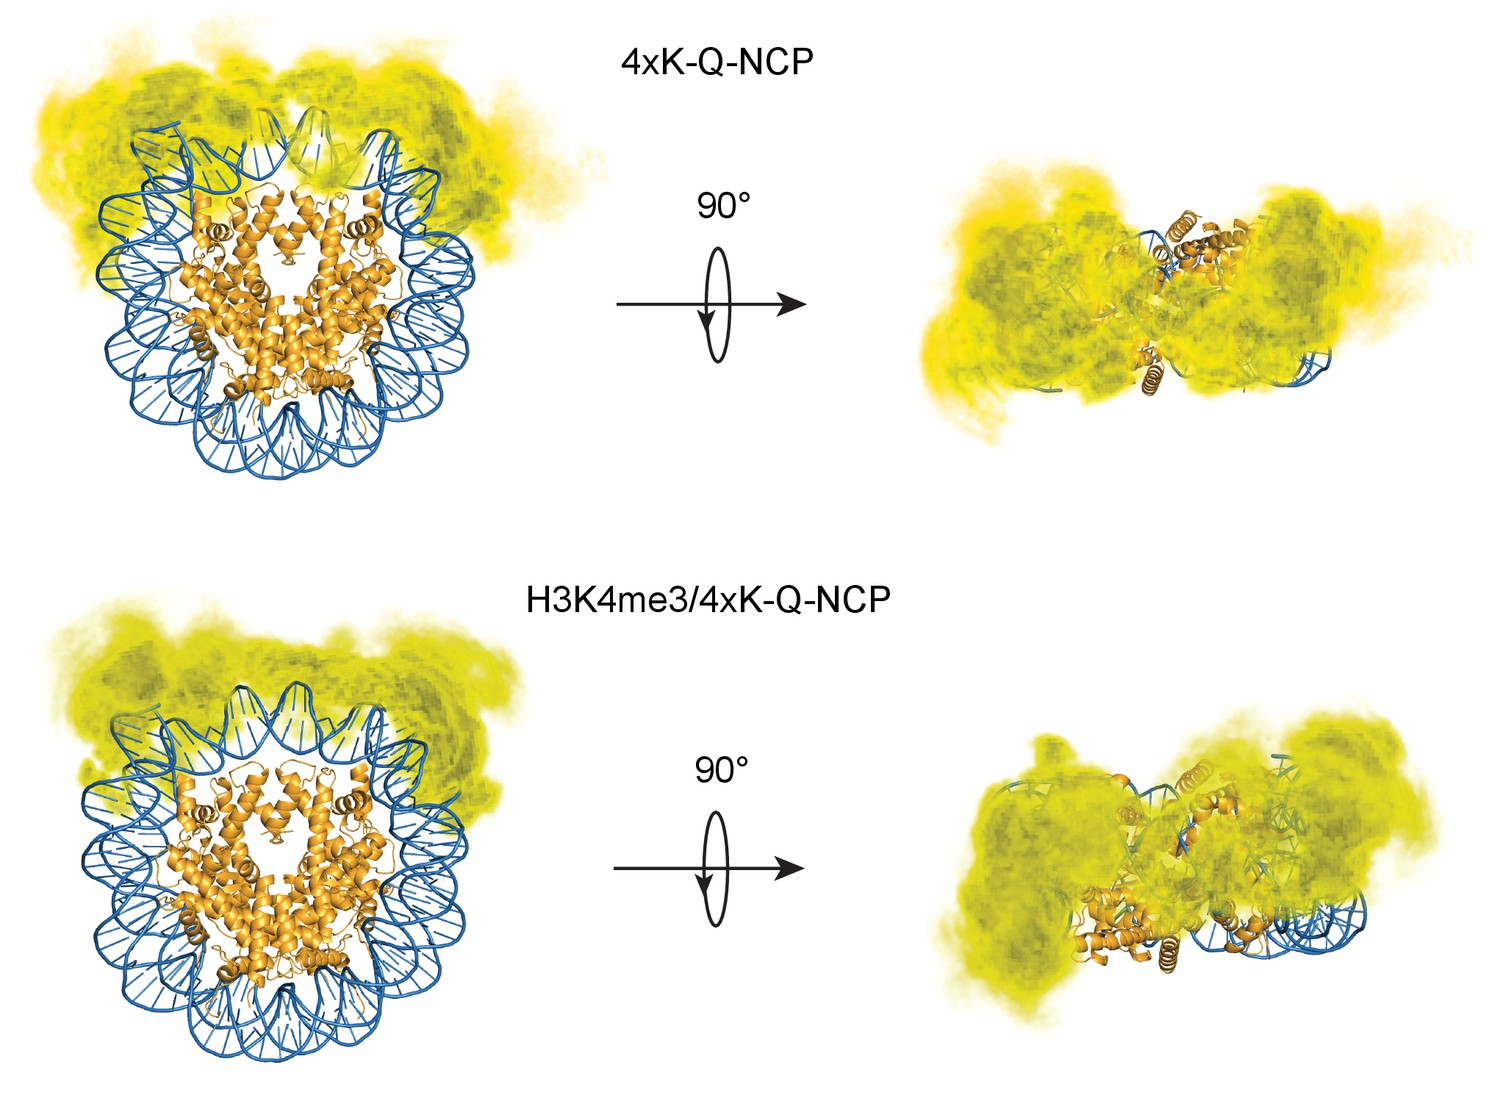
H3 tail distribution in 4XK-Q- and H3K4me3/4xK-Q-NCP.
Three-dimensional probability distribution of the locations of heavy atoms within H3 N-terminal tails for the 4XK-Q-NCP (top) and H3K4me3/4xK-Q-NCP (bottom) simulations, superimposed upon the crystal structure (PDBID 1KX5). Histones are shown in gold and DNA in blue. Darker regions represent areas of higher probability, and lighter regions depict areas of lower probability.
Figure 7—figure supplement 7
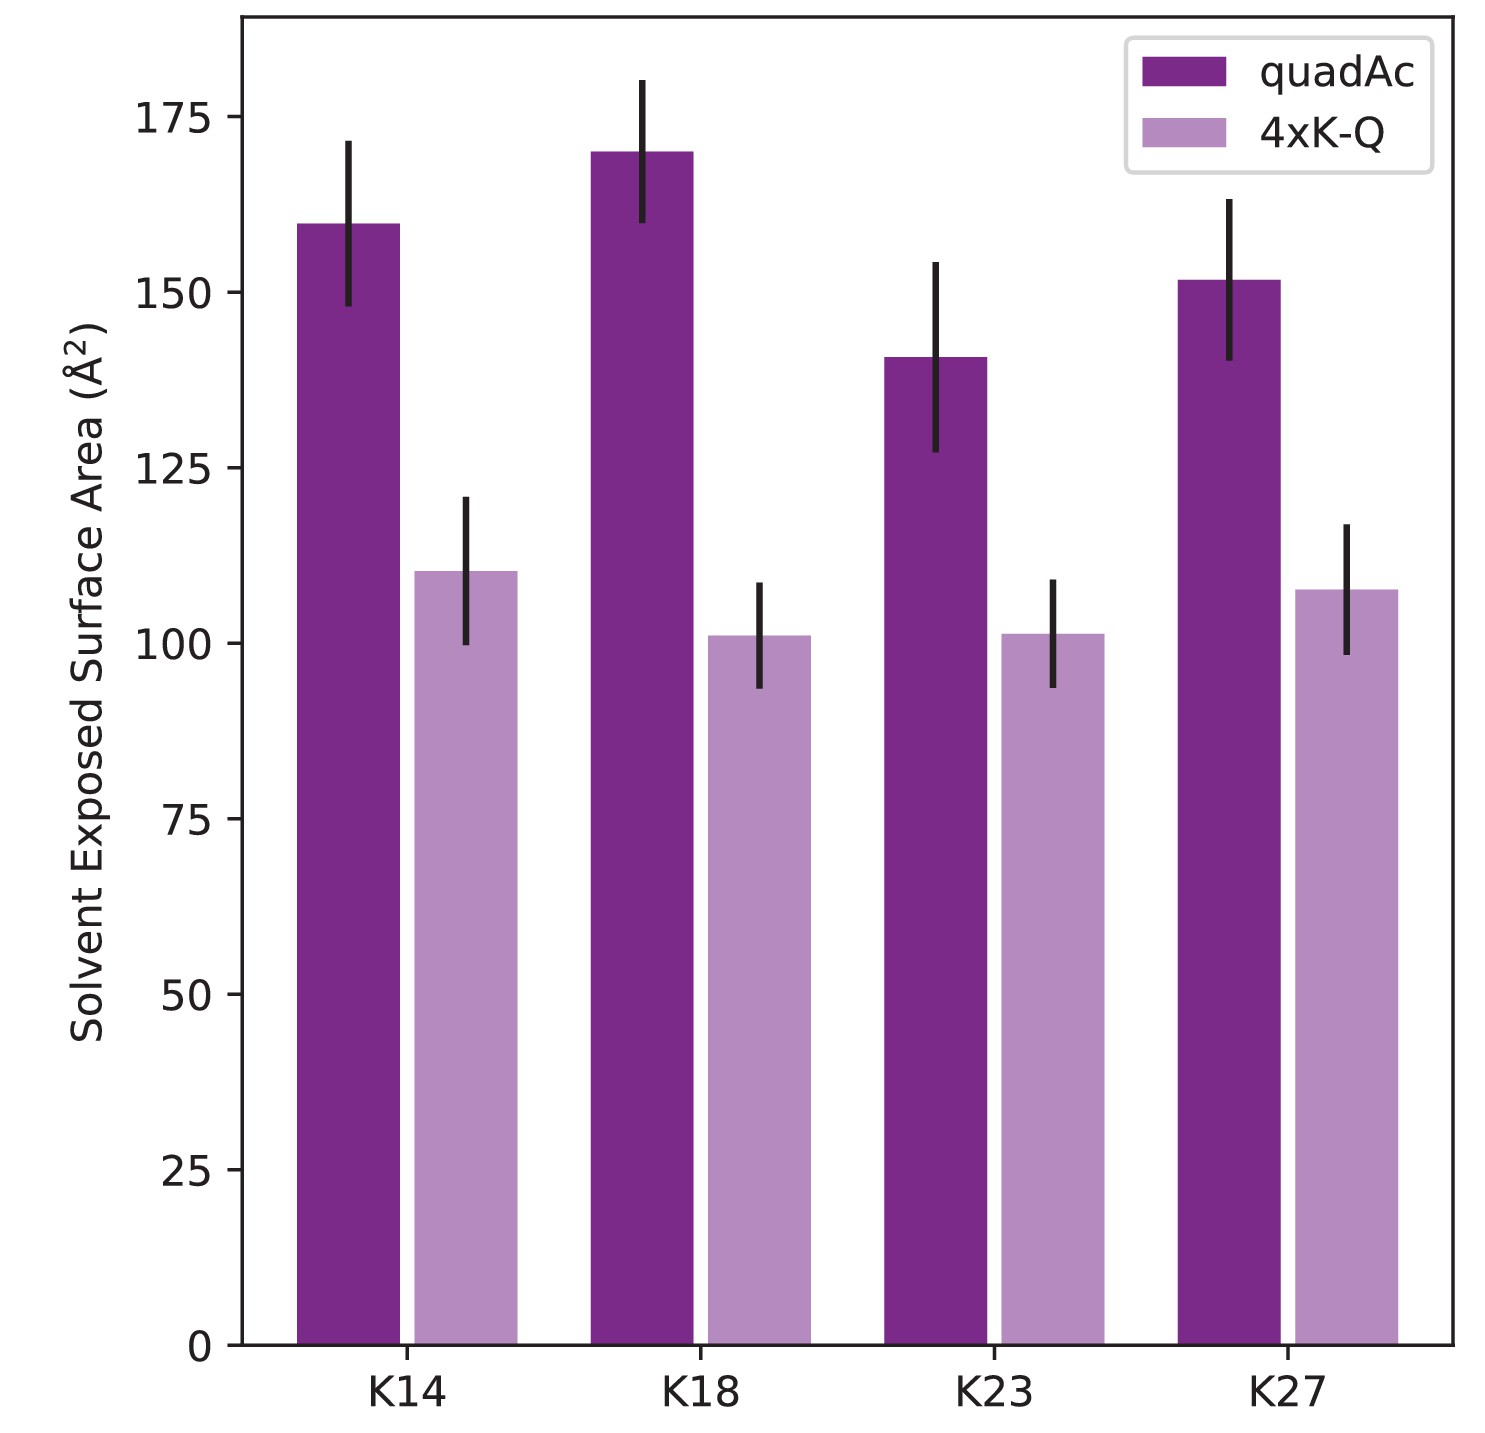
Difference in solvent-accessible surface area between acetylated lysine and glutamine.
Comparison of solvent-accessible surface area of modified/mutated lysine residues within quadAc- and 4xK-Q-NCP.
Figure 8 with 4 supplements
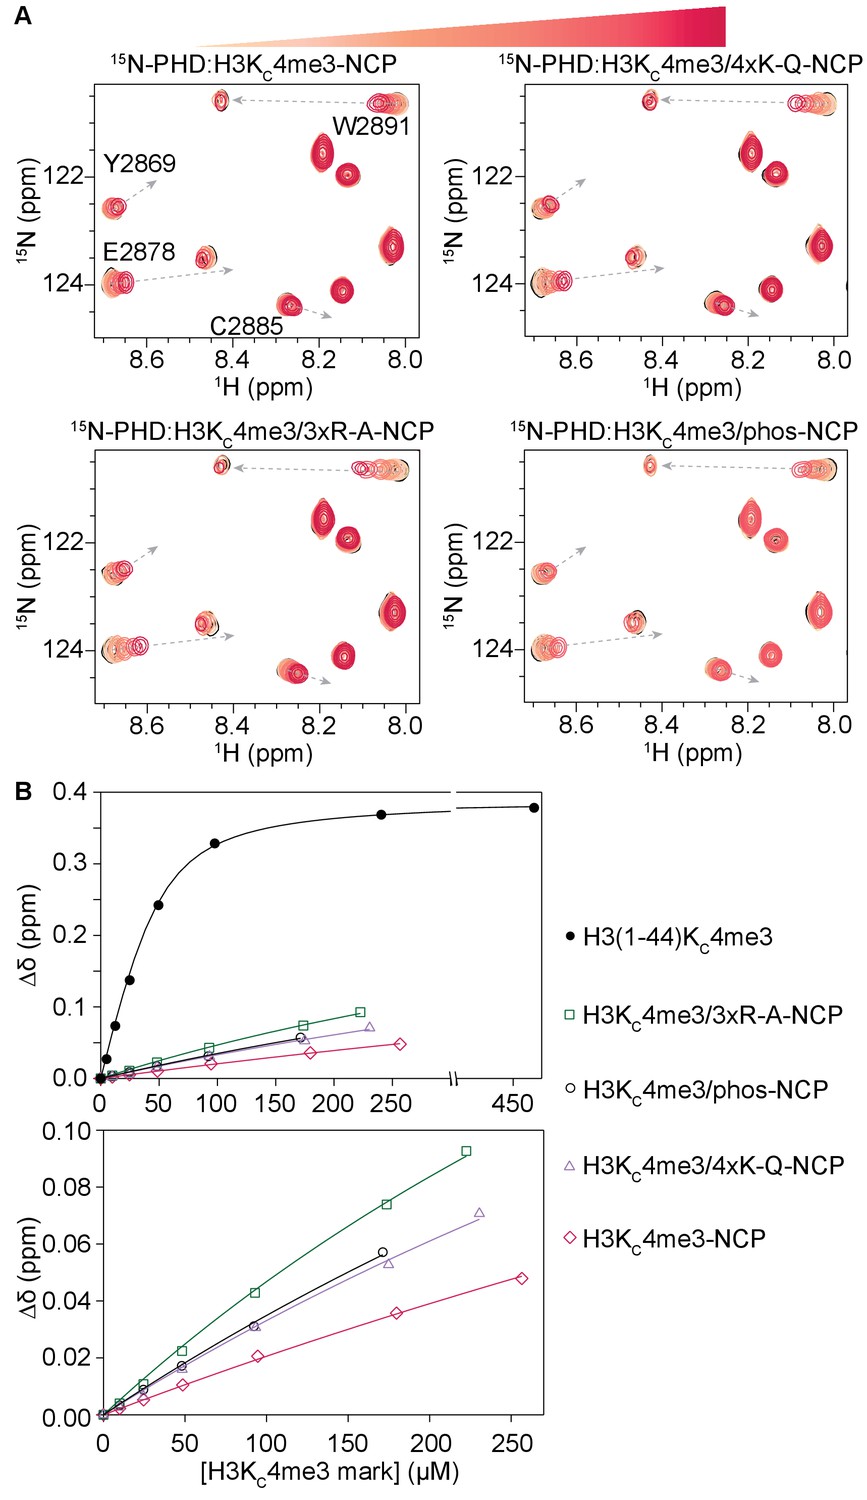
Modification of H3 tail residues remote from the binding interface with the BPTF PHD finger affects PHD finger binding.
(A) Overlay of a region of the 1H-15N TROSY HSQC spectra of 50 μM 15N-BPTF PHD upon titration of H3KC4me3-NCP containing no additional modifications, four lysine mutated to glutamine as acetyl-lysine mimetics, three arginine mutated to alanine, or phosphorylated serine on the H3 tail. Spectra are color-coded according to ligand concentration, with apo spectra in black and shades of salmon for increasing concentrations of ligand. Spectra were collected at molar ratios (PHD:H3KC4me3 mark) of 1:0, 1:0.2, 1:0.5, 1:1, 1:2 and 1:4 and additionally 1:6, 1:5.5, and 1:5.4 for H3KC4me3-, H3KC4me3/4xK-Q-, and H3KC4me3/3xR-A-NCP. Dashed, grey arrows track the trajectory between the apo and bound states for the H3KC4me3-Tail titration and are shown as visual aids for titrations with NCP, which are predicted to have the same end state. (B) CSPs (Δδ) are plotted for each H3KC4me3-NCP titration in (A) for the representative residue R2887 as a function of the concentration of the H3KC4me3 mark. The H3KC4me3-Tail titration is plotted for comparison.
Figure 8—figure supplement 1
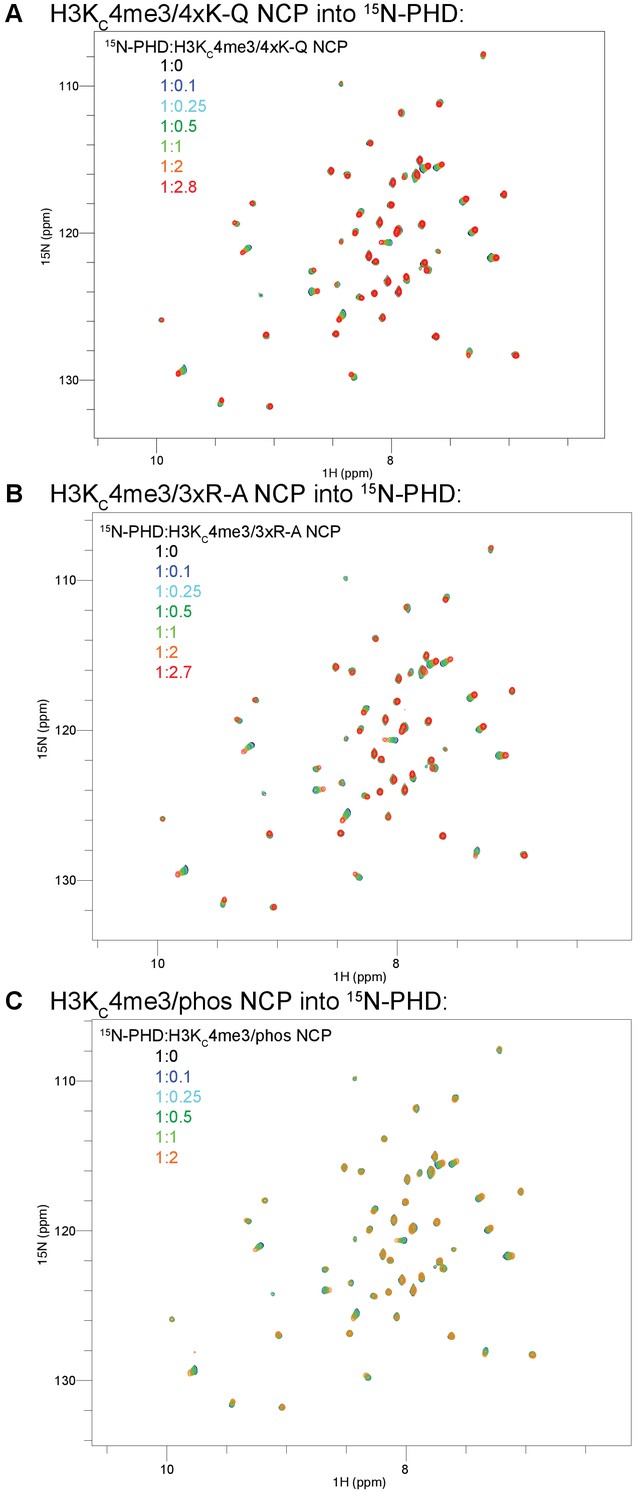
Full spectra of NCP titrations into 15N-BPTF PHD.
The full titrations from Figure 9 are shown for H3KC4me3/4xK-Q-NCP (A), H3KC4me3/3xR-A-NCP (B), and H3KC4me3/phos-NCP (C). The coloring guide is displayed on the spectra. Note that the ligand ratios are listed with respect to NCP concentration in this figure but the concentration of the H3KC4me3 mark in the main text figures.
Figure 8—figure supplement 2
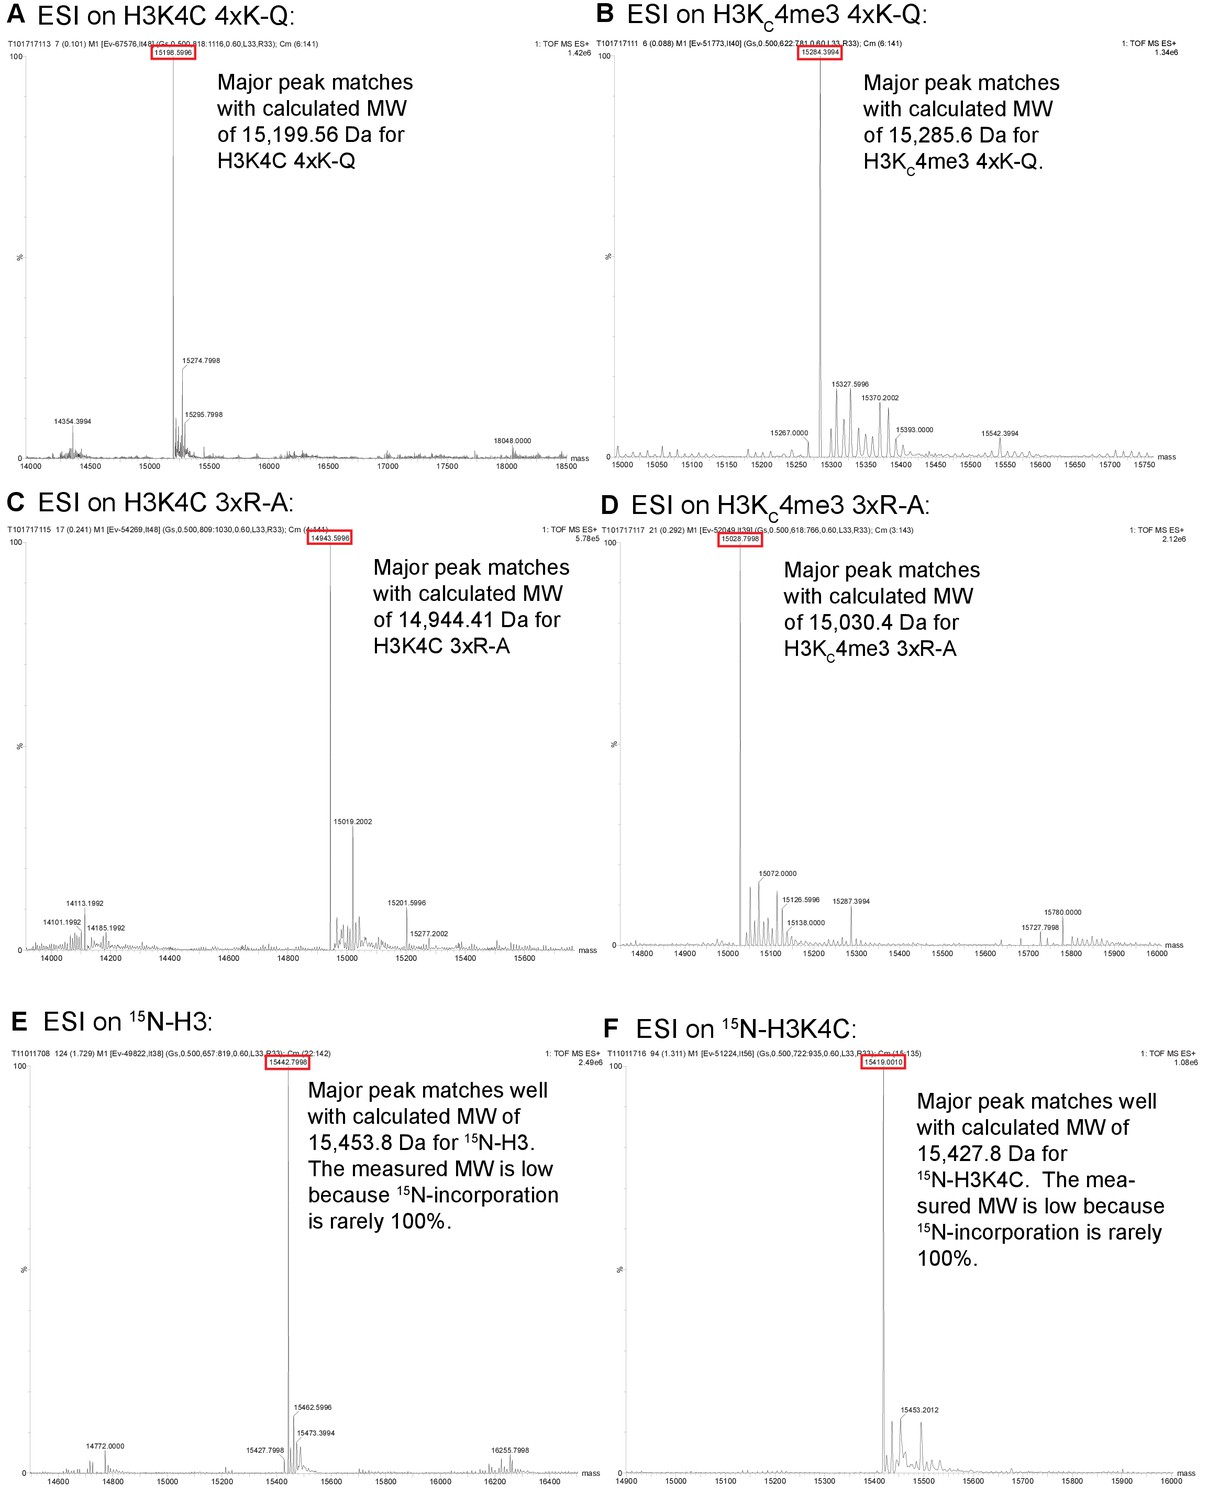
ESI data for histone constructs.
ESI mass spectrometry data is shown for unmodified and alkylated versions of histone H3 to confirm the lack of carbamylation and the proper alkylation for the MLA. The constructs are: unalkylated and alkylated H3K4C/4xK-Q (A,B), unalkylated and alkylated H3K4C/3xR-A (C,D), 15N-H3 (E), and 15N-H3K4C (F).
Figure 8—figure supplement 3
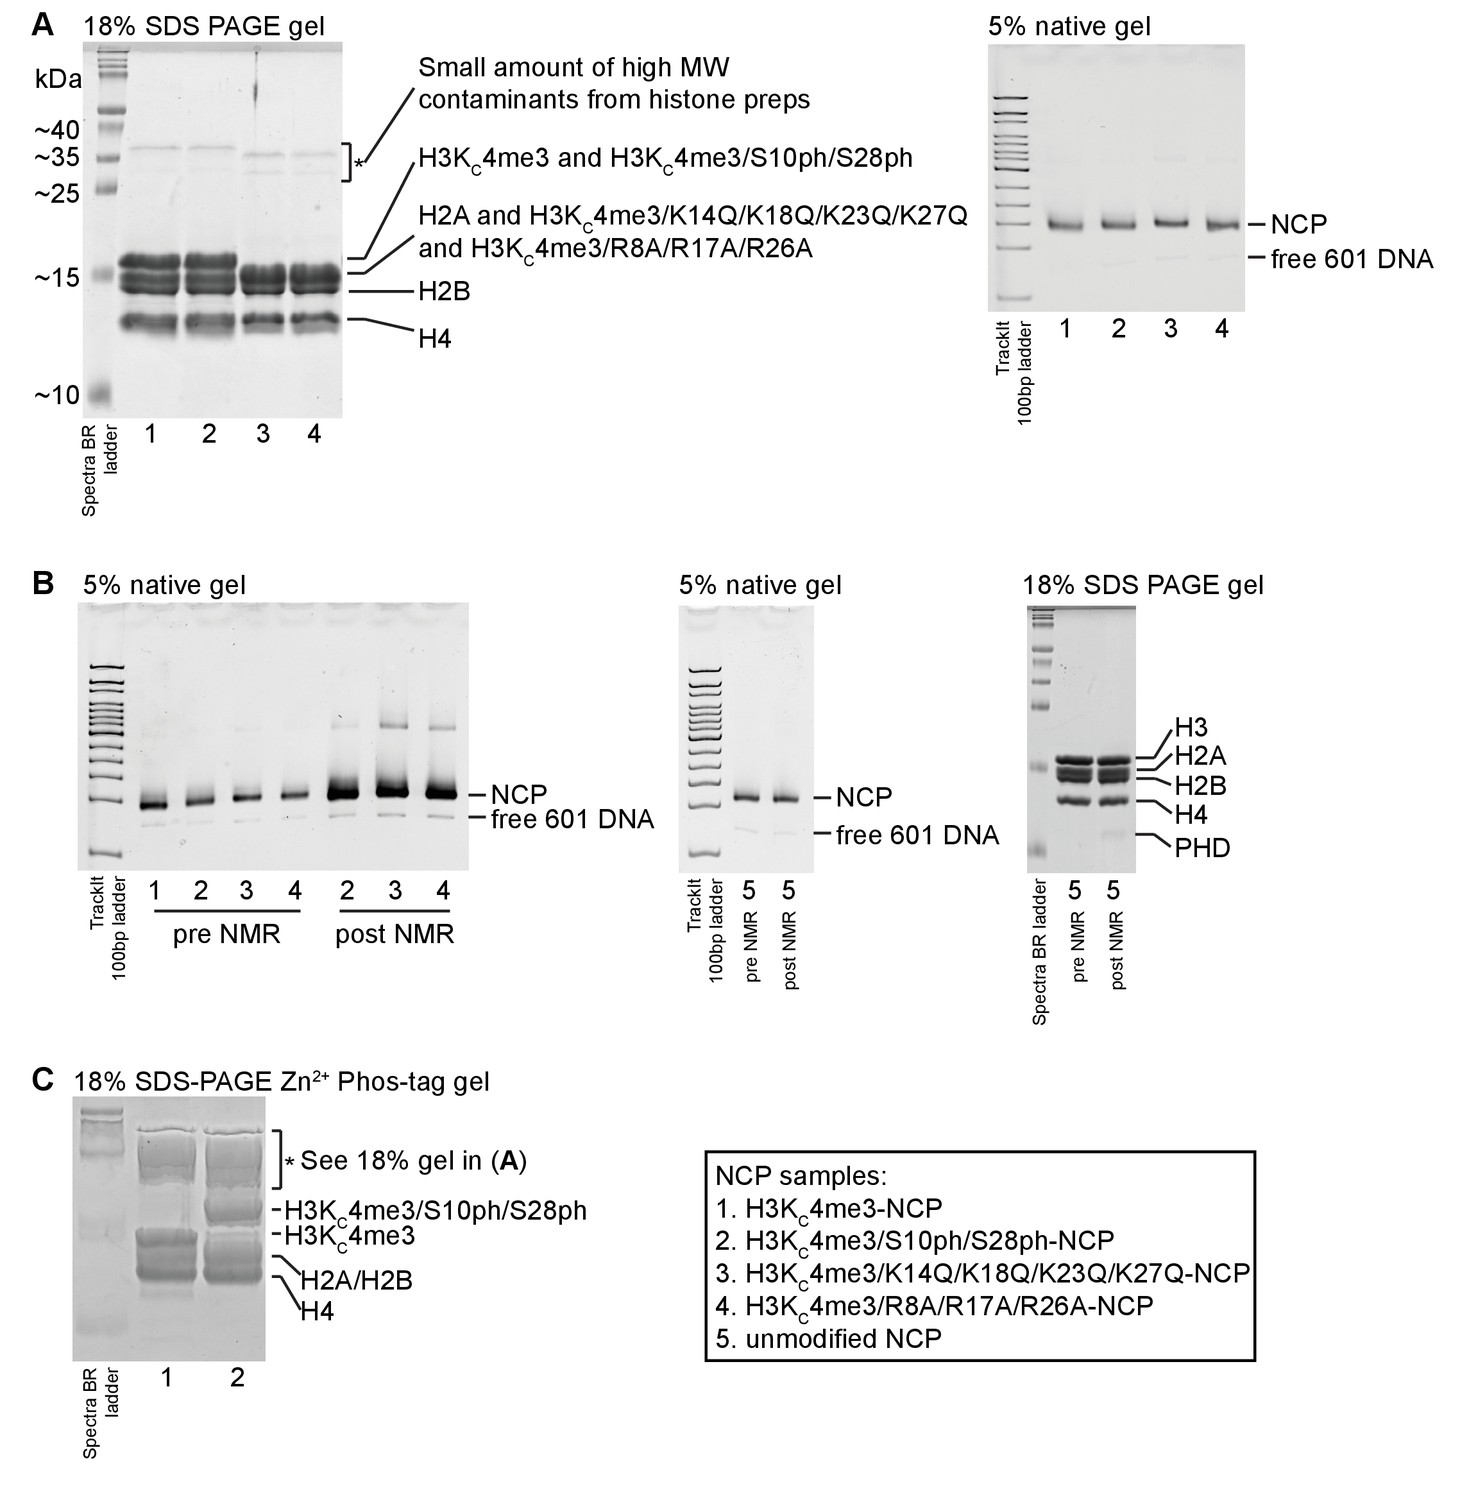
Gel characterization of NCP samples.
(A) A representative 18% SDS-PAGE gel on NCP samples is shown. The 18% tris gel was run in Tris/glycine/SDS running buffer. Spectra Multicolor Broad Range Protein Ladder (ThermoFisher Scientific) was run alongside NCP samples. The histones are labeled. The H3KC4me3/4xK-Q and H3KC4me3/3xR-A histone mutants migrate faster on the gel (likely due to the change in charge composition) and are not resolved from H2A. A small amount of high molecular weight contaminants from the histone preps is visible and marked (*). Additionally, a representative 5% 75:1 acrylamide/bisacrylamide native gel run is shown. The gel was made and run in 0.2x TBE with TrackIt 100 bp DNA ladder (ThermoFisher Scientific) for reference. The gel was run on ice for 50 min at 125V and visualized via ethidium bromide staining. The NCP prepared with different H3 mutants and modifications are not distinguishable under these conditions. A small amount of free 601 DNA (which stains better than DNA within NCP) always remains after the sucrose gradient purification. (B). Native gels run on different NCP samples before and after NMR titrations show that the NCP remains intact over the course of the experiments. Note that different amounts of NCP were loaded on the left-most gel. Equal amounts of NCP were loaded before and after the NMR titration for the unmodified NCP (center gel). A denaturing gel run with the unmodified NCP shows that the histones were not degraded over the course of the NMR titration. (C). An 18% SDS-PAGE gel was prepared with 50 μM Zn2+-Phos-tag acrylamide AAL-107 in order to assess the degree of phosphorylation by AurB. The Spectra BR ladder is simply provided for reference; proteins are known to run slower and differently using Phos-tag acrylamide such that molecular weight estimation is no longer possible. The Phos-tag gel appears to smear and accentuate the high molecular contaminants (*), which might also be due to the 601 DNA present in the sample and running at a similar position as the contaminants. See the comparison with the standard 18% SDS-PAGE gel in (A). The gel indicates that the majority of the H3 component was phosphorylated by AurB in the H3KC4me3/S10ph/S28ph-NCP sample. The different NCP samples are numbered as shown in the legend.
Figure 8—figure supplement 4
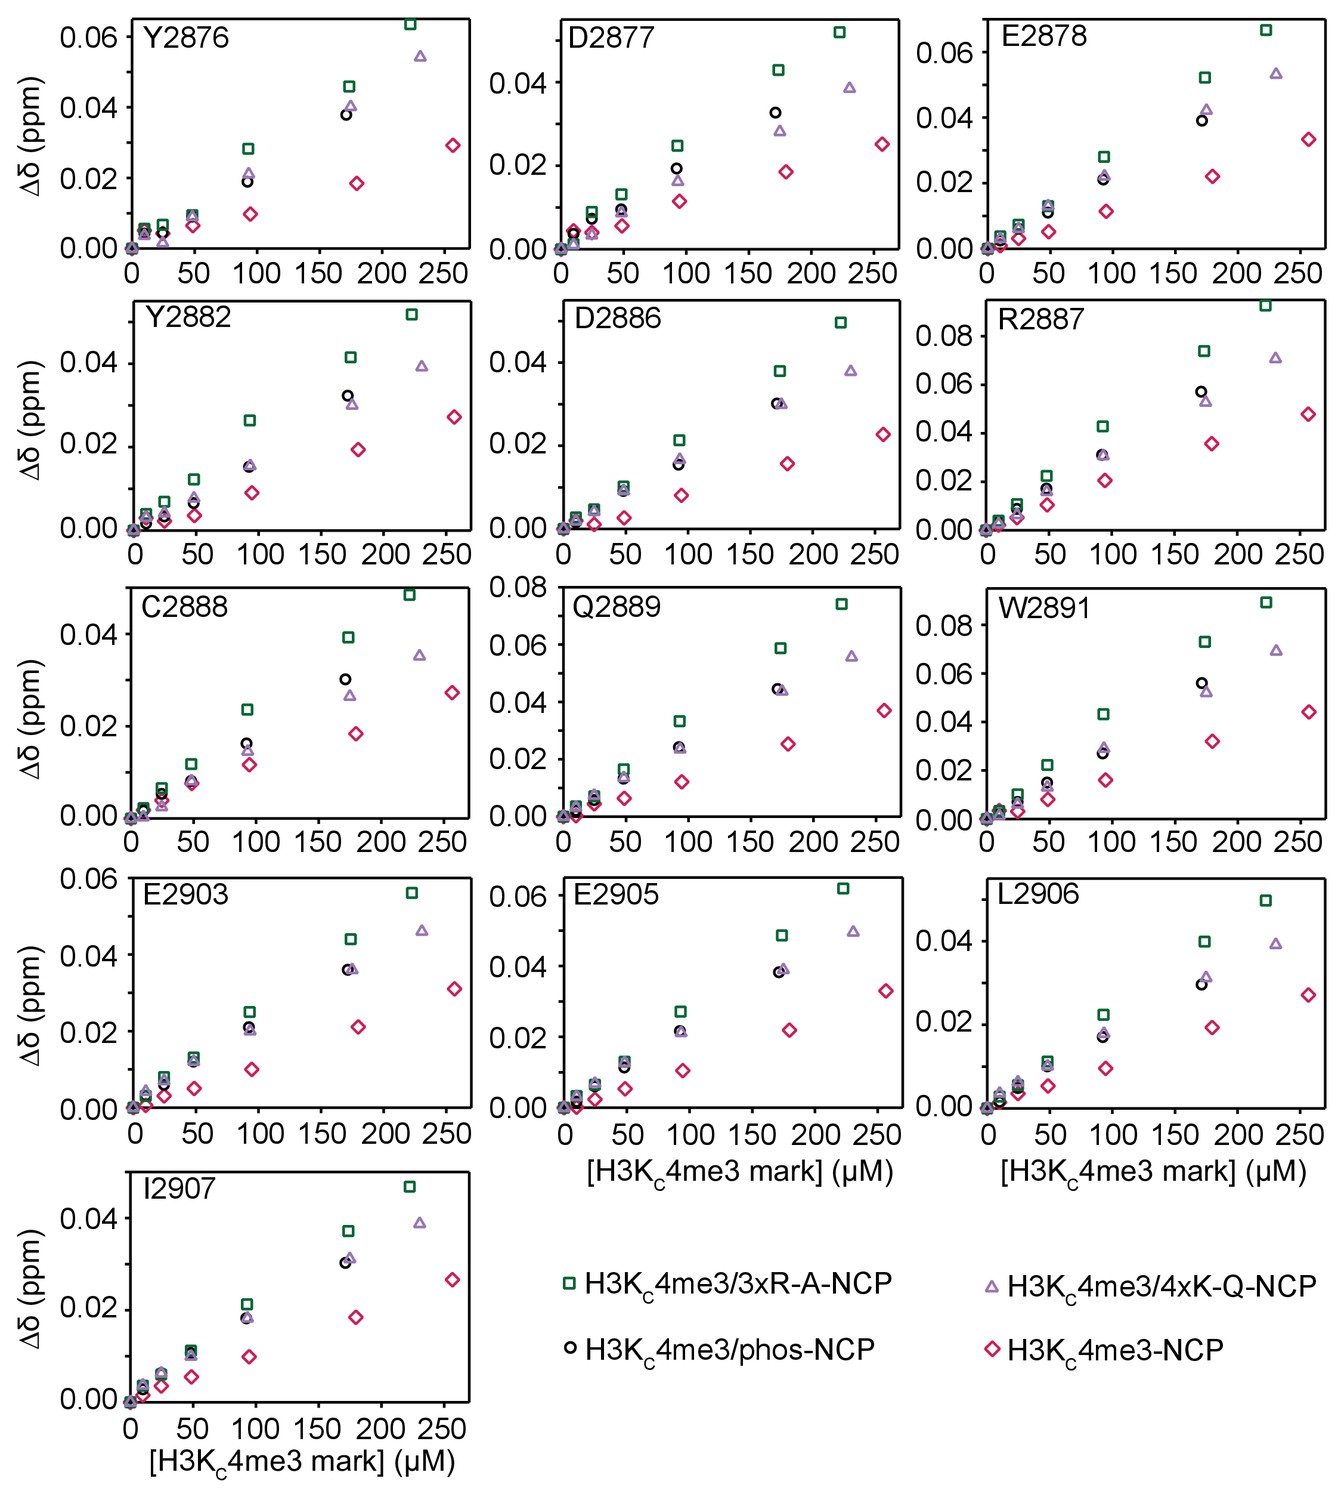
Modification of H3 tail residues outside of the BPTF PHD finger binding region affects the H3/PHD interaction.
CSPs (Δδ) are plotted as a function of the concentration of H3KC4me3 mark for the titrations of H3KC4me3-NCP (raspberry diamonds), H3KC4me3/4xK-Q-NCP (lavender triangles), H3KC4me3/3xR-A-NCP (dark green squares), and H3KC4me3/S10ph/S28ph-NCP (black circles) into 15N-BPTF PHD shown in Figure 9 and Figure 8 and Figure 8—figure supplement 1. The plots show that the trend in binding holds for all 13 significantly perturbed residues.
Figure 9

Model of the H3 tail conformational ensemble and effect on PHD finger binding.
(A) Conglomeration of histone tail conformations (gold) from all simulations of the unmodified NCP compacted upon the core DNA surface (blue). (B) Cartoon model depicting the simplified linked equilibria between the collapsed, autoinhibited state (favored) and extended, accessible state that is permissive to PHD finger binding. The extended and collapsed states are ensembles of conformations as denoted by n, m, and m’. Note that each histone tail is likely in equilibrium between collapsed, partially extended, and extended conformations. We do not intend to indicate cooperativity between the equilibria of individual tails as this is unknown; distinct ensembles are depicted only for simplicity. We expect that the energetics of these ensembles may be perturbed by a number of nuclear factors, including histone PTMs. (C) The data provided predicts that higher order PTM crosstalk, or the modification of residues remote from the region directly recognized by the histone effector domain, can perturb the energetics of the system, thereby shifting the conformational pre-equilibrium and altering the observed binding affinity. Specifically, the neutralization of lysine or arginine side chains or the addition of negatively charged groups such as by phosphorylation of serine or threonine side chains result in a tighter observed binding affinity.
Videos
Video 1
End states of histone H3 tails from unmodified-NCP simulations.
Protein backbone arrangement is shown in dark blue, while sidechains are represented as orange sticks. Sidechains interact with both DNA backbones (cyan and turquoise), as well as within both the major and minor grooves (grey), through a variety of conformations.
Video 2
End states of histone H3 tails from H3K4me3-NCP simulations.
Protein backbone arrangement is shown in dark blue, while sidechains are represented as orange sticks. Sidechains interact with both DNA backbones (cyan and turquoise), as well as within both the major and minor grooves (grey), through a variety of conformations.
Video 3
End states of histone H3 tails from quadAc-NCP simulations.
Protein backbone arrangement is shown in dark blue, while sidechains are represented as orange sticks. Sidechains interact with both DNA backbones (cyan and turquoise), as well as within both the major and minor grooves (grey), through a variety of conformations.
Video 4
End states of the histone H3 tails from the H3K4me3/3xR-A-NCP simulations.
Protein arrangement is shown in dark blue, while sidechains are represented as orange sticks. Sidechains interact with both DNA backbones (cyan and turquoise), as well as within both the major and minor grooves (grey), through a variety of conformations.
Video 5
End states of the histone H3 tails from 4xK-Q-NCP simulations.
Protein backbone arrangement is shown in dark blue, while sidechains are represented as orange sticks. Sidechains interact with both DNA backbones (cyan and turquoise), as well as within both the major and minor grooves (grey), through a variety of conformations.
Video 6
End states of the histone H3 tails from the H3K4me3/4xK-Q-NCP simulations.
Protein arrangement is shown in dark blue, while sidechains are represented as orange sticks. Sidechains interact with both DNA backbones (cyan and turquoise), as well as within both the major and minor grooves (grey), through a variety of conformations.
Tables
Table 1
Measured quantities for the NCP simulations conducted in this study.
https://doi.org/10.7554/eLife.31481.015| Modification | Initial tails | Rg (Å) | ΔGDNA-tail (kcal/mol) | % Helicity | % Sheet | Solvent exposed area (Å2) |
|---|---|---|---|---|---|---|
| Unmodified | 1KX5 | 24.8 ± 0.6 | −76.8 ± 6.2 | 6.1% | 2.3% | 2514 ± 61 |
| linear | 25.1 ± 0.6 | −62.5 ± 7.1 | 6.8% | 4.0% | 2674 ± 83 | |
| MODELLER | 25.6 ± 0.6 | −73.1 ± 6.6 | 3.0% | 2.3% | 2680 ± 62 | |
| Total | 25.2 ± 0.3 | −70.8 ± 4.0 | 5.3% | 2.9% | 2623 ± 42 | |
| H3K4me3 | 1KX5 | 25.0 ± 0.5 | −82.2 ± 5.8 | 4.7% | 0.5% | 2562 ± 83 |
| linear | 24.9 ± 0.4 | −76.3 ± 7.1 | 5.0% | 1.1% | 2697 ± 76 | |
| MODELLER | 26.1 ± 0.6 | −57.6 ± 5.3 | 7.8% | 3.3% | 2888 ± 60 | |
| Total | 25.3 ± 0.3 | −72.0 ± 4.0 | 5.8% | 1.7% | 2716 ± 48 | |
| quadAc | 1KX5 | 26.5 ± 0.5 | −54.8 ± 2.8 | 5.3% | 3.2% | 2914 ± 62 |
| Linear | 25.5 ± 0.6 | −53.8 ± 5.9 | 5.0% | 2.9% | 3002 ± 68 | |
| MODELLER | 26.4 ± 0.4 | −47.6 ± 4.3 | 7.3% | 3.9% | 2867 ± 78 | |
| Total | 26.1 ± 0.3 | −52.1 ± 2.7 | 5.9% | 3.3% | 2928 ± 42 | |
| 4xK-Q | 1KX5 | 26.0 ± 0.4 | −59.3 ± 4.3 | 6.6% | 1.4% | 2666 ± 58 |
| Linear | 24.6 ± 0.5 | −52.3 ± 5.1 | 6.1% | 3.7% | 2736 ± 44 | |
| MODELLER | 25.4 ± 0.5 | −57.6 ± 5.3 | 4.5% | 3.3% | 2733 ± 71 | |
| Total | 25.3 ± 0.3 | −55.2 ± 2.9 | 5.7% | 2.8% | 2712 ± 34 | |
| H3K4me3/4xK-Q | 1KX5 | 25.5 ± 0.5 | −65.4 ± 5.6 | 8.0% | 0.9% | 2744 ± 55 |
| Linear | 25.3 ± 0.5 | −57.3 ± 5.6 | 5.9% | 3.7% | 2798 ± 88 | |
| MODELLER | 26.6 ± 0.5 | −50.3 ± 6.1 | 3.6% | 4.3% | 2784 ± 59 | |
| Total | 25.8 ± 0.3 | −57.7 ± 2.7 | 5.8% | 2.9% | 2775 ± 40 | |
| H3K4me3/3xR-A | 1KX5 | 25.3 ± 0.6 | −55.1 ± 3.9 | 7.8% | 1.9% | 2461 ± 52 |
| Linear | 25.1 ± 0.6 | −38.9 ± 3.9 | 10.6% | 1.7% | 2567 ± 79 | |
| MODELLER | 25.7 ± 0.6 | −41.4 ± 4.2 | 8.0% | 2.4% | 2574 ± 60 | |
| Total | 25.4 ± 0.6 | −45.7 ± 2.7 | 8.8% | 2.0% | 2534 ± 39 |
Additional files
-
Transparent reporting form
- https://doi.org/10.7554/eLife.31481.042
Download links
A two-part list of links to download the article, or parts of the article, in various formats.
Downloads (link to download the article as PDF)
Open citations (links to open the citations from this article in various online reference manager services)
Cite this article (links to download the citations from this article in formats compatible with various reference manager tools)
The conformation of the histone H3 tail inhibits association of the BPTF PHD finger with the nucleosome
eLife 7:e31481.
https://doi.org/10.7554/eLife.31481


