Diverse functions of homologous actin isoforms are defined by their nucleotide, rather than their amino acid sequence
- University of Pennsylvania, United States
- National Institutes of Health, United States
- Perelman School of Medicine, University of Pennsylvania, United States
Figures
Figure 1 with 2 supplements
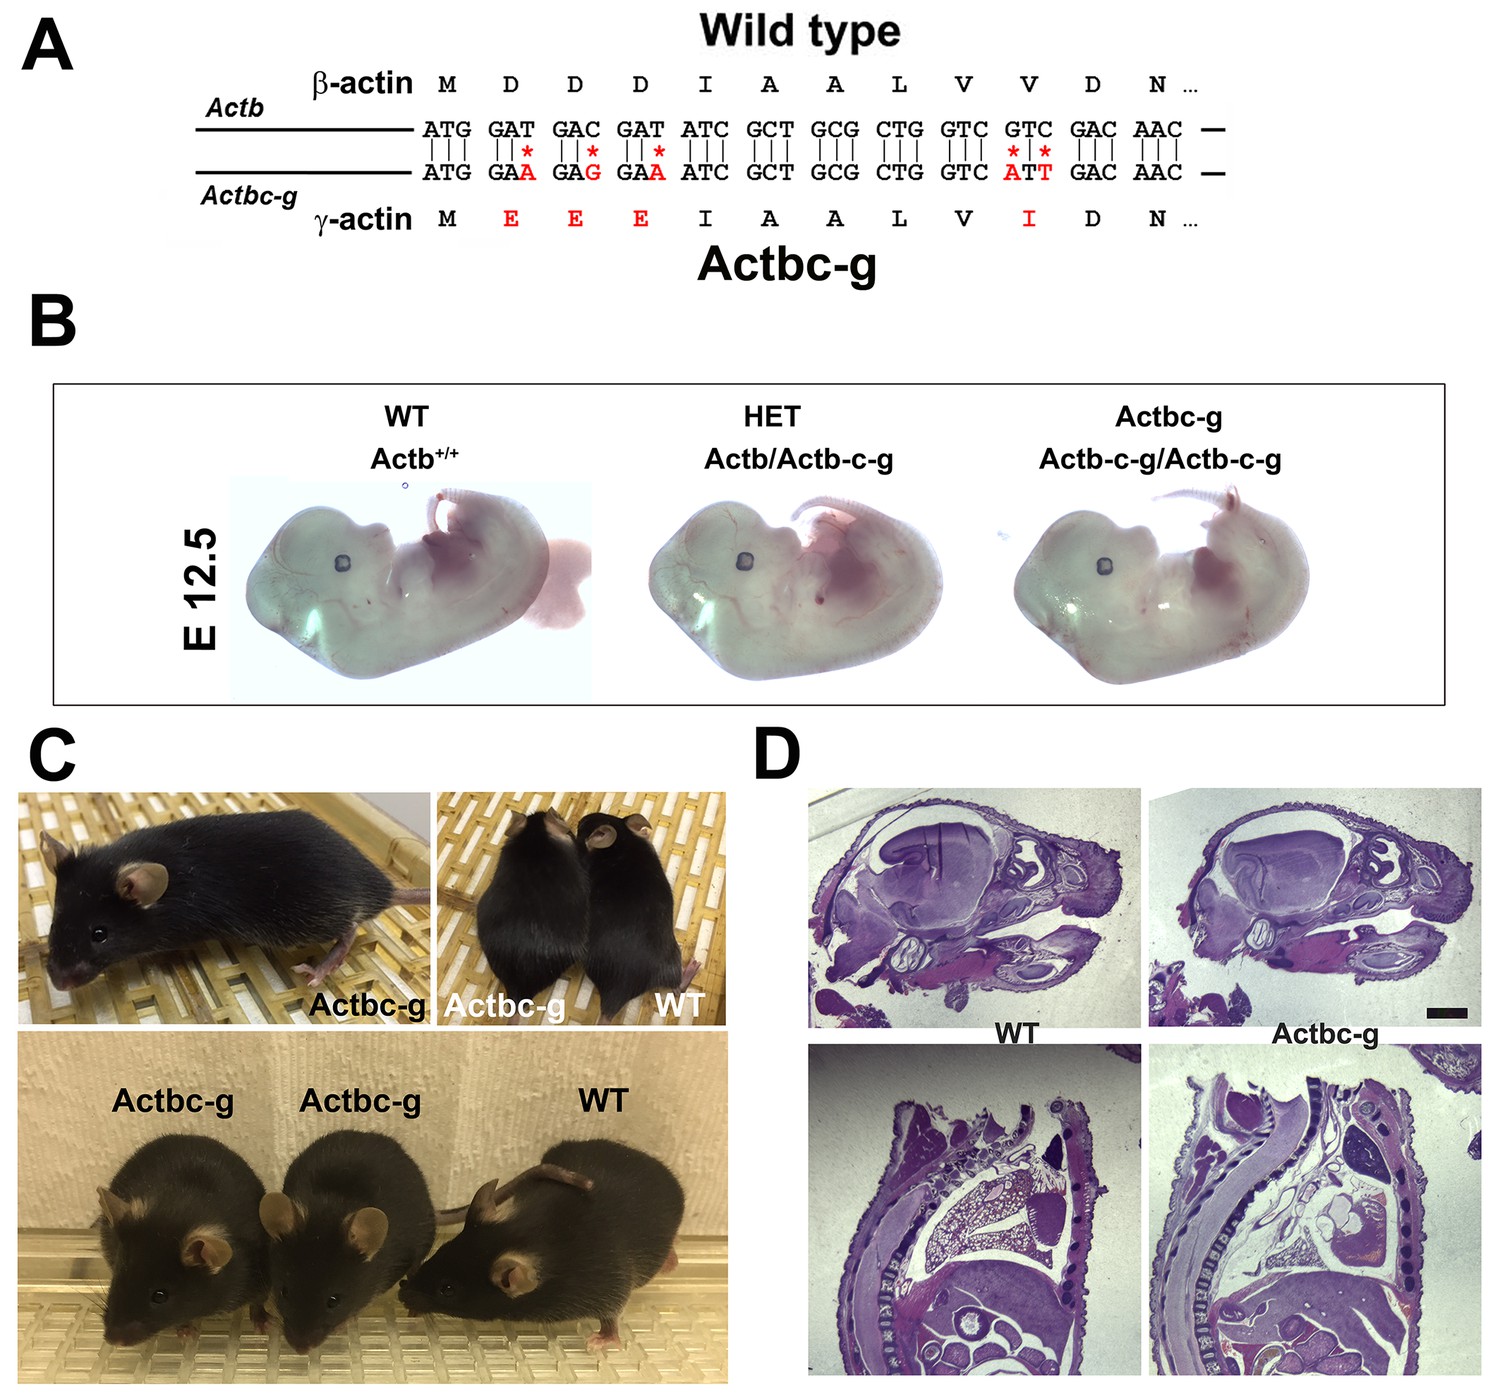
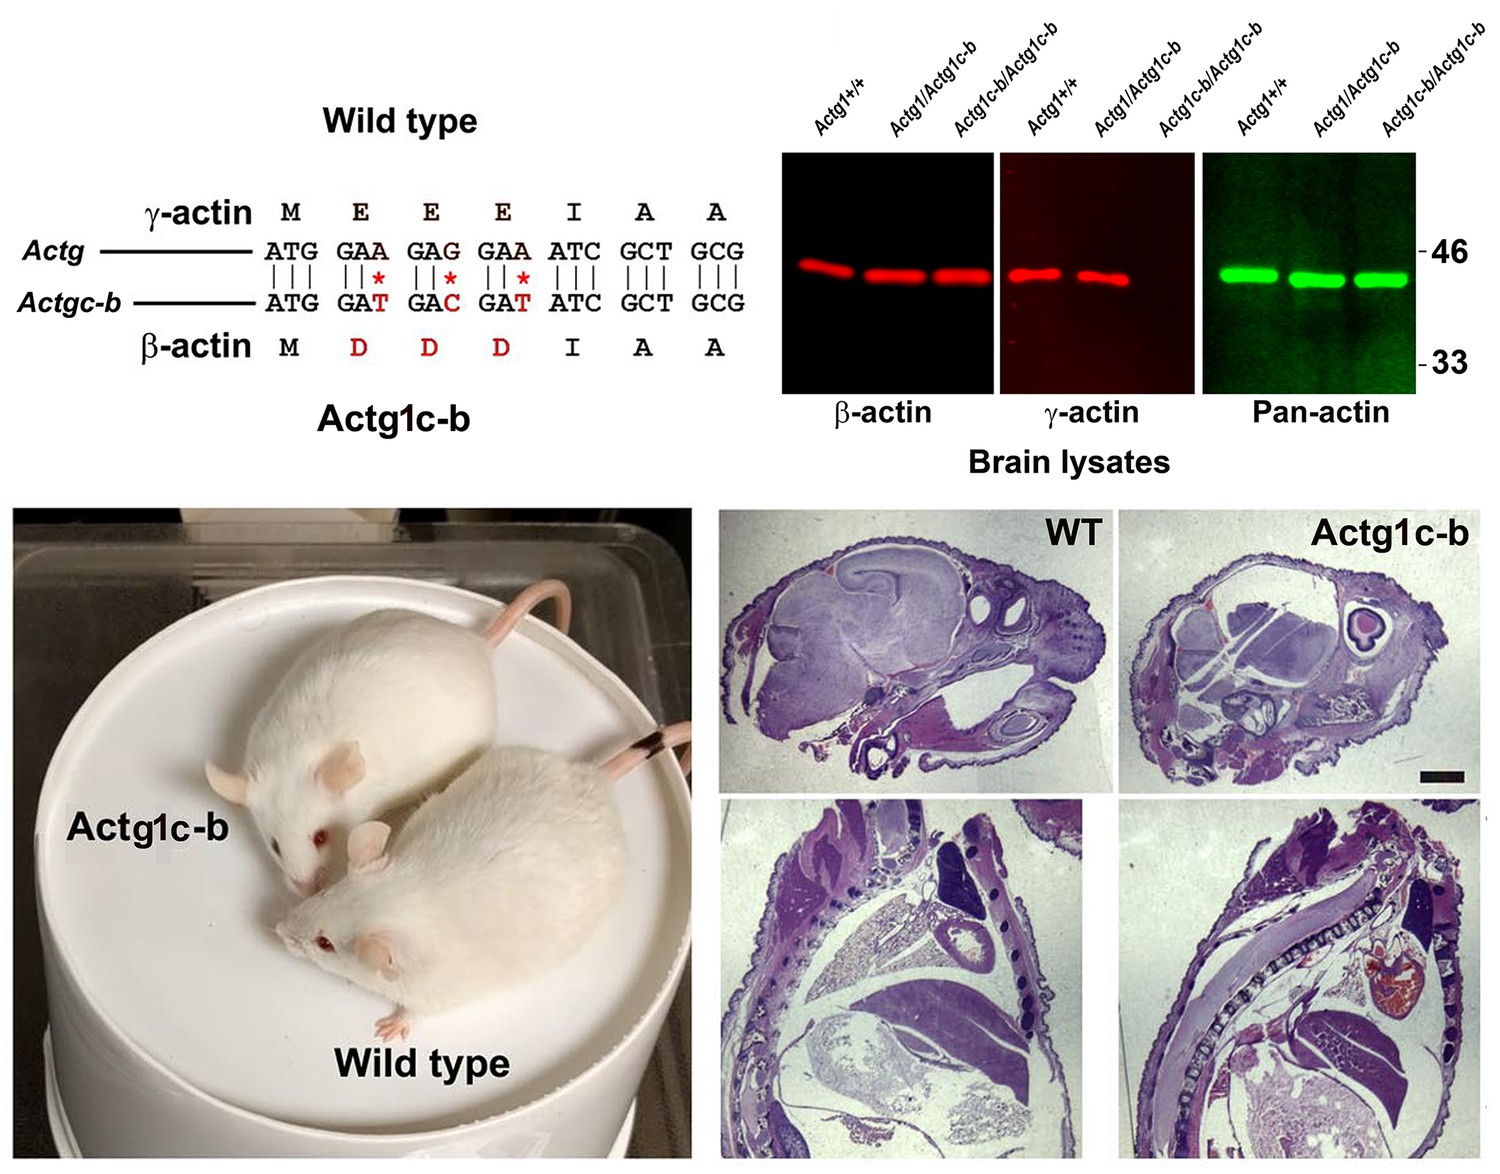
β -coded γ -actin (Actbc-g) mice exhibit no phenotypic changes compared to control.
(A) CRISPR/Cas9 editing strategy used to generate Actbc-g mouse. (B) photos of Actbc-g E12.5 mouse embryos, with genotypes indicated. (C) photos of Actbc-g mice after gene editing, alone (top left) and next to age-matched (top right) and littermate wild type (WT) (bottom). Three mice from two different litters are shown. (D) H&E-stained sagittal sections of the heads (top) and bodies (bottom) of littermate P0 wild type (WT) and Actbc-g mice. Scale bar, 1 mm.
Figure 1—figure supplement 1
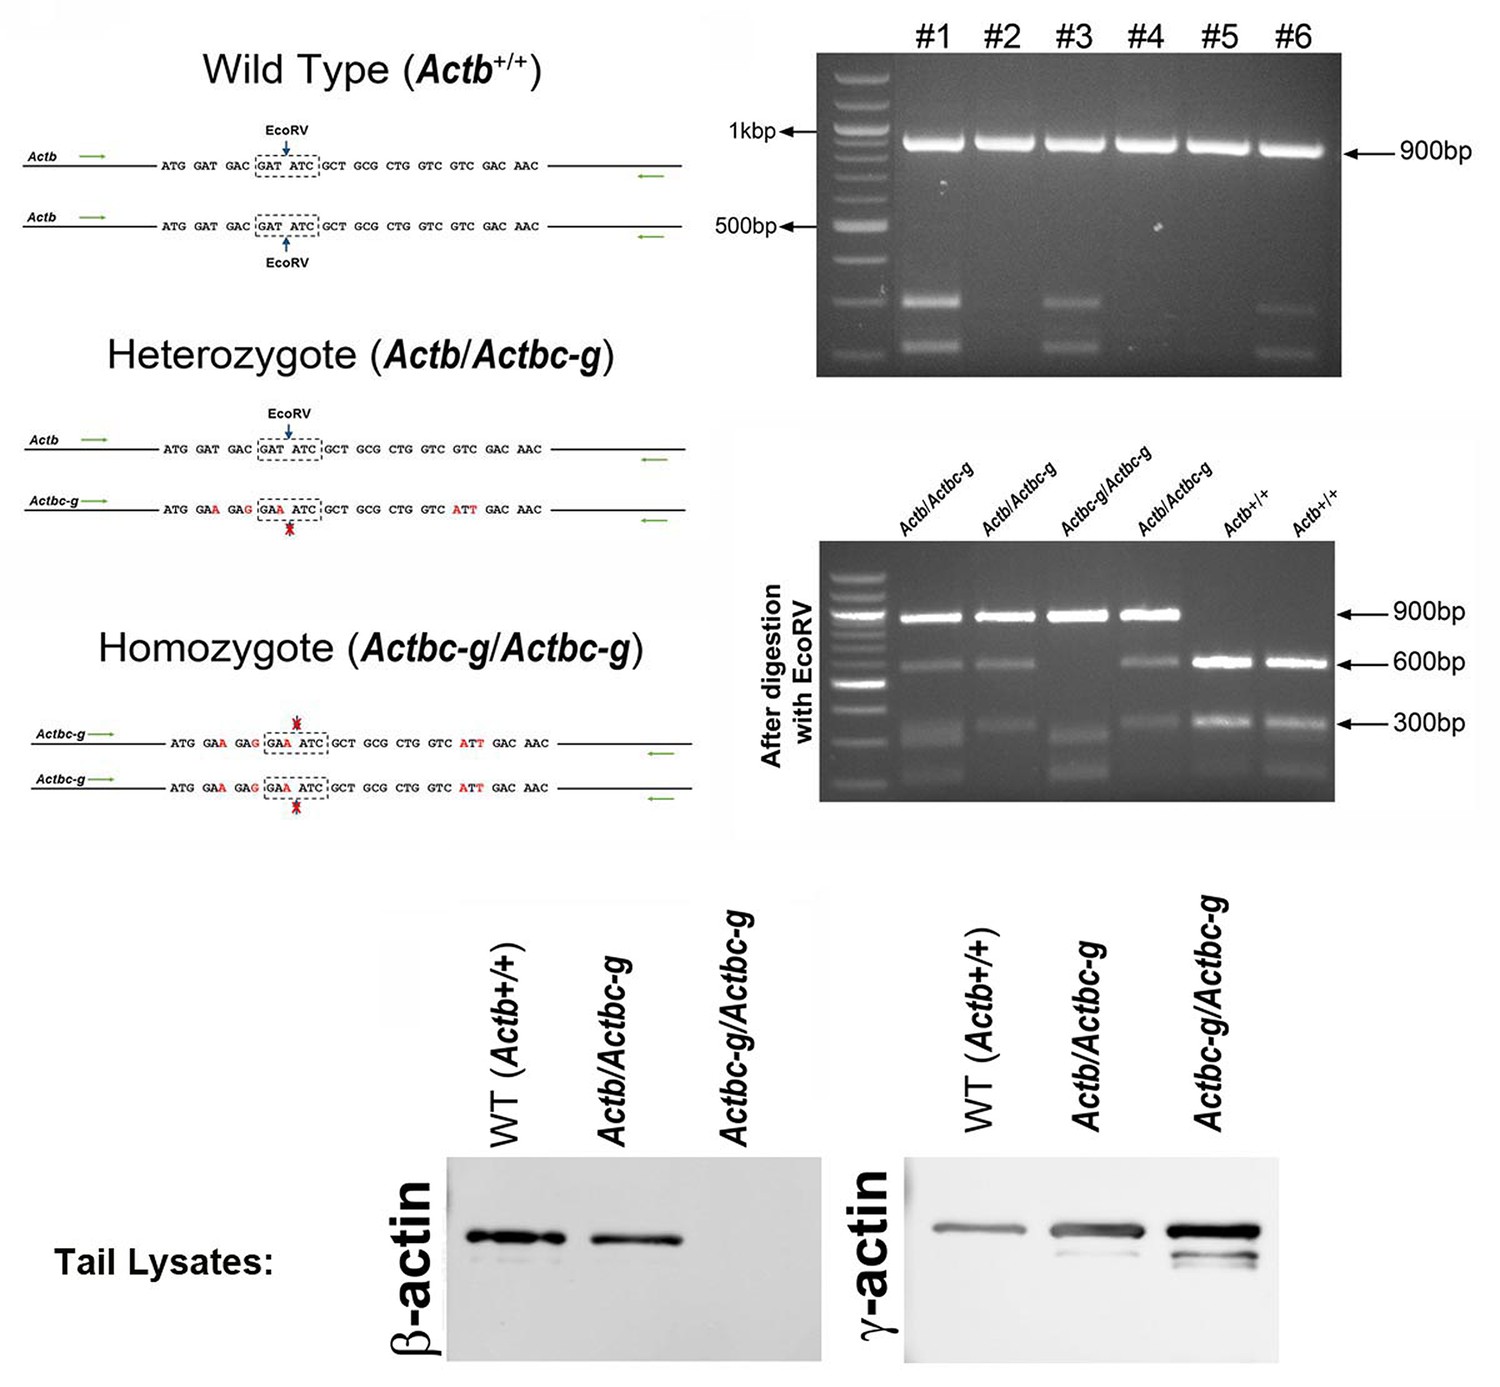
Generation of Actbc-g mouse.
Top left, genotyping strategy: editing of the N-terminal codons of the β-actin gene abolishes an EcoRV restriction site, enabling the screening of the edited gene variants by EcoRV digestion of the PCR-generated DNA fragments corresponding to the 5′ of the actin sequence. Top right, PCR products before (top) and after (bottom) EcoRV digestion. Bottom, western blots of wild type, heterozygous, and Actbc-g mouse tail lysates with antibodies to β- and γ- actin.
Figure 1—figure supplement 2
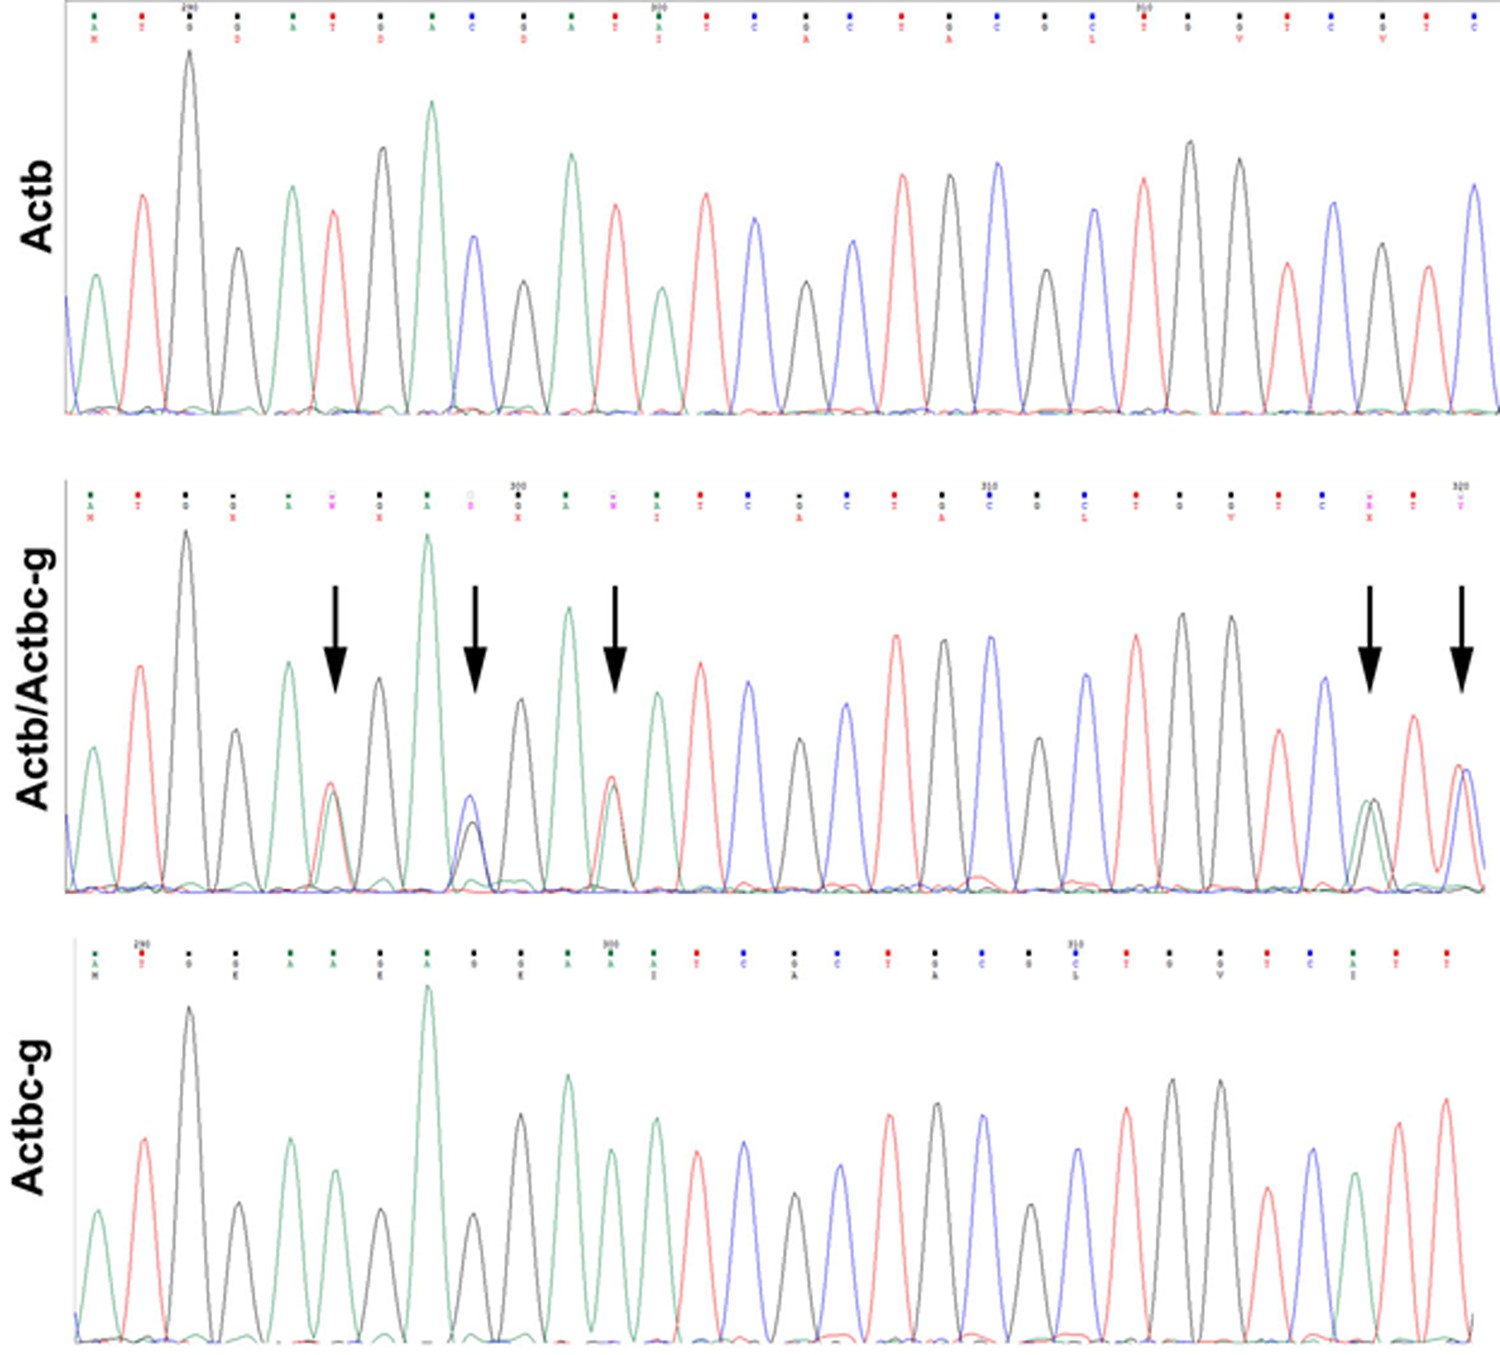
Sequencing result for wild type Actb and the edited Actbc-g alleles.
Screen shots from the Chromas sequence viewing software.
Figure 2 with 5 supplements

Actb gene editing abolishes β-actin protein from multiple organs and is accompanied by up-regulation of γ-actin without changing the total actin levels.
Western blot analysis showing images (left) and quantifications (right) of whole tissue lysates from wild type (Actb+/+) and Actbcg mice. Fluorescence images obtained from the Odyssey gel imager are shown. For quantification, total fluorescence from the 43 kDa actin band was normalized to the loading control and to the actin level in the first lane for each blot. Error bars represent SEM, n = 3.
Figure 2—figure supplement 1

Actin levels in Actbc-g mice are similar to control.
Western blots of wild type, heterozygous, and Actbc-g mouse brain lysates probed with antibodies to β- and γ-actin and total actin (pan-actin). Mouse genotypes are indicated on top of each lane, and the antibodies used are listed below each blot.
Figure 2—figure supplement 2
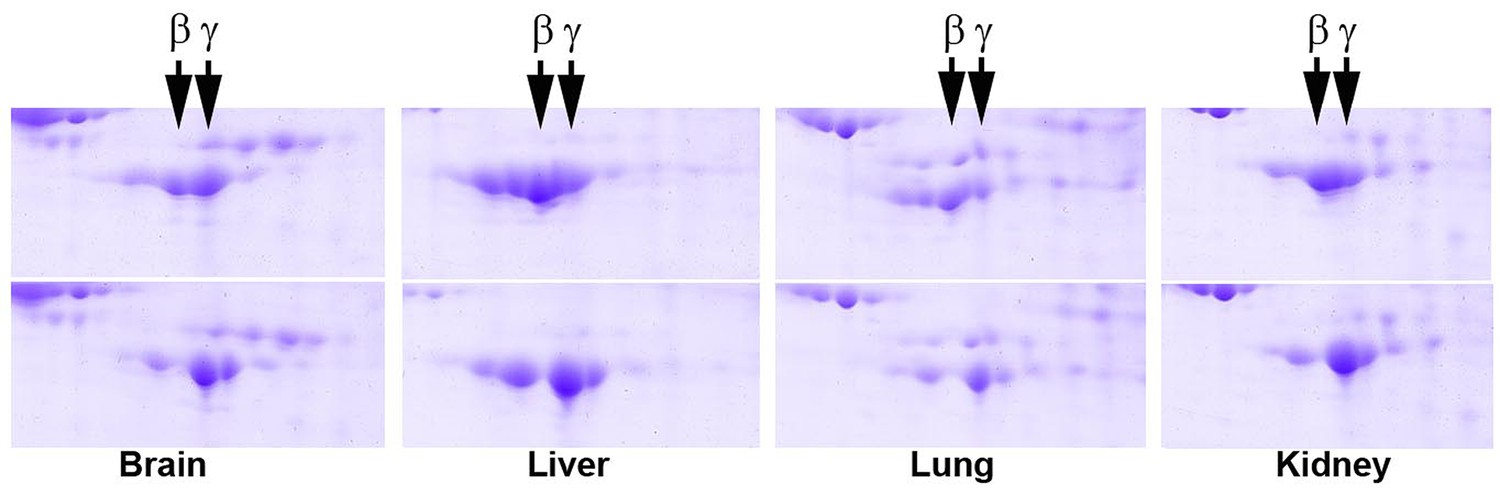
2D gel distribution of actin isoforms in wild type (top) and Actbc-g (bottom) mouse tissue lysates.
https://doi.org/10.7554/eLife.31661.008
Figure 2—figure supplement 3
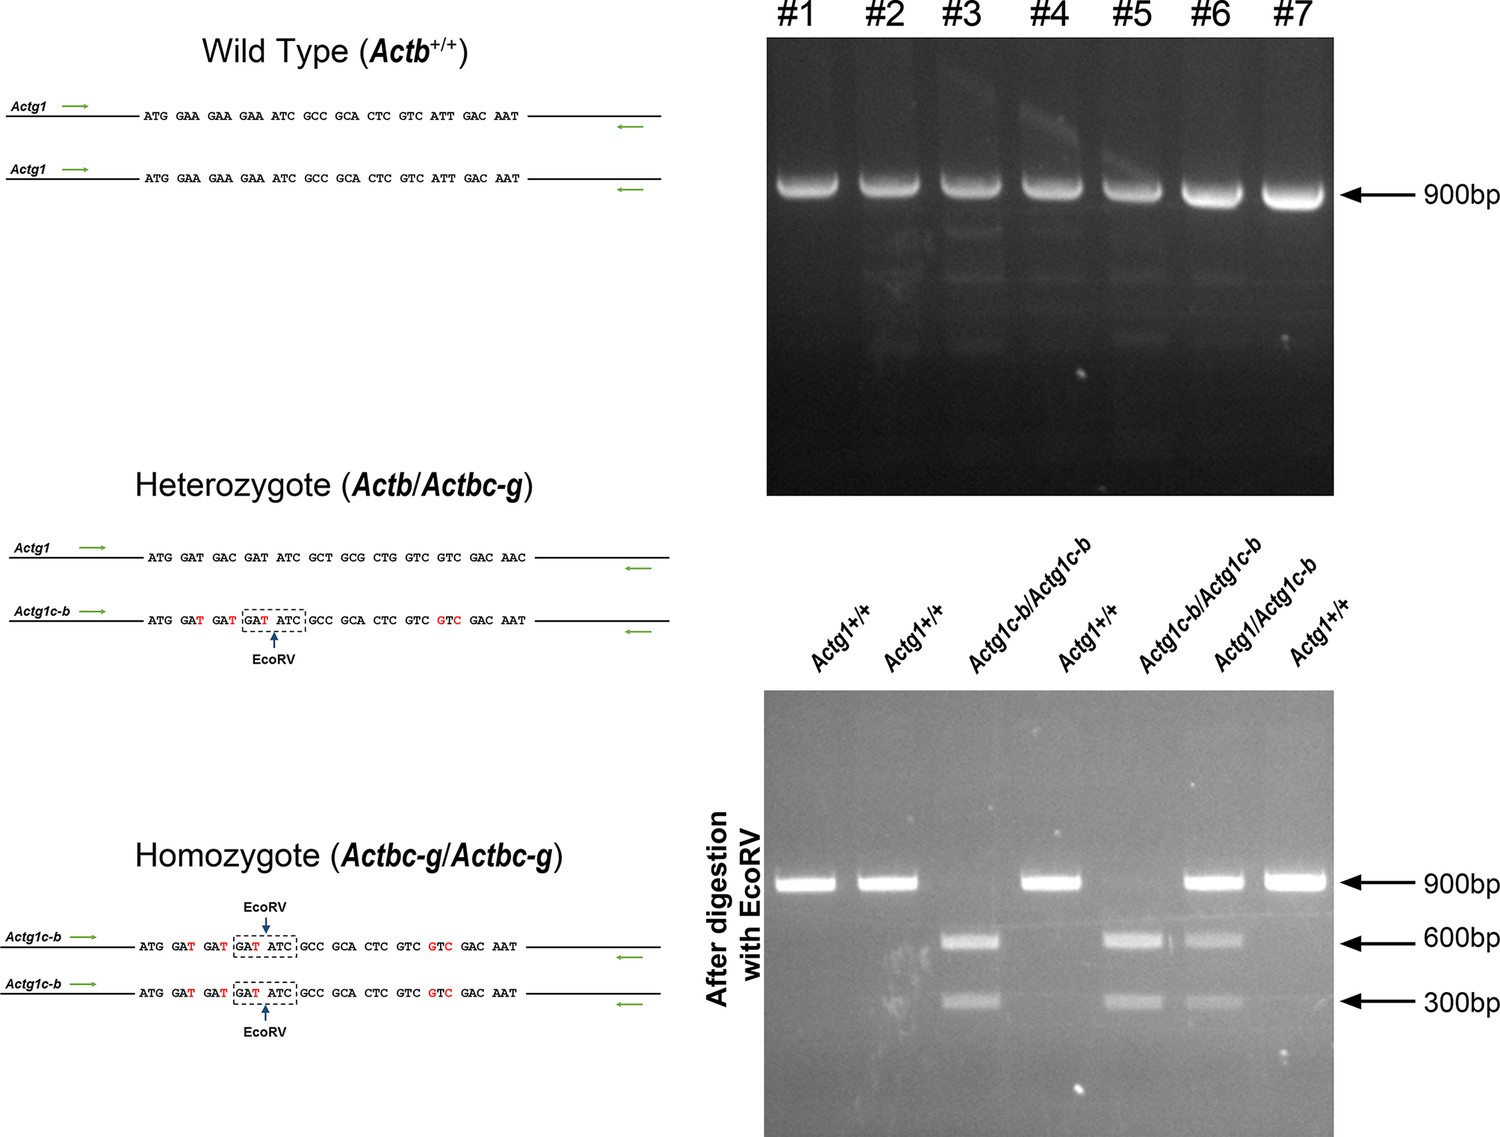
Generation of Actg1c-b mouse.
Top, genotyping strategy: editing of the N-terminal codons of theγ- actin gene generates an EcoRV restriction site, enabling the screening of the edited gene variants by EcoRV digestion of the PCR-generated DNA fragments corresponding to the beginning of the actin sequence. Bottom, PCR products before (top) and after (bottom) EcoRV digestion.
Figure 2—figure supplement 4
γ-coded β-actin (Actg1c-b mice exhibit no phenotypic changes compared to control.
Top, CRISPR/Cas9 editing strategy used to generate Actg1c-b mouse. Bottom left, photos of Actg1c-b mouse after gene editing, to age-matched wild type. Bottom right, H and E-stained sagittal sections of the heads (top) and bodies (bottom) of littermate wild type (WT) and Actg1c-b mice. Scale bar, 1 mm.
Figure 2—figure supplement 5
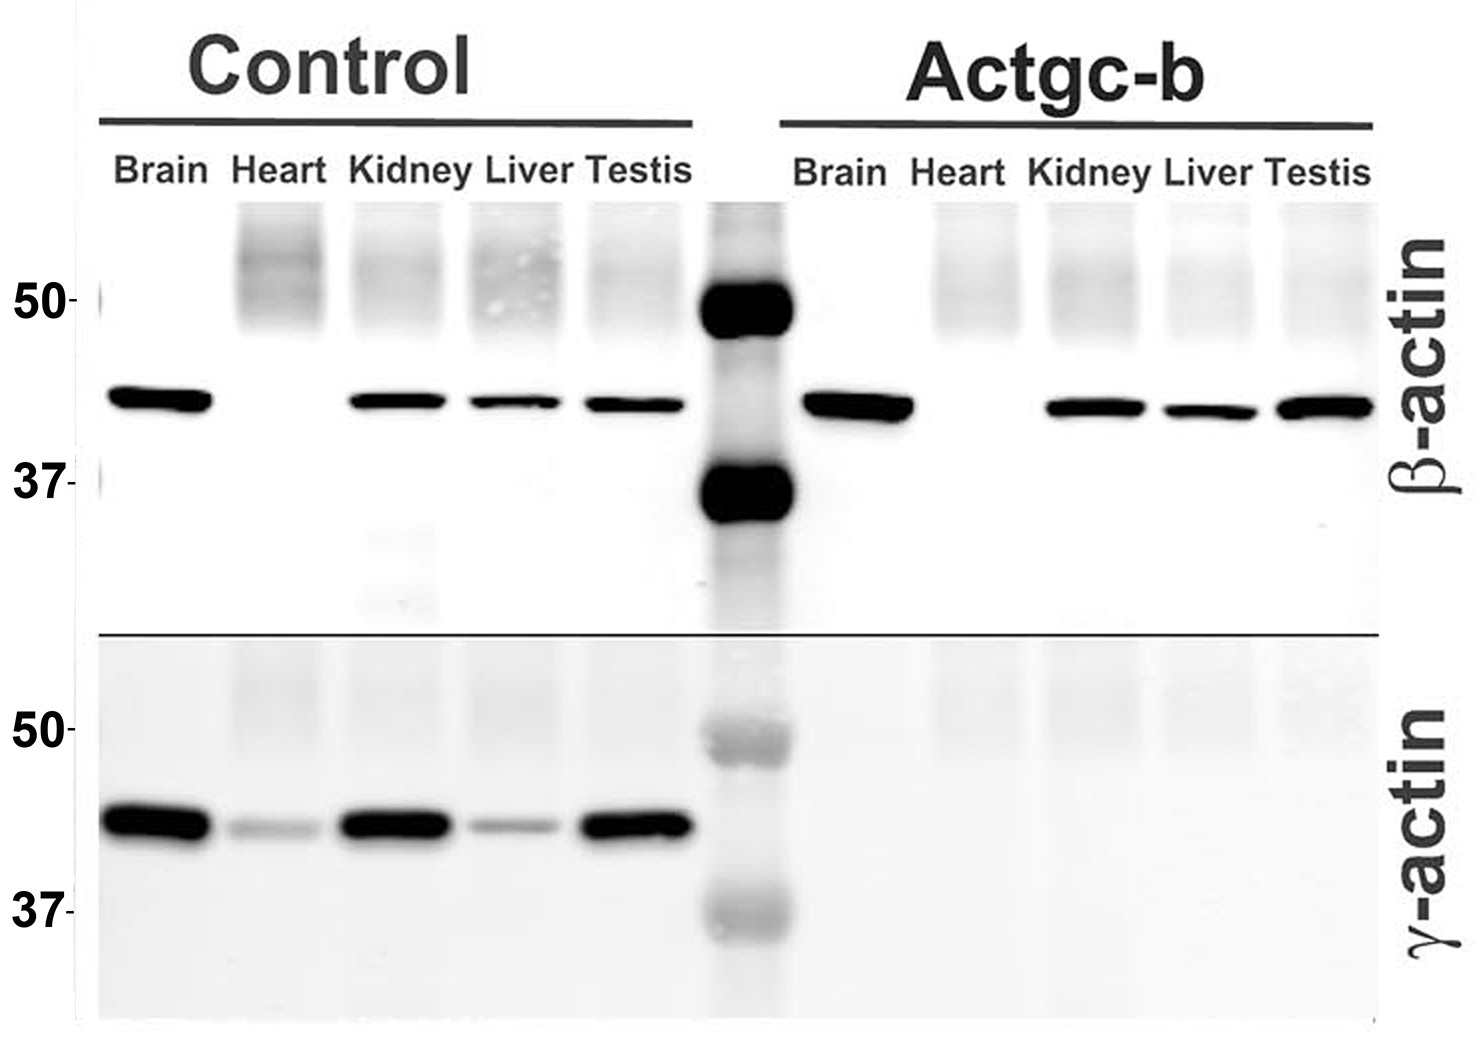
Partial editing of the γ-actin gene to encode β-actin-like protein abolishes γ-actin protein from multiple organs.
Western blots with the actin antibodies indicated on the left using tissue homogenates from wild type control and Actg1c-b mouse.
Figure 3
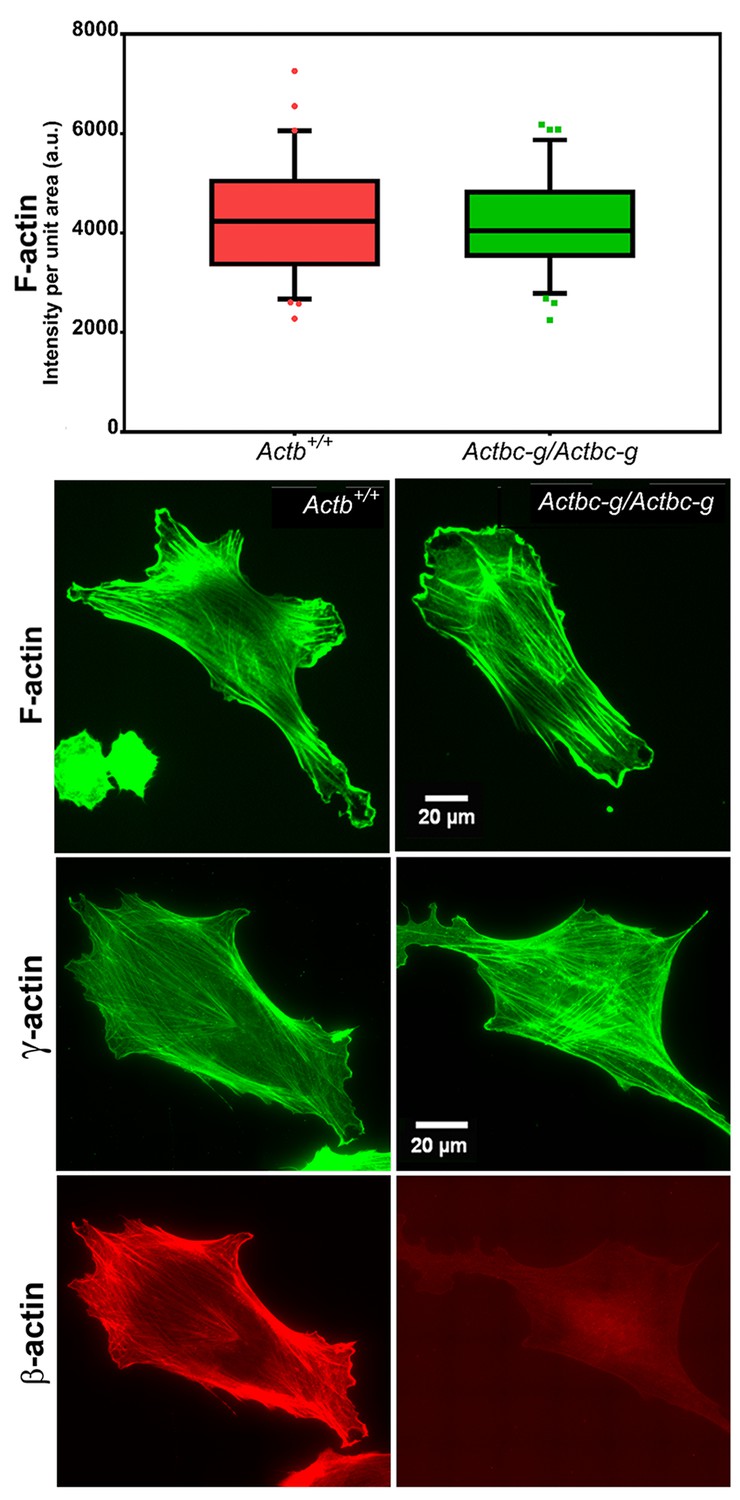
Mouse embryonic fibroblasts derived from Actbc-g mice have normal actin cytoskeleton, despite complete lack of β-actin.
Top, quantification of total F-actin detected by Phalloidin-AlexaFluor488 staining of wild type (Actb+/+) and Actbc-g primary mouse embryonic fibroblasts. Numbers were averaged from 69 cells in WT and 76 cells in Actbc-g, obtained from two different primary cultures independently derived from two different littermate embryos for each set. Bottom, representative images of both cell types stained with Phalloidin-AlexaFluor488 or antibodies to both actin isoforms as indicated.
Figure 4
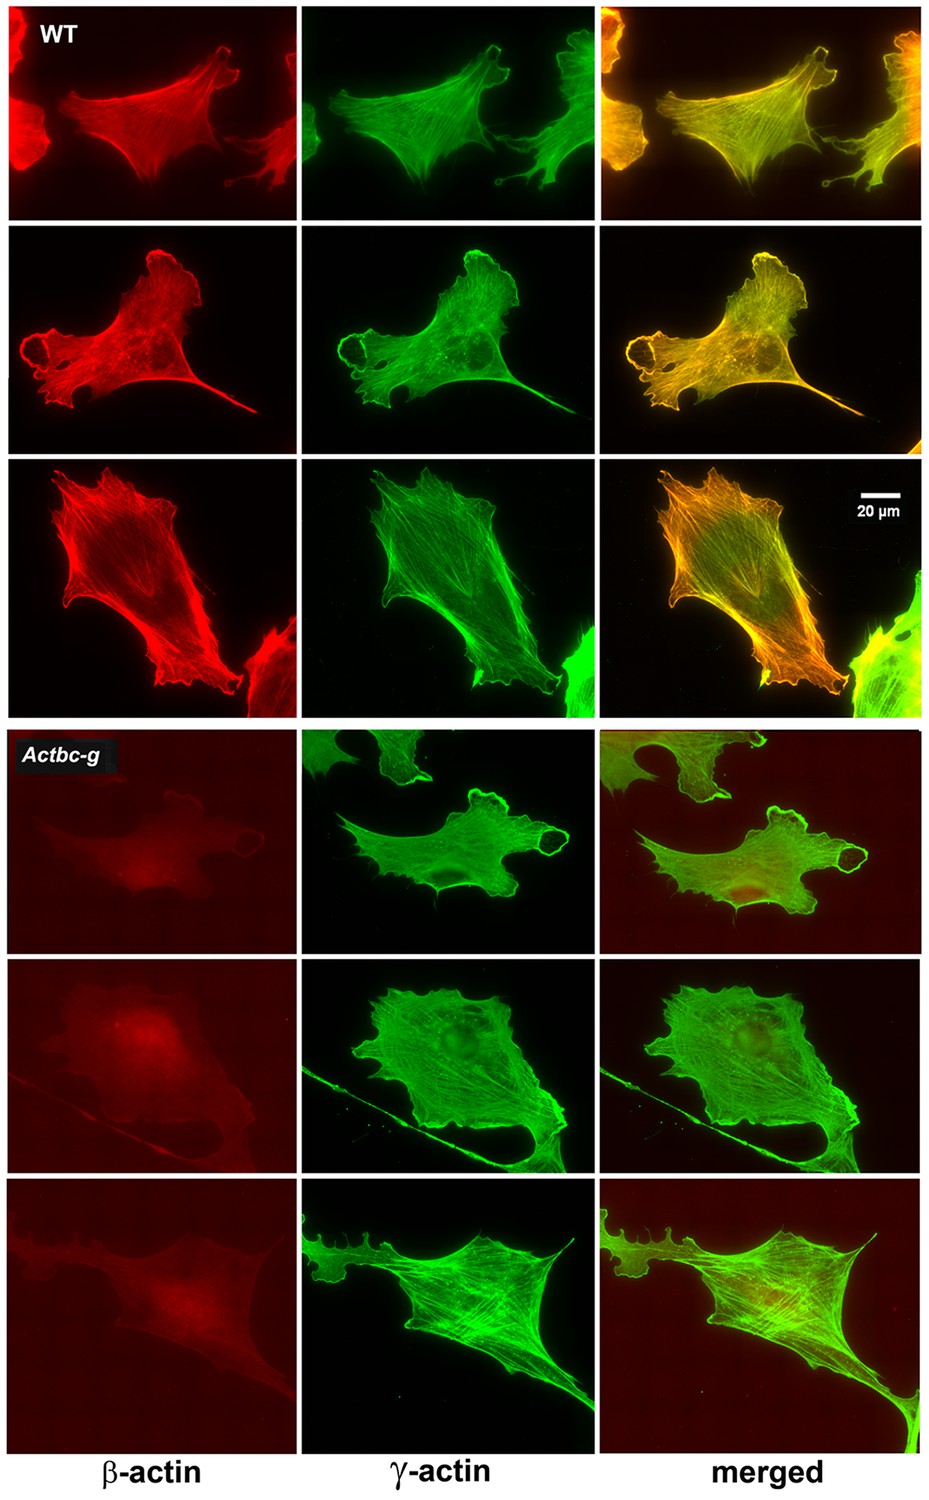
Mouse embryonic fibroblasts show no major changes in morphology and actin distribution.
Representative images of wild type (WT) and Actbc-g primary mouse embryonic fibroblasts stained with antibodies to both actin isoforms as indicated.
Figure 5 with 2 supplements
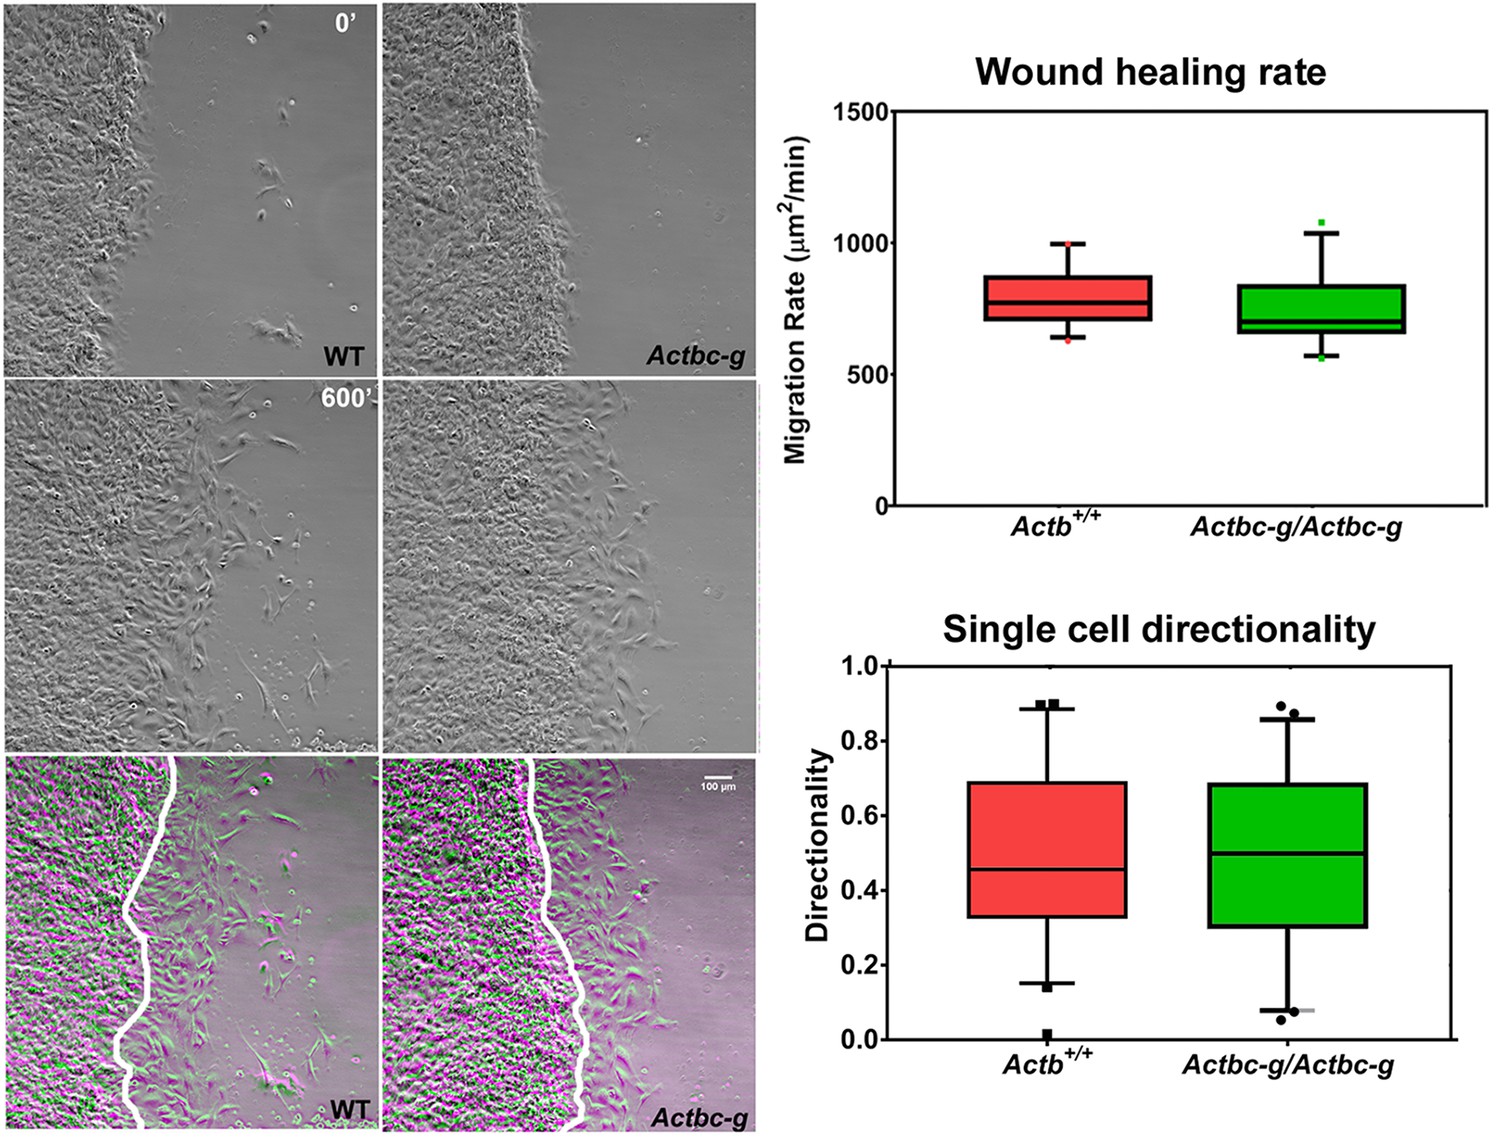
Mouse embryonic fibroblasts derived from Actbc-g mice migrate at normal rates.
Left, phase contrast images of the first (0′) and last (600′) frame taken from a representative time lapse videos of the WT and Actbc-g cells at the edge of a monolayer migrating into an infinite scratch wound. Overlay of the two frames is shown in the bottom row. Scale bar, 100 µm. Right top, quantification of the cell migration rate as μm2/min, WT: n = 28, Actbc-g: n = 29 averaged from two independently derived primary cultures for each set. See Supplemental Videos 1 and 2. Right bottom, quantification of cell directionality in single cell migration assays (calculated as persistence over time, WT: n = 49, Actbc-g: n = 50) suggests that single cell migration was not affected in Actbc-g cells.
Figure 5—video 1
Time lapse video showing migration of control fibroblasts into the infinite scratch wound.
https://doi.org/10.7554/eLife.31661.015
Figure 5—video 2
Time lapse video showing migration of Actbc-g fibroblasts into the infinite scratch wound.
https://doi.org/10.7554/eLife.31661.016Tables
Table 1
Severity of the actin isoform knockout phenotypes and their cross-compensation for each other correlate with their ribosome density.
See (Perrin and Ervasti, 2010) for the references on the isoform knockout data. * From heterozygotes (since homozygous knockout is embryonic lethal) and knockout MEFs. † Tissue specific upregulation of different isoforms See (Bunnell and Ervasti, 2010).
| Name | Gene symbol | NCBI accession number, protein | NCBI accession number, mRNA | Composite ribosome density | Mouse knockout phenotype | Other actin isoforms upregulated upon knockout |
|---|---|---|---|---|---|---|
| β-cytoplasmic actin | Actb | NP_031419 | NM_007393 | 1351.607 | Early embryonic lethality | Acta2; some Actg1* |
| α-smooth muscle actin | Acta2 | NP_031418 | NM_007392 | 53.781 | Viable, with vascular contractility and blood pressure defects | Acta1 |
| α-skeletal actin | Acta1 | NP_033736 | NM_009606 | 10.267 | Muscle weakness; postnatal lethality | Acta2 and Actc1 |
| α-cardiac actin | Actc1 | NP_033738 | NM_009608 | 3.872 | Perinatal lethality | Acta2 and Acta1 |
| γ-cytoplasmic actin | Actg1 | NP_033739 | NM_009609 | 1.289 | Viable, with growth defects and progressive deafness | Acta2, Actb, Acta1, and Actc1† |
| γ-enteric smooth muscle actin | Actg2 | NP_033740 | NM_009610 | 0.377 | Unknown | Unknown |
-
Table 1—source data 1
Composite ribosome profiling data for the actin gene family, plotted in logarithmic scale.
Bottom panel shows the coarse curves for the data on top.
- https://doi.org/10.7554/eLife.31661.018
-
Table 1—source data 2
Ribosome profiling data for the individual members of the actin family, plotted in logarithmic scale.
- https://doi.org/10.7554/eLife.31661.019
-
Table 1—source data 3
Predictions of the secondary structures for β− and γ− actin coding sequences.
Plot shows distance in nucleotides (x axis, 0 indicates the first ATG of the coding sequence) versus free energy (y axis).
- https://doi.org/10.7554/eLife.31661.020
-
Table 1—source data 4
Predictions for the initial regions of the β− and γ− actin coding sequence, compared to their codon-switched versions.
Plot shows distance in nucleotides (x axis, 0 indicates the first ATG of the coding sequence) versus free energy (y axis). β-coded γ− actin mRNA is predicted to have a more relaxed structure around the translation initiation site, while being indistinguishable throughout the rest of the sequence.
- https://doi.org/10.7554/eLife.31661.021
Additional files
-
Supplementary file 1
Mouse families of homologous protein isoforms showing the highest differences in ribosome densities between the members of each family.
Families are grouped by function, starting with the most abundant ones.
- https://doi.org/10.7554/eLife.31661.022
-
Supplementary file 2
Human families of homologous protein isoforms showing the highest differences in ribosome densities between the members of each family.
Families are grouped by function, starting with the most abundant ones.
- https://doi.org/10.7554/eLife.31661.023
-
Supplementary file 3
Zebrafish families of homologous protein isoforms showing the highest differences in ribosome densities between the members of each family.
Families are grouped by function, starting with the most abundant ones.
- https://doi.org/10.7554/eLife.31661.024
-
Supplementary file 4
Drosophila families of homologous protein isoforms showing the highest differences in ribosome densities between the members of each family.
Families are grouped by function, starting with the most abundant ones.
- https://doi.org/10.7554/eLife.31661.025
-
Supplementary file 5
C.elegans families of homologous protein isoforms showing the highest differences in ribosome densities between the members of each family.
Families are grouped by function, starting with the most abundant ones.
- https://doi.org/10.7554/eLife.31661.026
-
Transparent reporting form
- https://doi.org/10.7554/eLife.31661.027
Download links
A two-part list of links to download the article, or parts of the article, in various formats.
Downloads (link to download the article as PDF)
Open citations (links to open the citations from this article in various online reference manager services)
Cite this article (links to download the citations from this article in formats compatible with various reference manager tools)
Diverse functions of homologous actin isoforms are defined by their nucleotide, rather than their amino acid sequence
eLife 6:e31661.
https://doi.org/10.7554/eLife.31661


