Functional role of the type 1 pilus rod structure in mediating host-pathogen interactions
- Washington University School of Medicine, United States
- University of Virginia, United States
- Umeå University, Sweden
- Institut Pasteur, Biochemistry of Macromolecular Interactions Unit, France
Figures
Figure 1 with 1 supplement
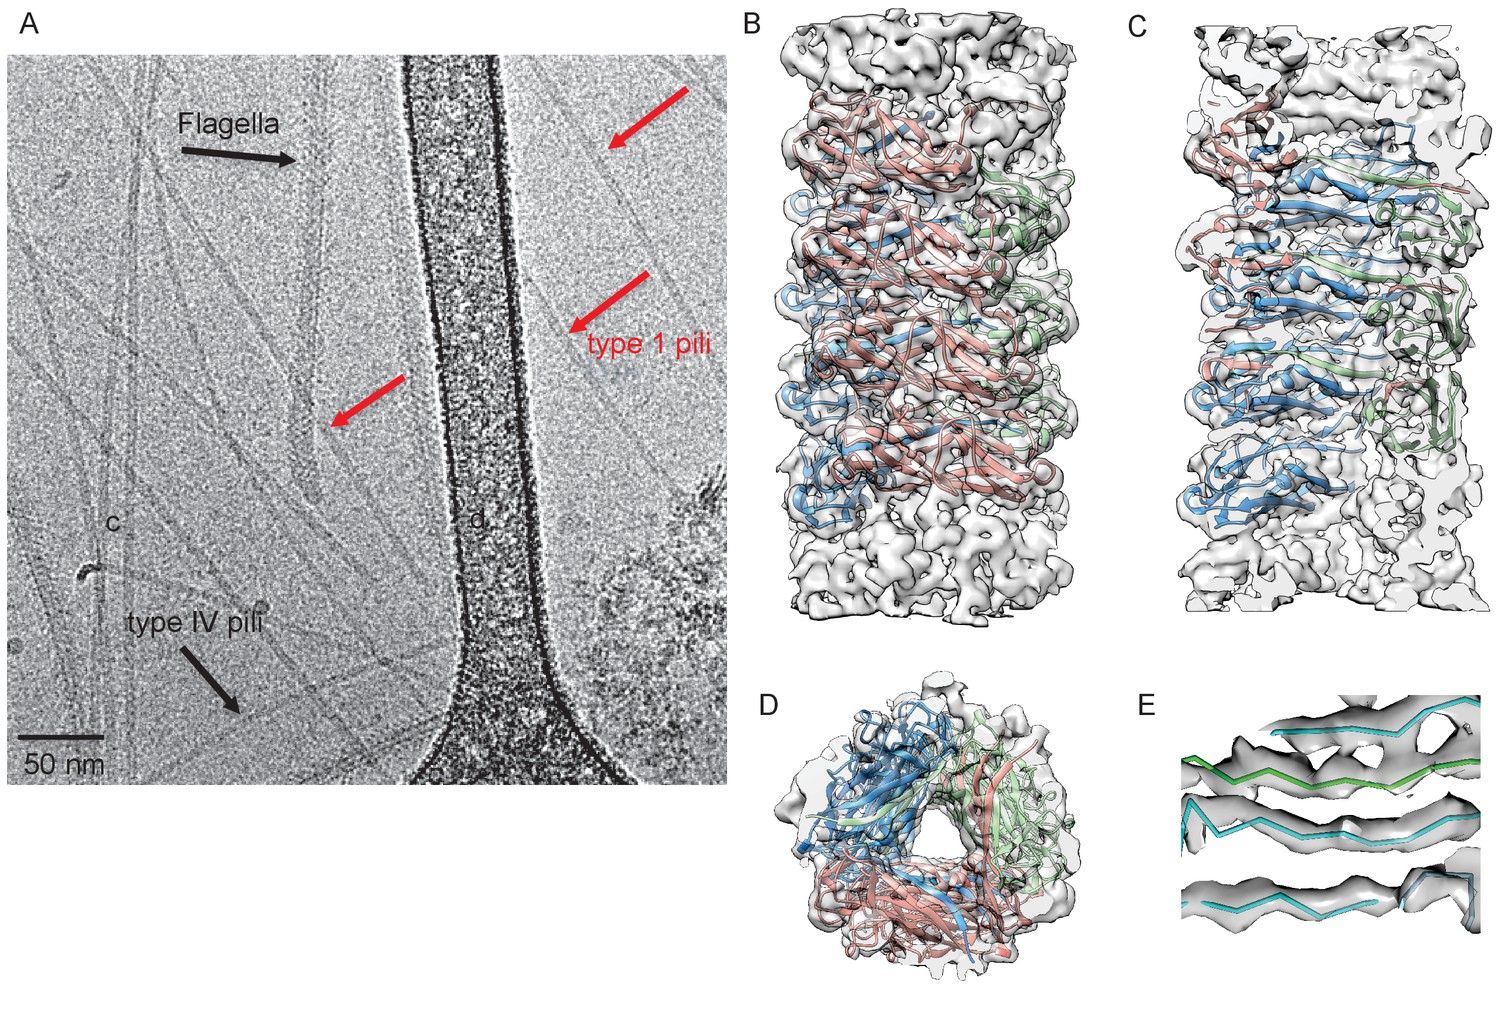
Cryo-EM Structure of Type 1 pili.
(A) An electron micrograph of type 1 pili in vitreous ice, surrounded by type 4 pili and flagellar filaments. (B) Side view, (C) interior view (the front half of the reconstruction has been removed) and (D) top view of overall reconstruction of FimA rod with subunits along the same left-handed 3-start helix colored in either blue, salmon or green. (E) Close-up view of donor strand complementation (DSC) in the central lumen showing that the β-strands in the reconstruction are very well resolved.
Figure 1—figure supplement 1
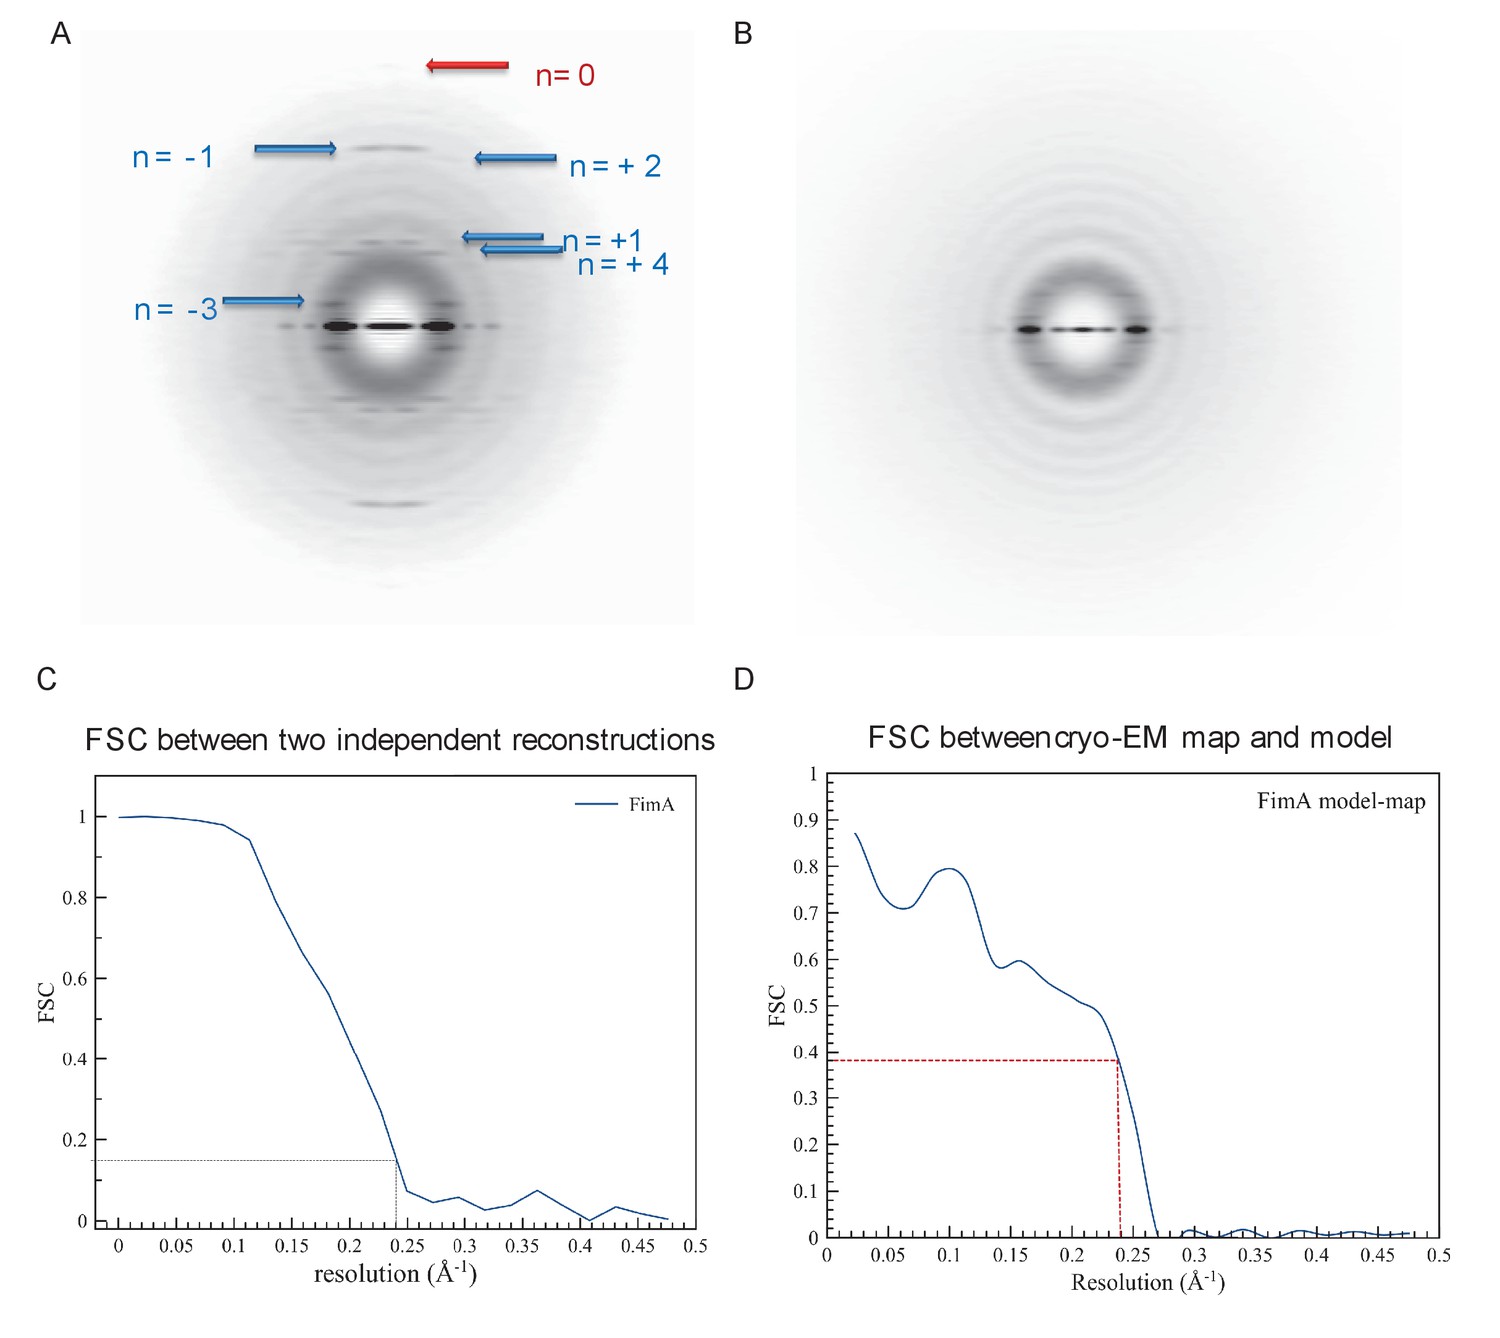
Details of cryo-EM reconstruction of type 1 pili.
(A) Averaged power spectrum from the segments of type 1 pili, which shows the meridional at ~1/(7.5 Å) indicated by the red arrow. The blue arrow indicates layer lines containing Bessel orders + 1,+2,+4,–1, and −3. (B) The power spectrum for the Type IV pili in the same preparation. (C) FSC plot generated from two independent half maps, each reconstructed from two independent dataset, shows a resolution of ~4.2 Å at FSC = 0.143. (D) FSC plot generated from the comparison of the cryo-EM map with the atomic model shows a resolution of ~4.2 Å at FSC = 0.38 (=0.1431/2).
Figure 2 with 3 supplements
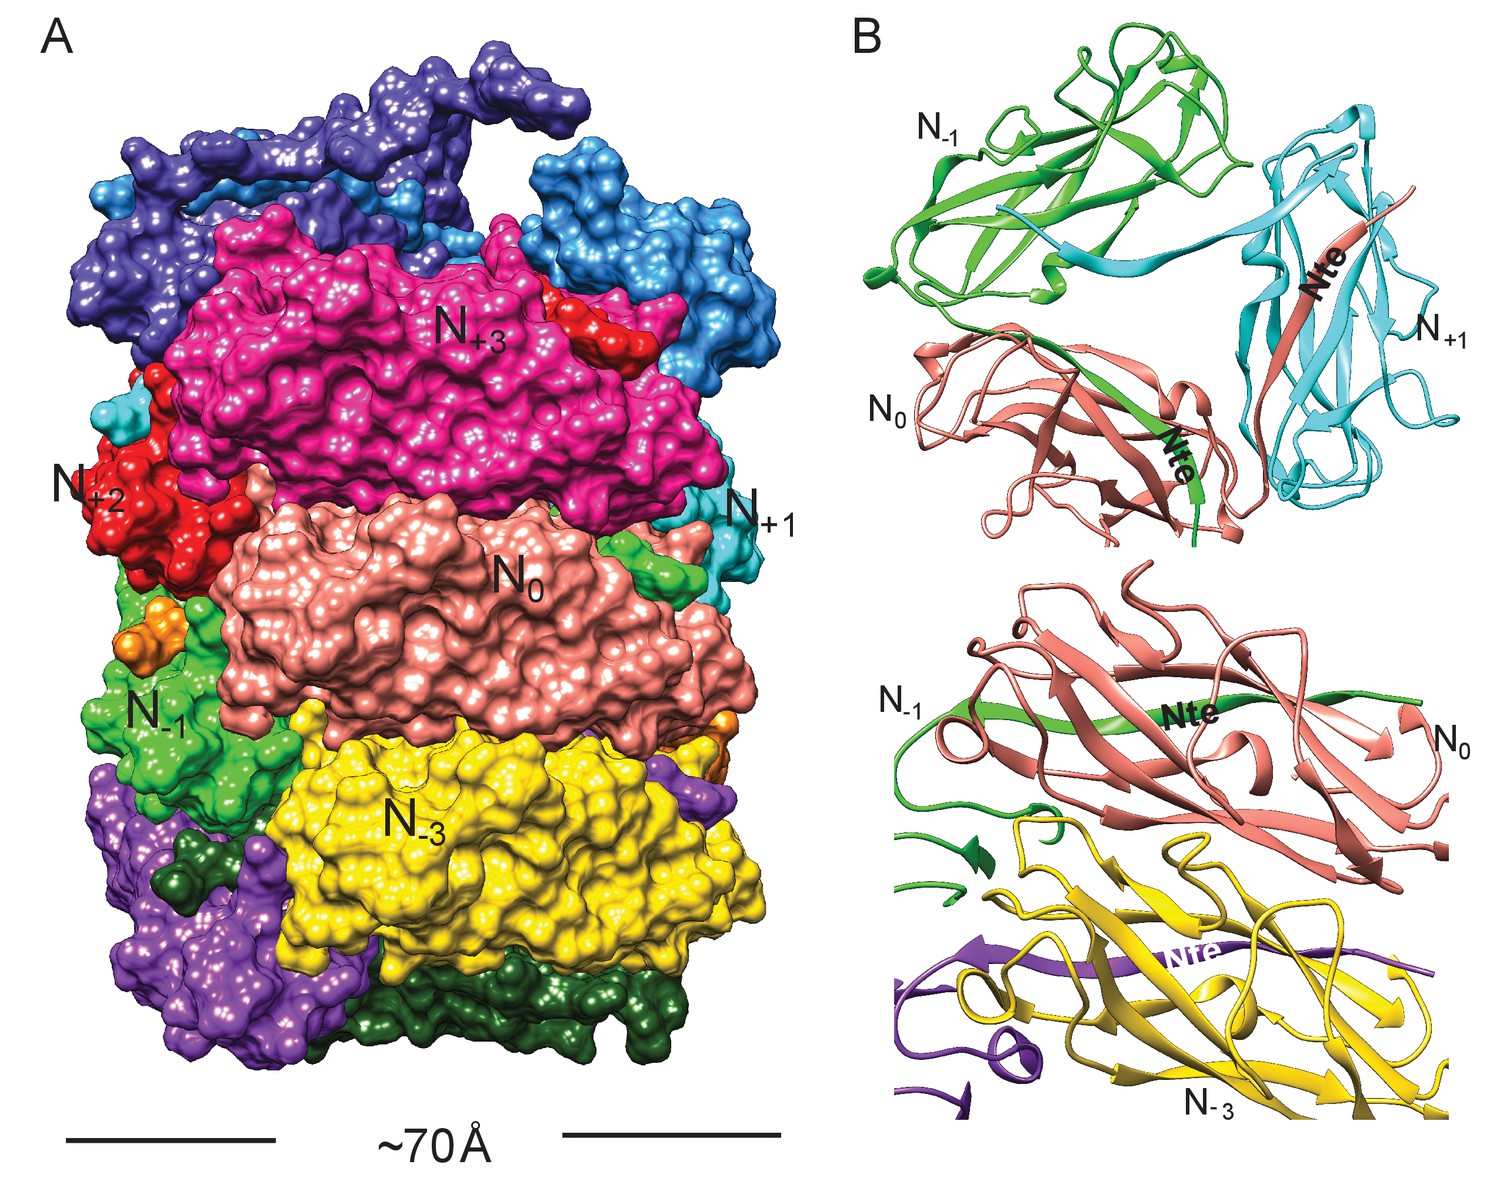
Subunit interface of the FimA rod.
(A) Surface view of FimA rod model with subunits numbered along the right-handed 1-start helix. Each subunit is in a different color. (B) Ribbon representation to illustrate the interface of subunit N0 (in salmon) with neighboring subunits.
Figure 2—figure supplement 1
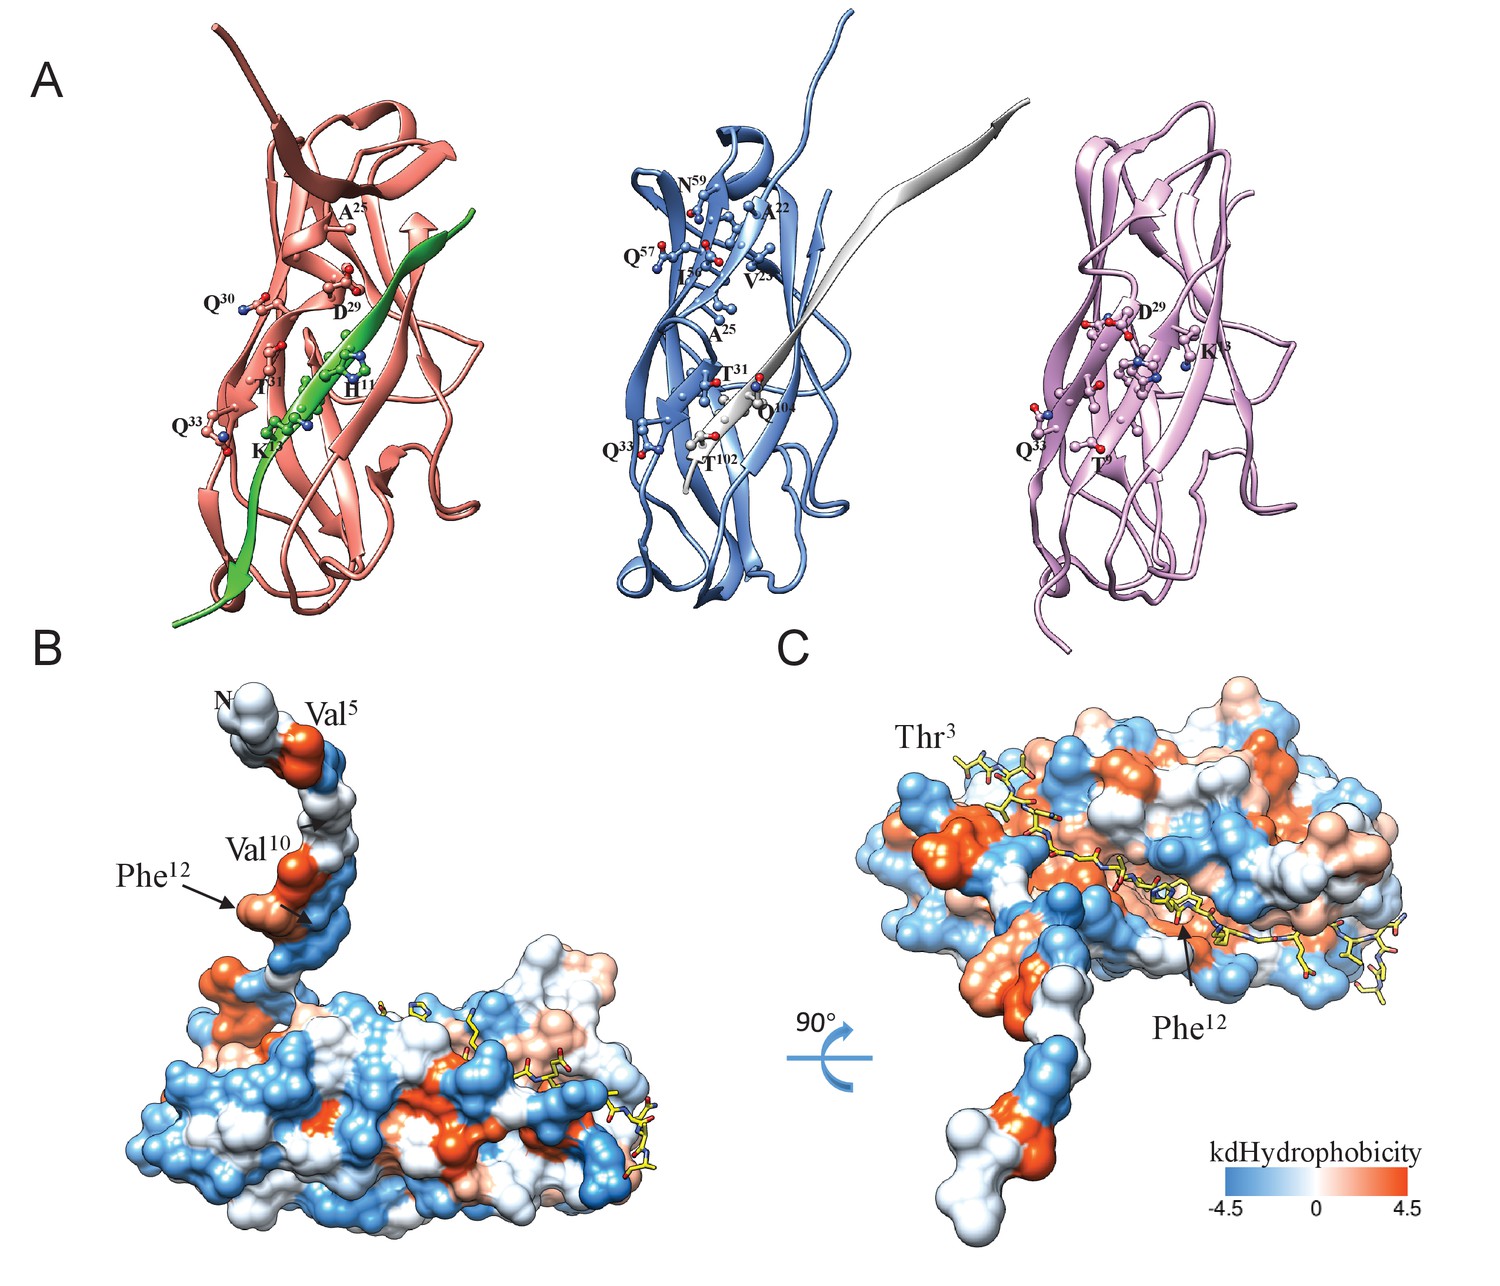
Nte inserts into the hydrophobic groove of the neighboring subunit.
(A) Comparison of the DSC within the helical rod, within the FimA:FimC complex (PDB ID:3SQB), and in the self-complemented FimA monomer (PDB ID:2M5G). FimA in the helical rod is shown in salmon and Nte from the adjacent subunit is shown in green; FimA in FimA:FimC complex is shown in blue and FimC donor strand is shown in grey; FimA self-complemented monomer is shown in plum. (B,C) FimA rod subunit surface is colored according to hydrophobicity, with the adjacent subunit’s Nte shown in a stick representation. Phe12 sits in a large hydrophobic pocket of the adjacent subunit.
Figure 2—figure supplement 2
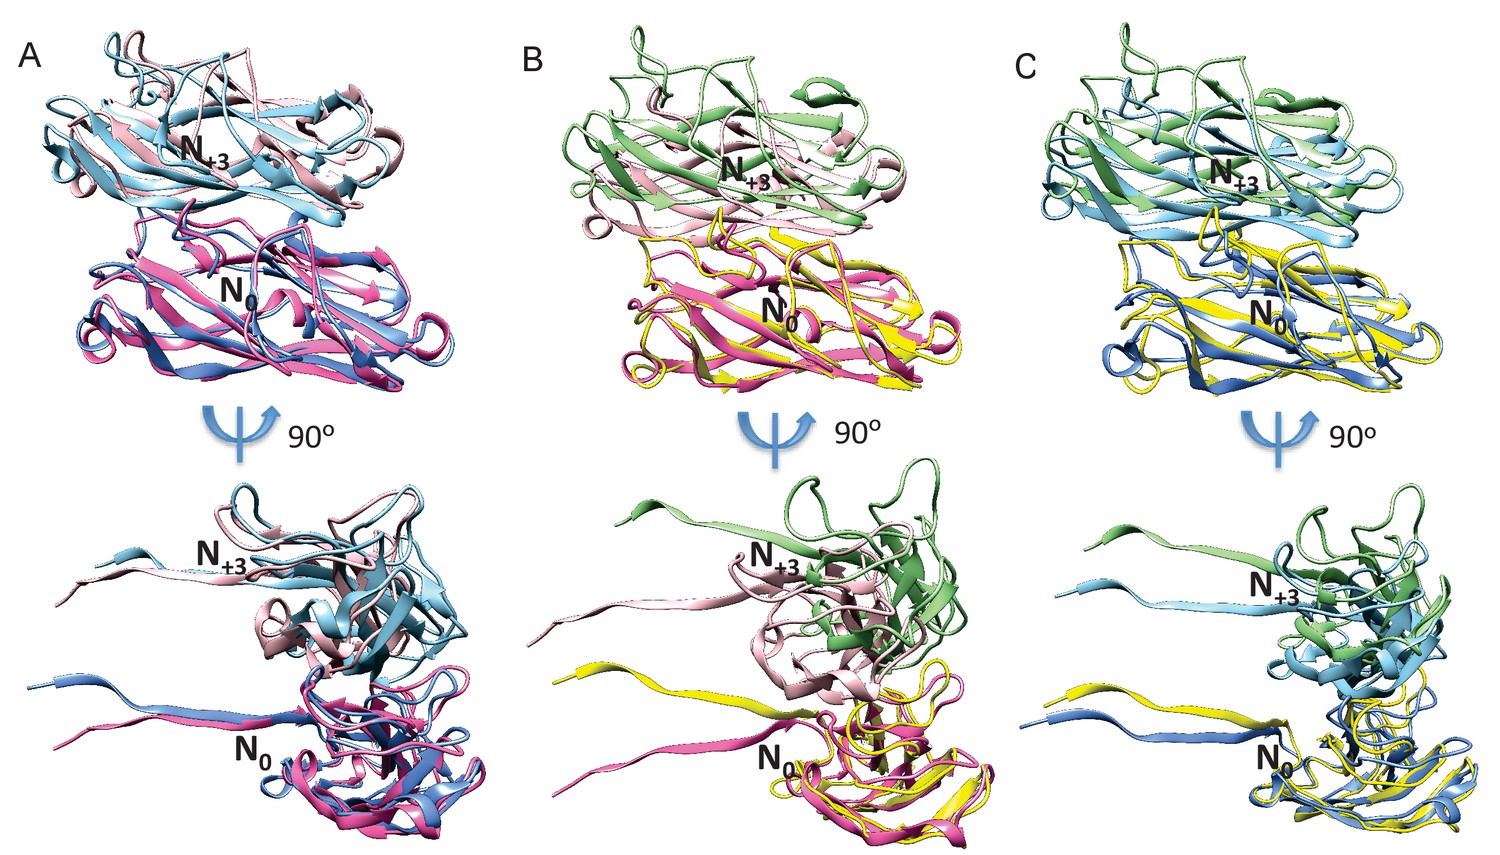
Comparison of subunit N0 and N+3 interfaces with previously deposited FimA pilus rod models.
(A) Our FimA pilus rod model and the deposited solid-state NMR FimA model 2N7H, when aligned with their N0 subunit have an overall RMSD of 5.7 Å for subunits N+3. (B) Our FimA pilus rod model and solid-state NMR FimA model 2MX3 when aligned with subunit N0 have an overall RMSD of 11.0 Å for subunits N+3. (C) FimA models 2N7H and 2MX3 when aligned with their N0 subunit, the overall RMSD is 5.6 Å for subunit N+3. The N0 and N+3 subunits of our FimA model are colored in hot pink and pink, respectively. The N0 and N+3 subunits of 2N7H are colored in dodger blue and light blue, respectively. The N0 and N+3 subunits of 2MX3 are colored in yellow and green, respectively.
Figure 2—figure supplement 3
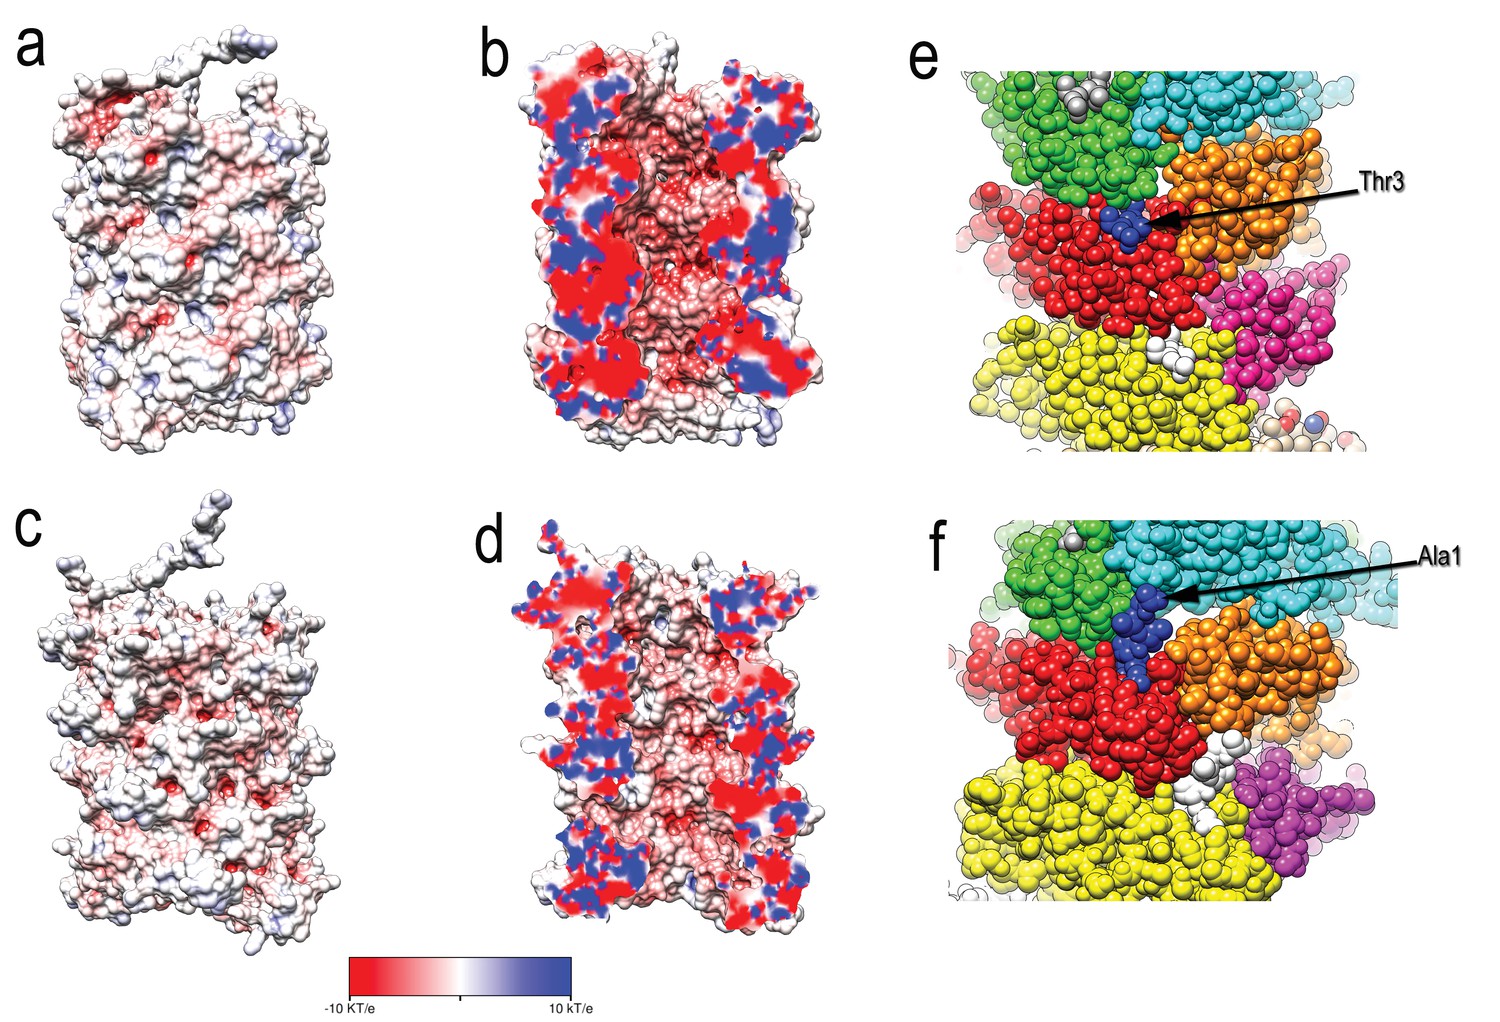
Comparison of type 1 pili and P pili.
(A) The exterior and (B) central lumen of type 1 pili colored according to the electrostatic potential. (C) The exterior and (D) central lumen of P pili (PDB ID: 5FLU) colored according to the electrostatic potential. Red corresponds to a potential of −10 kT/e, and blue corresponds to a potential of 10 kT/e. (E, F) structures of type 1 and P pilus rods with each FimA subunit shown in a different color. (E) The N-terminus of FimA in the type 1 pilus projects out of the structure and makes no contacts with other subunits. (F) In contrast, the N-terminus in P pili (PDB 5FLU) forms a ‘staple’ which involves contacts with two other subunits.
Figure 3 with 1 supplement

FimA conservation and variability.
(A) Conservation, consensus amino acid identity, and selection pressures on residues within the mature form of the FimA protein measured by alignment of 1,828 sequences. Numbering here is based on FimA from BW25113 and the vertical dashed line indicates the location of the two amino acid residues, in red, that are present in some FimA sequences. Consensus amino acid residues are shown at each position. Height of the residues corresponds to their information content (bits) where the larger size indicates greater certainty that residue shown is the consensus residue at that position. The vertical bars represent the proportion of strains with the consensus amino acid (0–100%). Vertical bars are colored by selection pressure acting upon the amino acid position, with red and blue bars indicating residues with codons under adaptive and purifying selection, respectively, as measured by a χ2 (chi-squared) test. Green bars indicate codons with too little variability for evolutionary analysis and grey indicates amino acid positions that do not show statistically significant evidence for selection. (B,C) The degree of conservation for every FimA residue shown in (A) has been mapped onto a single subunit in our rod model. The absolutely conserved residues are in blue, the residues that are 40% conserved (the greatest degree of variability found) are in white, and light blue represents 90% conservation. Every residue facing the lumen is 100% conserved. Overall, FimA displays strong signals of purifying selection resulting in conservation with hotspots of adaptive selection resulting in variability of surface residues.
Figure 3—figure supplement 1
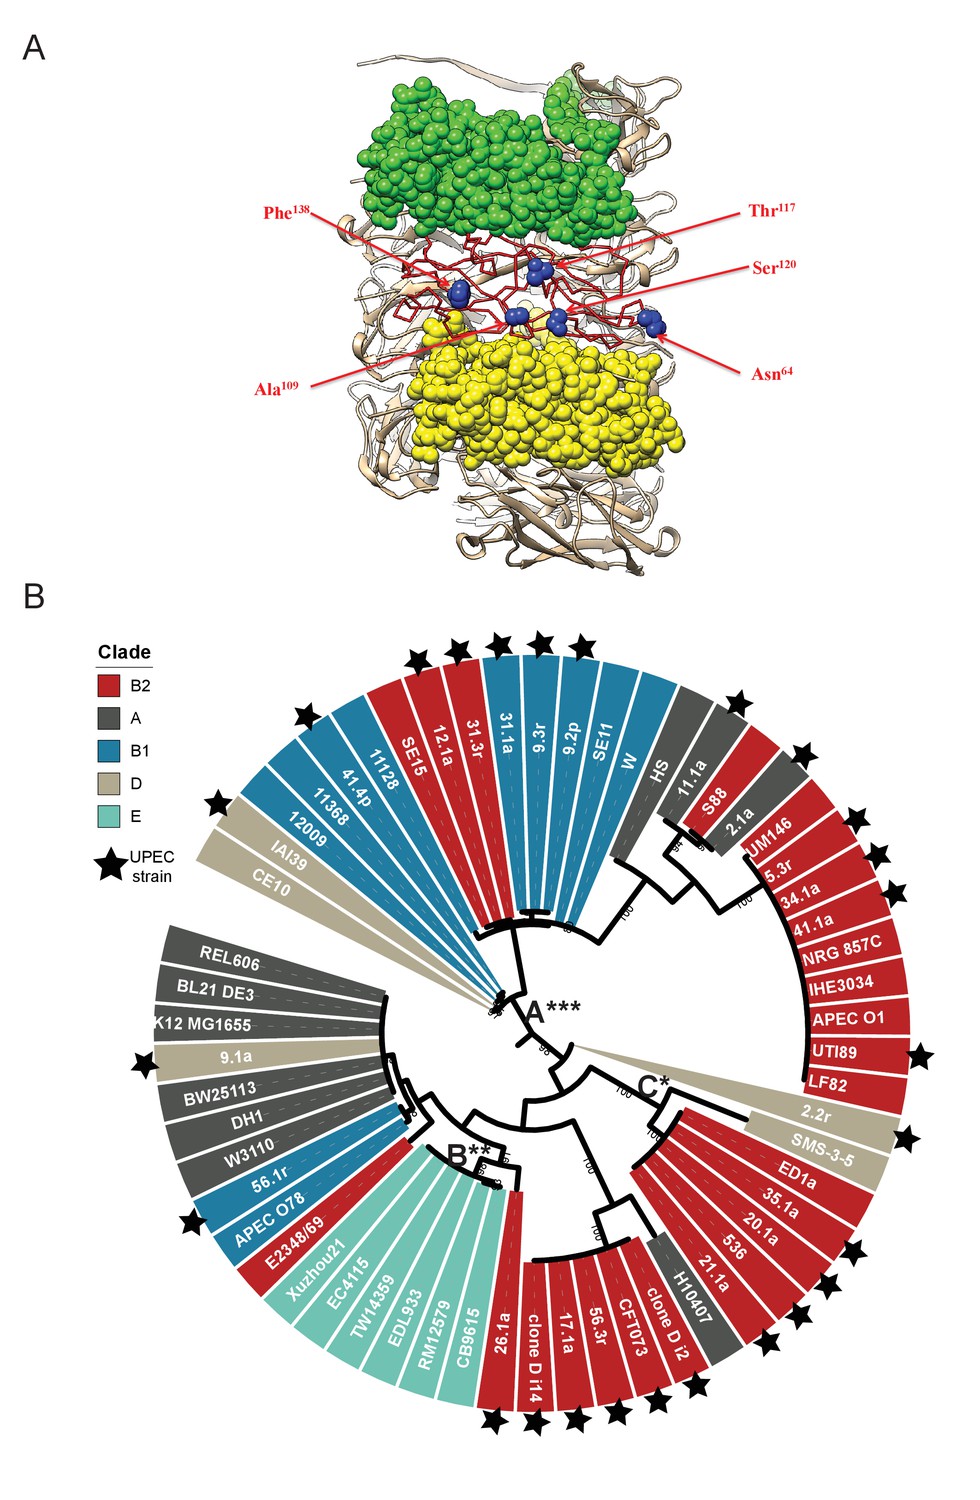
Location of FimA residues under positive selection for change in the helical rod.
(A) Five residues in FimABW25113, Asn64, Ala109, Thr117, Ser120 and Phe138, under adaptive selection are all located on the outside of the pilus rod and are shown in blue spheres. (B) Phylogenetic analysis of the carriage and evolution of the fimA gene in a curated dataset of E. coli genomes. A total of 57 fimA sequences were aligned and used to construct a phylogenetic tree with bootstrap support (between 80% and 100%) indicated along internal branches. Taxon labels are colored according to their clade of origin and UPEC strains are indicated with a star. Measurement of the rates of non-synonymous (dN) to synonymous (dS) mutation for each branch identified three branches carrying many sequences from UPEC strains are under episodic, diversifying selection (labeled A, B, and C). Statistical significance for these measures are indicated by asterisks, with *p≤0.05, **p≤0.01, and ***p<0.001 by likelihood ratio χ2 (chi-squared) test.
Figure 4 with 2 supplements

Mutations to FimA alter the force required to unwind the pilus.
(A) Force response of a single type 1 pilus. The force response is composed of three phases, elastic stretching of the shaft, unwinding of the shaft, and elastic stretching of individual subunits in an open coil. (B) Bar chart showing the average unwinding force of FimABW254113 wildtype (WT) and mutants expressed in trans in UTI89-LON∆fimA (C) Ala22 (cyan) plays an important role in the inter-subunit contacts through interacting with Val37 (magenta) from a second subunit and Ala93 (green) from a third subunit. (B) Bar chart showing the average unwinding force of measured pili where the error bars represent the standard error of the mean [WT, 30.3 ± 0.2 pN, N = 13, 2 replicates; A22R, 11.2 ± 0.2 pN, N = 25, 2 replicates; A92R, 24.6 ± 0.3 pN, N = 19, 2 replicates; D114R, 25.6 ± 0.3 pN, N = 16, 2 replicates; D62R, 26.7 ± 0.4 pN, N = 16, 2 replicates; K155R, 23.6 ± 0.3 pN, N = 14, 2 replicates; P132R, 24.1 ± 0.3 pN, N = 15, 2 replicates]. All replicates biological. ****p<0.0001 by unpaired, two-sided t-test).
Figure 4—figure supplement 1
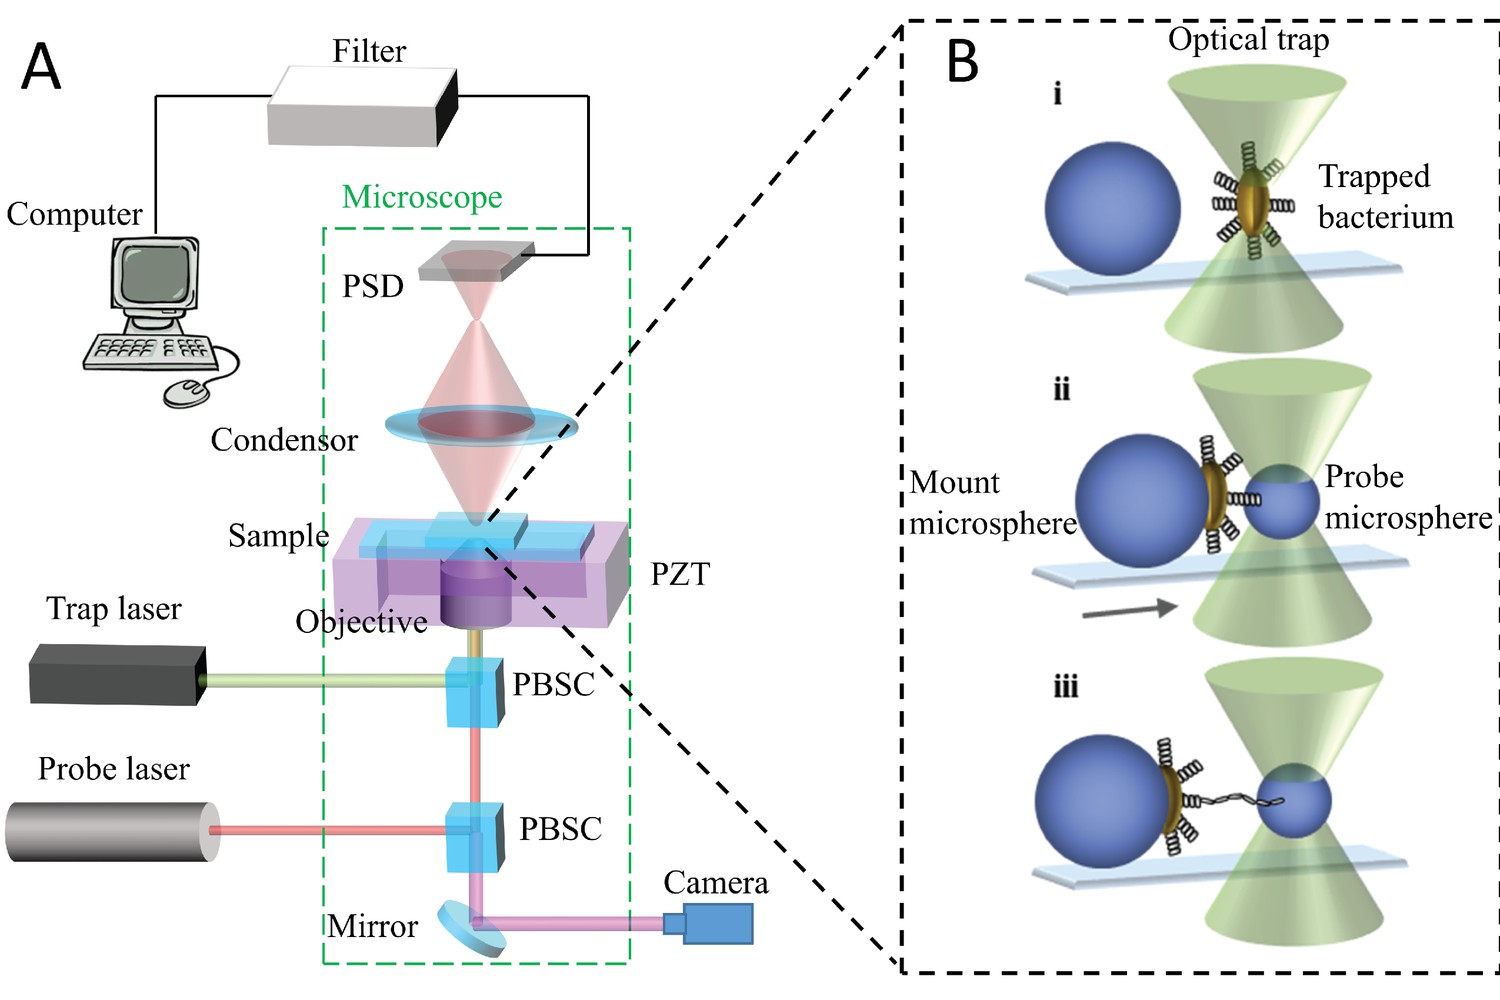
Schematic illustration of the optical tweezer setup.
(A) The trap and probe laser beams are merged using a polarizing beam splitter cube (PBSC) positioned inside the microscope. The two laser beams are thereafter focused by the objective inside the sample chamber. The weak probe laser beam (µW), refracted by the object and collected by the condenser, is illuminating a PSD-detector that converts the incoming light to a photocurrent, which in turn is converted to a voltage signal. (B) Schematic illustration of a force spectroscopy experiment. A single cell or probe microsphere can be trapped by the laser. (i) A single bacterium is mounted onto a large immobilized microsphere. (ii) A probe microsphere is trapped and brought into contact with bacterial pili. iii) The bacterium and trapped microsphere are separated and an attached pilus is unwound.
Figure 4—figure supplement 2
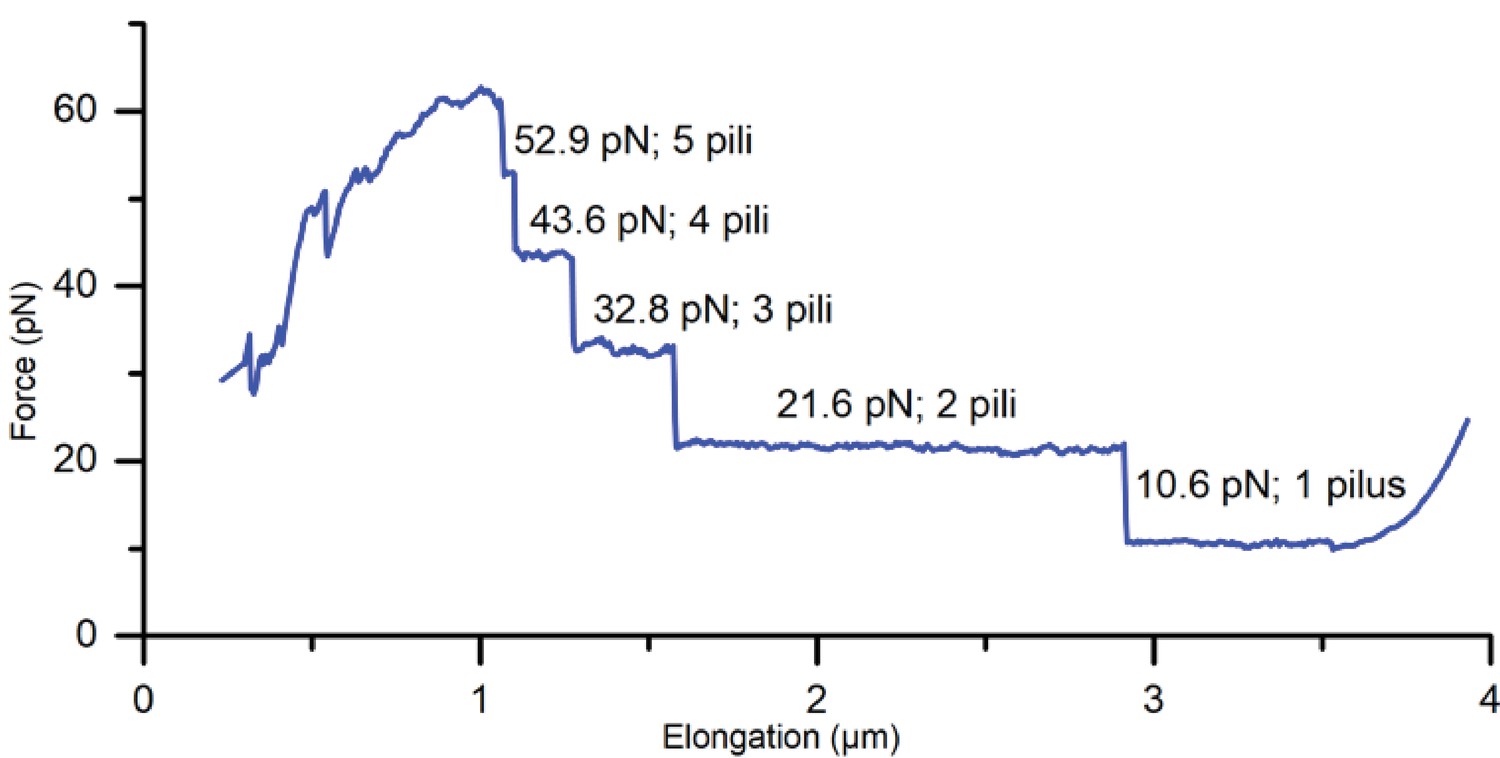
Force spectroscopy measurement showing attachment of multiple pili (A22R).
Since the uncoiling force of a pilus being extended by a attached microsphere is constant, the measured force response of all attached pili is a multiple of the force required to uncoil a single pilus, thus providing discrete values for each force plateau.
Figure 5 with 3 supplements
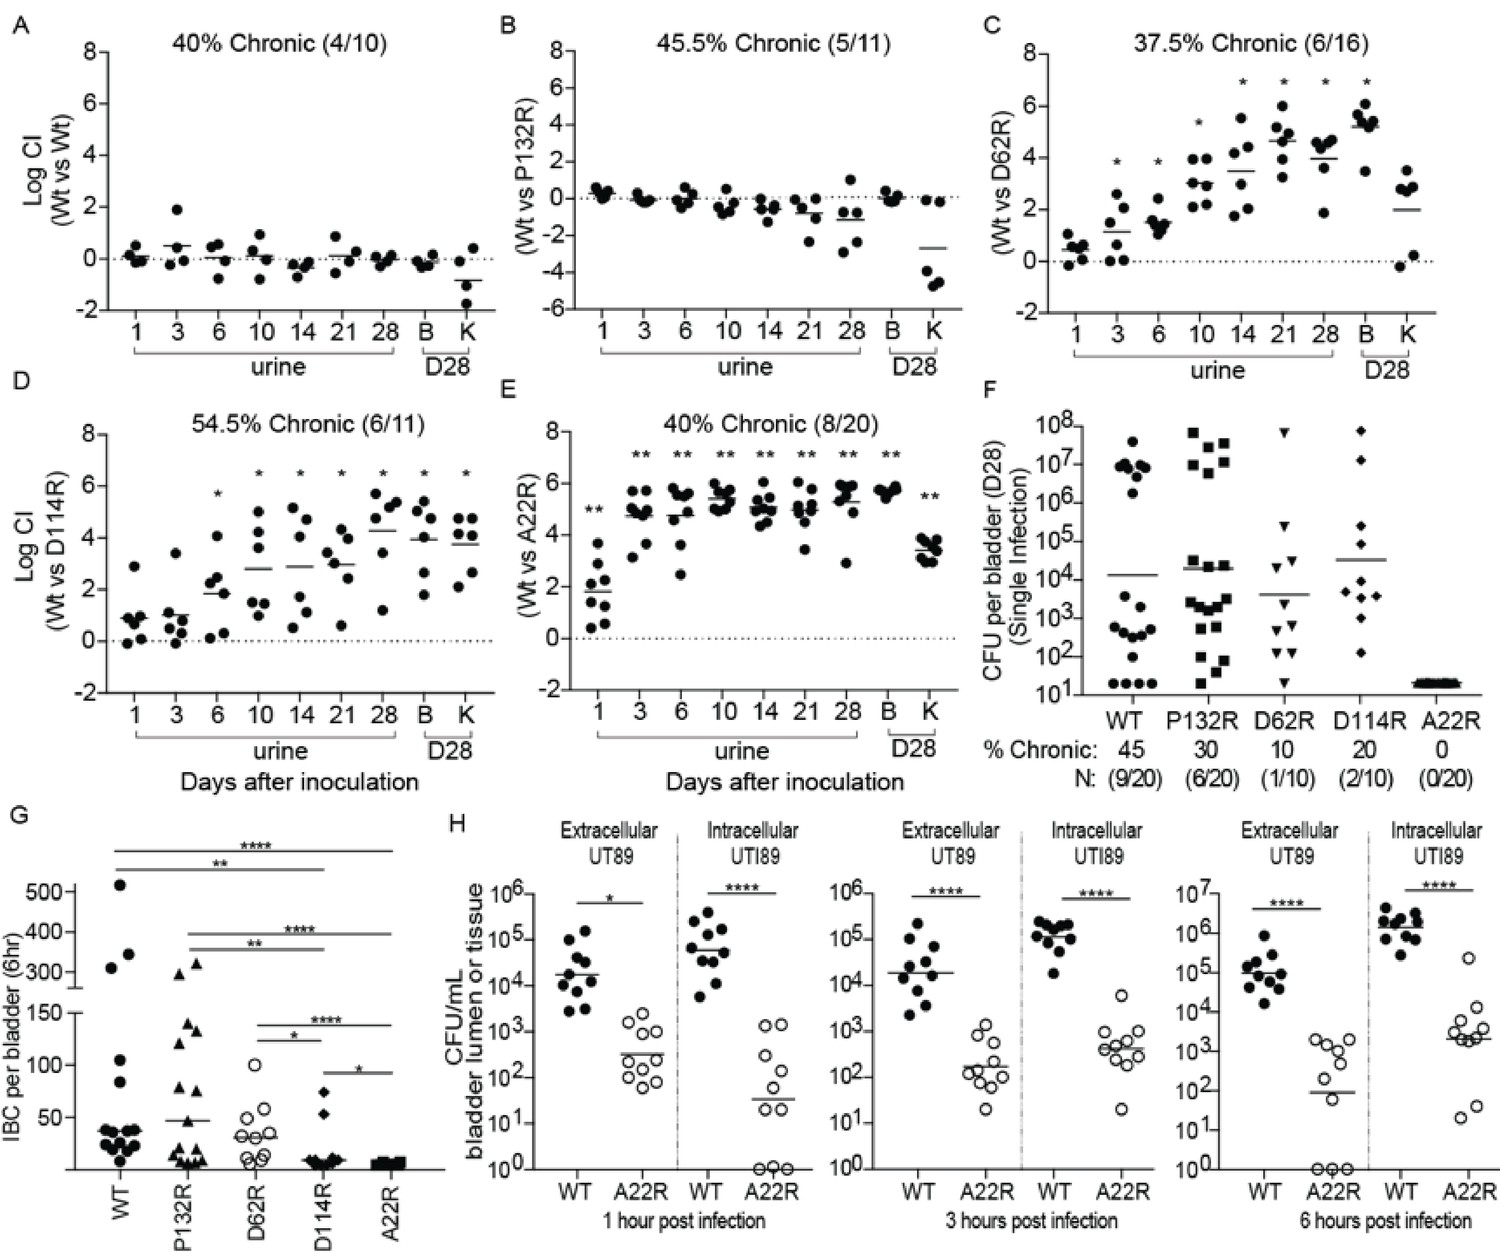
Point mutations in FimA alter UPEC pathogenesis in the bladder.
C3H/HeN mice were concurrently transurethrally inoculated with 1 × 10⁸ CFU of wildtype (WT) UTI89 and one of four isogenic UTI89 strains containing point mutations in the fimA gene. (A–E) Longitudinal urinalyses were performed over 28 days and examination of UTI89 and FimA mutant titers in bladders and kidneys were determined at time of sacrifice (28 dpi). (F) Mice were also infected singly, via transurethral inoculation, with UTI89 or FimA mutant strains. Longitudinal urinalysis was perfomed over 28 days (Figure 5—figure supplement 3). Bladders titers taken at 28 dpi after single infections are shown in panel F along with the percentage of mice that developed chronic UTI (% chronic) along with the number of mice used in the study (N). (G) Number of intracellular bacterial communities (IBCs) formed by indicated strain at 6 hr post infection (hpi). (H) Mice were singly infected with WT or A22R mutant and the ability of each strain to invade into bladder tissue was assed as 1, 3, and 6 hr post infection. Intracellular bacteria were able to invade into the bladder tissue while extracellular bacteria were detected in the bladder lumen. Abbreviations. B = bladder, K = kidney, CI = competitive index. Bars represent mean (A–E), geometric mean (F, H), and median (G). *p<0.05, **p<0.01, ***p<0.001, ****p<0.0001 by Wilcoxon Signed Ranked test (A–F) or Mann Whitney U test (G, H). N = 10, 2 replicates (A, G, H); N = 11, 2 replicates (B, E); N = 16, 3 replictates (C); N = 18, 3 replicates (D); N = 20 mice, 4 replicates (F, G); N = 15, 3 replicates, (H); N = 4, 2 replicates (I). All replicates are biological.
Figure 5—figure supplement 1

Chromosomally integrated point mutations in fimA gene do not prevent the expression or function of type 1 pili in vitro.
(A) Representative negative stain EM images of UTI89 strains producing WT FimA or one of the indicated mutant variants. (B) Percentage of bald, lowly-, moderately-, and highly-piliated cells in the different UTI89 populations. (C) The relative ability of the WT strain and each mutant to bind and agglutinate guinea pig red blood cells as assessed by hemagglutination titer analysis. Abbreviations: HA = hemagglutination assay. Bars represent mean ±SD (C). N = 600 cell counted per mutant, two biological replicates (B); N = 4 biological replicates with two technical replicates each (C).
Figure 5—figure supplement 2

CFU titers for mice that resolved competitive bladder infections shown in Figure 5.
C3H/HeN mice were concurrently colonized, via transurethral inoculation, with 1 × 10⁸ CFU of wildtype (WT) UTI89 and one of 4 isogenic UTI89 strains containing point mutations in fimA. The resolution of infection in mice was determine by longitudinal urinalysis and examination of UTI89 titers in bladders and kidneys at time of sacrifice (28 dpi). The mice that resolved infection by both strains (percentage shown above each graph) are shown here. Chronically infected mice are shown in Figure 5. Abbreviations. B = bladder, K = kidney, CI = competitive index. Bars represent mean values.
Figure 5—figure supplement 3
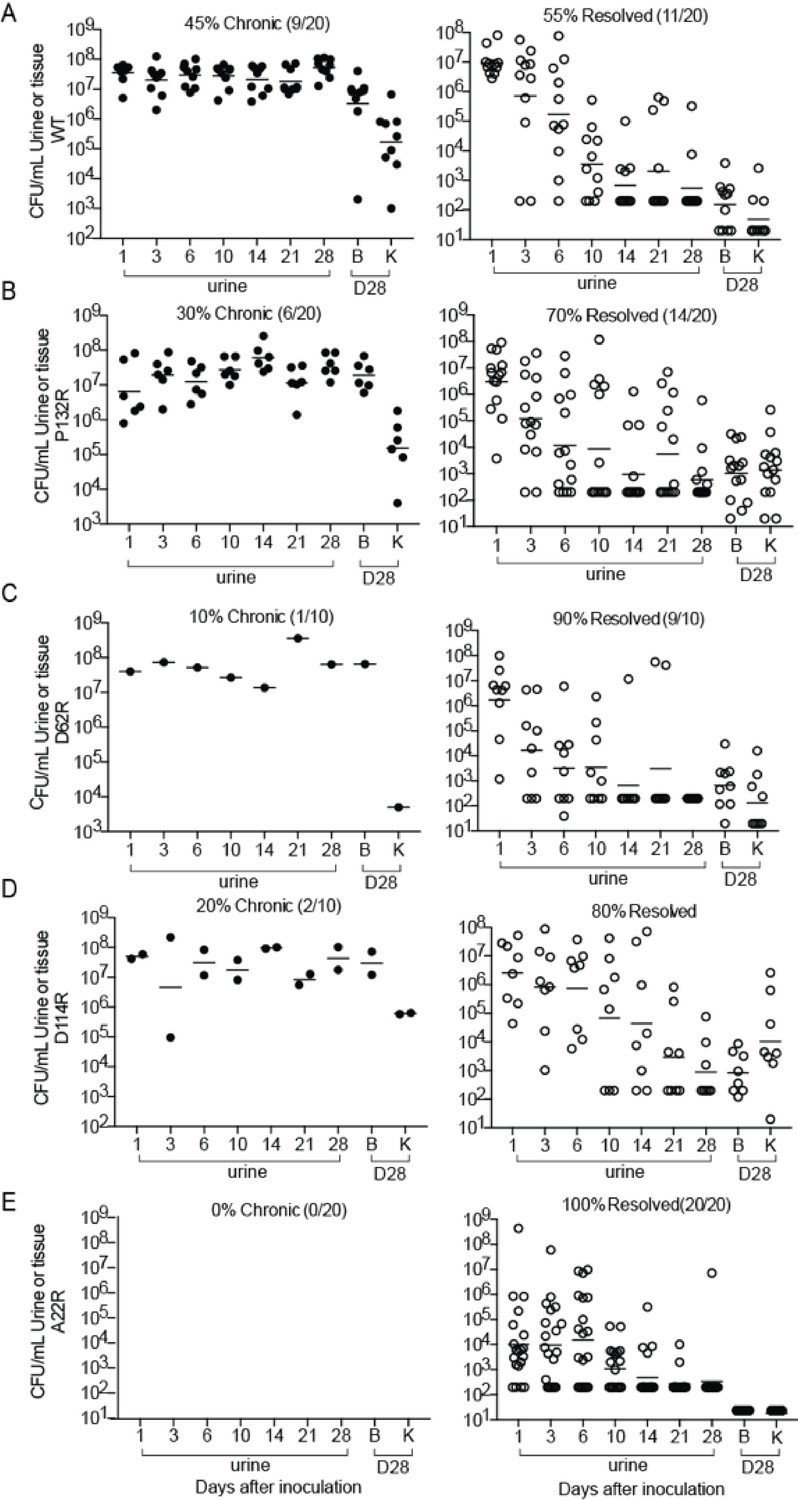
CFU titers for mice that developed chronic UTI or resolved infection in single bladder infections shown in Figure 5.
(A–E) C3H/HeN mice were singly colonized, via transurethal inoculation, with 1 × 10⁸ CFU of wildtype (WT) UTI89 or one of 4 isogenic UTI89 strains containing point mutations in fimA. The status of infection (mice that were chronically infected or those that resolved infection) was determine by longitudinal urinalysis and examination of UTI89 titers in bladders and kidneys at time of sacrifice (28 dpi). Mice that developed chronic infection are shown on the left while those that resolved infection are shown on the right. Percentages of each outcome are given above each graph. Abbreviations. B = bladder, K = kidney. Bars represent geometric mean.
Figure 6
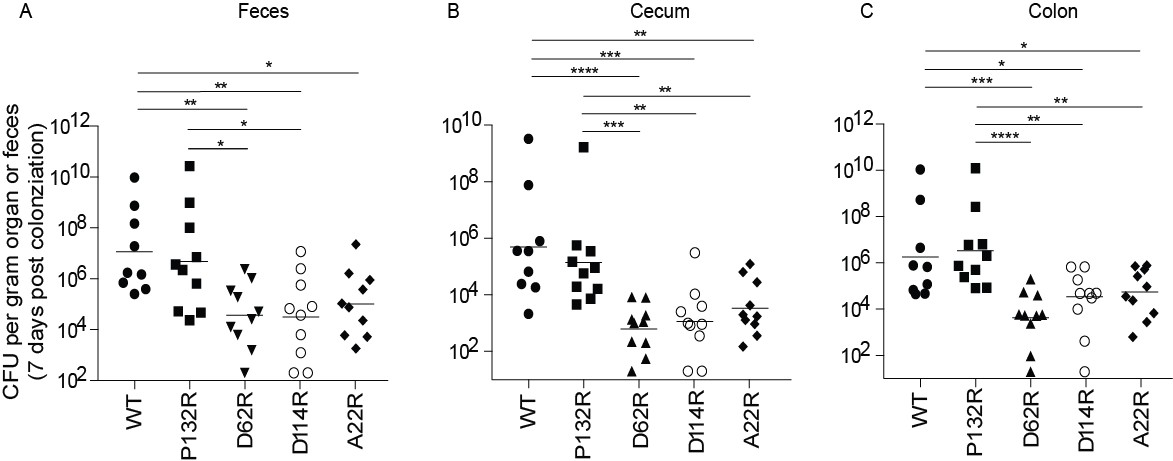
Mutations in FimA alter the ability of UTI89 to colonize the intestine.
C3H/HeN mice were orally gavaged with streptomycin, to disrupt colonization resistance, and one day later orally gavaged with 1 × 10⁸ CFU of WT UTI89 or one of 4 isogenic UTI89 strains with point mutations in fimA. The burden of each FimA mutant was determined via CFU counting in were determined the feces, cecum, or colon of mice at 7 days post colonization. Bars represent geometric mean. *p<0.05, **p<0.01, ***p<0.001, ****p<0.0001 by Mann Whitney U test. N = 10, 2 biological replicates.
Additional files
-
Supplementary file 1
Validation statistics for FimA model
- https://doi.org/10.7554/eLife.31662.019
-
Supplementary file 2
Helical parameters comparison within FimA models
- https://doi.org/10.7554/eLife.31662.020
-
Supplementary file 3
FimA sequences used in analysis of conservation and selection
- https://doi.org/10.7554/eLife.31662.021
-
Supplementary file 4
List of FimC and FimH sequences
- https://doi.org/10.7554/eLife.31662.022
-
Supplementary file 5
Codon-by-codon selection analysis in fimA
- https://doi.org/10.7554/eLife.31662.023
-
Supplementary file 6
Reference and UPEC strains used in analysis of fimA carriage
- https://doi.org/10.7554/eLife.31662.024
-
Supplementary file 7
In vivo and in vitro phenotypes of fim A mutants
- https://doi.org/10.7554/eLife.31662.025
-
Transparent reporting form
- https://doi.org/10.7554/eLife.31662.026
Download links
A two-part list of links to download the article, or parts of the article, in various formats.
Downloads (link to download the article as PDF)
Open citations (links to open the citations from this article in various online reference manager services)
Cite this article (links to download the citations from this article in formats compatible with various reference manager tools)
Functional role of the type 1 pilus rod structure in mediating host-pathogen interactions
eLife 7:e31662.
https://doi.org/10.7554/eLife.31662


