Integrative and distinctive coding of visual and conceptual object features in the ventral visual stream
- University of Toronto, Canada
- Mount Allison University, Canada
- Baycrest, Canada
- Queen's University, Canada
Figures
Figure 1
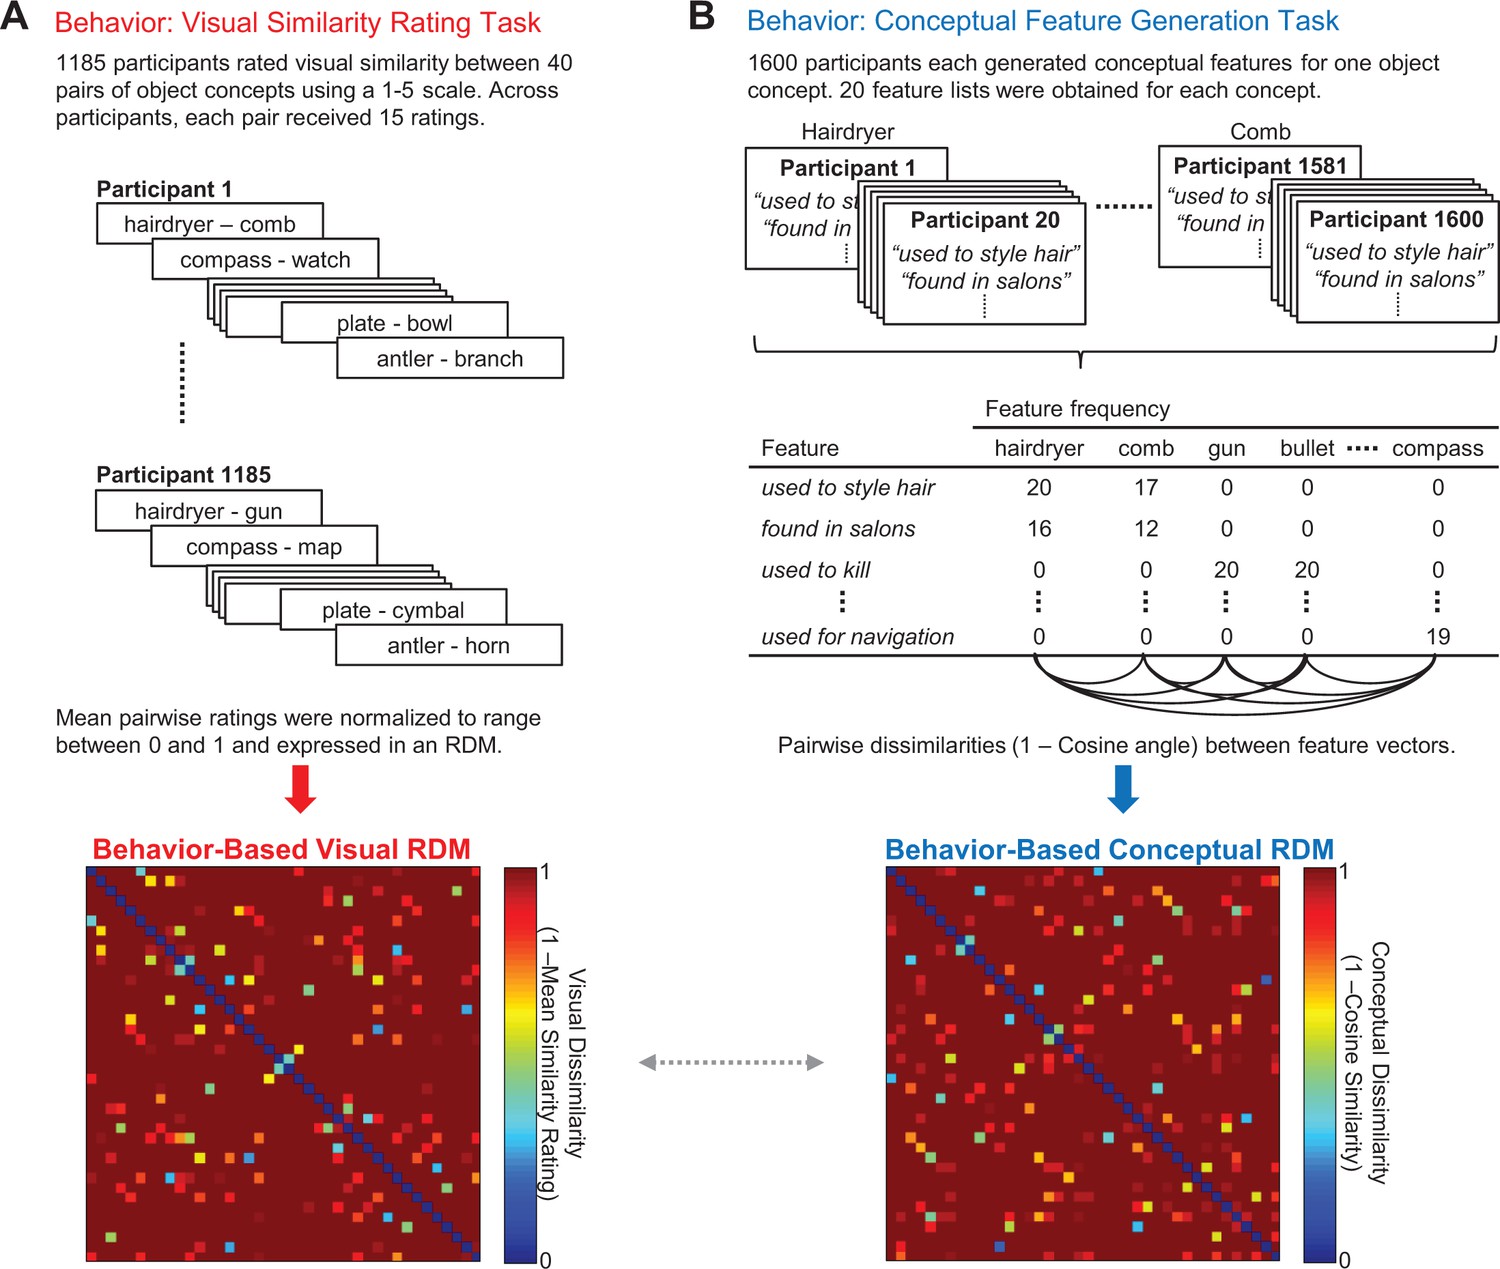
Behavior-based RDMs.
(A) Visual similarity rating task (top) and corresponding 40 × 40 behavior-based visual RDM (bottom). (B) Conceptual feature generation task (top), abridged feature matrix depicting the feature frequencies across participants for each concept (middle), and corresponding 40 × 40 behavior-based conceptual RDM (bottom). The dashed horizontal arrow between behavior-based RDMs denotes a second-level RSA that compared these similarity models with one another. All object concepts are listed in Figure 1—source data 1 - Object concepts and targeted pairs. Behavior-based RDMs (together with the word2vec RDM) are contained in Figure 1—source data 2 - Behavior-based RDMs and word2vec RDM.
-
Figure 1—source data 1
Object concepts and targeted pairs.
- https://doi.org/10.7554/eLife.31873.004
-
Figure 1—source data 2
Behavior-based RDMs and word2vec RDM.
- https://doi.org/10.7554/eLife.31873.005
Figure 2
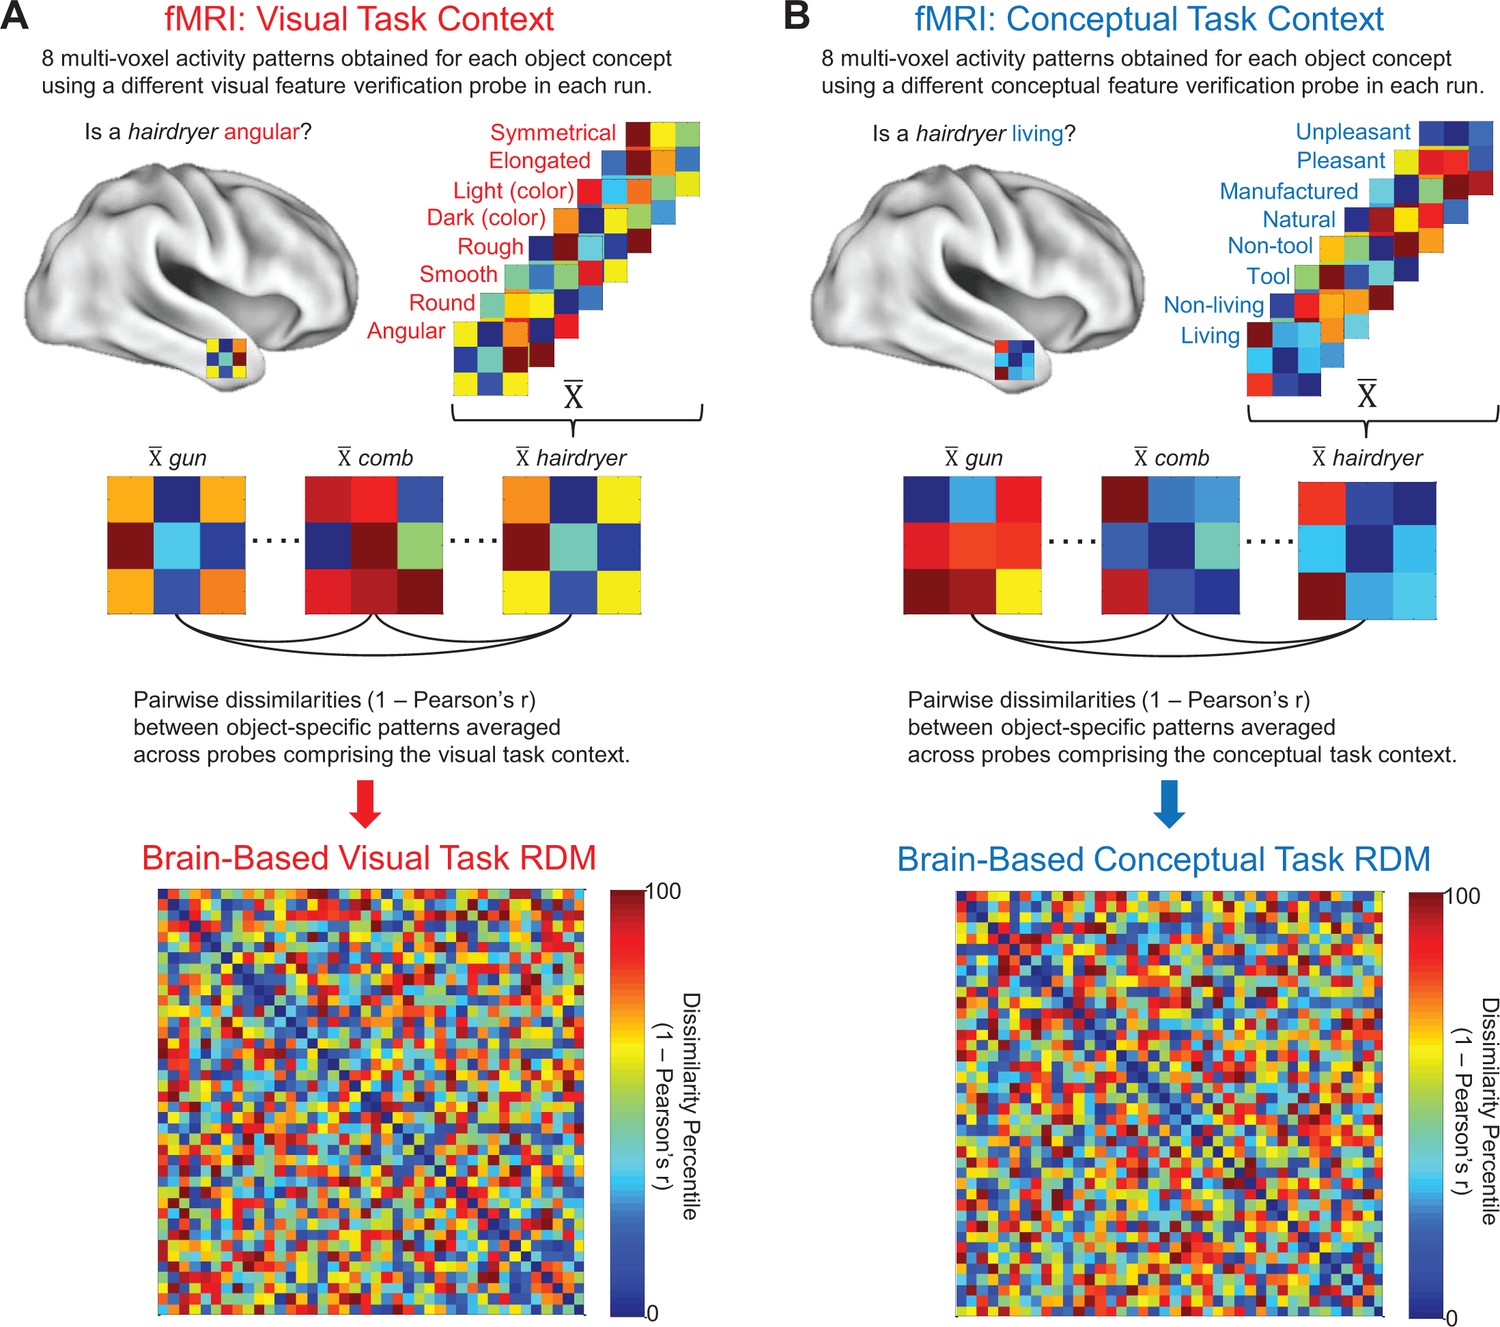
Brain-based RDMs.
(A) Example of object-evoked neural activity patterns obtained across all eight probes in the visual task context (top), mean object-specific activity patterns averaged across repetitions (middle), and corresponding 40 × 40 brain-based visual task RDM derived from a first-level RSA (bottom). (B) Example of object-evoked neural activity patterns obtained across all eight probes in the conceptual task context (top), mean object-specific activity patterns averaged across repetitions (middle), and corresponding 40 × 40 brain-based conceptual task RDM derived from a first-level RSA (bottom).
Figure 3
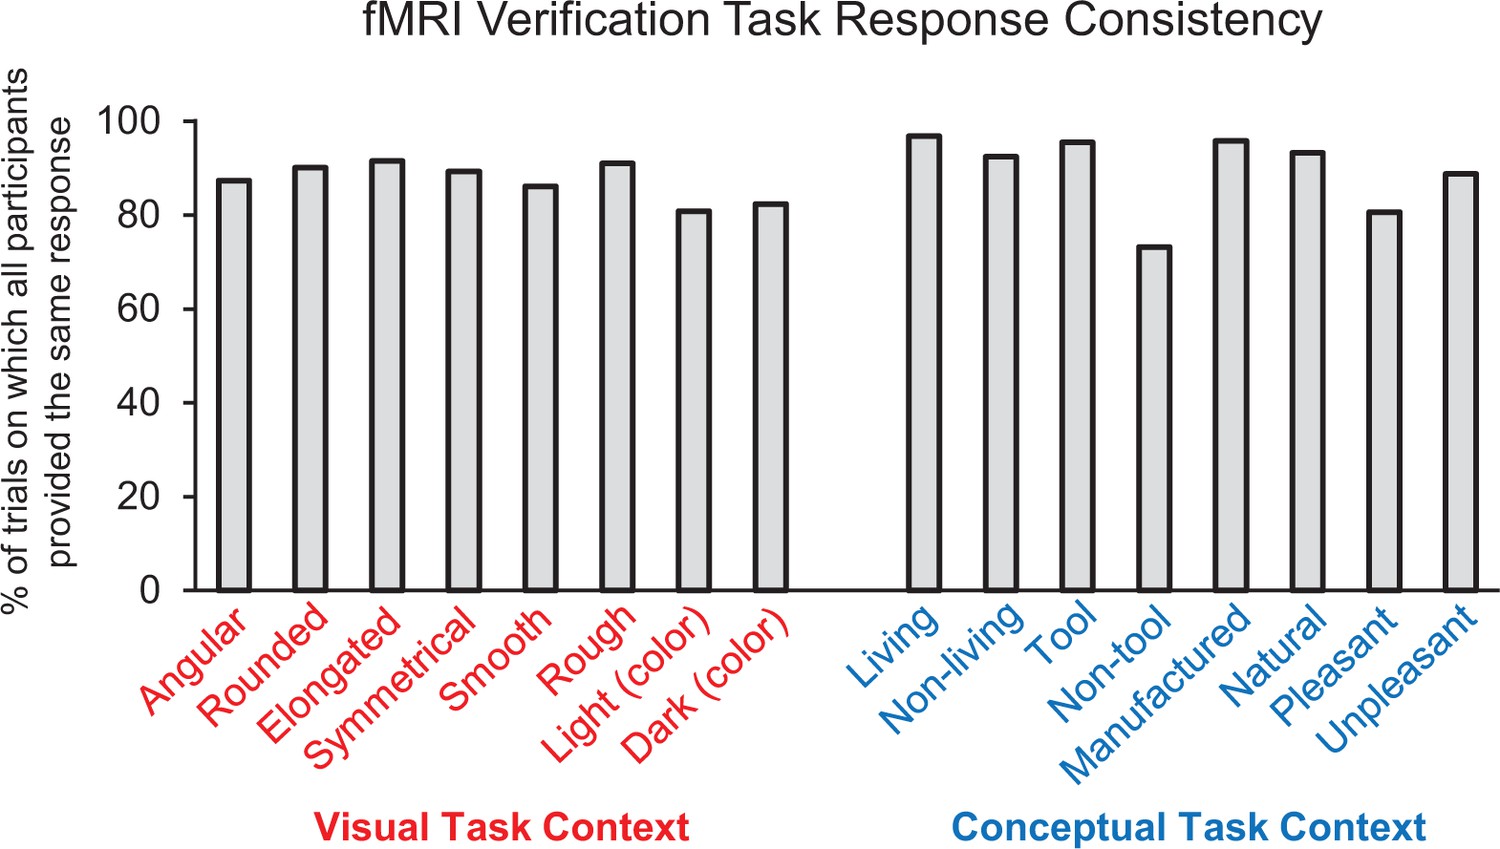
fMRI feature verification task performance.
Percentage of trials on which all participants (i.e. 16/16) provided the same ‘yes/no’ response for each property verification probe.
Figure 4
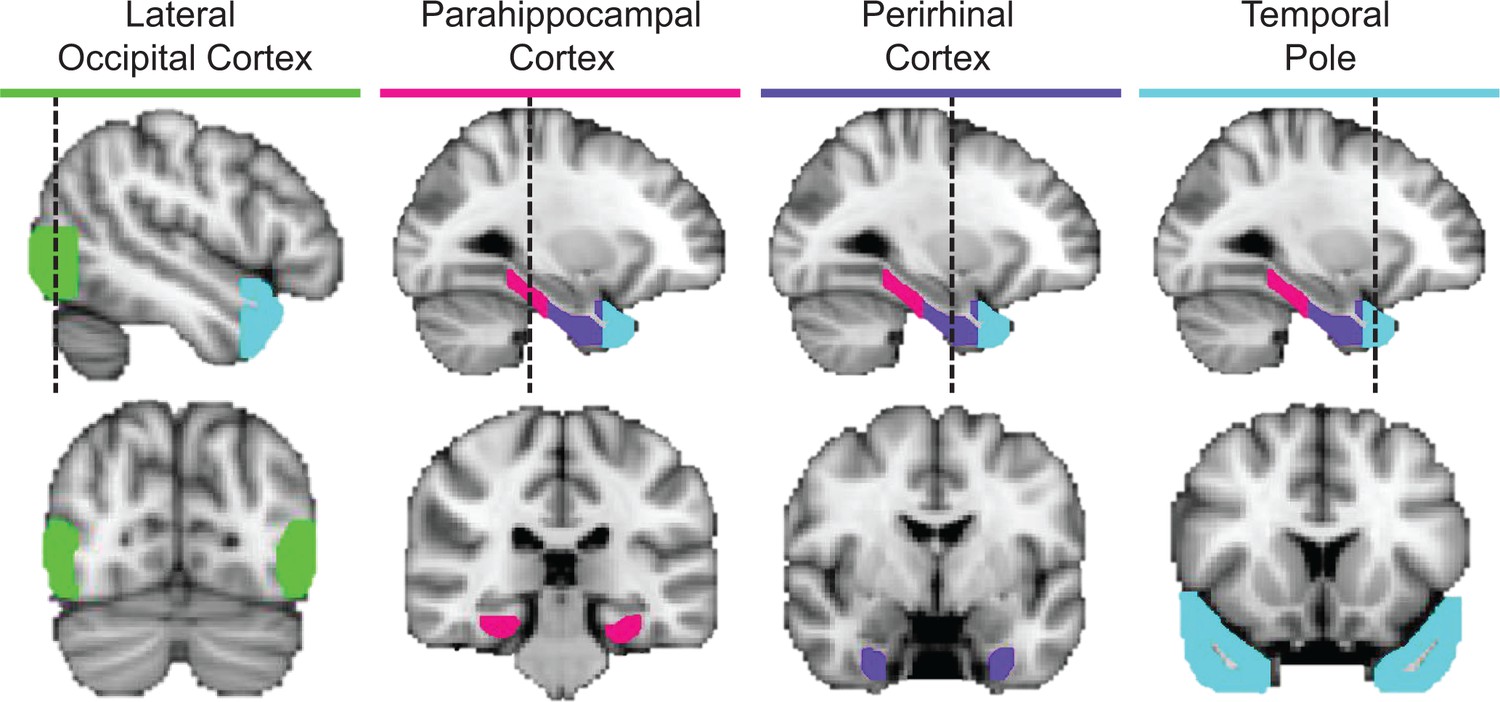
ROIs in a representative participant.
Cortical regions examined in the ROI-based RSAs, including lateral occipital cortex (green), parahippocampal cortex (pink), perirhinal cortex (purple), and the temporal pole (cyan).
Figure 5
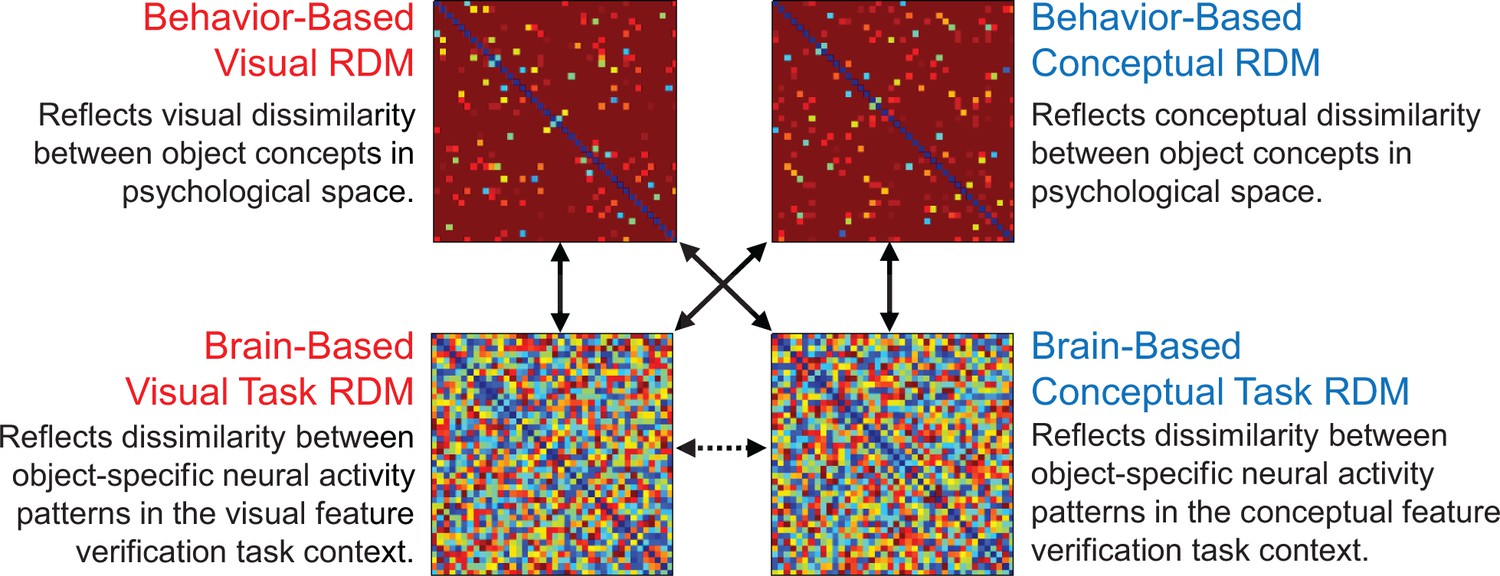
Second-level RSAs.
Solid vertical and diagonal arrows reflect second-level RSA in which behavior-based RDMs were compared with brain-based RDMs (ROI-based results in Figure 6, searchlight-based results in Figures 9, 10 and 11). The dashed horizontal arrow between brain-based RDMs reflects second-level RSA in which neural pattern similarities from each task context were directly compared with each other (results in Figure 7).
Figure 6 with 1 supplement
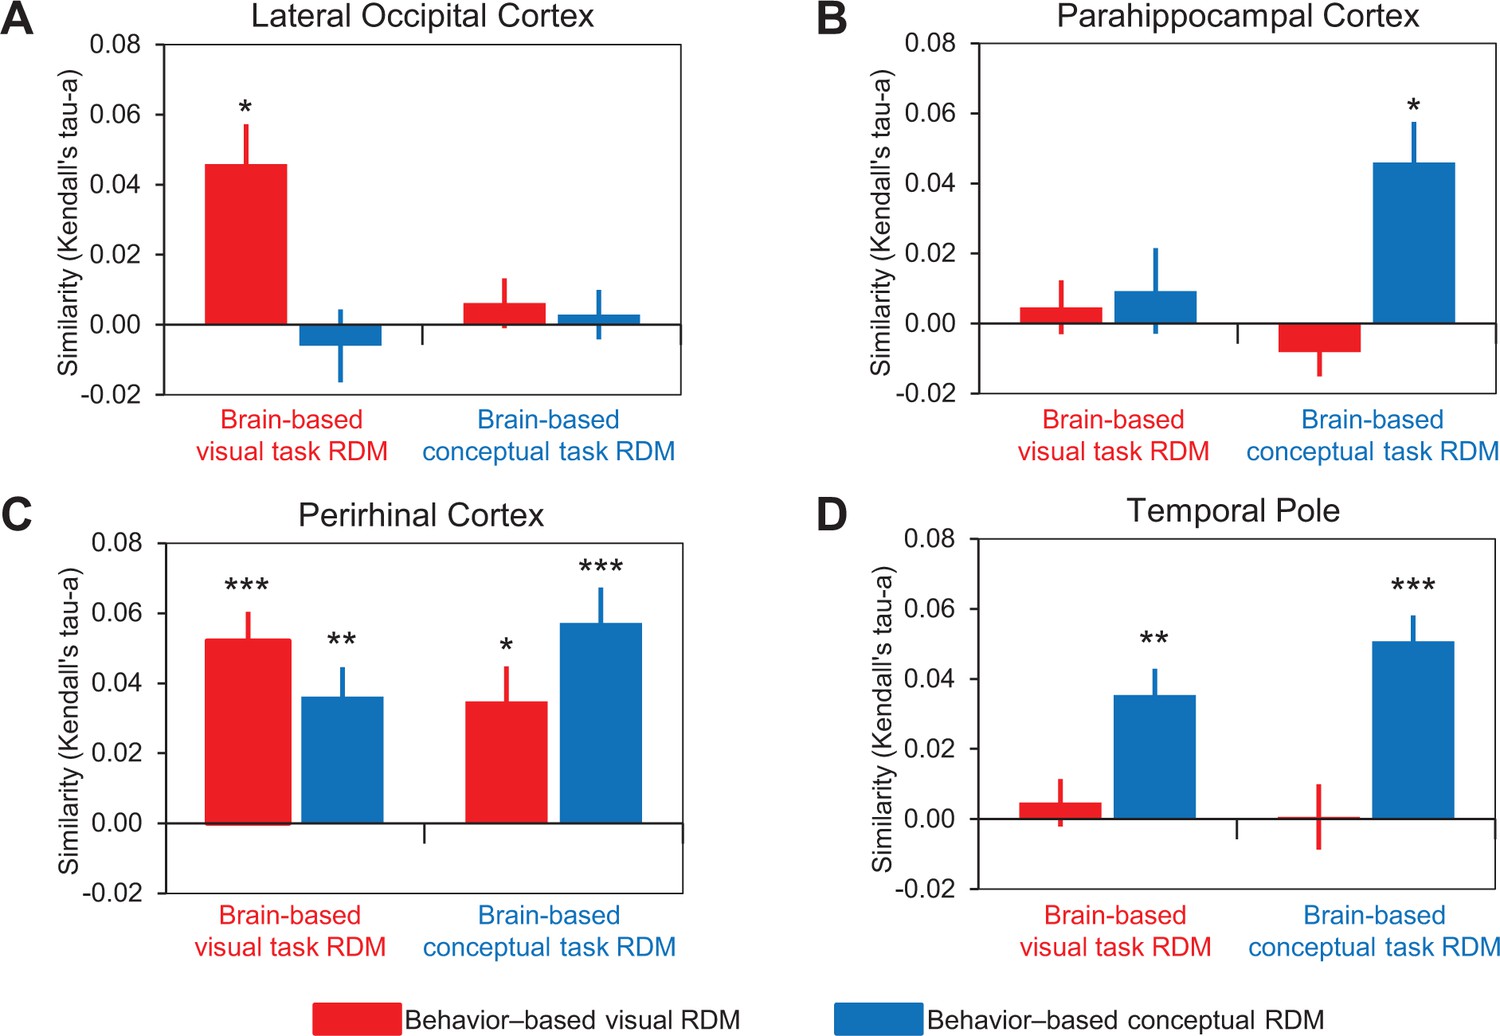
Comparison of behavior-based and brain-based RDMs.
Similarities between behavior-based and brain-based RDMs are plotted for (A) LOC, (B) parahippocampal cortex, (C) PRC, and (D) the temporal pole. These comparisons are denoted by the solid vertical and diagonal arrows in Figure 5. Similarity was quantified as the ranked correlation coefficient (Kendall’s tau-a) between behavior-based RDMs and the brain-based RDMs. Error bars indicate standard error of the mean. ***p<0.001, **p<0.01, *p<0.05 (Bonferroni corrected). Participant-specific Kendall’s tau-a co-efficients are contained in Figure 6—source data 1 - Comparison of similarity models and brain-based RDMs.
-
Figure 6—source data 1
Comparison of similarity models and brain-based RDMs.
- https://doi.org/10.7554/eLife.31873.012
Figure 6—figure supplement 1
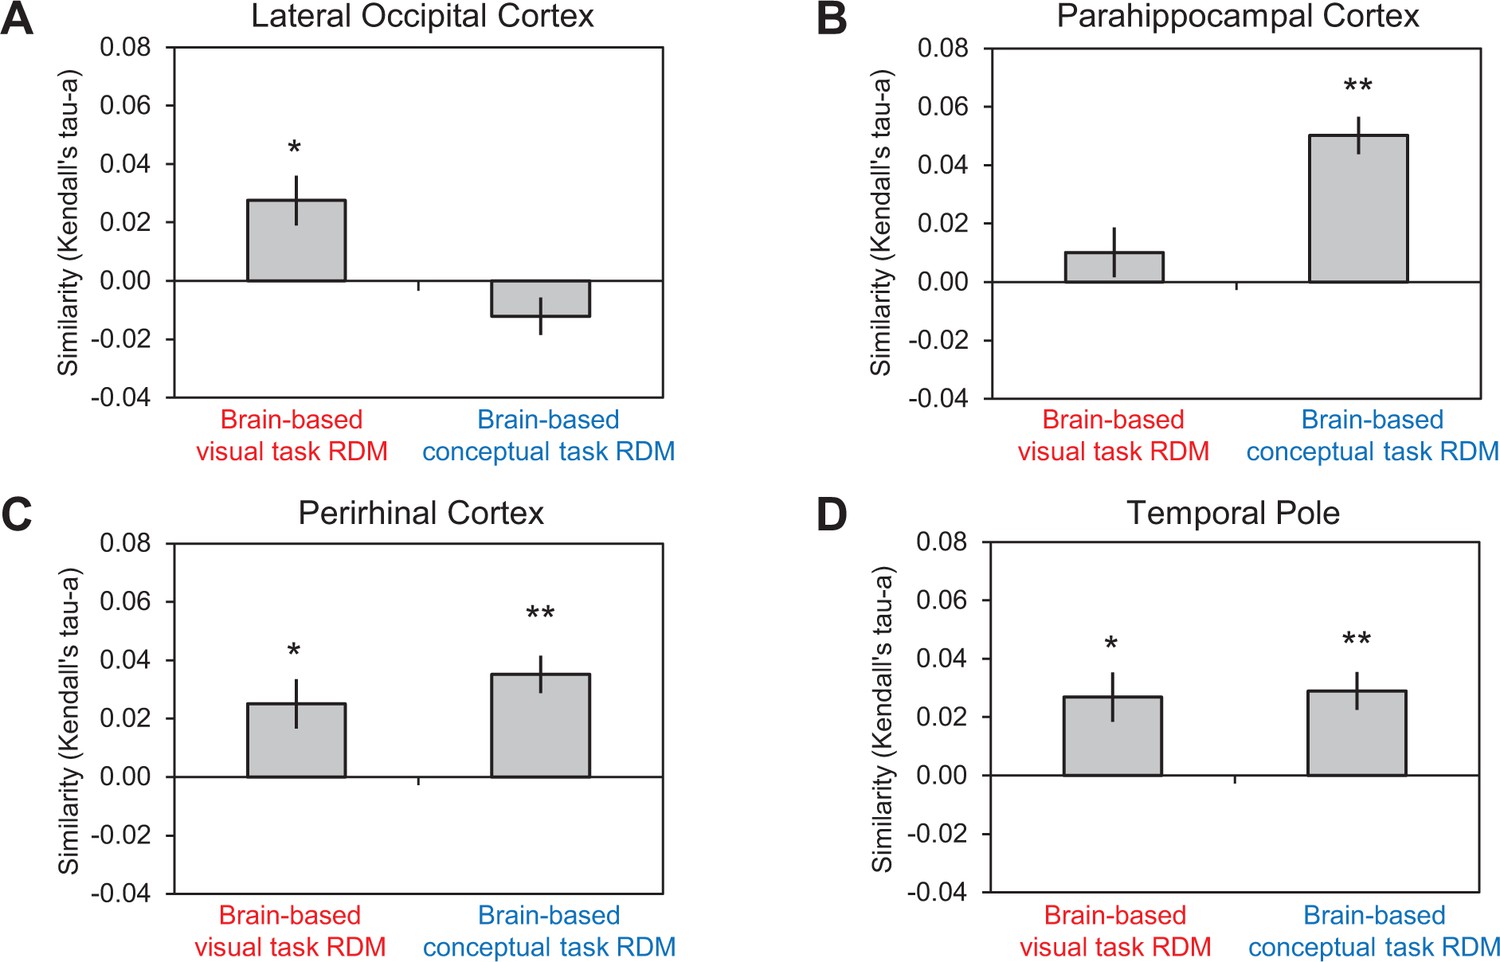
Comparison of word2vec RDM with brain-based RDMs.
Similarities between the word2vec RDM and brain-based RDMs are plotted for (A) LOC, (B) parahippocampal cortex, (C) PRC, and (D) the temporal pole. Similarity was quantified as the ranked correlation coefficient (Kendall’s tau-a) between behavior-based RDMs and the brain-based RDMs. Error bars indicate standard error of the mean. **p<0.01, *p<0.05 (Bonferroni corrected). Participant-specific Kendall’s tau-a co-efficients are contained in Figure 6—source data 1 - Comparison of similarity models and brain-based RDMs.
Figure 7
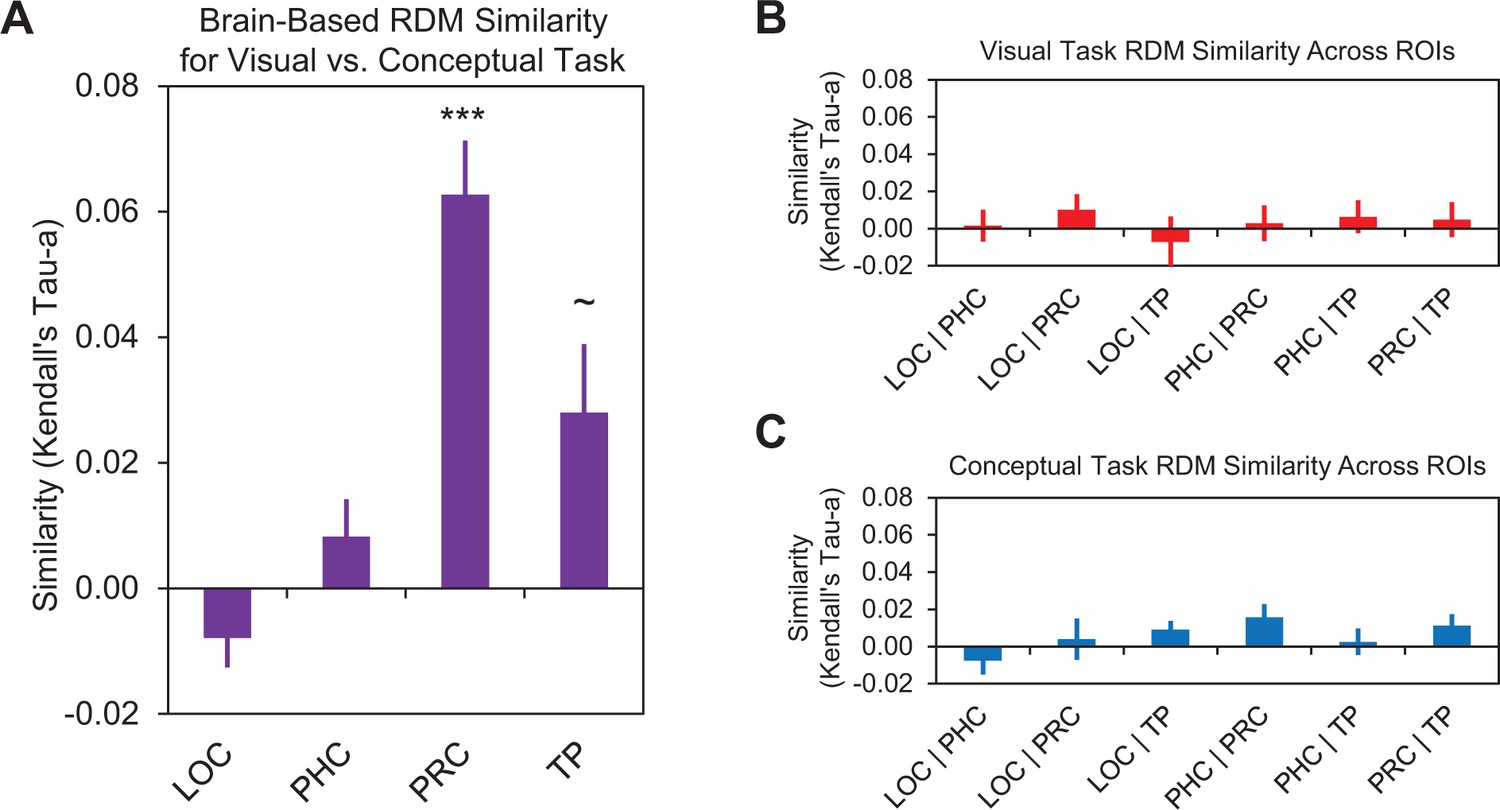
Comparison of brain-based RDMs.
(A) Similarities between brain-based visual task RDMs and brain-based conceptual task RDMs within lateral occipital cortex (LOC), parahippocampal cortex (PHC), perirhinal cortex (PRC), and the temporal pole (TP). These comparisons are denoted by the dashed horizontal arrow in the bottom of Figure 5. (B) Similarities between brain-based visual task RDMs across different ROIs. Labels on the x-axis denote the ROIs being compared. (C) Similarities between brain-based conceptual task RDMs across different ROIs. Similarity was quantified as the ranked correlation coefficient (Kendall’s tau-a) between behavior-based RDMs and the brain-based RDMs. Error bars indicate standard error of the mean. ***p<0.001 (Bonferroni corrected),~p < 0.05 (uncorrected). Participant-specific Kendall’s tau-a co-efficients are contained in Figure 7—source data 1 - Comparison of brain-based RDMs.
-
Figure 7—source data 1
Comparison of brain-based RDMs.
- https://doi.org/10.7554/eLife.31873.014
Figure 8
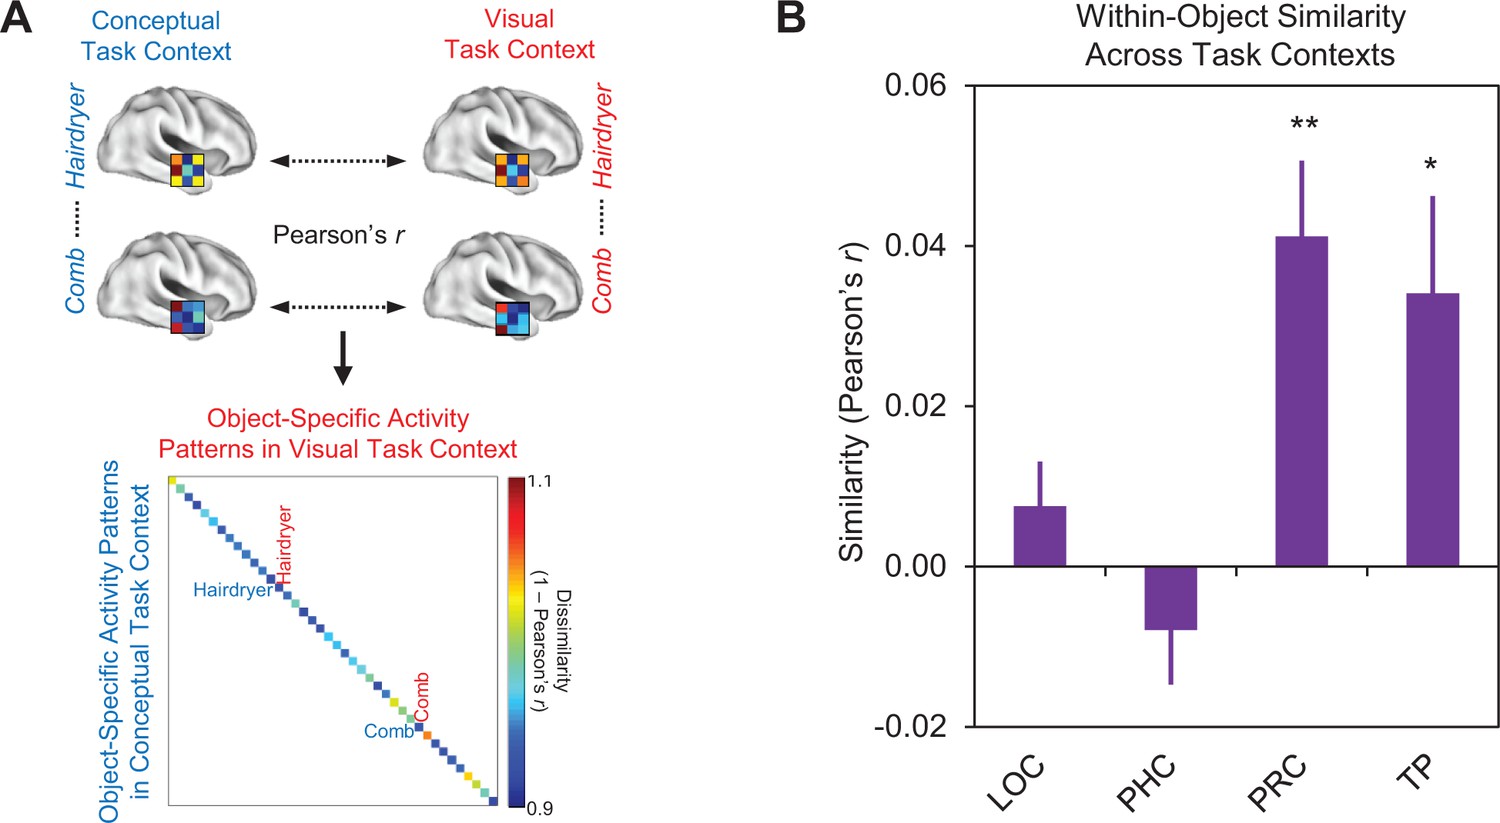
Comparison of within-object multi-voxel activity patterns across different task contexts.
(A) Depiction of first-level RSA procedure for quantifying within-object multi-voxel activity patterns across the visual and conceptual task contexts. (B) Mean similarities between within-object multi-voxel activity patterns across different task contexts within each region of interest. Similarity was quantified as the linear correlation coefficient (Pearson’s r) between object-evoked multi-voxel activity patterns. Lateral occipital cortex (LOC), parahippocampal cortex (PHC), perirhinal cortex (PRC), and the temporal pole (TP). Error bars indicate standard error of the mean. **p<0.01, *p<0.05 (Bonferroni corrected). Participant-specific Pearson’s r co-efficients are contained in Figure 8—source data 1 - Comparison of within-object similarity across task contexts.
-
Figure 8—source data 1
Comparison of within-object similarity across task contexts.
- https://doi.org/10.7554/eLife.31873.016
Figure 9
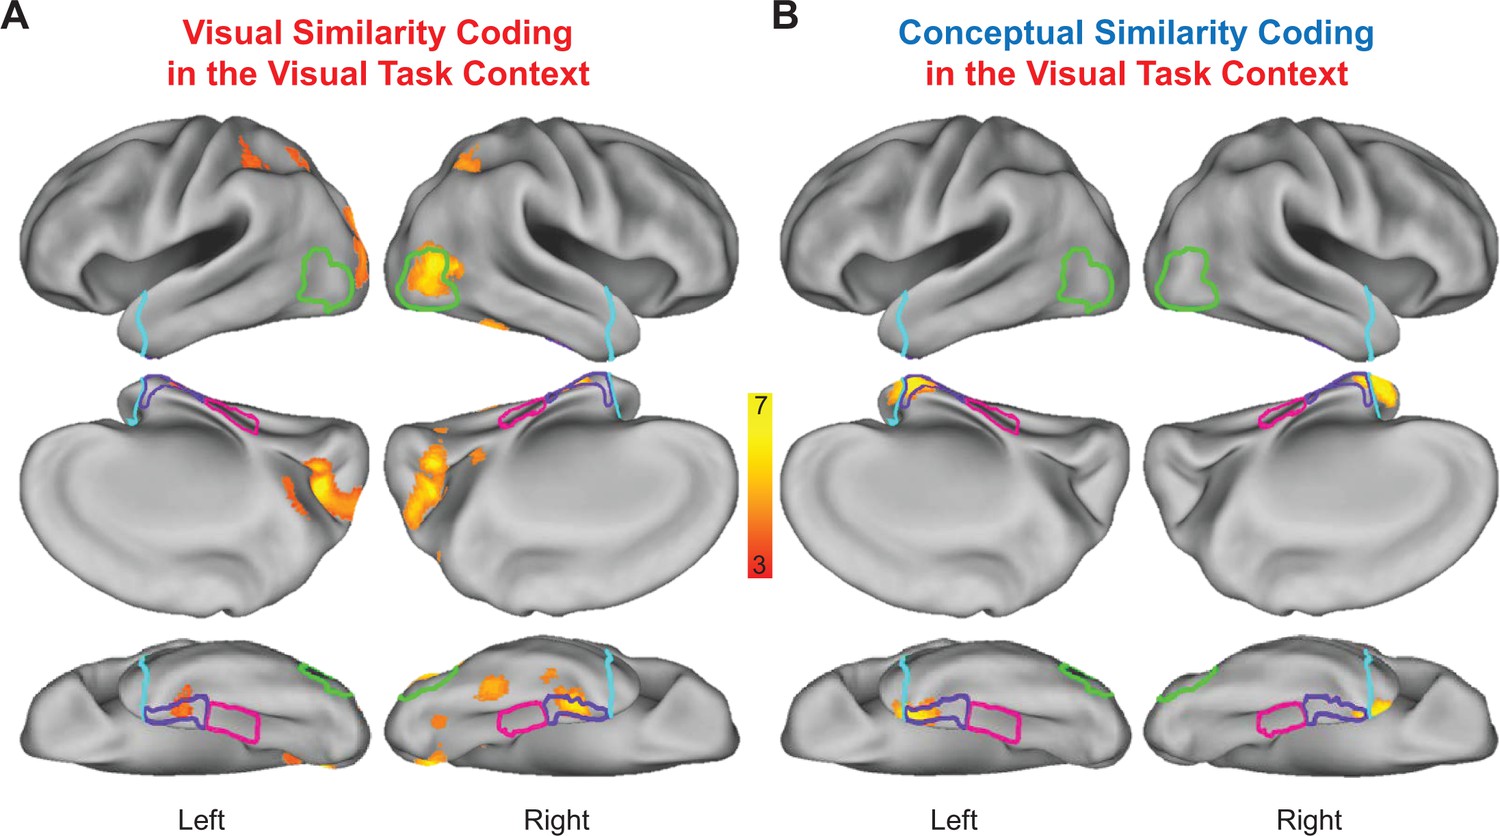
Visual task context representational similarity searchlight mapping results.
(A) Cortical regions in which the brain-based visual task RDMs were significantly correlated with the behavior-based visual RDM. (B) Cortical regions in which the brain-based visual task RDMs were significantly correlated with the behavior-based conceptual RDM. The correlation coefficients (Kendall’s tau-a) obtained between behavior-based RDMs and brain-based RDMs were Fisher-z transformed and mapped to the voxel at the centre of each searchlight. Similarity maps were corrected for multiple comparisons using threshold-free cluster enhancement with a corrected statistical threshold of p<0.05 on the cluster level (Smith and Nichols, 2009). Outlines are shown for the lateral occipital cortex (green), parahippocampal cortex (pink), perirhinal cortex (purple), and the temporal pole (cyan).
Figure 10
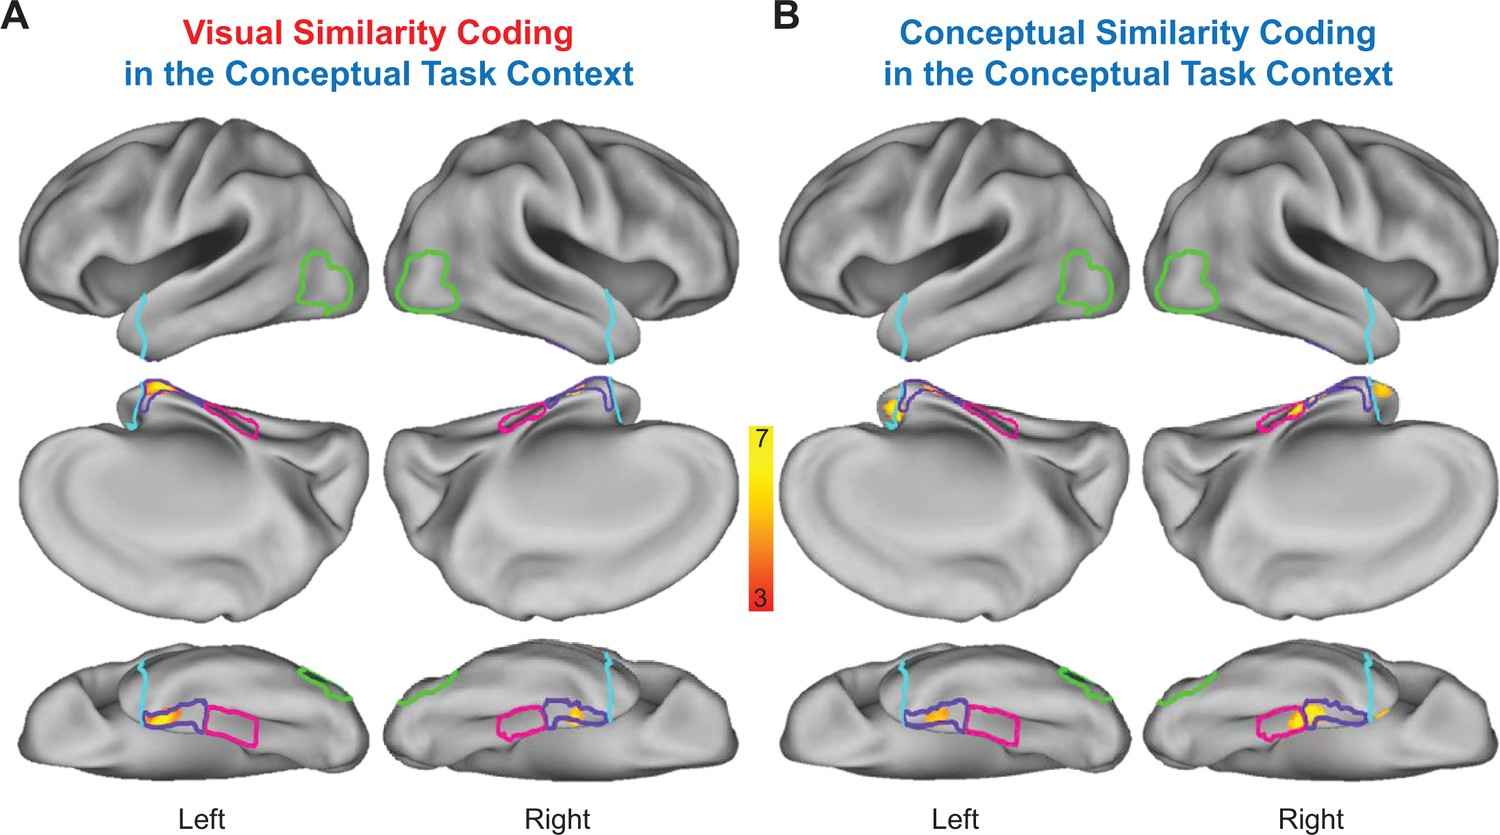
Conceptual task context representational similarity searchlight mapping results.
(A) Cortical regions in which the brain-based conceptual task RDMs were significantly correlated with the behavior-based visual RDM. (B) Cortical regions in which the brain-based conceptual task RDMs were significantly correlated with the behavior-based conceptual RDM. The correlation coefficients (Kendall’s tau-a) obtained between behavior-based RDMs and brain-based RDMs were Fisher-z transformed and mapped to the voxel at the centre of each searchlight. Similarity maps were corrected for multiple comparisons using threshold-free cluster enhancement with a corrected statistical threshold of p<0.05 on the cluster level (Smith and Nichols, 2009). Outlines are shown for the lateral occipital cortex (green), parahippocampal cortex (pink), perirhinal cortex (purple), and the temporal pole (cyan).
Figure 11
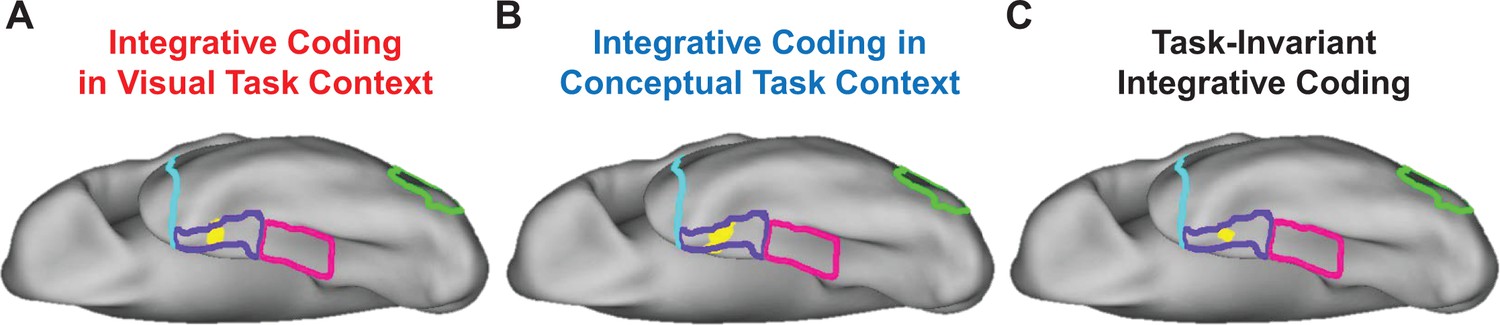
Overlap of searchlight similarity maps.
(A) Overlap between similarity maps obtained in the visual task context (i.e. overlapping voxels from Figure 9A and B). (B) Overlap between similarity maps obtained in the conceptual task context (i.e. overlapping voxels from Figure 10A and B). (C) Overlap across brain-behavior similarity maps across both task contexts (i.e. overlapping voxels from Figures 9A, B, 10A and B). Outlines are shown for the lateral occipital cortex (green), parahippocampal cortex (pink), perirhinal cortex (purple), and the temporal pole (cyan).
Author response image 1
Tables
Table 1
Clusters in which behavior-based RDMs were significantly correlated with brain-based RDMs as revealed using representational similarity searchlight analyses, with corresponding cluster extent, peak z-values, and MNI co-ordinates1.
https://doi.org/10.7554/eLife.31873.019| Region | Cluster extent | Peak z-value | X | Y | Z | ||
|---|---|---|---|---|---|---|---|
| Visual task context | |||||||
| Behavior-Based Visual RDM – Brain-Based Visual Task RDM | |||||||
| Mid calcarine | 1660 | 5.79 | -2 | −74 | 12 | ||
| R lateral occipital cortex | 455 | 3.89 | 50 | −66 | 4 | ||
| R perirhinal cortex | 112 | 3.64 | 34 | −12 | −34 | ||
| L superior parietal lobule | 110 | 3.21 | −32 | −40 | 44 | ||
| L perirhinal cortex | 76 | 2.85 | −30 | −12 | −36 | ||
| R superior parietal lobule | 48 | 2.64 | 38 | −54 | 54 | ||
| R fusiform gyrus | 45 | 2.77 | 40 | −46 | −20 | ||
| R precuneus | 29 | 2.66 | 12 | −76 | 48 | ||
| R Inferior Temporal Gyrus | 9 | 2.52 | 44 | −22 | −28 | ||
| Behavior-Based Conceptual RDM – Brain-Based Visual Task RDM | |||||||
| L Perirhinal Cortex | 368 | 3.96 | −24 | 2 | −38 | ||
| R Perirhinal Cortex | 232 | 3.26 | 22 | 2 | −36 | ||
| Overlap | |||||||
| L Perirhinal Cortex | 22 | −30 | -8 | −38 | |||
| Conceptual task context | |||||||
| Behavior-Based Conceptual RDM – Brain-Based Conceptual Task RDM | |||||||
| L Perirhinal Cortex | 79 | 2.88 | −30 | −10 | −34 | ||
| R Parahippocampal Cortex | 64 | 2.94 | 30 | −24 | −24 | ||
| L Temporal Pole | 61 | 2.89 | −34 | 4 | −26 | ||
| R Temporal Pole | 25 | 2.70 | 24 | 12 | −36 | ||
| Behavior-Based Visual RDM – Brain-Based Conceptual Task RDM | |||||||
| L Perirhinal Cortex | 98 | 4.87 | −26 | -4 | −10 | ||
| R Perirhinal Cortex | 26 | 3.01 | 28 | −12 | −34 | ||
| Overlap | |||||||
| L Perirhinal Cortex | 31 | −26 | -8 | −42 | |||
| Overlap across all Behavior-Based RDMs and Brain-Based RDMs | |||||||
| L Perirhinal Cortex | 16 | −30 | -8 | −36 | |||
-
1MNI co-ordinates are reported for the peak voxel in individual clusters and the centre of mass for cluster overlap.
Additional files
-
Transparent reporting form
- https://doi.org/10.7554/eLife.31873.021
Download links
A two-part list of links to download the article, or parts of the article, in various formats.
Downloads (link to download the article as PDF)
Open citations (links to open the citations from this article in various online reference manager services)
Cite this article (links to download the citations from this article in formats compatible with various reference manager tools)
Integrative and distinctive coding of visual and conceptual object features in the ventral visual stream
eLife 7:e31873.
https://doi.org/10.7554/eLife.31873


