IRF4 haploinsufficiency in a family with Whipple’s disease
- INSERM U1163, France
- Paris Descartes University, France
- Sidra Medicine, Qatar
- The Rockefeller University, United States
- University Aix-Marseille, URMITE, UM63, CNRS 7278, IRD 198, France
- Garvan Institute of Medical Research, Australia
- University of New South Wales, Australia
- Memorial Sloan Kettering Cancer Center, United States
- Institut Pasteur, France
- CNRS UMR2000, France
- Cochin Hospital, France
- Weill Cornell Graduate School of Medical Sciences, United States
- Assistance Publique-Hôpitaux de Paris, Necker Hospital for Sick Children, France
- Howard Hughes Medical Institute, United States
Figures
Figure 1 with 1 supplement
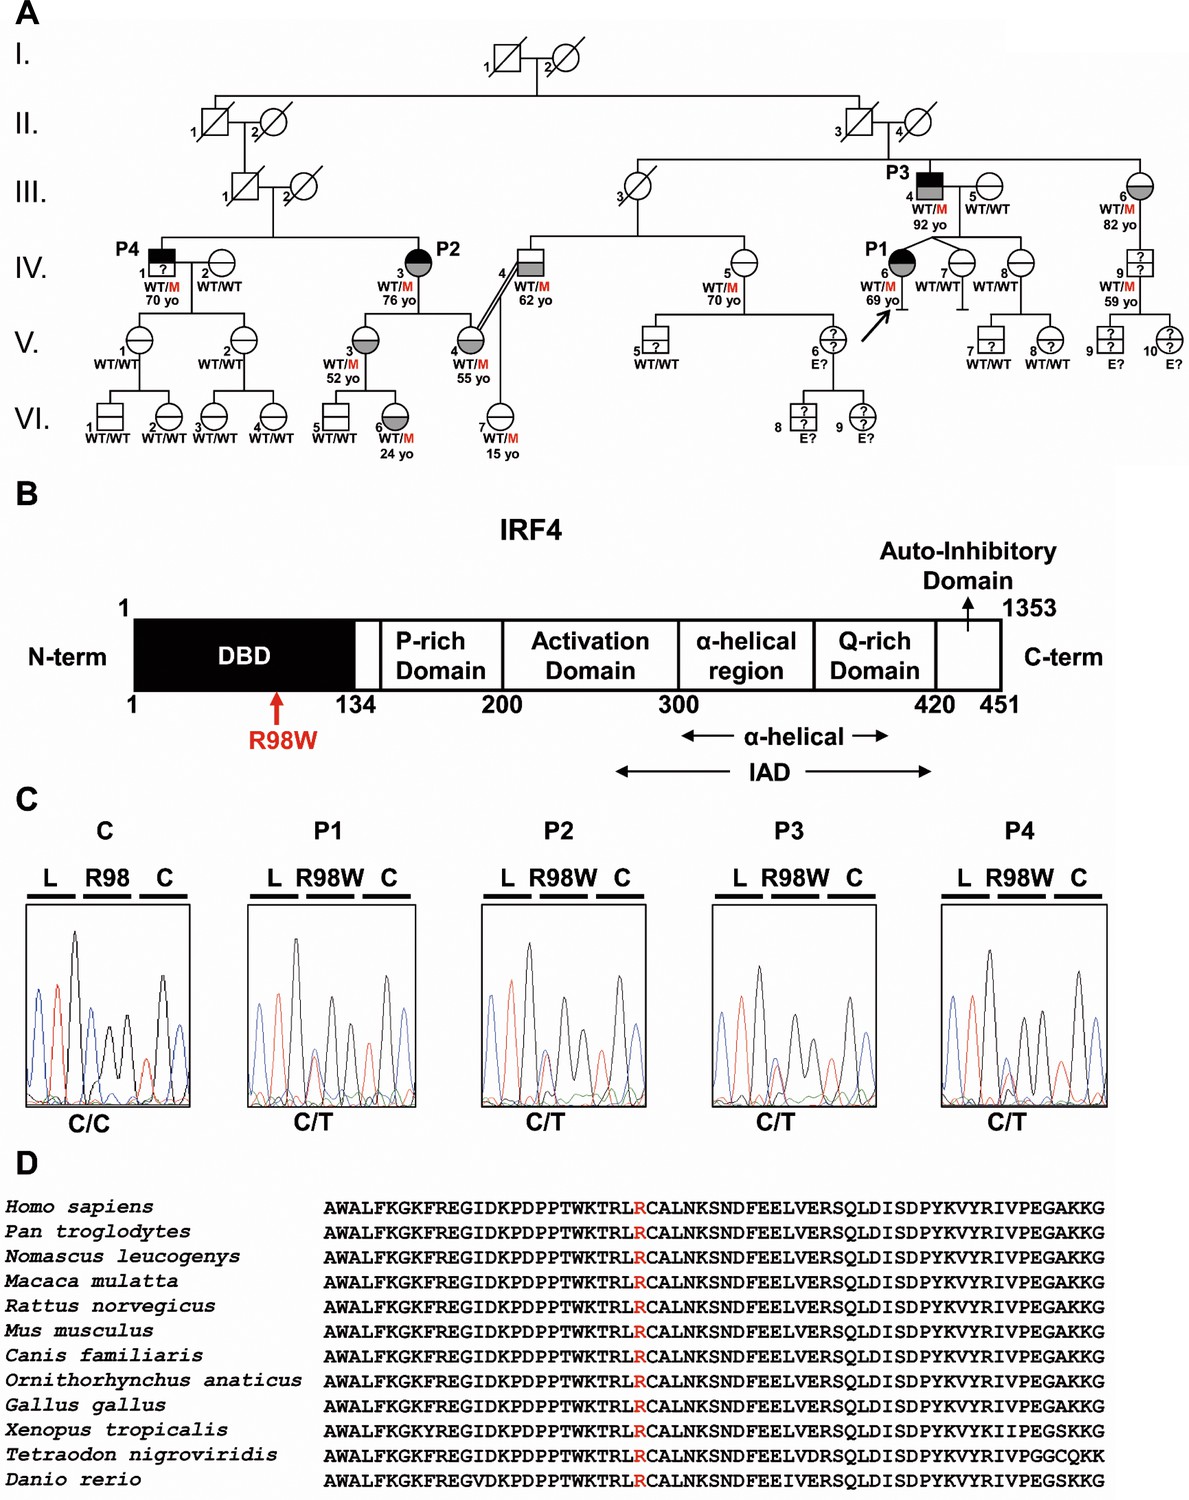
Autosomal dominant IRF4 deficiency.
(A) Pedigree of the kindred, with allele segregation. Generations are designated by Roman numerals (I, II, III, IV, V and VI), and each individual is designated by an Arabic numeral (from left to right). Each symbol is divided into two parts: the upper part indicates clinical status for WD (black: affected, white: healthy, ‘?': not known); the lower part indicates whether Tw was identified by PCR (in saliva, blood, feces or joint fluid) or by PAS staining on bowel biopsy specimens (gray: Tw-positive, white: Tw-negative, ‘?': not tested). Whipple’s disease patients are indicated as P1, P2, P3, and P4; the proband is indicated with an arrow. Genotype status and age (for IRF4-heterozygous individuals) are reported below the symbols. Individuals whose genetic status could not be evaluated are indicated by the symbol ‘E?”. (B) Schematic representation of the IRF4 protein, showing the DNA-binding domain (DBD), P-rich domain, activation domain, α-helical domain, Q-rich domain, IRF association domain (IAD), and auto-inhibitory domain. The R98W substitution is indicated in red. (C) Electropherogram of IRF4 genomic DNA sequences from a healthy unrelated control (C) and the patients (P1, P2, P3, P4). The R98W IRF4 mutation leads to the replacement of an arginine with a tryptophan residue in position 98 (exon 3, c.292 C > T). The corresponding amino acids are represented above each electropherogram. (D) Alignment of the R98W amino acid in the DBD domain of IRF4 in humans and 11 other animal species. R98 is indicated in red.
-
Figure 1—source data 1
Kindred information summary.
For each subject, Tw carriage status, IRF4 genotype, clinical status and date of birth (DOB) are reported. NA: not available; Pos: positive; Neg: negative; Tw: Tropheryma whipplei; WD: Whipple’s disease; E?: genotype not assessed.
- https://doi.org/10.7554/eLife.32340.004
-
Figure 1—source data 2
Non-synonymous variants within the linkage regions found in WES data from patients.
- https://doi.org/10.7554/eLife.32340.005
Figure 1—figure supplement 1
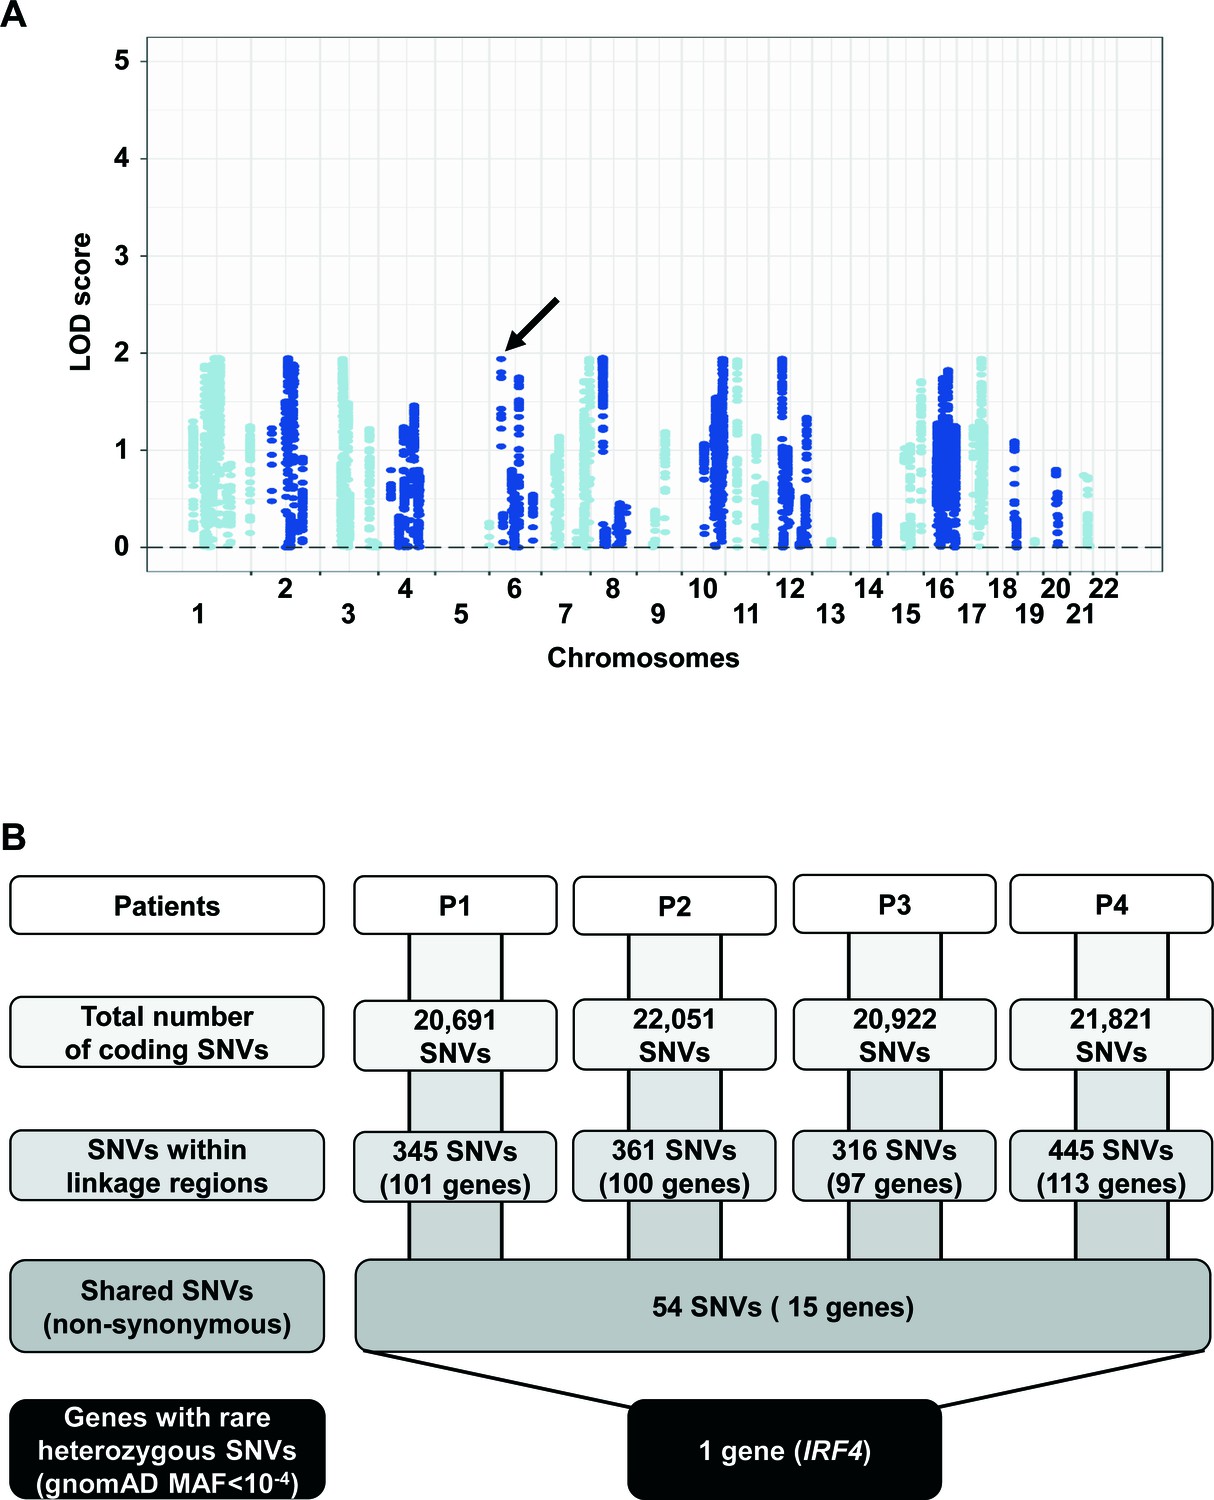
Genome-wide linkage and whole-exome sequencing analyses.
(A) Genome-wide linkage analysis was performed by combining genome-wide array and whole-exome sequencing (WES) data, assuming an autosomal dominant (AD) mode of inheritance. LOD (logarithm of odds) scores are shown for the four patients considered together. The maximum expected LOD score is 1.95, based on an AD model with incomplete penetrance. IRF4 is located within a linkage region (LOD = 1.94) on chromosome 6 (indicated by a black arrow). (B) A refined analysis of WES data identified IRF4 as the only protein-coding gene carrying a rare heterozygous mutation common to P1, P2, P3 and P4 within the linkage regions.
Figure 2 with 1 supplement

Analysis in silico of IRF4 variants.
Minor allele frequency (MAF) and combined annotation–dependent depletion (CADD) score of all coding variants previously reported in a public database (gnomAD) (http://gnomad.broadinstitute.org) and in our in-house (HGID) database. The dotted line corresponds to the mutation significance cutoff (MSC) with 95% confidence interval. The R98W variant is shown as a red square.
-
Figure 2—source data 1
156 non-synonymous heterozygous coding or splice variants reported in the gnomAD or HGID databases.
†: non-canonical transcript predicted to undergo nonsense mediated decay.
- https://doi.org/10.7554/eLife.32340.008
Figure 2—figure supplement 1

List of variants and strength of purifying selection on IRF4.
Genome-wide distribution of the strength of purifying selection, estimated by the f parameter (Eilertson et al., 2012), acting on 14,993 human genes. IRF4 is at the 9.4th percentile of the distribution, indicating that it is more constrained than most human genes.
Figure 3 with 5 supplements
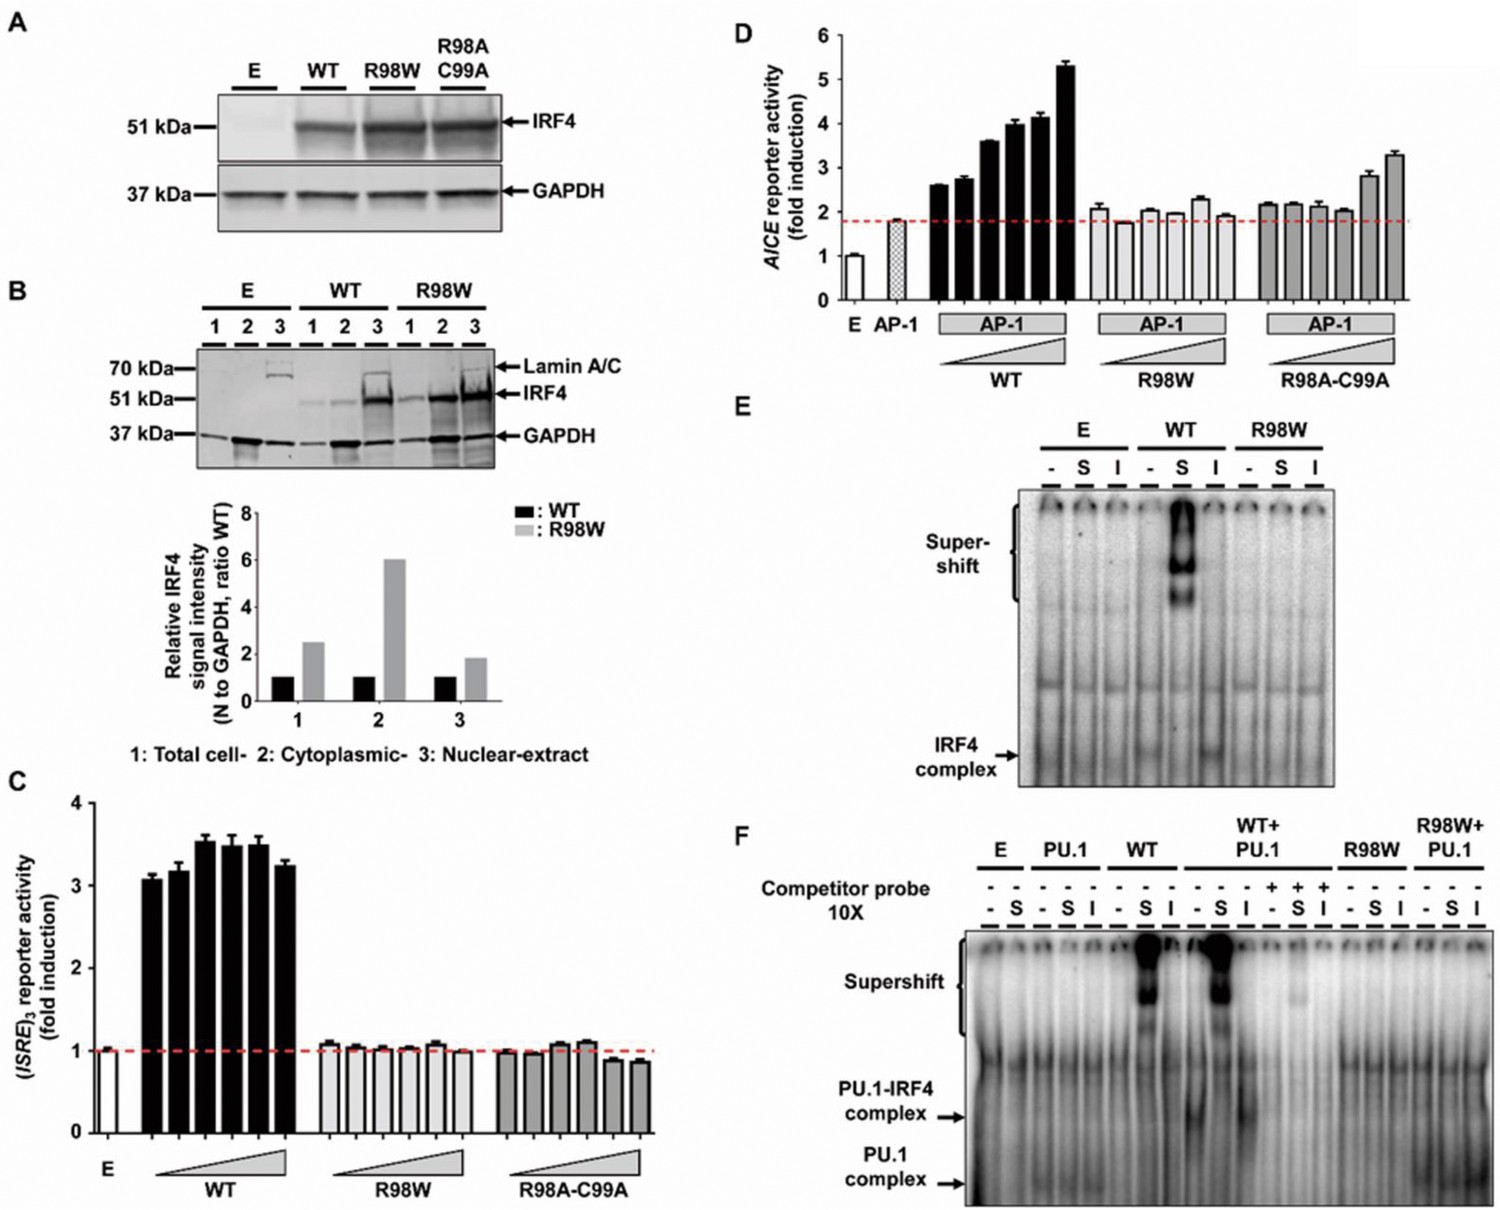
Molecular characterization of the R98W IRF4 mutation (loss of DNA binding).
(A) HEK293T cells were transfected with the pcDNA3.1 empty vector (E) or plasmids encoding IRF4 WT, IRF4 R98W or IRF4 R98A-C99A. Total cell extracts were subjected to western blotting; the upper panel shows IRF4 levels and the lower panel shows the levels of GAPDH, used as a loading control. The results shown are representative of three independent experiments. (B) (upper panel) HEK293T cells were transfected with the pcDNA3.1 empty vector (E) or plasmids encoding IRF4 WT or IRF4 R98W . Total cell (1), cytoplasmic (2) and nuclear (3) extracts were subjected to western blotting. Lamin A/C and GAPDH were used as loading controls. (lower panel) IRF4 signal intensity for R98W-transfected cells and WT-transfected cells, in various cell compartments (total, cytoplasmic and nuclear), normalized against the GAPDH signal, as shown by western blotting. The results shown are representative of three independent experiments. (C) Luciferase activity of HEK293T cells cotransfected with an (ISRE)3 reporter plasmid plus the pcDNA3.1 empty vector (E, 100 ng) and various amounts of plasmids encoding IRF4 WT or IRF4 R98W or IRF4 R98A/C99A (6.25, 12.5, 25, 50, 75 and 100 ng). Results are shown as the fold induction of activity relative to E-transfected cells. The red dotted line indicates mean activity for E-transfected cells. The mean and standard error of three experiments are shown. (D) Luciferase activity of HEK293T cells cotransfected with an AICE reporter plasmid plus the pcDNA3.1 empty vector (E, 100 ng) and/or constant amounts of plasmids encoding BATF WT and JUN WT (25 ng each, AP-1) and/or various amounts of plasmids encoding IRF4 WT or IRF4 R98W or IRF4 R98A/C99A (6.25, 12.5, 18.8, 25, 37.5 and 50 ng). Results are shown as the fold induction of activity relative to E-transfected cells. The red dotted line indicates mean activity for AP-1-transfected cells. The mean and standard error of two experiments are shown. (E) Electrophoretic mobility shift assay (EMSA) with nuclear extracts of HEK293T cells transfected with the pcDNA3.1 empty vector (E), or plasmids encoding IRF4 WT or IRF4 R98W. Extracts were incubated with a 32P-labeled ISRE probe. Extracts were incubated with a specific anti-IRF4 antibody (S) to detect DNA-protein complex supershift, with an isotype control antibody (I) to demonstrate the specificity of the complex, and with no antibody (-), as a control. The results shown are representative of three independent experiments. (F) EMSA of nuclear extracts of HEK293T cells transfected with the pcDNA3.1 empty vector (E), or plasmids encoding PU.1, IRF4 WT, or IRF4 R98W, or cotransfected with PU.1 and IRF4 WT or PU.1 and IRF4 R98W plasmids. Extracts were incubated with a 32P-labeled λB probe (EICE). Extracts were incubated with a specific anti-IRF4 antibody (S) to detect DNA-protein complex supershift, with an isotype control antibody (I) to demonstrate the IRF4 specificity of the complex and with no antibody (-), as a control. Experiments in the presence of excess non-radioactive probe (cold probe) demonstrated the probe specificity of the complexes. The results shown are representative of three independent experiments.
Figure 3—figure supplement 1
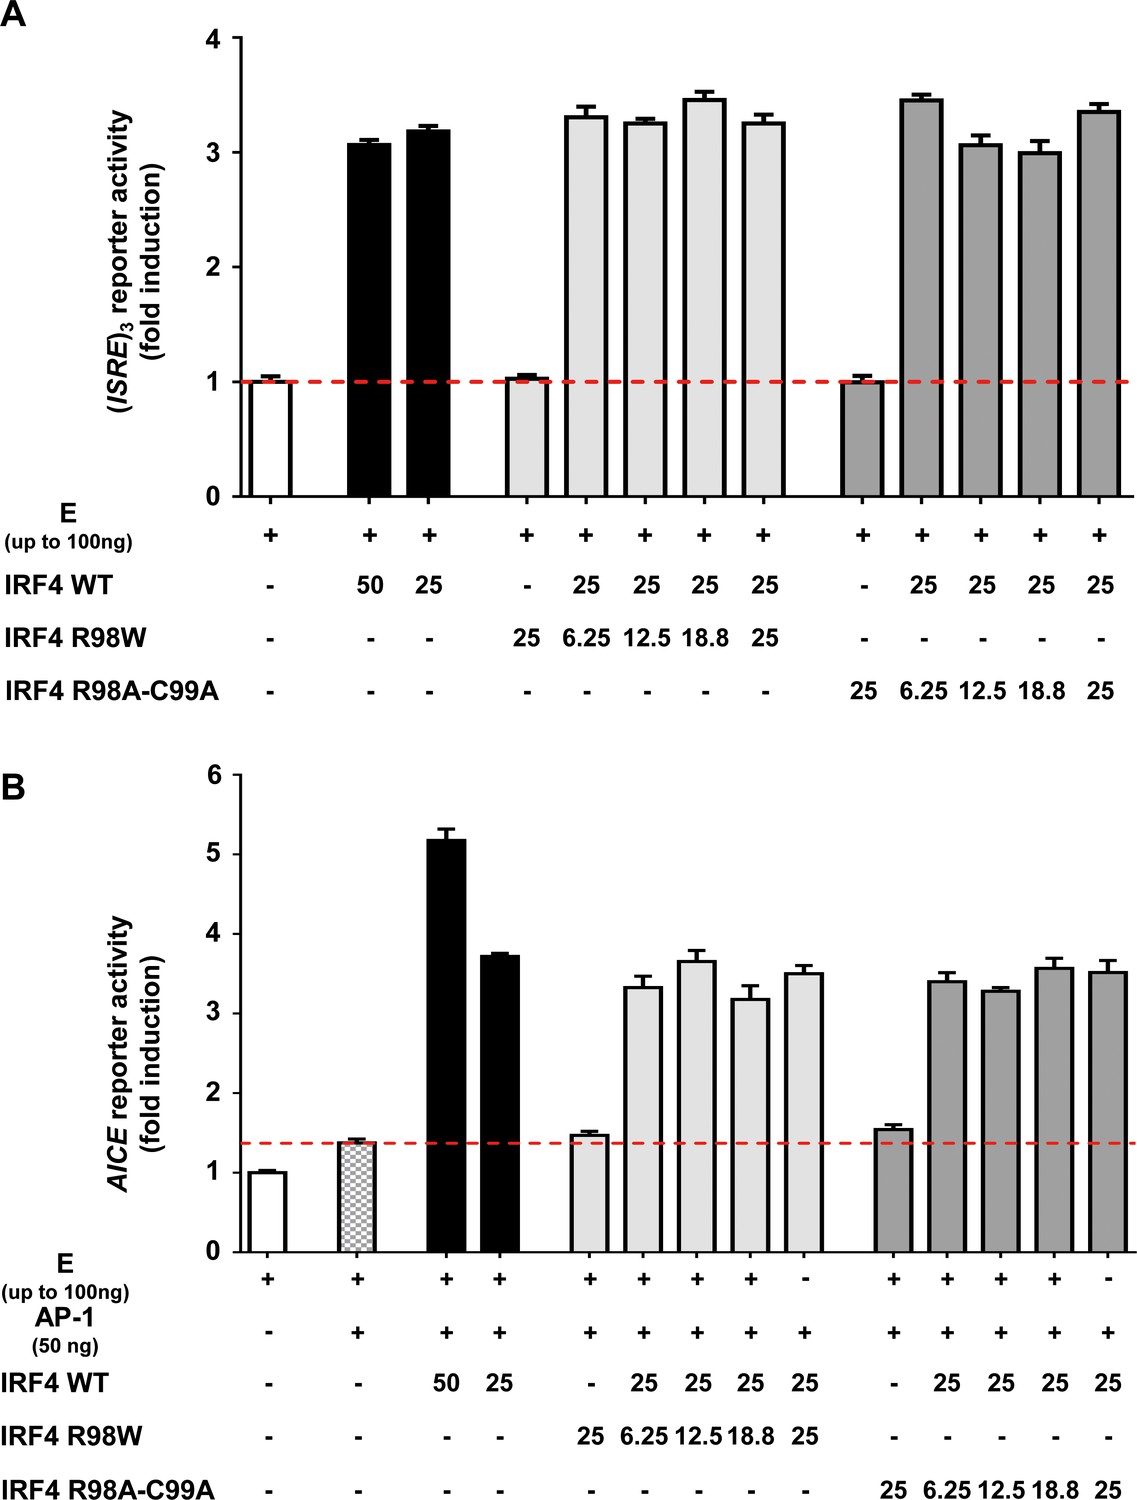
Functional activity of IRF4.
(A) Luciferase activity of HEK293T cells cotransfected with an (ISRE)3 reporter plasmid plus the pcDNA3.1 empty vector (E) and plasmids encoding IRF4 WT and/or IRF4 R98W or IRF4 R98A/C99A. The amount of plasmid used for transfection (ng) is indicated on the figure. Results are showed as fold induction of activity relative to E-transfected cells. The red dotted line represents the mean activity for E-transfected cells. The mean and standard error of three experiments are shown. (B) Luciferase activity of HEK293T cells cotransfected with an AICE reporter plasmid plus the pcDNA3.1 empty vector (E) and/or constant amounts of plasmids encoding BATF WT and JUN WT (25 ng each, AP-1) and/or plasmids encoding IRF4 WT and/or IRF4 R98W or IRF4 R98A/C99A. The amounts of plasmid used for tranfection (ng) are indicated on the figure. Results are shown as the fold induction of activity relative to E-transfected cells. The red dotted line indicates mean activity for AP-1-transfected cells. The mean and standard error of two experiments are shown.
Figure 3—figure supplement 2
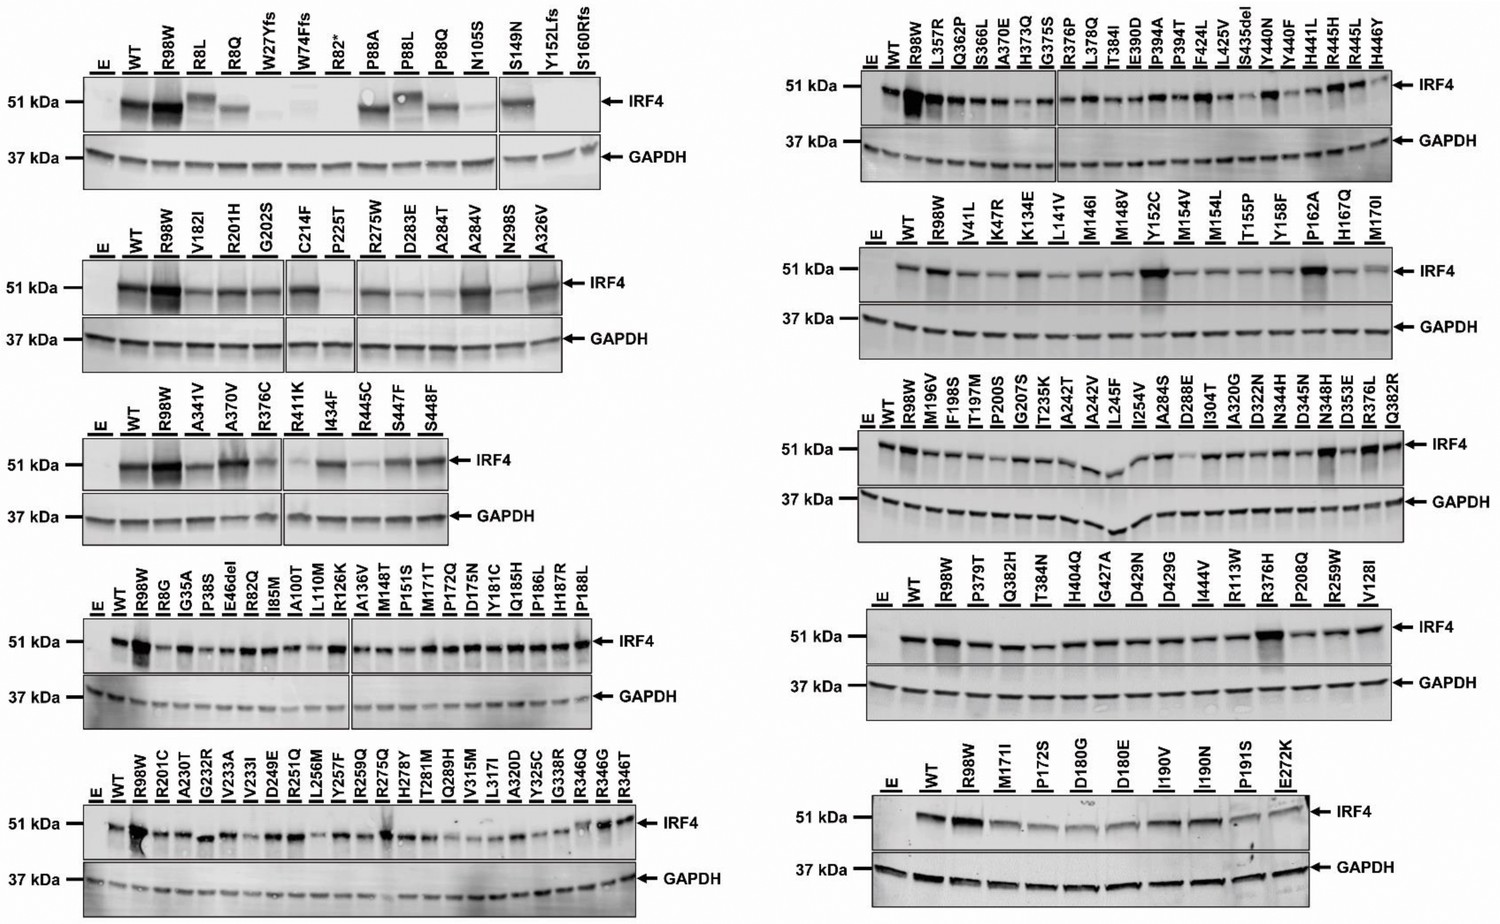
Protein levels of IRF4 variants previously reported in gnomAD database.
HEK293T cells were transfected with the pcDNA3.1 empty vector (E), or plasmids encoding IRF4 WT, IRF4 R98W or several IRF4 variants previously reported in the gnomAD database (see Figure 3). Total cell extracts were subjected to western blotting; the upper panel shows IRF4 levels and the lower panel shows the levels of GAPDH, used as a loading control. The results shown are representative of at least two independent experiments.
Figure 3—figure supplement 3
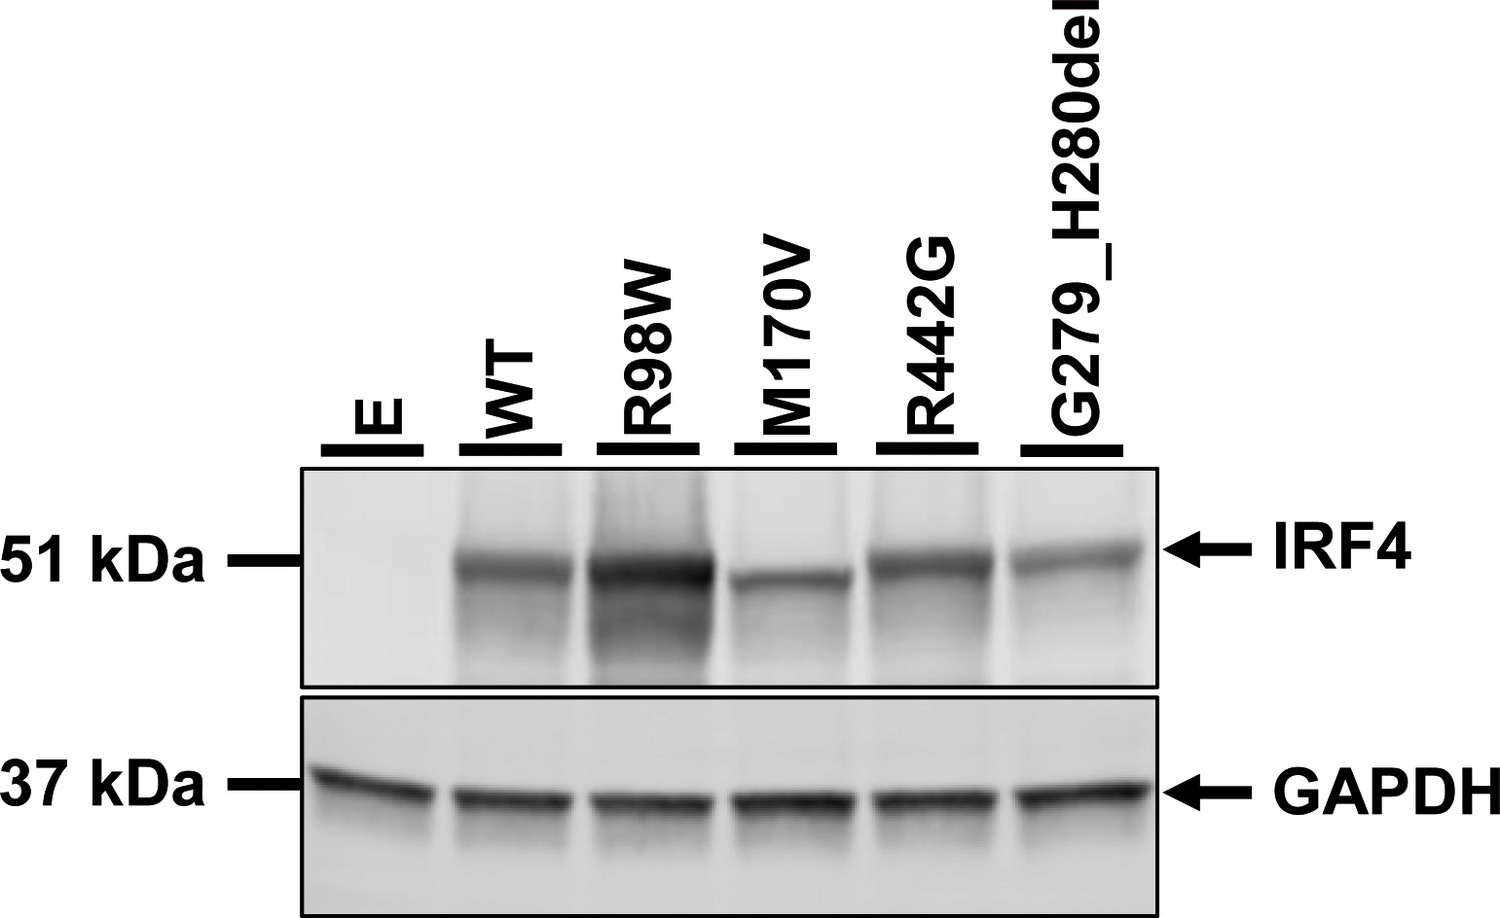
Protein levels of IRF4 variants from HGID database.
HEK293T cells were transfected with the pcDNA3.1 empty vector (E), or plasmids encoding IRF4 WT, IRF4 R98W or IRF4 variants from the HGID database (see Figure 3). Total cell extracts were subjected to western blotting; the upper panel shows IRF4 levels and the lower panel shows the levels of GAPDH, used as a loading control. The results shown are representative of at least two independent experiments.
Figure 3—figure supplement 4
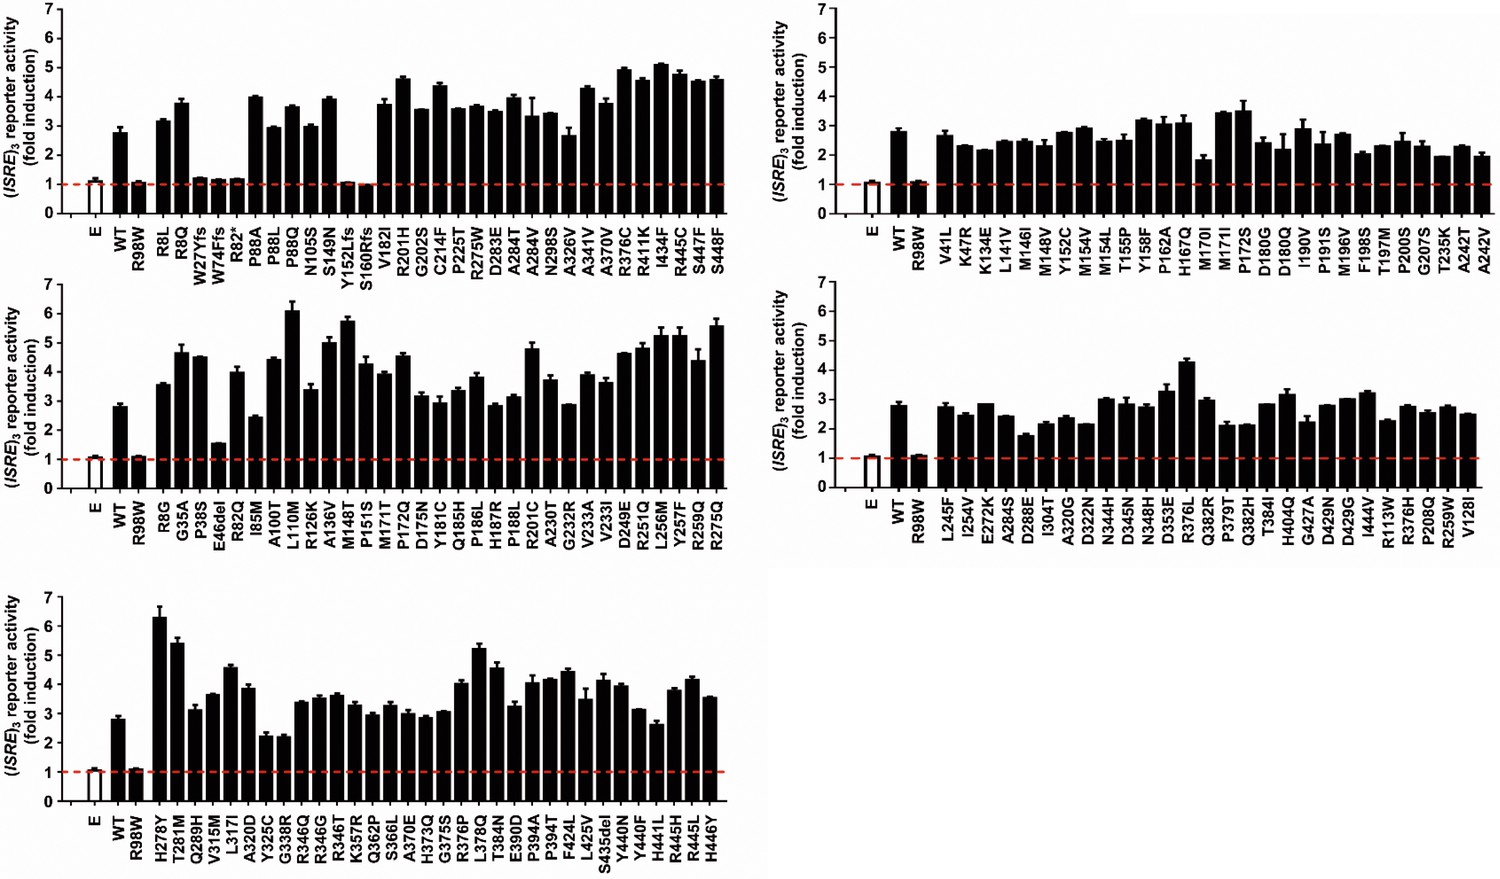
Functional impact of IRF4 variants previously reported in gnomAD database.
Luciferase activity of HEK293T cells cotransfected with an (ISRE)3 reporter plasmid plus the pcDNA3.1 empty vector (E) and plasmids encoding IRF4 WT, IRF4 R98W or several IRF4 variants previously reported in the gnomAD databases (see Figure 3). Results are shown as the fold induction of activity relative to E-transfected cells. The red dotted line represents the mean fold induction in E-transfected cells. The results shown are the mean ± SD of at least two independent experiments.
Figure 3—figure supplement 5

Functional impact of IRF4 variants from HGID database.
Luciferase activity of HEK293T cells cotransfected with an (ISRE)3 reporter plasmid plus the pcDNA3.1 empty vector (E) and plasmids encoding IRF4 WT, IRF4 R98W or IRF4 variants from the HGID database (see Figure 3). Results are shown as the fold induction of activity relative to E-transfected cells. The red dotted line represents the mean fold induction in E-transfected cells. The results shown are the mean ± SD of at least two independent experiments.
Figure 4 with 1 supplement

IRF4 mRNA levels in EBV-B cells.
(A) Total RNA extracted from healthy unrelated controls (n = 7; IRF4 WT/WT), patients diagnosed with Whipple’s disease (n = 25; WT/WT for all coding exons of IRF4) not related to this kindred, healthy homozygous WT relatives (n = 4, IRF4 WT/WT), patients with monoallelic IRF4 mutations (n = 2; IRF4 WT/R98W) and asymptomatic heterozygous relatives with monoallelic IRF4 mutations (n = 2; IRF4 WT/R98W) was subjected to RT-qPCR for total IRF4. Data are displayed as 2-ΔΔCt after normalization according to endogenous GUSB control gene expression (ΔCt) and the mean of controls (ΔΔCt). The results shown are the mean ± SD of three independent experiments. (B) Calculated frequency (%) of each mRNA (WT and R98W allele) obtained by the TA-cloning of cDNA generated from EBV-B cells from healthy unrelated controls (n = 2), healthy homozygous WT relatives (n = 1), patients with monoallelic IRF4 mutations (n = 2) and asymptomatic heterozygous relatives with monoallelic IRF4 mutations (n = 1).
Figure 4—figure supplement 1
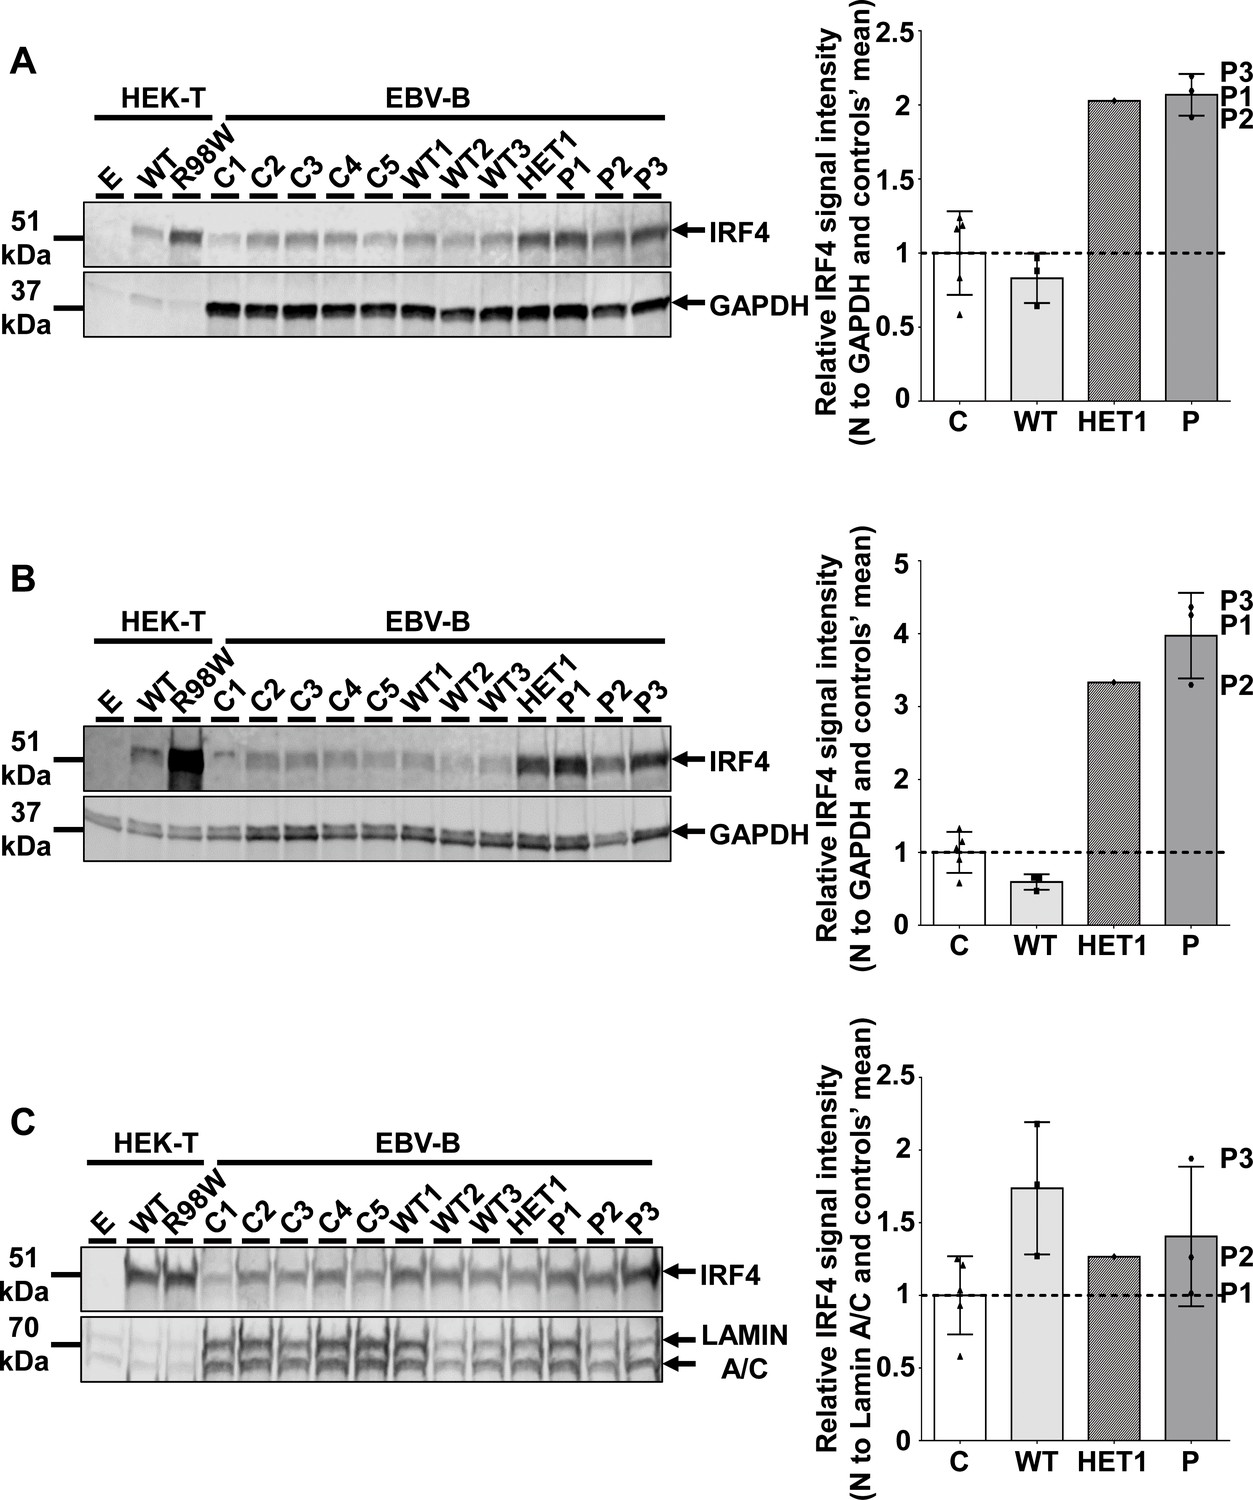
IRF4 protein levels in EBV-B cells.
(A–C) (Left) Total cell (A), cytoplasmic (B) and nuclear (C) extracts from five healthy unrelated controls (C1 to C5), three homozygous WT relatives (WT1, WT2, WT3), three patients (P1 to P3) and one asymptomatic heterozygous relative from the kindred (HET1). Protein extracts from HEK293T cells transfected with the pcDNA3.1 empty vector (E), or plasmids encoding IRF4 WT or IRF4 R98W were used as controls for the specific band corresponding to IRF4. (Right) Representation of IRF4 signal intensity for each individual relative to the mean signal for healthy unrelated controls (n = 5) obtained on western blotting (Figure 4A–C left) and represented by black dotted lines, with normalization against the GAPDH signal (total, cytoplasmic extracts) or the lamin A/C signal (nuclear extracts). The results shown are representative of two independent experiments.
Figure 5 with 7 supplements
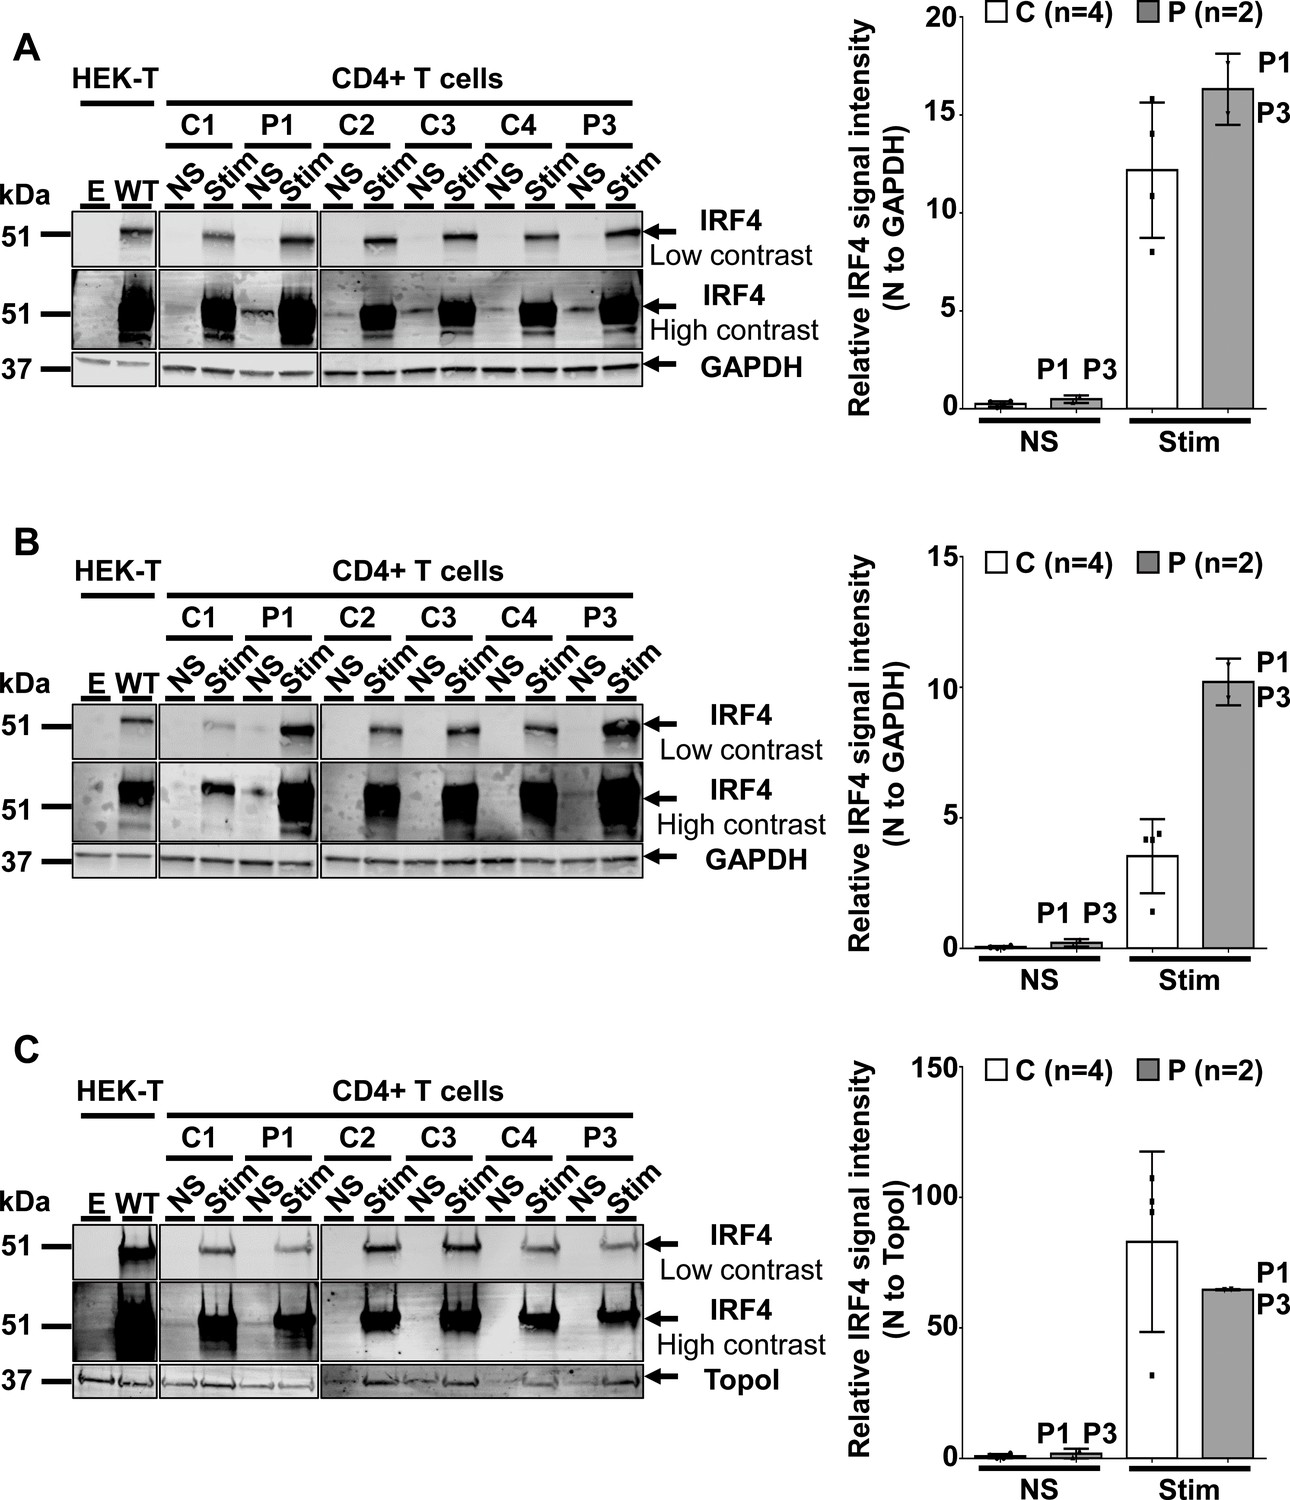
IRF4 protein levels in CD4+ T cells.
(A–C) (Left) Total-cell (A), cytoplasmic (B) and nuclear (C) extracts from CD4+ T cells from four healthy unrelated controls (C1 to C4) and two patients (P1 and P3) stimulated with activating anti-CD2/CD3/CD28 monoclonal antibody-coated beads (Stim) or left unstimulated (NS). Protein extracts from HEK293T cells transfected with the pcDNA3.1 empty vector (E) or plasmids encoding IRF4 WT plasmids were used as controls for the specific band corresponding to IRF4. (Right) Representation of IRF4 signal intensity for each individual, obtained by western blotting, with normalization against the GAPDH signal (total, cytoplasmic extracts) or the topoisomerase I signal (nuclear extracts).
-
Figure 5—source data 1
Immunophenotyping of patients (P1, P2 and P3) and a WT homozygous relative.
All subjects had normal numbers and percentages of T, B, and NK cells for age.
- https://doi.org/10.7554/eLife.32340.029
Figure 5—figure supplement 1
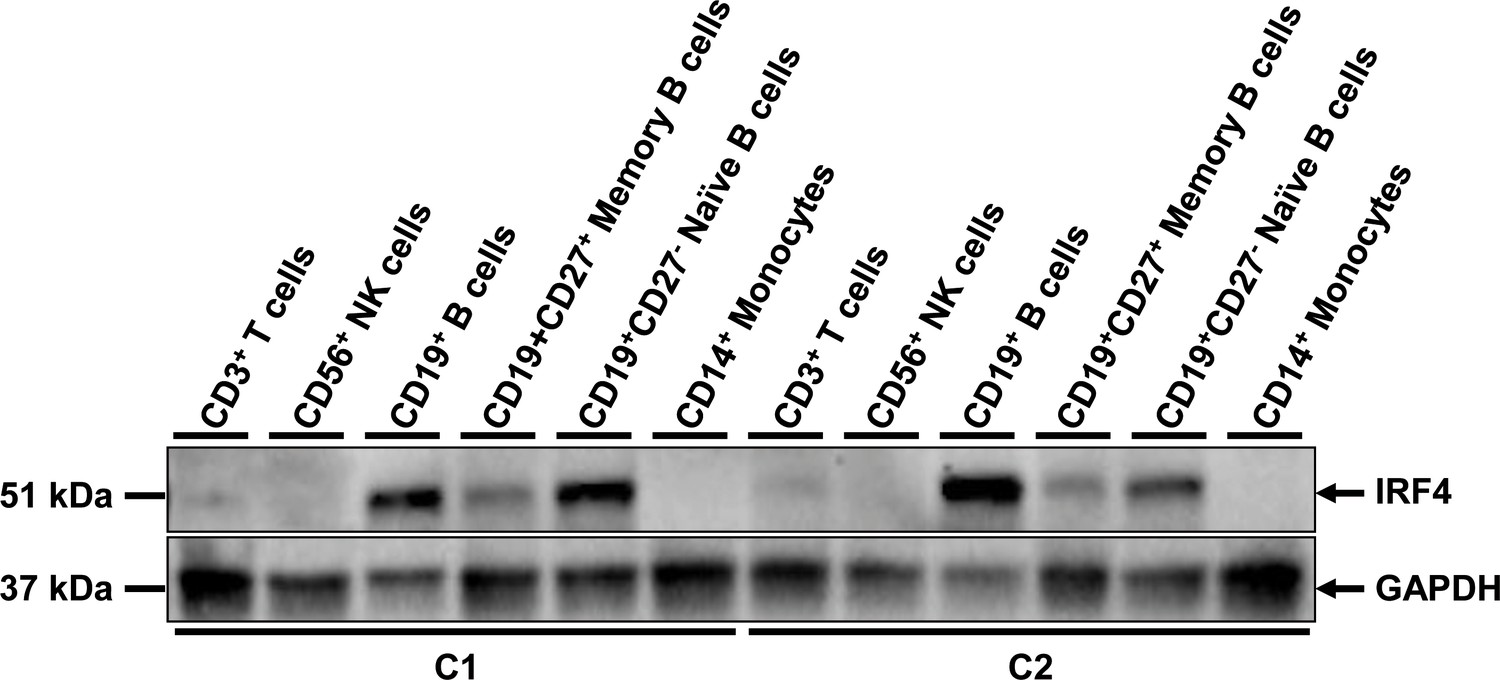
IRF4 protein levels in PBMC subpopulations.
Total cell extracts from PBMC subpopulations (CD3+ T cells, CD56+ NK cells, CD19+ B cells, CD19+ CD27+ memory B cells, CD19+ CD27- naive B cells, CD14+ monocytes) from two healthy unrelated controls were subjected to western blotting. The upper panel shows IRF4 levels and the lower panel shows the levels of GAPDH, used as a loading control. The results shown are representative of two independent experiments. We showed that IRF4 was produced in large amounts in total B lymphocytes (CD19+), but also in naive and memory B lymphocytes (CD19+ CD27- and CD19+ CD27+, respectively). IRF4 was less strongly expressed in CD3+ T lymphocytes and was not detectable in CD14+ monocytes or CD56+ natural killer (NK) cells.
Figure 5—figure supplement 2
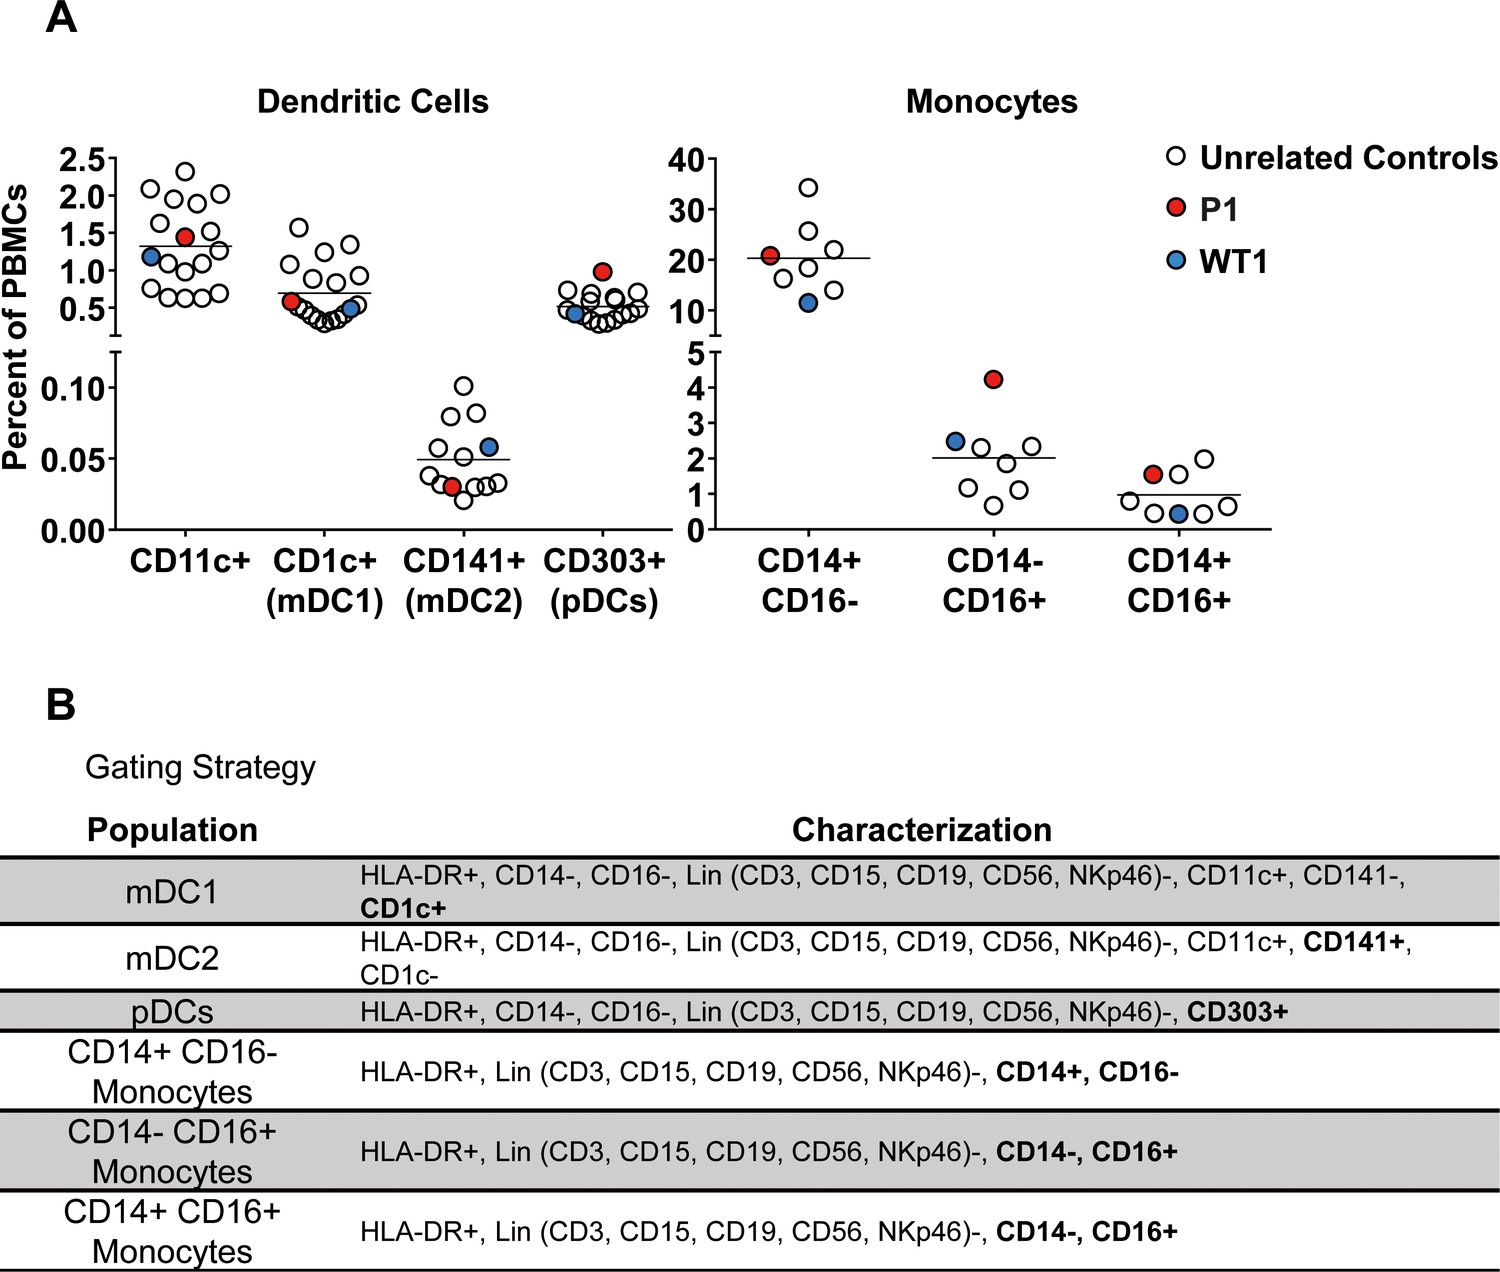
Percentage of dendritic cells and monocyte subtypes within total PBMCs.
(A) Percentage of CD11c+, myeloid dendritic cells (mDC1 and mDC2) and plasmacytoid dendritic cells (pDCs) (left), and monocyte subtypes (right) among total PBMCs from healthy unrelated controls, a patient (P1) and a homozygous WT relative (WT1). We showed that the frequencies of these subsets in P1 were similar to those in healthy controls. (B) Gating strategy to define the dendritic cell and monocyte subtypes.
Figure 5—figure supplement 3
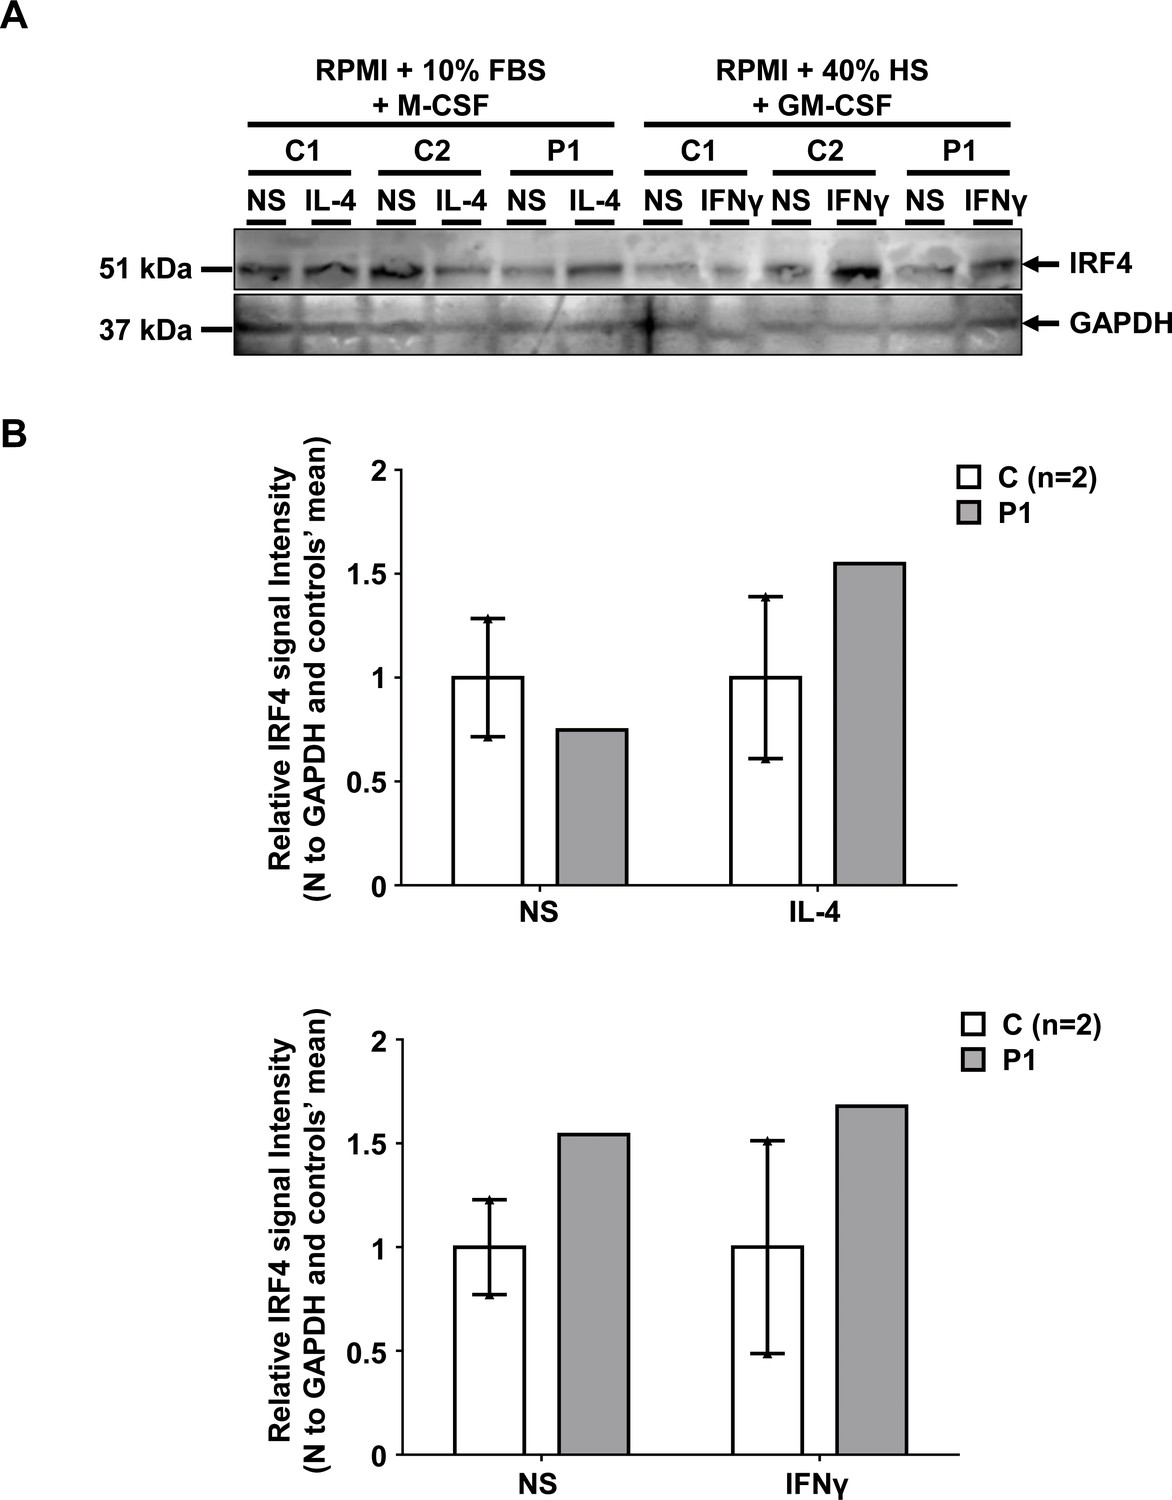
IRF4 levels in controls and patient monocyte-derived macrophages.
(A) IRF4 protein levels, as determined by western blotting on total cell extracts from M2-like (left panel) or M1-like (right panel) monocyte-derived macrophages (MDMs) from two healthy unrelated controls (C1 and C2) and P1, either left non-stimulated (NS) or stimulated with IL-4 (for M2-like MDMs) or IFN-γ (for M1-like MDMs). We showed that IRF4 was present in similar amounts in MDMs from P1 and healthy unrelated controls, regardless of the differentiation or activation conditions used. (B) IRF4 signal intensity for each individual relative to the mean signal for controls on western blots.
Figure 5—figure supplement 4
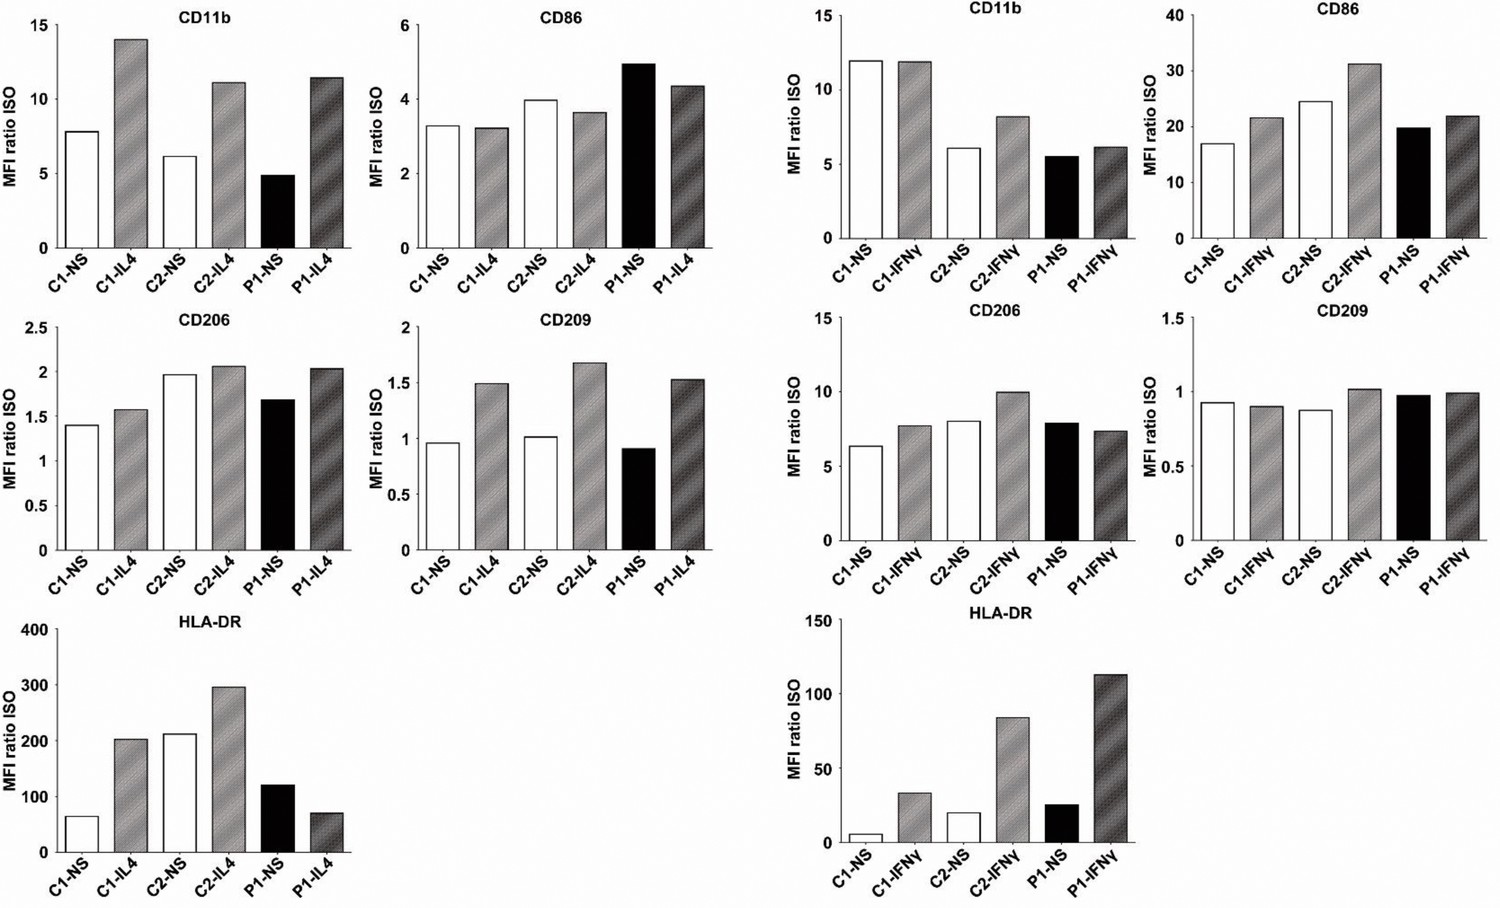
Surface marker levels in controls and patient monocyte-derived macrophages.
CD11b, CD86, CD206, CD209 and HLA-DR mean fluorescence intensity (MFI) for M2-MDM (left) and M1-MDM (right) from P1 and two healthy unrelated controls (C1 and C2), either left non-stimulated (NS) or stimulated with IL-4 (for M2-like MDMs) or IFN-g (for M1-like MDMs). We showed that CD11b, CD86, CD206, CD209, and HLA-DR expression levels were similar in MDMs from P1 and healthy unrelated controls.
Figure 5—figure supplement 5

Percentage of memory B cells in PBMCs from controls and patients.
PBMCs from healthy unrelated controls and patients (P1, P2 and P3) were stained with antibodies against CD20, CD10 and CD27, IgM, IgD, IgG, or IgA. Percentages of memory B cells (CD20+ CD10- CD27+) were determined, and the proportion of memory B cells that had undergone class switching to express IgM/IgD, IgG or IgA was then calculated. No significant differences were observed between healthy unrelated controls and patients.
Figure 5—figure supplement 6
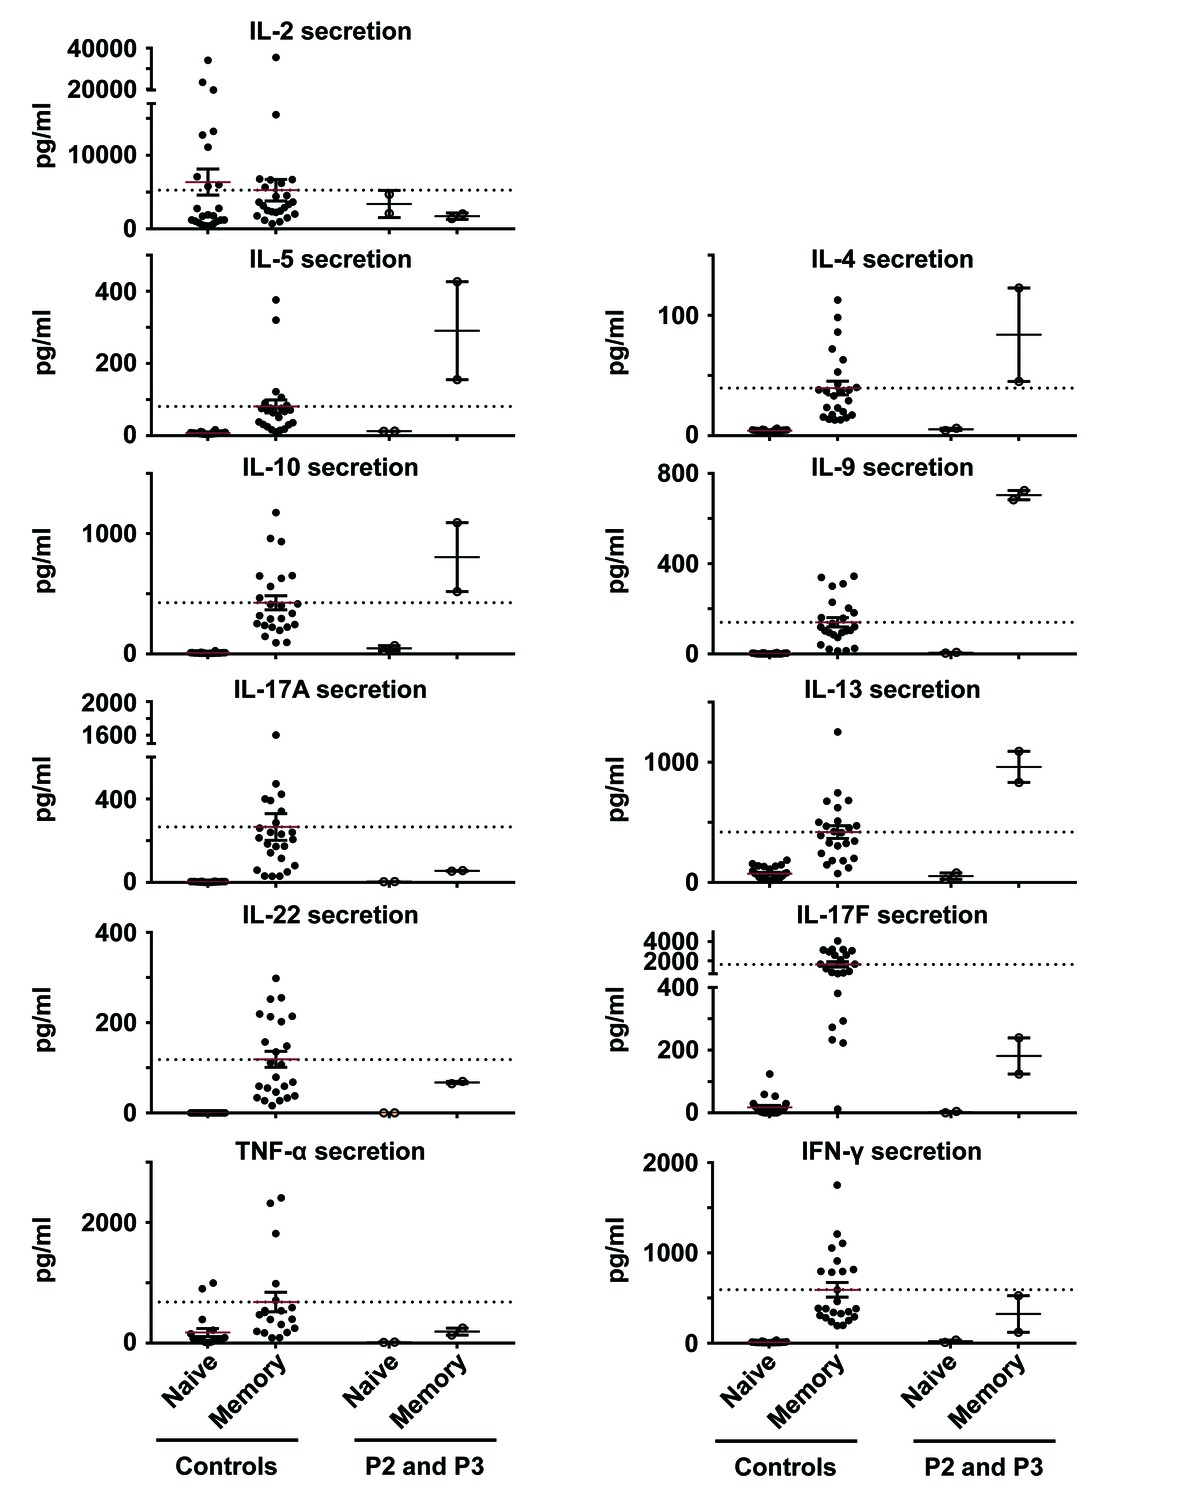
In vitro differentiation of CD4+ T cells from patients and controls.
Naive and memory CD4+ T cells from healthy unrelated controls and patients (P2 and P3) were purified by sorting and cultured with TAE beads. The secretion of IL-2, IL-4, IL-5, IL-9, IL-10, IL-13, IL-17A, IL-17F, IL-22, IFN-γ and TNF-α was measured five days later. No significant differences were observed between healthy unrelated controls and patients.
Figure 5—figure supplement 7

Ex vivo cytokine production by CD4+ memory T cells from patients and controls.
Naive CD4+ T cells from healthy unrelated controls and patients (P2 and P3) were stimulated with TAE beads alone or under Th1, Th2, Th17 or Tfh polarizing conditions. The production of IL-10, IL-21, IL-17A, IL-17F and IFN-γ was measured 5 days later, in the corresponding polarizing conditions. No significant differences were observed between healthy unrelated controls and patients.
Figure 6
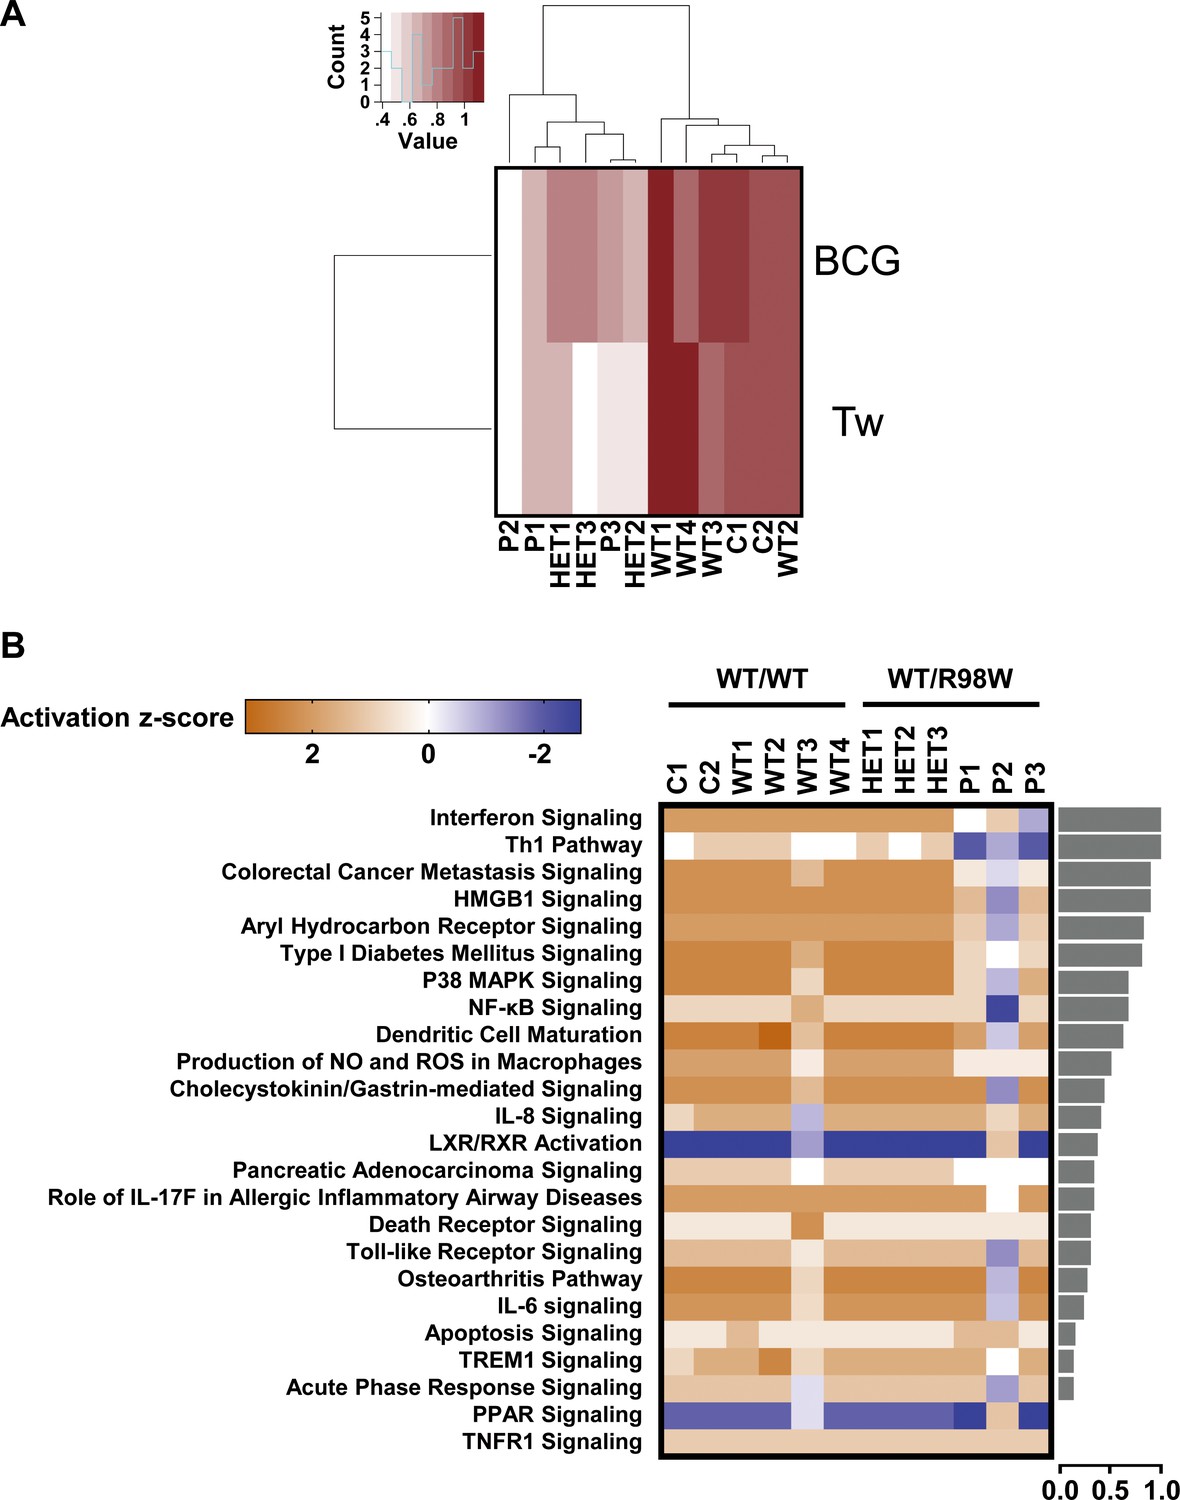
Overall transcriptional responsiveness of PBMCs following in vitro exposure to Tw and BCG and pathway activity analysis for genes responsive to BCG exposure.
(A) The overall responsiveness of individual subjects following stimulation with BCG and Tw, relative to non-stimulated conditions (along the horizontal axis) is shown as a heatmap. For each individual and each stimulus, overall responsiveness was assessed on the basis of normalized counts of differentially expressed transcripts, as described in the corresponding Materials and methods section. Subjects were grouped by unsupervised hierarchical clustering. (B) Enriched canonical pathways were ranked according to differences in mean activation z-score between genotypes (WT/WT individuals vs. WT/R98W individuals). The activation z-scores for each individual and pathway are shown as heat maps. Pathways predicted to be activated are depicted in orange, pathways predicted to be inhibited are depicted in blue. A lack of prediction concerning activation is depicted in white. Individuals are presented in columns, pathways in rows. The pathways are ranked from most different between genotypes (at the top of the list) to the least different (at the bottom). The differences in mean activation z-scores between WT/WT and WT/R98W individuals for each pathway are depicted as bars to the right of the heat maps (the direction of difference is not shown). The Ingenuity Pathway Analysis (IPA) tool was used to generate a list of the most significant canonical pathways and their respective activation z-scores.
-
Figure 6—source data 1
Differentially expressed (DE) genes found to be responsive to BCG in homozygous WT subjects using the criteria described in the Materials and methods section.
Genes are grouped by up- or down- regulation and ranked in alphabetical order.
- https://doi.org/10.7554/eLife.32340.027
-
Figure 6—source data 2
Differentially expressed (DE) genes found to be responsive to Tw in homozygous WT subjects using the criteria described in the Materials and methods section.
Genes are grouped by up- or down- regulation and ranked in alphabetical order.
- https://doi.org/10.7554/eLife.32340.028
Author response image 1
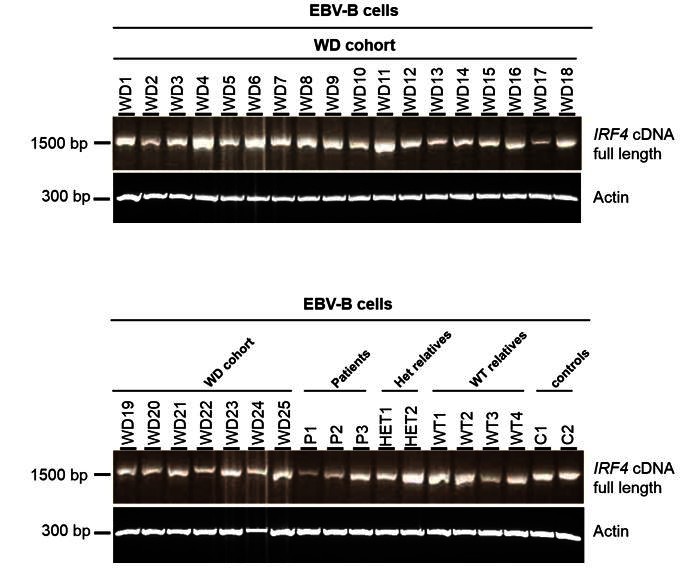
Electrophoresis of the full-length IRF4 cDNA from EBV-B cell lines.
EBV-B cell lines from 25 patients diagnosed with Whipple’s disease (WD1 to WD25, WT/WT at all coding exons of IRF4) and from three patients (P1, P2 and P3), two asymptomatic heterozygous relatives (HET1 and HET2), four homozygous WT relatives (WT1 to WT4) and two healthy controls (C1 and C2).
Author response image 2
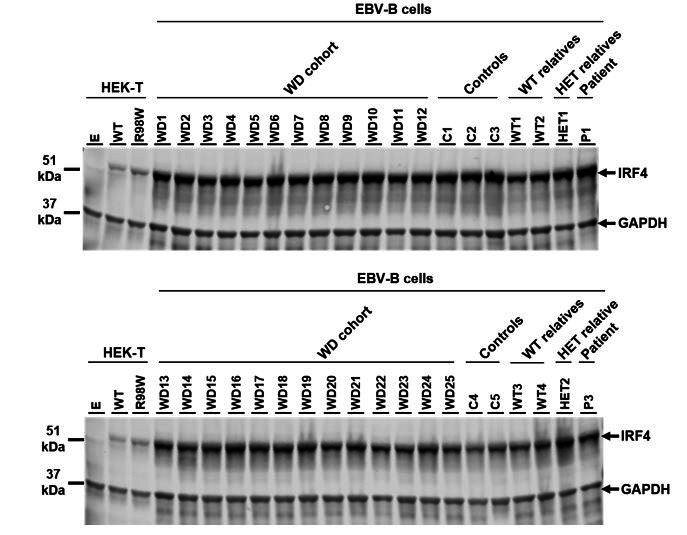
IRF4 protein levels in EBV-B cell lines.
Total lysates of EBV-B cells from five healthy controls (C1 to C5), four homozygous WT relatives (WT1 to WT4), two asymptomatic heterozygous relatives (HET1 and HET2), two patients (P1 and P3) and 25 other patients diagnosed with Whipple’s disease (WD1 to WD25, WT/WT at all coding exons of IRF4 ). Protein extracts from HEK293T cells transfected with empty vector (E), WT or R98W plasmids were used as controls for the specific band corresponding to IRF4.
Author response image 3
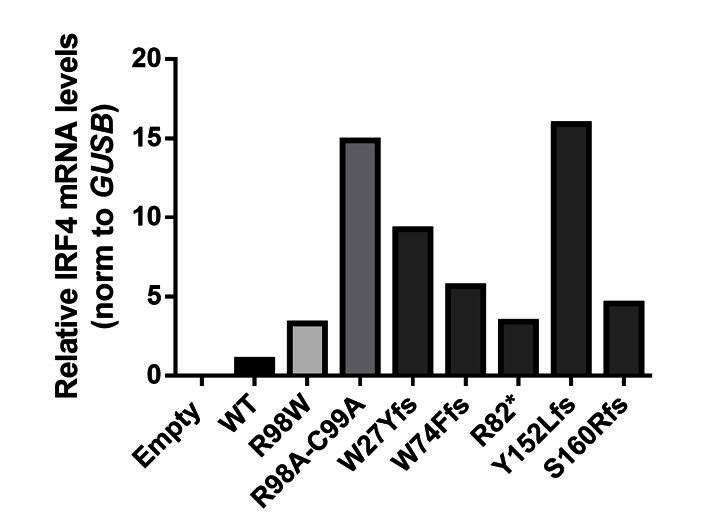
IRF4 mRNA levels in transfected HEK293T cells.
Total RNA extracted from HEK293T cells transfected with E, WT, R98W, R98A-C99A or the five predicted LOF variant plasmids, was subjected to RT-qPCR for total IRF4 . Data are displayed as 2ΔΔCt after normalization against endogenous GUS control gene expression (ΔCt) and the WT value (ΔΔCt).
Author response image 4
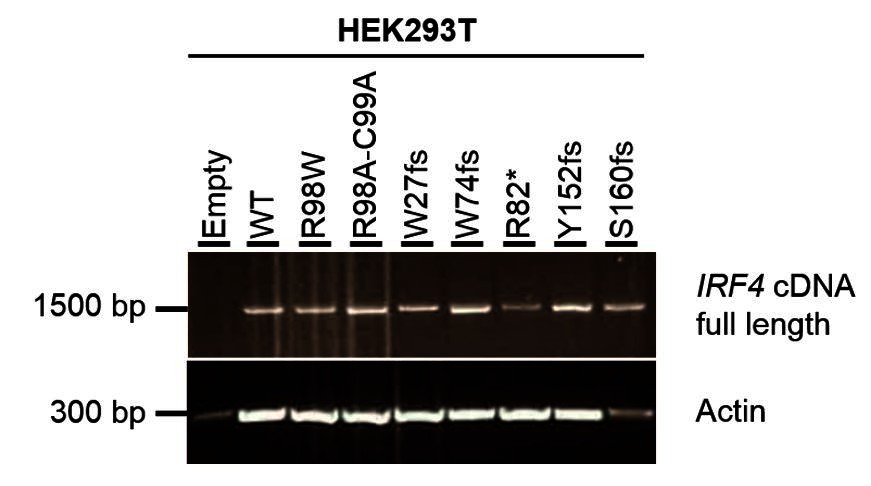
Electrophoresis of full-length IRF4 cDNA from transfected HEK293T cells.
Total cDNA extracted from HEK293T cells transfected with E, WT, R98W, R98A-C99A or the five predicted LOF variant plasmids. A partial actin B cDNA was used as a loading control.
Tables
Key resources table
| Reagent type (species) or resource | Designation | Source or reference | Identifiers | Additional information |
| Gene (Human) | IRF4 (NM_002460.3) | This paper | Vector backbone: pcDNA 3.1D/V5-His-TOPO vector (Thermo Fisher Scientific) | |
| Gene (Human) | PU.1 (NM_001080547.1) | This paper | Vector backbone: pcDNA 3.1D/V5-His-TOPO vector (Thermo Fisher Scientific) | |
| Gene (Human) | BATF (NM_006399.3) | OriGene | RC207104 | |
| Gene (Human) | JUN (NM_002228.3) | OriGene | RC209804 | |
| Strain (Tropheryma whipplei), strain background (DIG APD 25) | Tw | This paper | NCBI taxon: 2039 | Obtained from ‘Research Unit of Infectious and Tropical Emerging Diseases, University Aix-Marseille, URMITE, UM63, CNRS 7278, IRD 198, 13005 Marseille, France, EU’. Strain isolated from mesenteric lymph node (29/01/09). |
| Strain (Mycobacterium bovis-Bacillus Calmette-Guerin) , strain background (pasteur) | BCG | doi: 10.1084/jem.20021769 | NCBI taxon: 33892 | |
| Cell line (Human) | HEK293T | ATCC | CRL-3216 | |
| Cell line (Human) | EBV-B cells | This paper | For each individual, purified B cells were immortalized with EBV in the laboratory | |
| Transfected construct (PGL4.10[luc2]) | (ISRE)3 reporter plasmid, | This paper, backbone: Promega | #E6651 | Obtained from ‘Department of Biotechnology and Food Engineering, Technion-Israel Institute of Technology’ |
| Transfected construct (PGL4.10[luc2]) | AICE reporter plasmid | This paper, backbone: Promega | #E6651 | Generated by metabion international ag |
| Transfected construct (pRL-SV40 vector) | pRL-SV40 vector | Promega | #E2231 | |
| Biological sample (Human) | Patients' blood samples | This paper | ||
| Biological sample (Human) | Controls' blood samples | This paper | ||
| Antibody | anti-IRF4 | Santa Cruz | M-17 | Dilution: 1/1000 |
| Antibody | anti-GAPDH | Santa Cruz | FL-335 | Dilution: 1/1000 |
| Antibody | anti-topoisomerase I | Santa Cruz | C-21 | Dilution: 1/1000 |
| Antibody | anti-lamin A/C | Santa Cruz | H-110 | Dilution: 1/1000 |
| Antibody | anti-CD11b | Miltenyi Biotec | # 130-110-611 | Fluorochrome: PE |
| Antibody | anti-CD86 | Miltenyi Biotec | #130-094-877 | Fluorochrome: PE |
| Antibody | anti-CD206 | Miltenyi Biotec | #130-099-732 | Fluorochrome: PE |
| Antibody | anti-CD209 | Miltenyi Biotec | #130-109-589 | Fluorochrome: PE |
| Antibody | anti-HLADR | Miltenyi Biotec | #130-111-789 | Fluorochrome: PE |
| Antibody | anti-CD20 | BD biosciences | Fluorochrome: PE; clone H1 | |
| Antibody | anti-CD10 | BD biosciences | Fluorochrome: APC, clone HI10a | |
| Antibody | anti-CD27 | BD biosciences | Fluorochrome: PerCP-Cy5.5; clone L128 | |
| Antibody | anti-IgM | Miltenyi | Clone PJ2-22H3 | |
| Antibody | anti-IgG | BD biosciences | Fluorochrome: BV605; clone G18-145 | |
| Antibody | anti-IgA | Miltenyi | Clone IS11-8E10 | |
| Antibody | anti-CD4 | eBioscience | Fluorochrome: Pacific blue; clone OKT4 | |
| Antibody | anti-CD45RA | BD biosciences | Fluorochrome: PerCP-Cy5.5, clone HI100 | |
| Antibody | anti-CCR7 | Sony | Fluorochrome: FITC; clone G043H7 | |
| Recombinant DNA reagent | pcDNA 3.1D/V5-His-TOPO vector | Thermo Fisher Scientific | #K4900-01 | |
| Sequence-based reagent | IRF4-specific primer | Thermo Fisher Scientific | #Hs01056533_m1 | |
| Sequence-based reagent | GUSB | Thermo Fisher Scientific | #4326320E | |
| Peptide, recombinant protein | rhGM-CSF | R and D System | #CAA26822 | |
| Peptide, recombinant protein | rhM-CSF | R and D System | #NP_757350 | |
| Peptide, recombinant protein | IFN-γ | Boehringer Ingelheim | Imukin | |
| Peptide, recombinant protein | rhIL4 | R and D System | #P05112 | |
| Commercial assay or kit | Lipofectamine LTX kit | Thermo Fisher Scientific | #15338100 | |
| Commercial assay or kit | Dual-Luciferase 1000 assay system kit | Promega | #E1980 | |
| Commercial assay or kit | ZR RNA Microprep kit | Zymo research | #R1061 | |
| Commercial assay or kit | High-Capacity RNA-to-cDNA kit | Thermo Fisher Scientific | #R4387406 | |
| Commercial assay or kit | TOPO TA cloning kit | Thermo Fisher Scientific | #K450001 | |
| Commercial assay or kit | directional TOPO expression kit | Thermo Fisher Scientific | #K4900-01 | |
| Commercial assay or kit | QuikChangeII XL Site-Directed Mutagenesis Kit | Agilent Technologies | #200522 | |
| Commercial assay or kit | LIVE/DEAD Fixable Aqua Dead Cell Stain Kit | Thermo Fisher Scientific | #L34957 | |
| Chemical compound, drug | Tris | MP biomedicals | #11TRIS01KG | |
| Chemical compound, drug | HCl | Sigma | #H1758 | |
| Chemical compound, drug | NaCl | Sigma | #S3014 | |
| Chemical compound, drug | Triton X-100 | Sigma | #T8532 | |
| Chemical compound, drug | EDTA | MP biomedicals | #11EDTA05M1 | |
| Chemical compound, drug | protease inhibitors Complete | Roche | #04693116001 | |
| Chemical compound, drug | Phosphatase inhibitor cocktail | Roche | #04906837001 | |
| Chemical compound, drug | DTT | Thermo Fisher Scientific | #20290 | |
| Chemical compound, drug | pepstatin A | Sigma | #P4265 | |
| Chemical compound, drug | leupeptin | Sigma | #L2884 | |
| Chemical compound, drug | antipain | Sigma | #A6191 | |
| Chemical compound, drug | Hepes | Sigma | #H3375 | |
| Chemical compound, drug | KCl | Sigma | #P9333 | |
| Chemical compound, drug | EGTA | Amresco | #0732 | |
| Chemical compound, drug | NP40 | Sigma | #N6507 | |
| Chemical compound, drug | NaF | Sigma | #S7920 | |
| Chemical compound, drug | PMSF | Sigma | #P7626 | |
| Chemical compound, drug | MgCl2 | Sigma | #M8266 | |
| Chemical compound, drug | Klenow fragment | NEB | #M0210S | |
| Chemical compound, drug | d-ATP-32P | PerkinElmer | #BLU012H250UC | |
| Chemical compound, drug | TBE migration buffer | Euromedex | #ET020-B | |
| Chemical compound, drug | acrylamide/bis-acrylamide 37.5:1 | Sigma | #A7168 | |
| Software, algorithm | affy R package | Gautier et al., 2004; Irizarry et al., 2003 | ||
| Software, algorithm | IPA software | Alsina et al., 2014 | ||
| Software, algorithm | Microsoft Excel | Microsoft | ||
| Software, algorithm | GraphPad Prism V7.0 | GraphPad | ||
| Software, algorithm | Image studio | Licor |
Additional files
-
Transparent reporting form
- https://doi.org/10.7554/eLife.32340.030
Download links
A two-part list of links to download the article, or parts of the article, in various formats.
Downloads (link to download the article as PDF)
Open citations (links to open the citations from this article in various online reference manager services)
Cite this article (links to download the citations from this article in formats compatible with various reference manager tools)
IRF4 haploinsufficiency in a family with Whipple’s disease
eLife 7:e32340.
https://doi.org/10.7554/eLife.32340


