Age-related islet inflammation marks the proliferative decline of pancreatic beta-cells in zebrafish
- Technische Universität Dresden, Germany
- German Center for Diabetes Research (DZD e.V.), Germany
- Technische Universität Dresden, German Center for Diabetes Reseach (DZD e.V.), Germany
- King’s College London, United Kingdom
- Imperial College London, United Kingdom
- University of Birmingham, United Kingdom
- Institute of Metabolism and Systems Research, University of Birmingham, United Kingdom
Abstract
The pancreatic islet, a cellular community harboring the insulin-producing beta-cells, is known to undergo age-related alterations. However, only a handful of signals associated with aging have been identified. By comparing beta-cells from younger and older zebrafish, here we show that the aging islets exhibit signs of chronic inflammation. These include recruitment of tnfα-expressing macrophages and the activation of NF-kB signaling in beta-cells. Using a transgenic reporter, we show that NF-kB activity is undetectable in juvenile beta-cells, whereas cells from older fish exhibit heterogeneous NF-kB activity. We link this heterogeneity to differences in gene expression and proliferation. Beta-cells with high NF-kB signaling proliferate significantly less compared to their neighbors with low activity. The NF-kB signalinghi cells also exhibit premature upregulation of socs2, an age-related gene that inhibits beta-cell proliferation. Together, our results show that NF-kB activity marks the asynchronous decline in beta-cell proliferation with advancing age.
https://doi.org/10.7554/eLife.32965.001Introduction
Aging is a universal process that detrimentally changes the characteristics of cells in multicellular organisms. A hallmark of aging is the reduction in cellular renewal and proliferation across different tissues and organs (Yun, 2015). The insulin producing beta-cells, which reside in the islets of Langerhans, provide a good model to study regulators of cellular aging. Whereas young beta-cell are highly proliferative and increase rapidly in number from the prenatal phase until early stages of development in mammals, beta-cell proliferation becomes dramatically reduced in adults (Perl et al., 2010). Nevertheless, adult beta-cell proliferation can increase under specific conditions such as obesity and pregnancy (Parsons et al., 1992; Weir et al., 2001). It remains unclear whether this proliferation is restricted to a privileged population of beta-cells that retain replicative potential even in adult life, or whether it represents stochastic cell cycle re-entry.
Previous studies have indicated that both extrinsic factors, such as the vasculature, and intrinsic factors, such as chromatin modifications, may influence the age-related changes in beta-cells. For example, rejuvenating the beta-cell environment by implanting old islets in younger animals is sufficient to restore the proliferative potential of the aged beta-cells (Almaça et al., 2014; Salpeter et al., 2013). In addition, transcriptome and methylome studies revealed age-dependent DNA methylation changes at cell-cycle regulators, which may contribute to the quiescence of aging beta-cells (Avrahami et al., 2015; Arda et al., 2016). Furthermore, analysis of gene expression in islets from aging mice showed an age-dependent decline of transcripts encoding the platelet-derived growth factor-receptors Pdgfra and Pdgfrb as well as its ligand Pdgf. This decline in expression was shown to underlie a decline in beta-cell proliferation with aging (Chen et al., 2011). Likewise, the expression of the transcription factor FoxM1 declines with aging and the forced expression of its activated form in aged beta-cells is sufficient to re-ignite replication (Golson et al., 2015). In addition, the prostaglandin receptors (E-Prostanoid Receptor 3 and 4) might also regulate beta-cell proliferation in an age-dependent manner (Carboneau et al., 2017).
An important aspect of beta-cell biology is the presence of significant heterogeneity within a seemingly homogenous collection of cells. In particular, beta-cells within the islet and between islets may belong to subpopulations with different ‘ages’ (van der Meulen et al., 2017; Singh et al., 2017), with the proportion of young-to-old beta-cells changing with the age of the animal (Aguayo-Mazzucato et al., 2017). In addition, recent studies have identified various markers of beta-cell heterogeneity such as Fltp, ST8SIA1 and CD9 (Bader et al., 2016; Dorrell et al., 2016). Specifically, Fltp was shown to distinguish the proliferative beta-cells from the more functional ones. However, the markers of beta-cell heterogeneity have not yet been shown to play a direct role in establishing phenotypic differences among the beta-cell subpopulations. In addition, it remains unclear how aging shapes the proliferative heterogeneity of the beta-cells.
To identify signals that change in beta-cells during organismal aging, we used the zebrafish as a model. We first characterized the rate of beta-cell proliferation in juvenile, younger and older adults, and found that proliferation declines with advancing age. We performed transcriptomics of beta-cells from younger and older animals, which identified an upregulation of genes involved in inflammation, including NF-kB signaling. The analysis of inflammatory signaling with single-cell resolution using a transgenic GFP reporter line confirmed that NF-kB signaling was activated in a heterogeneous manner at the level of individual beta-cells. Notably, beta-cells with higher levels of NF-kB signaling exhibit a more pronounced proliferative decline compared to their neighbors with lower activity. These cells also express higher levels of socs2, which can inhibit beta-cell proliferation in a cell-autonomous manner. Our work identifies NF-kB signaling as a marker of beta-cell aging and their proliferative decline.
Results
Beta-cell proliferation declines with advancing age in zebrafish
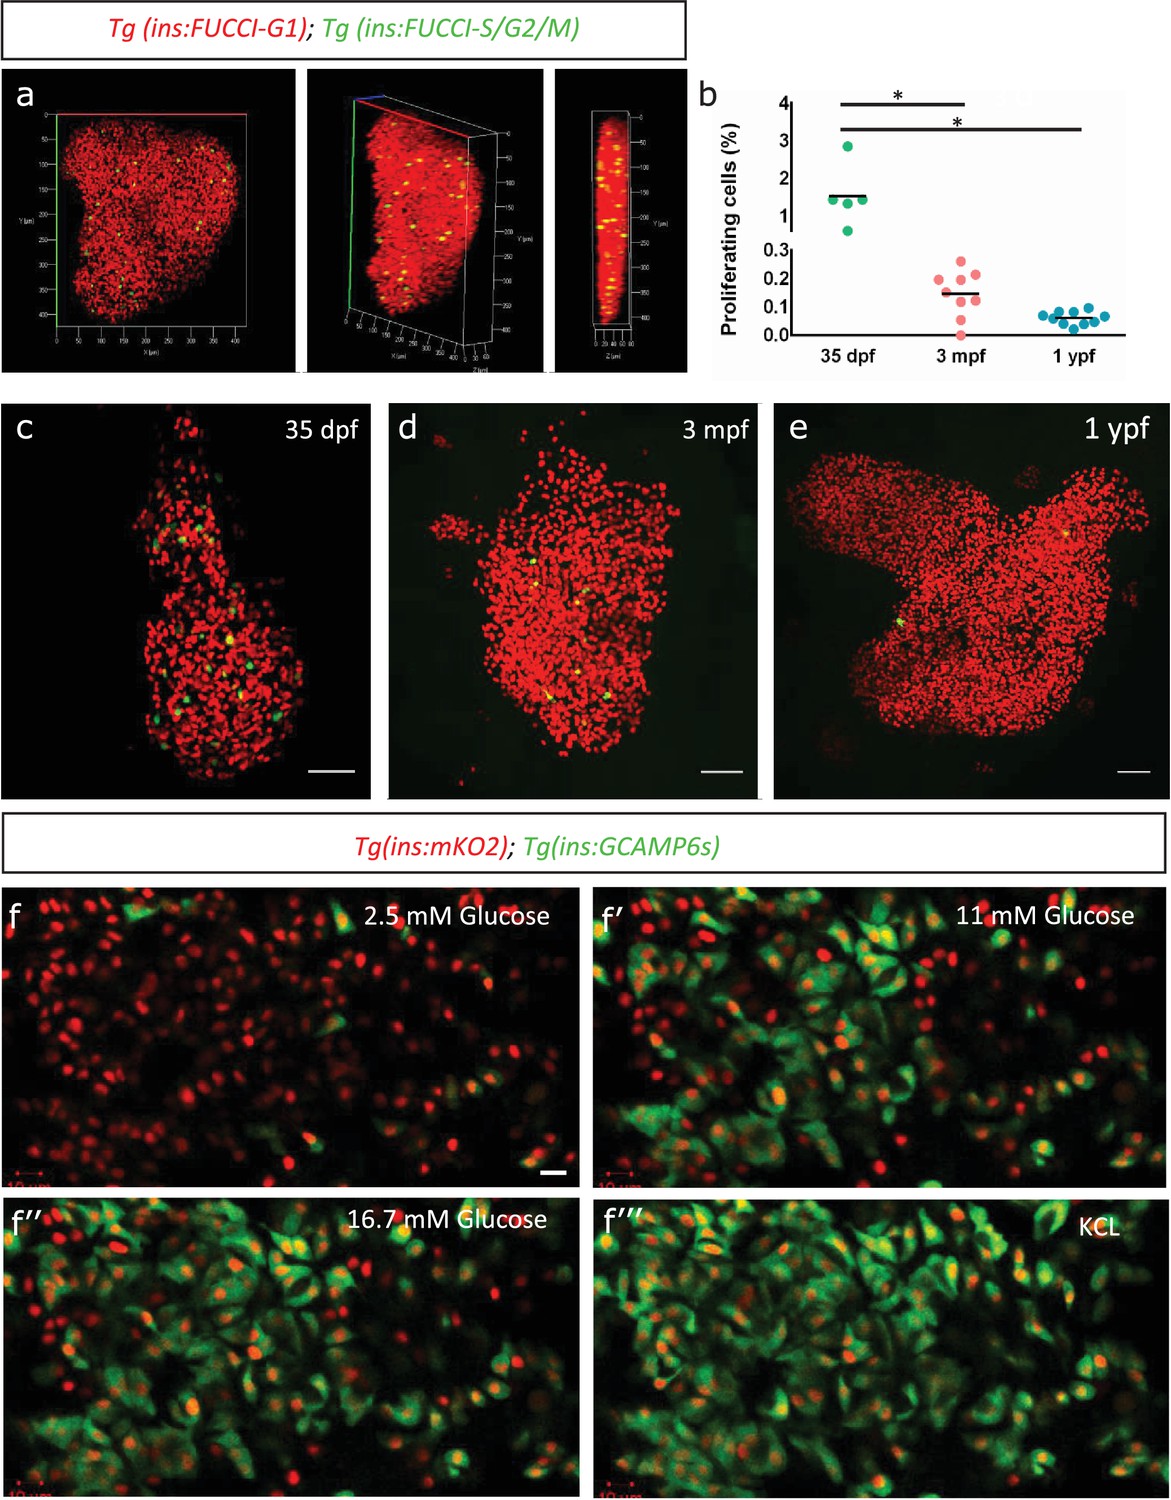
To monitor the endogenous rate of proliferation of zebrafish beta-cells, we used the beta-cell-specific fluorescence ubiquitination cell cycle indicator (FUCCI) lines, Tg(ins:Fucci-G1) and Tg(ins:Fucci-S/G2/M) (Ninov et al., 2013). The FUCCI system uses fluorescent proteins fused with cdt1 to label cells in the G0/G1 phases of cell cycle with red fluorescence and geminin to label cells in S/G2/M with green fluorescence (Figure 1a). We imaged whole primary islets from normally-fed fish at 35 days-post-fertilization (dpf), 3 months-post-fertilization (mpf) and 1 year-post-fertilization (ypf) (Figure 1c–e). We calculated the percentage of Tg(ins:Fucci-G1)-negative and Tg(ins:Fucci-S/G2/M)-positive cells among the total number of beta-cells per islet. We found that the percentage of proliferating beta-cells declined with advancing age. Whereas in islets from 35 dpf animals, on average 1.53% ± 0.72 (n = 5) of the beta-cells were proliferating, this number was reduced to 0.15% ± 0.07 (n = 9) and 0.06% ± 0.02 in islets from 3 mpf and 1 ypf animals, respectively (n = 10) (Figure 1b). A similar decline in beta-cell proliferation was observed also in the secondary islets, which arise from the differentiation of sox9b-expressing progenitors lining the pancreatic ducts (Figure 1—figure supplement 1a–d).
Figure 1 with 1 supplement see all
Beta-cell proliferation declines with age.
(a) 3D-rendering of a primary islet from Tg(ins:Fucci-G1);Tg(ins:Fucci-S/G2/M) animals at 3 mpf showing nuclear Tg(ins:Fucci-G1) (red) and Tg(ins:Fucci-S/G2/M) (green) expression. (b) Quantification of percentage of Tg(ins:Fucci-S/G2/M)-positive and Tg(ins:Fucci-G1)-negative (green-only) beta-cells at 35 dpf (n = 5), 3 mpf (n = 9) and 1 ypf (n = 10) animals. Each dot represents one animal. Horizontal bars represent mean values (one-way ANOVA, *p<0.05). (c, d, e) Confocal projection of whole-mount islets from Tg(ins:Fucci-G1);Tg(ins:Fucci-S/G2/M) animals at 35 dpf, 3 mpf and 1 ypf. Anterior to the top. Scale bar 50 µm. (f) Ex vivo live-imaging of beta-cells from Tg(ins:nlsRenilla-mKO2);Tg(ins:GCaMP6s) animals at 3 mpf. Beta-cells (red) were stimulated with 2.5 (basal) mM D-Glucose, (f’) 11 mM D-glucose, (f’’) 16.7 mM D-glucose and (f’’’) depolarized using 30 mM KCl while monitoring GCAMP6s-fluorescence (green). Scale bar 10 µm.
To confirm that adult beta-cells within the zebrafish primary islets are functional, we analyzed glucose-stimulated calcium influx using Tg(ins:GCaMP6s) transgenic line, a genetically encoded calcium indicator that binds to increasing intracellular Ca2+ and emits green fluorescence (Singh et al., 2017). We crossed this line to Tg(ins:nlsRenilla-mKO2), which marks the beta-cells with red fluorescence. This double transgenic system allowed us to visualize the response of beta-cells to increasing concentrations of glucose over time ex vivo (n = 10) (Figure 1f–f’’’). We found that adult beta-cells were sensitive to glucose, as beta-cells exhibited calcium influx upon stimulation with increasing glucose concentrations.
Aging is associated with transcriptional changes in zebrafish beta-cells
To determine changes in gene expression in beta-cells with increasing age, we used fluorescence-activated cell sorting (FACS) coupled with next-generation RNA-Sequencing to profile fluorescently labeled beta-cells from 3 mpf and 1 ypf animals (Figure 2a–a’, Figure 2—figure supplement 1a). We selected these two stages in order to avoid confounding changes in gene expression associated with the morphogenesis and the remodeling of the islets occurring during the juvenile stages (Singh et al., 2017). Thus, we compared the transcriptomes of beta-cells at 3 mpf and 1 ypf to identify genes that increase in expression with increasing age. In order to avoid introducing sequencing noise or bias, RNA-sequencing of sorted beta-cells was carried out without PCR amplification of the staring mRNA. A comparison between beta-cells from 3 mpf and 1 ypf animals revealed 74 genes that showed 1.5-log2fold difference (p<0.05) in expression (Figure 2b), of which 61 genes were upregulated and 13 genes were downregulated in older beta-cells (Supplementary file 1). Literature survey and unbiased gene ontology analysis using DAVID (Huang et al., 2009a; Huang et al., 2009b) revealed that the upregulated genes were involved in the negative regulation of growth-factor signaling including socs2, cish, spry4 and fstl1 (Figure 2c–c’). We also found upregulation of genes involved in ER stress including trib3 and cebpd, as well as genes associated with increased risk of developing Type two diabetes and glucose intolerance (prtfa, lpp and socs2) (Fang et al., 2014; Szabat et al., 2016; Kato et al., 2006; Lebrun et al., 2010; Nair et al., 2014; Liu et al., 2008).
Figure 2 with 1 supplement see all

Transcriptome profiling of younger and older beta-cells.
(a) Schematic showing isolation and FAC-sorting of beta-cells from Tg(ins:nlsRenilla-mKO2) animals at 3 mpf and 1 ypf followed by high-throughput mRNA-Sequencing. (a’) Heatmap depicting differentially regulated genes among the beta-cells at 1 ypf and 3 mpf involved in beta-cell proliferation, function and inflammation (asterisks denote genes vaildated by single-cell RT-qPCR). (b) Volcano plot representing the distribution of genes that were differentially regulated in beta-cells from 1 ypf and 3 mpf (1.5-log2fold change, p<0.05). (c) The biological categories of enriched genes in beta-cells at one ypf (1.5-log2fold change, p<0.05) based on literature survey. (c’) Unbiased gene-ontology analysis using DAVID of genes enriched in beta-cells at 1 ypf (p<0.05). (d) Gene expression analysis was carried out using single-cell RT-qPCR. Violin plots denote expression distribution of the candidate genes. The Y-axis shows -log10(Ct) values of transcript levels in single beta-cells. The X-axis shows gene names and the respective developmental stages. The percentage values under each violin plot denote the proportion of beta-cells with detectable transcript levels. The cycle threshold for detectable gene expression was set as Ct = 40. The value −1.6 (-log10(40)) on the Y-axis represents undetectable expression as measured by single-cell RT-qPCR (see Materials and methods). Each dot represents one beta-cell. Significance testing for differences in proportion of cells with detectable gene expression at each stage was performed using Pearson’s Chi-Square test (**p<0.01, ***p<0.001).
NF-kB-signaling is activated heterogeneously in the beta-cells with advancing age
In addition to the genes involved in regulating proliferation and ER stress, cytokine-mediated signaling was over-represented in the gene ontology analysis performed using DAVID (Figure 2c’). We found that transcripts associated with an inflammatory signature, such as interleukins, complement factors and members of the NF-kB pathway, including il15, c9, tnfrsf1b, cd74a, cd74b (Starlets et al., 2006), also increased in expression in islets from older animals (Supplementary file 1). Specifically, tnfrsf1b belongs to a superfamily of cytokine receptors, which respond to Tumor Necrosis Factor (TNF) and activate NF-kB, an inducible and ubiquitous transcription factor that senses inflammation (Espı´nEspín-Palazo´nPalazón et al., 2014). In order to validate the changes in gene-expression of tnfrsf1b at the level of individual cells, we performed single-cell RT-qPCR of sorted beta-cells (Supplementary file 2). Notably, the single-cell RT-qPCR revealed that there was an increase in the proportion of beta-cells expressing tnfrsf1b in islets of older animals (Figure 2d). This was also true for additional components of the NF-kB pathway, including ikbaa and tnfα. In contrast, the proportion of sorted cells expressing known beta-cell markers such as insulin, islet1 and neurod1, remained similar (Figure 2d).
We then wanted to test if overexpressing tnfrsf1b in beta-cells can induce NF-kB signaling. To do so, we cloned tnfrsf1b in a plasmid containing an upstream insulin promoter and injected it into one-cell-stage embryos. The ensuing stochastic genomic integration and expression from the insulin promoter leads to mosaic overexpression of tnfrsf1b specifically in beta-cells. We analyzed the activity of NF-kB using an NF-kB signaling reporter line, Tg(NF-kB:GFP) (Kanther et al., 2011). This reporter expresses GFP under the control of six tandem NF-kB-binding sites, such that GFP is expressed upon the nuclear translocation and binding of NF-kB dimer to the NF-kB binding sites. We saw that a higher proportion of beta-cells from animals injected with ins:tnfrsf1b expressed GFP at 5 dpf compared to controls. A total of 32.2% ± 32.07 beta-cells (n = 6) in the tnfrsf1b-injected animals expressed GFP as compared to 2.4% ± 1.98 beta-cells (n = 5) in the controls (Figure 3a–b).
Figure 3 with 3 supplements see all

An inflammation reporter reveals heterogeneous activation of NF-kB signaling in beta-cells with age.
(a) The images show single confocal planes from islets of 5 dpf larvae. The tnfrsf1b coding sequence was expressed under the control of the insulin promoter. The plasmid was injected in Tg(NF-kB:GFP) embryos at the one-cell-stage, leading to mosaic and stochastic expression of the construct in beta-cells. The Tg(NF-kB:GFP) reporter expresses GFP (green) under the control of six tandem repeats of NF-kB DNA-binding sites. Beta-cells were labelled using an insulin antibody (red). Arrows indicate GFP-positive beta-cells. Scale bar 5 µm. (b) The graph shows the percentage of GFP-positive and insulin-positive cells in uninjected controls (n = 5) and tnfrsf1b injected animals (n = 6) at 5 dpf. Horizontal bars represent mean values. (c–e) Confocal stack of islets from Tg(NF-kB:GFP) animals at 1 mpf, 3 mpf and 1 ypf. Beta-cells were labeled using an insulin antibody (red). NF-kB:GFP reporter expression is shown in green. Scale bars 20 µm. (c’–e’) Insets show high magnification single planes of the confocal stacks (corresponding to the regions shown using white dotted-lines in the top panels). Scale bar 10 µm. (f–g) Beta-cells from 3 mpf Tg(NF-kB:GFP) animals were labeled with TSQ (Zn2+ labeling dye) and analyzed using FACS. The graph shows GFP intensity (along the X-axis) and the distribution of beta-cells at 3 mpf and 1 ypf. Horizontal lines indicate the division point between GFPlow and GFPhigh levels. Percentage values represent proportion of cells with GFPlow or GFPhigh expression.
The ability of tnfrsf1b overexpression to activate NF-kB signaling and the increase in the proportion of beta-cells that upregulate tnfrsf1b with age (Figure 2d) prompted us to follow-up on the endogenous levels of NF-kB signaling in the beta-cells. We performed a temporal analysis of NF-kB activity in beta-cells by imaging the islets from Tg(NF-kB:GFP) animals (Figure 3c–e, Figure 3—figure supplement 1a–d). We found that GFP intensity was too low to be detected in beta-cells from the primary or secondary islets of juveniles (1 mpf) (Figure 3c, Figure 3—figure supplement 1a). In contrast, beta-cells from 3 mpf animals exhibited a detectable, salt-and-pepper pattern of GFP expression (Figure 3d, Figure 3—figure supplement 1b), suggesting heterogeneous NF-kB activation, which is consistent with the heterogeneous expression of tnfrsf1b (Figure 2d). Notably, nearly all beta-cells in both the primary and secondary islets from 1 ypf animals express GFP (Figure 3e, Figure 3—figure supplement 1c).
To better quantify the proportions of GFP-positive cells in younger and older islets, we labeled beta-cells from 3 mpf and 1 ypf Tg(NF-kB:GFP) animals using the Zn2+ chelator TSQ (Kim et al., 2000), which preferentially labels beta-cells due to their high-zinc content (Figure 3—figure supplement 2a–b). TSQ-labeled beta-cells were then passed through FACS and were analyzed for the levels of GFP expression in each cell. Flow cytometry analysis of cells from 3 mpf and 1 ypf animals confirmed the presence of two populations at each stage based on GFP-fluorescence intensity (Figure 3f–g) (n = 10). Quantifying the proportion of cells within the low- and high-GFP expressing regions indicated that a higher proportion of cells express GFP in older animals (Figure 3f–g). Thus, we found that not only does the overall GFP expression increases in individual cells with increasing age, but a higher proportion of cells with GFP expression were present in the islets of the older compared to younger animals (Figure 3f–g).
In order to verify that the increase in GFP levels in older fish is not simply due to the accumulation of GFP protein, we quantified using RT-qPCR the differences in GFP mRNA in beta-cells sorted from 3 mpf and 1 ypf animals of the genotype Tg(ins:mCherry);Tg(NF-kB:GFP). We saw approximately 50% increase in the GFP transcript levels in beta-cells from 1 ypf animals as compared to 3 mpf animals (Figure 3—figure supplement 3a). This result corroborates the increase in NF-kB reporter activity in beta-cells between the two time points. Furthermore, we used index sorting of single-cells, which allows to correlate transcript levels with GFP fluorescence intensity in individual beta-cells. Overall, there was a positive correlation between GFP mRNA and GFP fluorescence intensity across cells (R2 = 0.28) (Figure 3—figure supplement 3b).
Immune cells infiltrate the islet during development and persist throughout adult life
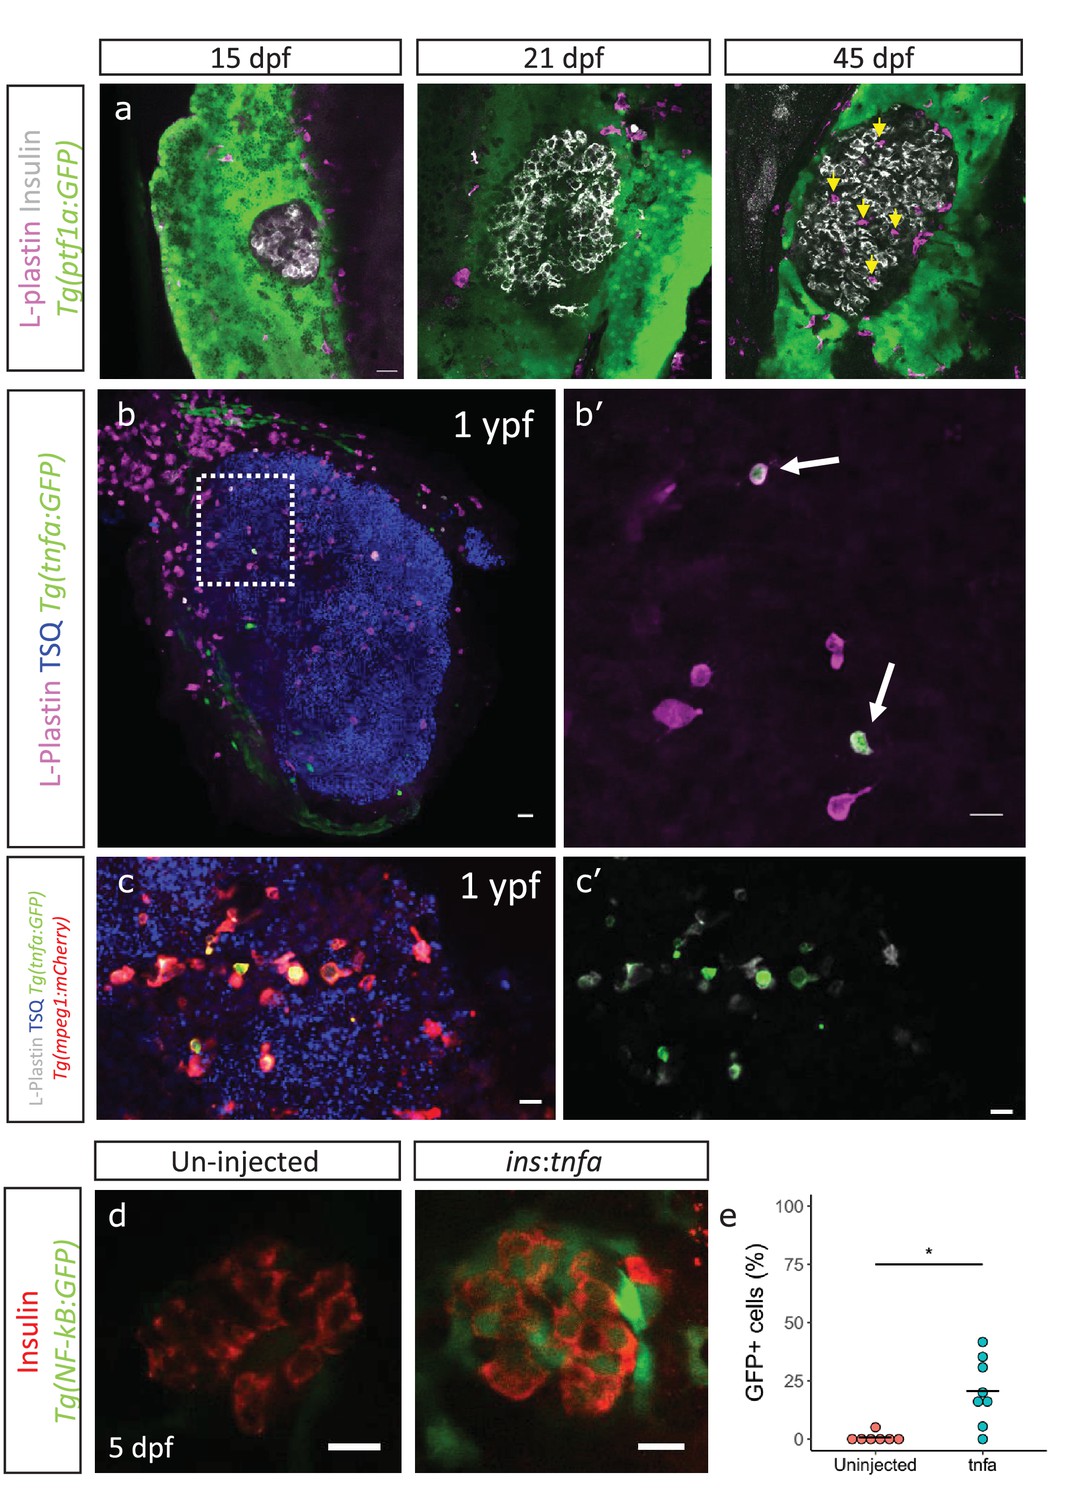
An enrichment of genes associated with an inflammatory signature in beta-cells from older fish together with the heterogeneous activation of the NF-kB pathway prompted us to look for additional signs of islet inflammation. One cell type important for the response and resolution of inflammation is the tissue-resident macrophage. To study this cell type in the developing islet, we labeled immune cells using a pan-leukocyte marker, L-plastin, which marks the monocyte/macrophage lineage in zebrafish (Mathias et al., 2009). We found that whereas innate immune cells were not present in the islets during the larval stages (15–21 dpf), they had infiltrated them during the late juvenile stages (45 dpf) (Figure 4a). Analysis of the macrophage reporter line, Tg(mpeg1:mCherry), revealed that the innate immune cells were macrophages, whereas neutrophils could not be detected, as assessed by the neutrophil-specific line Tg(lyz2:GFP) (Figure 4—figure supplement 1a, data not shown).
Figure 4 with 1 supplement see all
Immune cells infiltrate the islet during development and persist throughout adult life.
(a) Confocal images of pancreata from 15, 21 and 45 dpf animals. Beta-cells were labeled using an insulin antibody (grey), leukocytes were labeled using an L-plastin antibody (magenta) and Tg(ptf1a:GFP) marks the acinar cells (green). Immune cells are present within the islet at 45 dpf (arrows). (b) Confocal images of whole islets from Tg(tnfα:GFP) animals at 1 ypf. Islets were labeled using TSQ (Zn2+ labeling dye) (blue), leukocytes were labelled with an L-plastin antibody (magenta) and Tg(tnfα:GFP) marks cells expressing tnfα (green). Scale bars 20 µm. (b’) Insets show high-magnification single planes from the confocal stacks (corresponding to the area marked using a white dotted-line in b). Scale bar 10 µm. (c–c’) Confocal image of a one ypf islet showing a single plane. The TgBAC(tnfα:GFP) line marks the tnfα-positive cells (green), whereas Tg(mpeg1:mCherry) marks the macrophages (red). The L-plastin antibody marks all leukocytes (grey) and TSQ (Zn2 +labeling dye) was used to mark the islet (n = 5). Scale bar, 10 µm. (d) Confocal images showing islets at five dpf. The tnfα cDNA was expressed under the insulin promoter. The plasmid was injected in Tg(NF-kB:GFP) embryos at the one-cell-stage and the islets were analyzed at 5 dpf. Beta-cells were labeled with an insulin antibody (red). Tg(NF-kB:GFP) reporter expression is shown in green. (e) The graph shows the percentage of GFP and insulin double-positive cells in un-injected controls (n = 7) and ins:tnfα injected animals (n = 8) at five dpf. Horizontal bars represent mean values (two-tailed t-test, *p<0.05).
To test whether these infiltrating immune cells express inflammatory cytokines, such as TNFα, we made use of a TgBAC(tnfα:GFP) transgenic line and examined the presence of tnfα-expressing leukocytes within the L-plastin-positive population (Marjoram et al., 2015). On average 25% ± 10.9 (n = 5) and 17% ± 11.1 (n = 5) of the L-plastin-positive cells inside the islet expressed tnfα:GFP in 3 mpf and one ypf animals, respectively (p>0.05) (Figure 4b, Figure 4—figure supplement 1b). However, the number of tnfα:GFP-positive cells, as well as the total number of L-plastin-positive cells showed increasing trends in the islets from older animals (Figure 4—figure supplement 1c–d). Analysis of TgBAC(tnfα:GFP) together with specific labeling of macrophages using Tg(mpeg1:mCherry) confirmed that the tnfα:GFP-expressing leukocytes were macrophages (Figure 4c).
We next wanted to test whether tnfα-expression is capable of inducing inflammatory activity in the beta-cells. To this end, we placed tnfα under the insulin promoter in order to drive beta-cell-specific expression. We injected the construct in one-cell-stage Tg(NF-kB:GFP) embryos and analyzed GFP-expression in beta-cells at 5 dpf. Indeed, we found that tnfα-expression alone could induce NF-kB:GFP reporter activity (Figure 4d–e).
NF-kB:GFPhigh beta-cells proliferate less compared to their neighbors
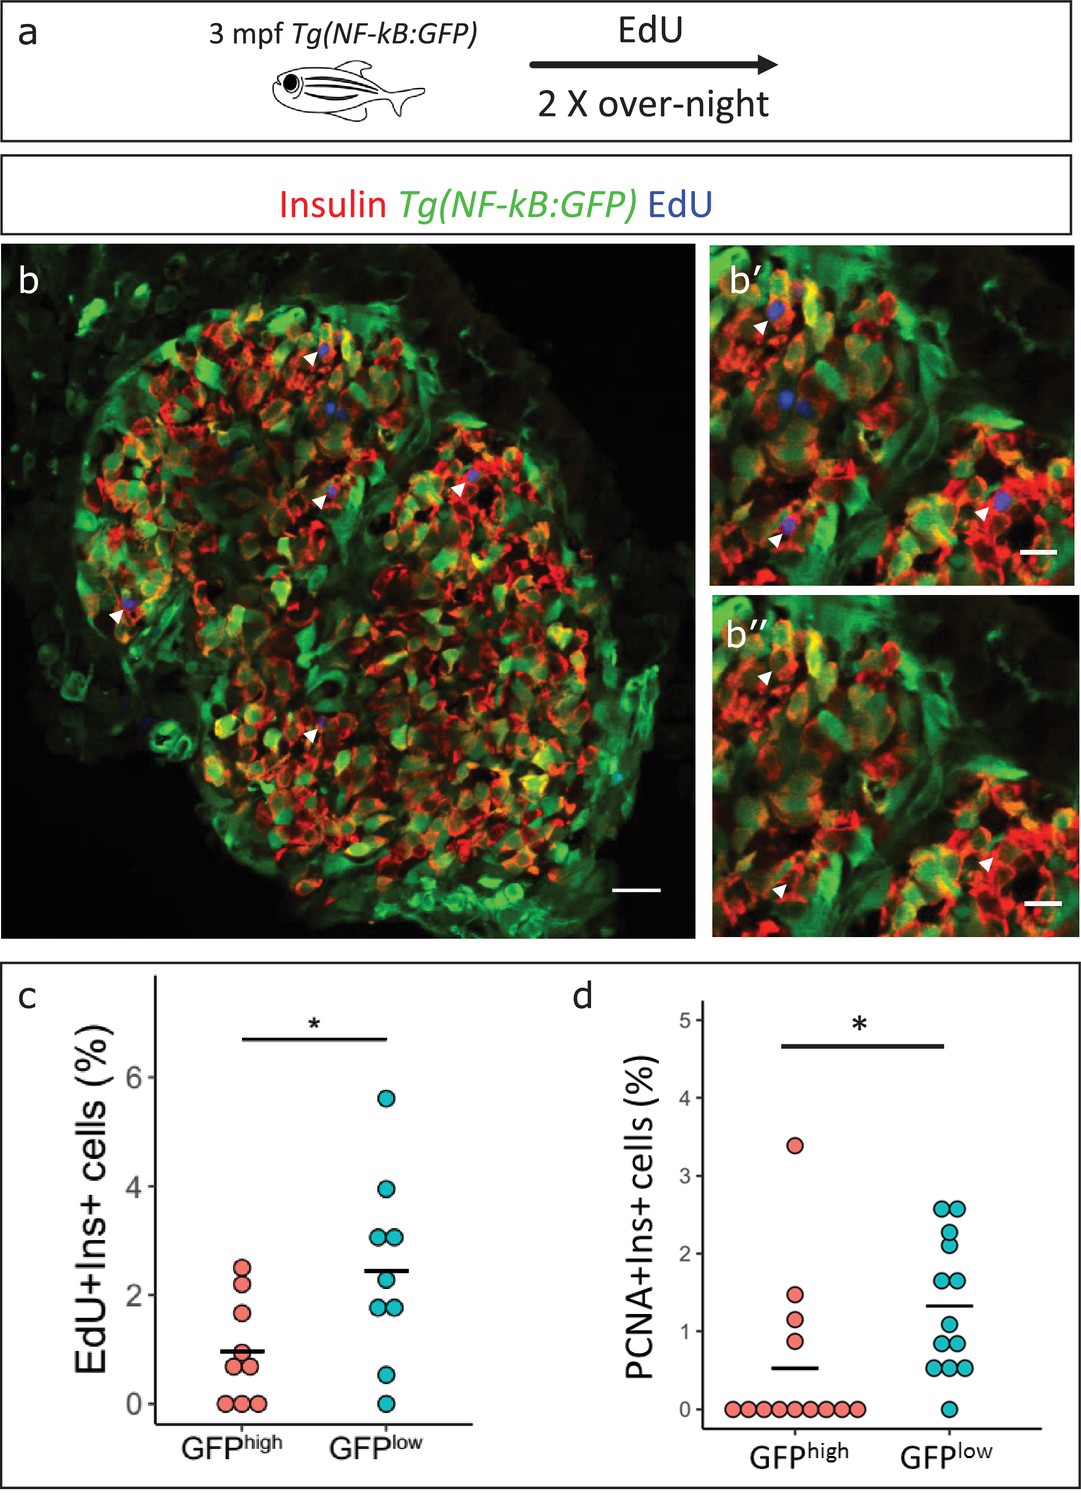
Based on the earlier observation that beta-cell proliferation declines in older fish, and the finding that NF-kB:GFP expression increases, we asked if high NF-kB activity and beta-cell proliferation were inversely correlated. We performed 5-ethynyl-2´-deoxyuridine (EdU) incorporation assay to mark the proliferating beta-cells in 3 mpf Tg(NF-kB:GFP) animals and examined the levels of NF-kB:GFP in the EdU-positive and negative beta-cells. We measured the normalized GFP intensity in all beta-cells in the islets of 3 mpf animals (n = 9). The total normalized mean GFP intensity of all the sections belonging to one islet, designated GFPtotal, was set as a threshold for each respective islet. The beta-cells with normalized mean GFP intensity higher than GFPtotal were categorized as NF-kB:GFPhigh while cells with normalized mean GFP intensity lower than GFPtotal were categorized as GFPlow. We observed that a lower proportion of the NF-kB:GFPhigh cells had incorporated EdU over a 2-day period as compared to GFPlow cells (Figure 5a–c). In order to confirm that the GFP fluorescence of beta-cells remains stable over the 2-day period of EdU incorporation, we followed individual FAC-sorted NF-kB:GFPhigh and low beta-cells over 72 hr ex vivo. Indeed, the GFP fluorescence remained stable over the time-period of the experiment (Figure 5—figure supplement 1). In addition, to obtain a snapshot of the proliferative status of the cells, we performed immunohistochemistry for the proliferating cell nuclear antigen (PCNA), which marks proliferating cells. A higher proportion of NF-kB:GFPlow cells were positive for PCNA, as compared to NF-kB:GFPhigh cells (Figure 5d, Figure 5—figure supplement 2). We conclude that beta-cells with high NF-kB signaling proliferate significantly less compared to their neighbors with lower activity.
Figure 5 with 2 supplements see all
NF-kB:GFPhigh beta-cells proliferate less than their neighbors.
(a) Schematic showing the EdU (5-ethynyl-2′-deoxyuridine) incorporation assay. Tg(NF-kB:GFP) animals were incubated in EdU at 3 mpf for two consecutive nights and fed during each day. (b) EdU incorporation assay was performed to mark the proliferating beta-cells in Tg(NF-kB:GFP) animals at 3 mpf. The confocal image (single plane) shows an overview of a section through the islet. Beta-cells were labeled with an insulin antibody (red), a GFP antibody (green) and EdU (blue). Arrowheads point to EdU-positive beta-cells. (b’–b’’) The insets show higher magnification images with and without the EdU channel. EdU incorporation can be observed in some of the GFPlow cells (white arrow-heads). (c) An insulin-positive cell was first located by going through individual sections in the confocal z-stack. The optical section containing the largest area of the nucleus was chosen as the center of the cell. A region-of-interest (ROI) was drawn around the nucleus and the fluorescence intensities of the GFP and DAPI channels were recorded. The normalized GFP intensity was calculated as a ratio of mean GFP intensity and mean DAPI intensity for each ROI. The average total normalized GFP-intensity of each islet was set as a threshold for dividing the cells into GFPhigh and GFPlow populations. The graph shows the percentage of EdU and insulin double-positive cells among the GFPhigh and GFPlow populations. Each dot represents one islet (n = 9). Horizontal bars represent mean values (two-tailed t-test, *p<0.05). (d) The graph shows the percentage of PCNA and insulin double-positive cells among the GFPhigh and GFPlow populations. Each dot represents one islet (n = 13). Horizontal bars represent mean values (two-tailed t-test, *p<0.05). See also Figure 5—figure supplement 2 for representative PCNA antibody staining.
Socs2 is enriched in NF-kB:GFPhigh beta-cells and inhibits proliferation
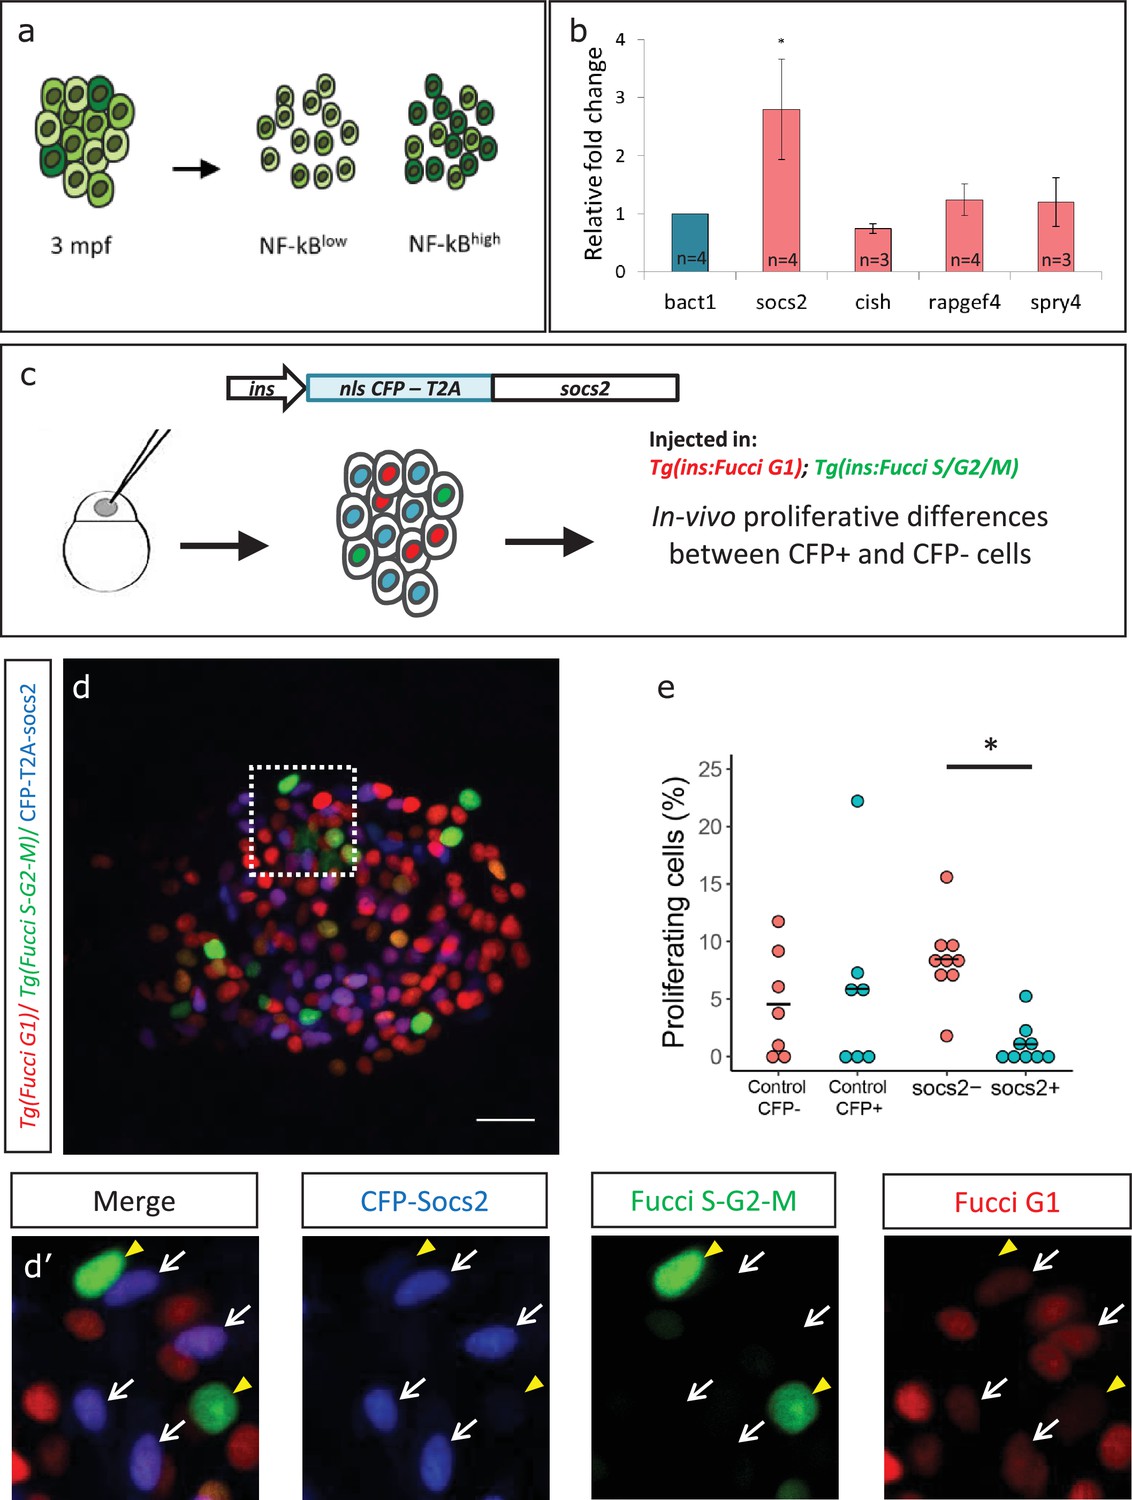
To investigate molecular factors to explain the lower proliferation of NF-kB:GFPhigh beta-cells, we separated the beta-cells from 3 mpf animals into GFPhigh and GFPlow populations using a double transgenic line Tg(ins:mCherry);Tg(NF-kB:GFP) by FACS (Figure 6a, Figure 6—figure supplement 1). Using RT-qPCR analysis of the GFPhigh and GFPlow populations, we then quantified the expression levels of selected candidate genes that we previously found to be significantly enriched in beta-cells from older animals (1 ypf) in the transcriptomic analysis. We found that socs2 showed more than 2.5-fold higher expression (n = 4 biological replicates, n = 3 animals per replicate, 1000 cells per condition) in the GFPhigh cells compared to GFPlow, whereas other genes did not exhibit significantly higher expression (Figure 6b, Figure 6—source data 1).
Figure 6 with 2 supplements see all
Socs2 is enriched in NF-kB:GFPhigh cells and inhibits beta-cell proliferation in a cell-autonomous manner.
(a) Schematic showing the sorting of beta-cells from the double transgenic line Tg(ins:mCherry);Tg(NF-kB:GFP) at 3 mpf into GFPhigh and GFPlow cells using FACS. (b) Bulk RT-qPCR was performed on the GFPhigh and GFPlow beta-cells (n = 3 to 4 biological replicates, n = 3 animals per replicate, 1000 cells per condition). Candidate genes significantly enriched in beta-cells at 1 ypf were chosen to be compared between the GFPhigh and GFPlow populations at 3 mpf. The graph shows relative fold-change between GFPhigh and GFPlow cells. The expression of all genes was normalized to β-actin expression before calculating fold-change. socs2 shows higher expression in the GFPhigh cells. Error bars, SD (two-tailed paired t-test, *p<0.05). (c) Schematic showing the method for mosaic overexpression of candidate genes in beta-cells. The socs2 coding sequence is linked to nuclear-CFP using a T2A sequence. The entire construct was expressed under the insulin promoter. This construct was injected in one-cell-stage-embryos from Tg(ins:Fucci-G1);Tg(ins:Fucci-S/G2/M) animals leading to mosaic and stochastic expression of socs2 in beta-cells during islet development. Control animals were injected with plasmid containing only nuclear-CFP sequence (See Figure 6—figure supplement 2). (d) Confocal projections showing mosaic expression of socs2-T2A-CFP (blue) at 23 dpf (blue). Proliferating beta-cells are marked by Tg(ins:Fucci-S/G2/M) expression (green) and absence of Tg(ins:Fucci-G1) expression (red). Anterior to the left. Scale bar 10 µm. (d’) Insets show higher magnification single planes from the confocal stacks (white dotted-line in d) with separate channels. The proliferating beta-cells are CFP-negative (yellow arrowheads), whereas some of the non-proliferating cells are CFP-positive (white arrowheads) (e) Quantification of the percentage of Tg(ins:FUCCI-S/G2/M)-positive and Tg(ins:FUCCI-G1)-negative (green only) beta-cells. The socs2 expressing β-cells exhibit reduced cell-cycle progression compared to wild-type neighbors (n = 9). Horizontal bars represent mean values (two-tailed t-test, *p<0.05).
-
Figure 6—source data 1
This spreadsheet contains the Relative Fold Change between NF-kB:GFPhigh and NF-kB:GFPlow beta-cells used to generate the bar plots and average data shown in Figure 6b.
- https://doi.org/10.7554/eLife.32965.018
To test if higher levels of socs2 expression can inhibit beta-cell proliferation, we generated a bi-cistronic construct containing CFP linked to socs2 via a viral T2A sequence, and placed it under the control of the insulin promoter. Injecting the plasmid in one-cell-stage zebrafish embryos leads to mosaic and stochastic expression of socs2 in beta-cells at later stages (Figure 6c). To quantify the effect of socs2 expression on proliferation, we injected the plasmid in Tg(ins:Fucci-G1);Tg(ins:Fucci-S/G2/M) embryos, such that beta-cells in the G0/G1 phases of cell-cycle were labeled in red, whereas cells in the S/G2/M phases of cell cycle were labeled in green. The cells expressing socs2 were also CFP-positive, allowing us to distinguish them from wild-type beta-cells in the same islet (Figure 6d). We then quantified the proportion of proliferating CFP-positive and CFP-negative beta-cells at 23–25 dpf, a stage characterized by higher rates of beta-cell proliferation. We found that whereas 8.44% ± 3.37 of the CFP-negative beta-cells were proliferating, only 1.08% ± 1.65 CFP-positive beta-cells exhibited cell-cycle progression (n = 9) (Figure 6e). Overexpression of CFP alone, or CFP-T2A-rapgef4 and CFP-T2A-spry4 in this mosaic manner did not affect proliferation (Figure 6—figure supplement 2). Thus, socs2 can cell-autonomously inhibit beta-cell proliferation. Altogether, these results suggest that the higher endogenous expression of socs2 in NF-kB:GFPhigh compared to NF-kB:GFPlow beta-cells could contribute to the proliferative heterogeneity among beta-cells based on the differences in NF-kB signaling strength.
Discussion
Type two diabetes is an age-related disease, and hence, it is important to identify how advancing age alters the islet. Our work shows that in zebrafish, NF-kB signaling becomes preferentially active in beta-cells from older animals. An additional sign of islet inflammation is the recruitment of intra-islet macrophages, a subset of which express the cytokine tnfα. In addition, we show that beta-cells upregulate in a heterogeneous manner the TNFα receptor, tnfrsf1b, and that tnfα-expression is sufficient to trigger NF-kB signaling activation. Altogether, our results document the development of chronic islet inflammation in older animals. Based on our data, we also propose that with age, beta-cell replication declines in a heterogeneous manner, with high levels of NF-kB signaling marking the cells that lose proliferative potential (Figure 7).
Figure 7
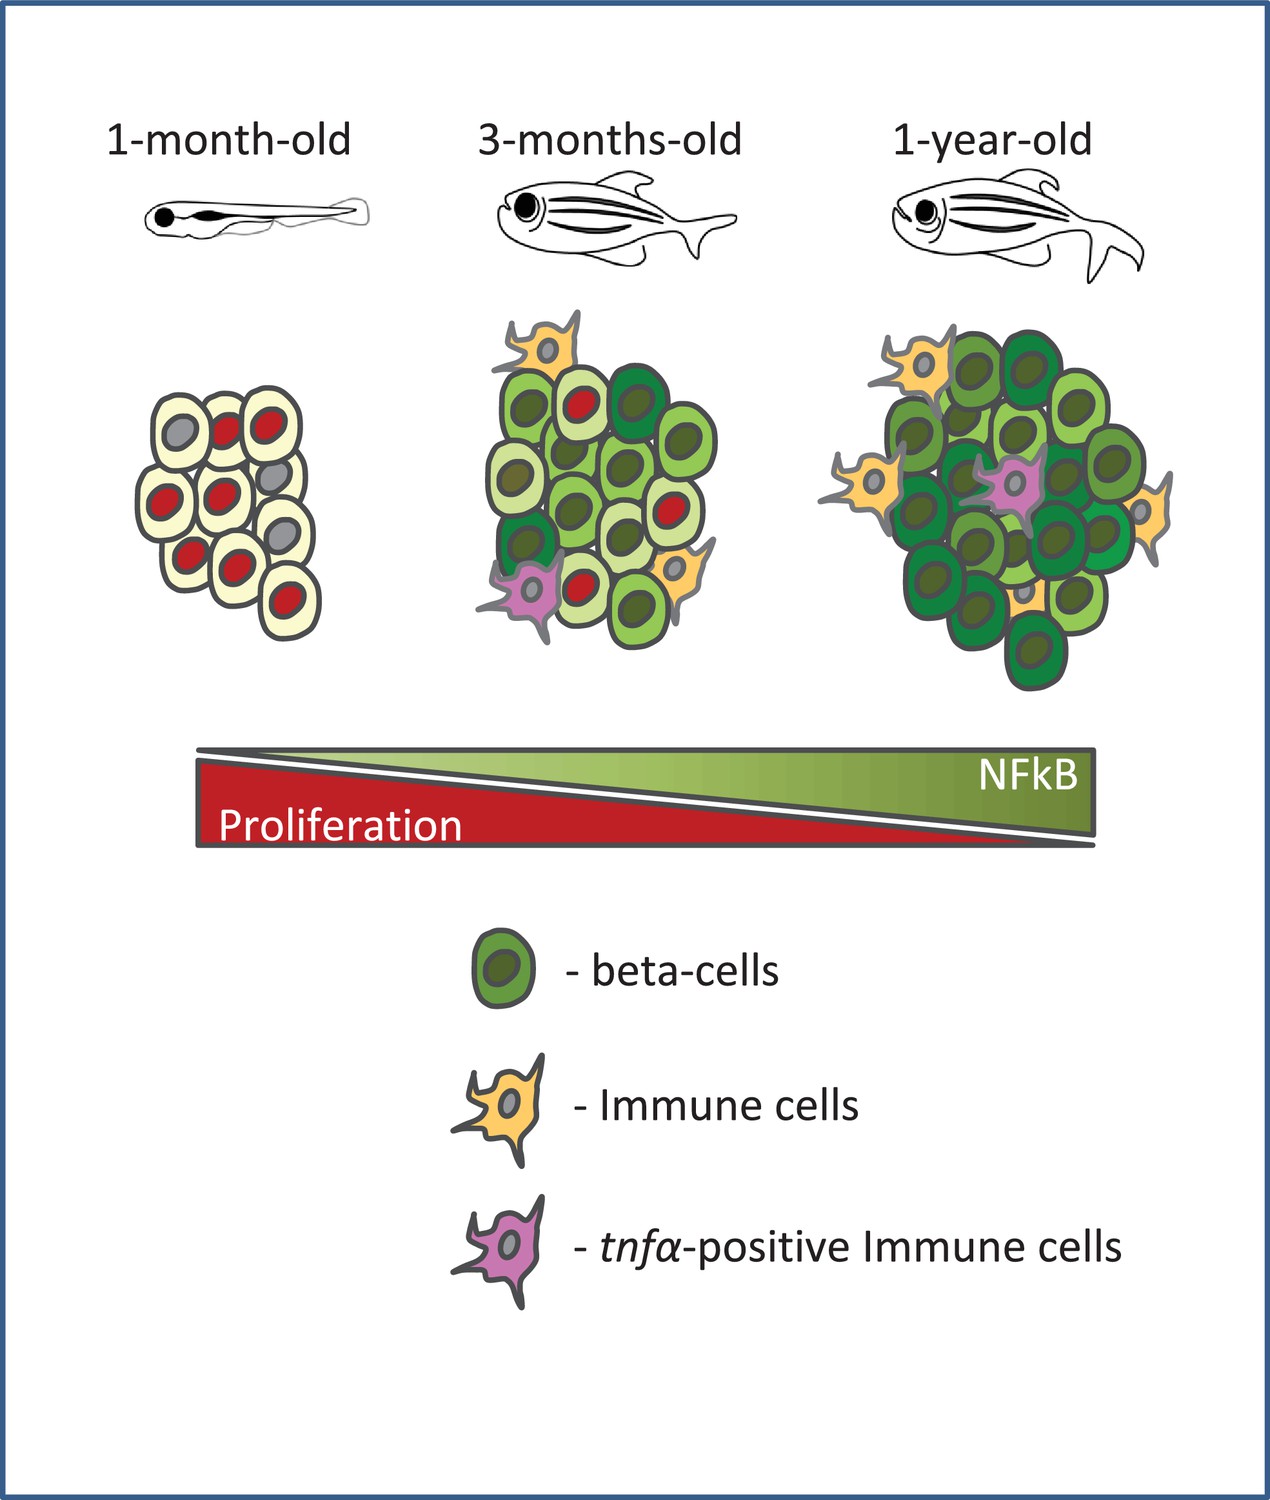
A schematic summarizing our model.
Beta-cell proliferation declines with age together with a concurrent increase in NF-kB signaling. The activation of NF-kB signaling is heterogeneous among beta-cells and correlates with their proliferative heterogeneity. In particular, beta-cells with higher NF-kB activity proliferate less compared to neighbors with lower activity, and express higher levels of socs2, which can inhibit beta-cell proliferation. Furthermore, the crosstalk with tnfα-positive immune cells in the islet provides a potential source of inflammation and NF-kB activation in beta-cells.
The relevance of our results extends beyond the zebrafish model, as they corroborate empirical evidence gathered in human beta-cells. There is emerging evidence that chronic inflammation is a characteristic of aging in human (Puchta et al., 2016) and is associated with beta-cell dysfunction in type two diabetes (Nordmann et al., 2017). Moreover, the accumulation of innate immune cells in islets in fish is reminiscent of changes observed in type two diabetes in man (Nordmann et al., 2017). Furthermore, islets form older human donors exhibit an increase in the number of intra-islet macrophages (Almaça et al., 2014), analogous to zebrafish. Thus, our work puts forward the zebrafish as a new model to investigate the mechanisms of beta-cell aging and the crosstalk between beta-cells and the innate immune system, which is of relevance to understanding human disease.
Our work also adds to the burgeoning field of mammalian beta-cell heterogeneity. A recent report from Bonner-Weir and colleagues (Aguayo-Mazzucato et al., 2017) revealed progressive increases in the proportion of beta cells expressing age-related markers, including IGF-IR in older mice and human islets, suggesting that aging in mammalian beta-cells might be a heterogeneous process. In our study, we identified a different marker of age-related heterogeneity – NF-kB-activity, and linked this to the proliferative decline of beta-cells, which is an important age-related trait. Intriguingly, the human receptor TNFRSF11A (Receptor Activator of NF-kB) shows markedly heterogeneous expression in adult human beta-cells according to the single-cell sequencing database provided by the Sandberg lab (http://sandberg.cmb.ki.se/pancreas/) (Segerstolpe et al., 2016). The significance of this observation for human beta-cell heterogeneity needs further investigation. Notably, TNFRSF11A antagonism can increase human beta-cell proliferation, implicating NF-kB signaling in beta-cell proliferation (Kondegowda et al., 2015). Indeed, we found that in zebrafish, beta-cells with higher levels of NF-kB signaling elevate socs2 expression, which in turn can reduce proliferation. Of note, adenovirus transduction of the functionally related gene socs3 in rat islets inhibits beta-cell proliferation (Lindberg et al., 2005). It will be necessary to address whether NF-kB activates socs2 directly or indirectly to control proliferation.
Recent studies have proposed that beta-cell proliferation and functional maturity exhibit an inverse correlation. For example, gene-expression analysis revealed that proliferating beta-cells reduce the levels of transcripts required for beta-cell function (Klochendler et al., 2016). In addition, lineage tracing of immature and mature beta-cells within the same islet revealed higher proliferation of immature beta-cells (Singh et al., 2017). In this regard, it will be important to explore whether beta-cells with higher NF-kB signaling are functionally more mature compared to the ones with lower activity, and whether beta-cell function increases in older zebrafish. To start addressing these questions, we performed analysis of beta-cell functional connectivity of our calcium recordings using algorithms developed in the Hodson and Rutter groups (Hodson et al., 2012;Johnston et al., 2016). However, this analysis did not reveal conclusive changes in beta-cell connectivity with aging (data not shown). In the future, it will be informative to develop new calcium fluorescent reporters allowing to monitor and compare glucose-responsiveness of NF-kB:GFPlow and NF-kB:GFPhigh cells within the same islet.
An intriguing observation of our study is the presence of tnfα-positive macrophages in the islets under basal conditions, which might indicate that these macrophages are activated and pro-inflammatory (Nguyen-Chi et al., 2015). Under steady state, activated macrophages are typically observed only in barrier organs, such as the lung and the intestine (Ferris et al., 2017). Our results now show that activated macrophages are also present in the islets of adult zebrafish under physiological conditions. In agreement with our findings, a recent report documented the presence of islet-resident macrophages expressing TNFα, IL1b and MHC-II (Ferris et al., 2017) in non-obese diabetic (NOD) mice. However, despite the presence of cytokine expression in the macrophages, Ferris et al. could not detect nuclear RelA (a member of the NF-kB heterodimer) signaling in the islets, suggesting that beta-cells did not activate NF-kB signaling. This might be a result of the lower sensitivity of their detection method. Indeed, using a sensitive readout of NF-kB signaling based on a transgenic reporter, we show that tnfα-expression alone is capable of inducing NF-kB activation in beta-cells. However, we note that further studies and new tools will be necessary to address the crosstalk between the innate immune cells and beta-cell inflammation. Furthermore, additional inflammatory signals can originate from cells other than the macrophages. For example, acinar cells were recently shown to express TNFα, which in turn induces apoptosis in aged mouse beta-cells (Xiong et al., 2017).
Besides paracrine factors, NF-kB activity might be regulated by beta-cell intrinsic factors. In particular, ER stress is known to activate NF-kB signaling in multiple cell types (Tam et al., 2012). It is possible that with aging, beta-cells experience higher levels of ER stress and thereby activate NF-kB signaling. Therefore, a good question for the future will be to define the contribution of extrinsic and intrinsic factors, including ER-stress, to the heterogeneous activation of inflammation in beta-cells. Our study opens the possibility to use Danio rerio as a new model for gaining insights into the links between aging and beta-cell biology and the relationship between the innate immune system and diabetes.
Materials and methods
Key resources table
| Reagent type (species) or resource | Designation | Source or reference | Identifiers | Additional information |
|---|---|---|---|---|
| Gene (Danio rerio) | flag-tnfrsf1b | synthesized from GenScript | ||
| Gene (Danio rerio) | tnfα | Dharmacon | MDR1734-202796946 | ZGC tnfa cDNA (CloneId:8148192) |
| Gene (Danio rerio) | cpf-T2A | synthesized from GenScript | ||
| Genetic reagent (Danio rerio) | Tg(ins:FUCCI-G1)s948 | PMID: 23791726 | ||
| Genetic reagent (Danio rerio) | Tg(ins:FUCCI-S/G2/M)s946 | PMID: 23791726 | ||
| Genetic reagent (Danio rerio) | Tg(NF-kB:GFP) | PMID: 21439961 | ||
| Genetic reagent (Danio rerio) | TgBAC(tnfα:GFP) | PMID: 25730872 | ||
| Genetic reagent (Danio rerio) | Tg(ins:nlsRenilla-mKO2) | PMID: 28939870 | ||
| Genetic reagent (Danio rerio) | Tg(ins:gCaMP6s; cryaa:mCherry) | PMID: 28939870 | ||
| Genetic reagent (Danio rerio) | Tg(ins: loxP:mCherrySTOP:loxP:H2B-GFP) | PMID: 21497092 | ||
| Genetic reagent (Danio rerio) | Tg(mpeg1:mCherry) | PMID: 21084707 | ||
| Genetic reagent (Danio rerio) | Tg(ins:CFP-NTR) | PMID: 17326133 | ||
| Antibody | anti-insulin | Dako | A0564 | guinea pig (1:200) |
| Antibody | anti-EGFP | Abcam | ab13970 | chicken (1:500) |
| Antibody | anti-PCNA | Dako | M0879 | mouse (1:500) |
| Antibody | anti-L-plastin | Biozol | LS-C210139-250 | rabbit (1:1000) |
| Antibody | Alexa Fluor488, 568 and 647 secondaries | Molecular Probes | (1:300) | |
| Recombinant DNA reagent | ins:Flag-tnfrsf1b;cryaa:RFP (plasmid) | This paper | cloned into ins:MCS2;cryaa:RFP | |
| Recombinant DNA reagent | ins:tnfα;cryaa:CFP (plasmid) | This paper | cloned by replacing mCherry-zCdt1 with tnfα in ins:mCherry-zCdt1;cryaa:CFP | |
| Recombinant DNA reagent | ins:CFP-T2A-socs2;cryaa:RFP (plasmid) | This paper | cloned into ins:MCS2;cryaa:RFP | |
| Recombinant DNA reagent | ins:CFP-T2A-rapgef4;cryaa:RFP (plasmid) | This paper | cloned into ins:MCS2;cryaa:RFP | |
| Recombinant DNA reagent | ins:CFP-T2A-spry4;cryaa:RFP (plasmid) | This paper | cloned into ins:MCS2;cryaa:RFP | |
| Recombinant DNA reagent | ins:mAG-zGeminin;cryaa:RFP (plasmid) | PMID: 23791726 | ||
| Recombinant DNA reagent | ins:MCS2;cryaa:RFP (plasmid) | PMID: 28939870 | ||
| Recombinant DNA reagent | ins:mCherry-zCdt1;cryaa:CFP (plasmid) | PMID: 23791726 | ||
| Software, algorithm | edgeR package | PMID:19910308 | ||
| Other | TSQ (N-(6-Methoxy-8-Quinolyl)-p-Toluenesulfonamide) | ThermoFisher | M-688 | 30 µM |
Zebrafish strains and husbandry
Request a detailed protocolWild-type or transgenic zebrafish of the outbred TL, AB, WIK strains were used in all experiments. Zebrafish were raised under standard conditions at 28°C. Animals were chosen at random for all experiments. Published transgenic strains used in this study were Tg(ins:FUCCI-G1)s948 (Ninov et al., 2013), Tg(ins:FUCCI-S/G2/M)s946 (Ninov et al., 2013), Tg(NF-kB:GFP) (Kanther et al., 2011), TgBAC(tnfa:GFP) (Marjoram et al., 2015), Tg(ins:nlsRenilla-mKO2) (Singh et al., 2017), Tg(ins: loxP:mCherrySTOP:loxP:H2B-GFP) abbreviated as Tg(ins:mCherry) (Hesselson et al., 2011), Tg(mpeg1:mCherry) (Ellett et al., 2011), Tg(ins:CFP-NTR) abbreviated as Tg(ins:CFP) (Curado et al., 2007). Experiments were conducted in accordance with the Animal Welfare Act and with permission of the Landesdirektion Sachsen, Germany (AZ 24–9168, TV38/2015, A12/2016, A5/2017).
Cloning and constructs
Request a detailed protocolTo generate ins:Flag-tnfrsf1b;cryaa:RFP, a vector was created by inserting multiple cloning sites (MCS2) downstream of the insulin promoter to yield ins:MCS2;cryaa:RFP. To do so, the plasmid ins:mAG-zGeminin;cryaa:RFP was digested with EcoRI/PacI and ligated with dsDNA generated by annealing two primers harboring the sites SpeI, BamHI, EcoRV and flanked by EcoRI/PacI overhangs. The plasmid pUC consisting of the tnfrsf1b flanked by EcoRI/PacI sites was synthesized from GenScript. Primers were designed such that EcoRI site was destroyed in the process of inserting tnfrsf1b under the insulin promoter. ins:MCS2;cryaa:RFP and the plasmid pUC-Flag-tnfrsf1b were subsequently digested with EcoRI/PacI to yield compatible fragments, which were ligated together to yield the final construct. The entire construct was flanked with I-SceI sites to facilitate transgenesis.
To generate ins:CFP-T2A-socs2;cryaa:RFP, a vector was created by inserting multiple cloning sites (MCS2) downstream of the insulin promoter to yield ins:MCS2; cryaa:RFP. To do so, the plasmid ins:mAG-zGeminin;cryaa:RFP was digested with EcoRI/PacI and ligated with dsDNA generated by annealing two primers harboring the sites SpeI, BamHI, EcoRV and flanked by EcoRI/PacI overhangs. The plasmid pUC consisting of the candidate gene socs2 fused to CFP via T2A sequence flanked by EcoRI/PacI sites was synthesized from GenScript. Primers were designed such that the EcoRI site was destroyed in the process. ins:MCS2;cryaa:RFP and the plasmid pUC-CFP-T2A-socs2 were subsequently digested with EcoRI/PacI to yield compatible fragments, which were ligated together to yield the final construct. The entire construct was flanked with I-SceI sites to facilitate transgenesis. Same process as described above was used for generating ins:CFP-T2A-spry4;cryaa:RFP construct.
To generate ins:CFP-T2A-rapgef4;cryaa:RFP, a plasmid pUC consisting of rapgef4 flanked by SpeI/PacI sites was synthesized from GenScript. ins:CFP-T2A-socs2;cryaa:RFP and the plasmid pUC-rapgef4 were subsequently digested with SpeI/PacI to yield compatible fragments, which were ligated together to yield the final construct.
Analysis of proliferation using mosaic integration in the genome
Request a detailed protocolFor counting beta-cells in Tg(ins:FUCCI-G1);Tg(ins:FUCCI-S/G2/M) with mosaic expression of candidate genes, the ‘spots’ function of Imaris (Bitplane) was used after thresholding. The total number of CFP-positive red cells and CFP-negative red cells in the entire islet spanning all stacks were calculated. All the Tg(ins:FUCCI-S/G2/M)-positive cells were counted manually for CFP-positive and CFP-negative beta-cells.
Tissue collection and sectioning
Request a detailed protocolTo facilitate confocal imaging of the islet, the pancreas was dissected from the gut (juvenile and adults) after fixation. Fish were killed in Tricaine prior to dissection of gut, and the samples immersed in 4% paraformaldehyde for 48 hr at 4°C. The pancreas was then manually dissected and washed multiple times in PBS.
For cryo-sectioning, the tissue was then immersed in 20% sucrose solution overnight at 4°C. The tissue was then embedded in 20% sucrose +7.5% gelatin solution in cryo-molds on dry ice and sectioned at 14 μm in thickness with Leica cryostat.
Cell counting
Request a detailed protocolTotal number of beta-cells in the islets were counted using Imaris (Bitplane). For counting beta-cells in Tg(ins:FUCCI-G1);Tg(ins:FUCCI-S/G2/M), the ‘spots’ function of Imaris, with appropriate thresholding, was used to count all the red cells in stacks spanning the entire islet. All the proliferating cells (green only) were counted manually. This approach enabled us to quantify the percentage of proliferating beta-cells in the whole islet.
EdU labeling
Request a detailed protocolTo label proliferating cells, 3 mpf fish were placed in 2 mM EdU on 2 consecutive nights, and then placed back in system water with normal feeding during each day. The fish were then killed, the gut was fixed and the pancreas was sectioned as described above. The tissue sections were washed 3 × 10 min with PBS, and EdU detection was performed according to the kit protocol Click- iT EdU Alexa Fluor 647 Imaging Kit (C10340 Fisher Scientific). GFP and insulin staining was performed at the concentrations described below.
Immunofluorescence and image acquisition
Request a detailed protocolImmunofluorescence was performed on pancreas sections prepared as described above. Antigen retrieval was carried out prior to anti-PCNA staining by treating the sections with 10 mM citrate buffer (pH = 6) for 10 mins at 90°C. The sections were permeabilized in 1% PBT (TritonX-100) and blocked in 4% PBTB (BSA). Primary and secondary antibody staining was performed overnight at 4°C. Primary antibodies used in this study were anti-insulin (guinea pig, Dako A0564) at 1:200, anti-EGFP (chicken, abcam ab13970) at 1:500, anti-PCNA (mouse, Dako, M0879) at 1:500, and anti-L-plastin (rabbit, Biozol LS-C210139-250) at 1:1000. Secondary antibodies used in this study were Alexa Fluor 568 and Alexa Fluor 488 anti-guinea pig (1:300), Alexa Fluor 647 anti-rabbit and anti-mouse (1:300) and Alexa Fluor 488 anti-chicken (1:300). Samples were mounted in Vectashield and imaged using a Zeiss LSM 780.
GCAMP6s image acquisition and analysis
Request a detailed protocolTo monitor the changes in glucose-stimulated calcium influx during development, GCAMP6s measurements were performed on isolated islets from Tg(ins:gCaMP6s; cryaa:mCherry);Tg(ins:Renilla-mKO2; cryaa:CFP) double-transgenic animals at 3 mpf. Freshly dissected islets were washed with HBSS containing Ca2+/Mg2+ (Life technologies, 14175095) twice and embedded in fibrin gels (3:1 ratio of 10 mg/ml Bovine fibrinogen, 50 U/ml Bovine thrombin; Sigma Aldrich, Germany). Upon polymerization, islets were immersed in HBSS containing 2.5 mM glucose and imaged using live confocal microscopy (LSM-780 FLIM inverse) to establish the baseline.
Fluorescent intensity analysis
Request a detailed protocolNormalized GFP fluorescent intensity of insulin-positive cells on pancreatic islet sections was measured using Fiji (Schindelin et al., 2012). An insulin-positive cell was first located by going through individual sections in the confocal z-stack. The optical section containing the largest area of the nucleus was chosen as the center of the cell. A region-of-interest (ROI) was drawn around the nucleus and the fluorescence intensity of the GFP and DAPI channels were recorded. The normalized GFP intensity was calculated as a ratio of mean GFP intensity and mean DAPI intensity for each ROI. For EdU or PCNA intensity measurements, mean grey intensity value for the EdU or PCNA channel was calculated along with the GFP and DAPI channels in each ROI created at the center of a cell, as described above. To discriminate between GFPhigh and GFPlow cells, a threshold was set for each islet individually. The threshold (GFPtotal) was calculated as the average normalized GFP intensity of all the images belonging to one islet. Threshold for determining EdU or PCNA-positive cells was set by eye.
The GFP fluorescence intensity of the secondary islets in Tg(NF-kB:GFP) animals was calculated with the Imaris software by using the surface function. Surfaces were rendered for each secondary islet using the same threshold. The mean GFP fluorescence intensity and volume within these surfaces was recorded. The GFP fluorescence was normalized to the volume of the secondary islets.
Cell culture of sorted beta-cells
Request a detailed protocolBeta-cells were dissociated from 3 mpf Tg(NF-kB:GFP);Tg(ins:mCherry) islets and FAC-sorted. The single beta-cells were sorted into a 384-well plate, containing the final cell-culture media (50% L-15 (Gibco, 11415–049), 50% DMEM (Gibco, 31966–021), 10% FBS (Gibco, 10500–064) and 1x antibiotics (Sigma, A5955)). The plates were incubated in a cell-culture incubator at 27°C with 5% CO2. Individual beta-cells were imaged using Zeiss LSM-780 inverse confocal microscope. The GFP fluorescence intensity was measured using the ROI function of Fiji as described above.
FACS and gene profile analysis
Request a detailed protocolFor RNA-Seq, RT-qPCR and NF-kB population analysis, beta-cell isolated from islets were sorted and analyzed using FACS-Aria II (BD Bioscience). For dissociation, islets were collected in PBS chilled on ice. After one washing with ice cold PBS, islets were dissociated into single cells by incubation in TrypLE (ThermoFisher, 12563029) with 0.1% Pluronic F-68 (ThermoFisher, 24040032) at 37°C in a benchtop shaker set at 350 rpm for 50 min. Following dissociation, TrypLE was inactivated with 10% FBS, and the cells pelleted by centrifugation at 500 g for 10 min at 4°C. The supernatant was carefully discarded and the pellet re-suspended in 500 µl of HBSS (without Ca2+, Mg2+)+0.1% Pluronic F-68. To remove debris, the solution was passed over a 30 µm cell filter (Miltenyi Biotec, 130-041-407).
For RNA-Sequencing, total RNA was extracted from FACS sorted beta-cells using Quick-RNA MicroPrep kit (R1050 Zymo Research). Sequencing was performed on llumina HiSeq2500 in 2 × 75 bp paired-end mode. Reads were splice-aligned to the zebrafish genome, GRCz10, using GSNAP and known splice sites from Ensembl gene annotation, version 81. FeatureCounts was used to assign reads to exons thus eventually getting counts per gene. EdgeR package of R (Robinson et al., 2010) was used to perform differential analysis between samples. Across-samples normalization was performed using the TMM normalization method.
For single-cell RT-qPCR, cDNA was synthesized with Quanta qScript TM cDNA Supermix directly on cells. Total cDNA was pre-amplified for 16 cycles (1 × 95°C 8’, 18x (95°C 45’’, 49°C* 1.30’, 72°C 1.5’) 1 × 72°C 7’) (* with 0.3°C increment/cycle) with the QIAGEN Multiplex PCR Plus Kit (Qiagen) in a final volume of 35 µl in the presence of primer pairs (Supplementary file 2, 25 nM final for each primer). Pre-amplified DNA (10 µl) was treated with 1.2 U Exonuclease I and expression quantified by real time PCR on the BioMark HD System (Fluidigm Corporation, CA) using the 96.96 Dynamic Array IFC and the GE 96 × 96 Fast PCR +Melt protocol and SsoFast EvaGreen Supermix with Low ROX (BIO RAD, CA) with 5 µM primers (described above) for each assay. Raw data was analyzed using the Fluidigm Real-Time PCR analysis software.
For bulk RT-qPCR gene expression profiling, 1000 GFPhigh and GFPlow cells were sorted into 5 µl EB Buffer (Qiagen) containing 0.3% IGEPAL and 0.1% BSA and immediately snap frozen. The cells were then thawed and incubated on ice for 10’. cDNA was synthesized with Quanta qScript TM cDNA Supermix directly on cells in a final volume of 30 µl. 15 µl of cDNA was pre-amplified for 12 cycles (1 × 95°C 1’, 95°C 15’’, 60°C 1’, 72°C 1.5’) and 1 × 72°C 10’ with the TATAA GrandMaster Mix (TATAA Biocenter, Göteborg, Sweden) in a final volume of 35 µl in the presence of primer pairs for the following genes: ins, cish, spry4, trib3, rapgef4, ef1a, bact2, rpl13, tnfa, tnfrsf1b, socs23 (25 nM final for each primer). 1.2 µl pre-amplified cDNA was used for quantification by real time PCR on the LightCycler480 (Roche, Switzerland) using SYBR Premix Ex Taq TM (Tli RNaseH Plus) (Takara BIO USA, INC.) and 0.2 nM of each primer in a volume of 10 µl using the following cycling program: initial denaturation 95°C 30’’, amplification 45x (95°C 5’’, 60°C 30’’) and melting curves 1x (95°C 5’’, 60°C 1’, ramp to 95°C (ramping rate 0.11)) followed by 30’’ cooling at 50°C. Raw data was analyzed using the LightCycler480 analysis software.
For analysing the levels of NF-kB:GFP by FACS, dissociated cells were incubated in 30 µM solution of TSQ (N-(6-Methoxy-8-Quinolyl)-p-Toluenesulfonamide) (ThermoFisher, M-688) for 20 mins to label beta-cells. The cells were pelleted by centrifugation at 500 g for 10 min at 4°C. The supernatant was carefully discarded and the pellet re-suspended in 500 µL of HBSS (without Ca, Mg)+0.1% Pluronic F-68. To remove debris, the solution was passed over a 30 µm cell filter (Miltenyi Biotec, 130-041-407) and proportion of NF-kB:GFPhigh and NF-kB:GFPlow cells were analyzed by FACS.
For correlation analysis of GFP fluorescence intensity with GFP mRNA, beta-cells from 3 mpf Tg(ins:mCherry);Tg(NF-kB:GFP) animals were dissociated as described above. Single beta-cells were sorted into 96-well plates using the index sort function of Aria II. This allowed us to record the GFP fluorescence intensity of each sorted beta-cell. Single-cell RT-qPCR was performed on the FAC-sorted cells for GFP and b-actin1 mRNA as described above.
Analysis of single-cell RT-qPCR data
Request a detailed protocolSingle-cell RT-qPCR data was obtained from Fluidigm as Ct values of gene expression per cell. The Fluidigm assay performs 40 cycles of amplification. If the fluorescence signal from RT-qPCR does not cross threshold after 40 cycles, then the gene is considered to be ‘not detected’, and set as Ct = 40 (McDavid et al., 2013). A gene was classified as ‘detected’ for the value of Ct <40 in a given cell (McDavid et al., 2013). Pre-analysis cleanup of the RT-qPCR data was performed by removing cells with undetected values (Ct = 40) for the house keeping genes b-actin1, ef1α or rpl13α. For the beta-cells from 3 mpf and 1 ypf animals, the proportion of cells with detectable candidate gene expression was calculated as:
Significance testing for differences in proportion of cells with detectable gene expression was performed using Pearson’s Chi-Square test. The Ct values were -log10 transformed for representation purpose, such that -log10(40)~−1.6 is considered undetectable gene expression level.
Statistical analysis
Request a detailed protocolNo statistical methods were used to predetermine sample size. The experiments were not blinded. Graphs were plotted using R. Statistical analysis was performed using R and Microsoft Excel. Values were compared using unpaired Students t-test or ANOVA as indicated for each experiment. p-Values of <0.05 were considered statistically significant. Data are expressed as mean ±standard deviation (SD) unless otherwise specified.
Source data
Request a detailed protocolThe raw files and raw count table from deep sequencing can be accessed at GEO with accession number GSE106938.
Data availability
-
Age-related Islet Inflammation Marks the Proliferative Decline of Pancreatic Beta-cells in ZebrafishPublicly available at the NCBI Gene Expression Omnibus (accession no: GSE106938).
References
-
Conditional targeted cell ablation in zebrafish: a new tool for regeneration studiesDevelopmental Dynamics 236:1025–1035.https://doi.org/10.1002/dvdy.21100
-
Human islets contain four distinct subtypes of β cellsNature Communications 7:11756–11759.https://doi.org/10.1038/ncomms11756
-
The islet-resident macrophage is in an inflammatory state and senses microbial products in bloodThe Journal of Experimental Medicine 214:2369–2385.https://doi.org/10.1084/jem.20170074
-
Beta Cell Hubs Dictate Pancreatic Islet Responses to GlucoseCell Metabolism 24:389–401.https://doi.org/10.1016/j.cmet.2016.06.020
-
Regulation of pancreatic beta-cell mass and proliferation by SOCS-3Journal of Molecular Endocrinology 35:231–243.https://doi.org/10.1677/jme.1.01840
-
Characterization of zebrafish larval inflammatory macrophagesDevelopmental & Comparative Immunology 33:1212–1217.https://doi.org/10.1016/j.dci.2009.07.003
-
Metabolic regulation of cellular plasticity in the pancreasCurrent Biology 23:1242–1250.https://doi.org/10.1016/j.cub.2013.05.037
-
The role of inflammation in β-cell dedifferentiationScientific Reports 7:1–10.https://doi.org/10.1038/s41598-017-06731-w
-
Significant human beta-cell turnover is limited to the first three decades of life as determined by in vivo thymidine analog incorporation and radiocarbon datingThe Journal of Clinical Endocrinology & Metabolism 95:E234–E239.https://doi.org/10.1210/jc.2010-0932
-
Fiji: an open-source platform for biological-image analysisNature Methods 9:676–682.https://doi.org/10.1038/nmeth.2019
-
Changes in regenerative capacity through lifespanInternational Journal of Molecular Sciences 16:25392–25432.https://doi.org/10.3390/ijms161025392
Article and author information
Author details
Funding
Horizon 2020 Framework Programme (Research and Innovation programme 715884)
- David J Hodson
DFG-Center for Regenerative Therapies Dresden
- Nikolay Ninov
German Center for Diabetes Research
- Nikolay Ninov
Deutsche Forschungsgemeinschaft
- Nikolay Ninov
European Foundation for the Study of Diabetes
- Nikolay Ninov
The funders had no role in study design, data collection and interpretation, or the decision to submit the work for publication.
Acknowledgements
We thank Max Yun, and members of the Ninov lab for comments on the manuscript, members of CRTD fish, microscopy, Deep Sequencing and FACS facilities for technical assistance. We thank Anne Eugster for assistance with single-cell RT-qPCR and bulk RT-qPCR data. We thank Stephen Renshaw for Tg(NF-kB:GFP) reporter line and Michel Bagnat for TgBAC(tnfα:GFP) reporter line. DJH was supported by a Diabetes UK RD Lawrence (12/0004431) and EFSD/Novo Nordisk Rising Star Fellowships, a Wellcome Trust Institutional Support Award, and an MRC Project Grant (MR/N00275X/1). GAR was supported by Wellcome Trust Senior Investigator (WT098424AIA) and Royal Society Wolfson Research Merit Awards, and by MRC Programmes (MR/J0003042/1 and MR/R022259/1), MRC Project (MR/N00275X/1), Biological and Biotechnology Research Council (BB/J015873/1) and Diabetes UK Project (11/0004210) grants. This project has received funding from the European Research Council (ERC) under the European Union’s Horizon 2020 research and innovation programme (Starting Grant 715884 to DJH). NN is supported by funding from the DFG–Center for Regenerative Therapies Dresden, Cluster of Excellence at TU Dresden and the German Center for Diabetes Research (DZD), as well as research grants from the German Research Foundation (DFG), the European Foundation for the Study of Diabetes (EFSD) and the DZD.
Ethics
Animal experimentation: Experiments were conducted in accordance with the Animal Welfare Act and with permission of the Landesdirektion Sachsen, Germany (AZ 24-9168, TV38/2015, A12/2016, A5/2017).
Copyright
© 2018, Janjuha et al.
This article is distributed under the terms of the Creative Commons Attribution License, which permits unrestricted use and redistribution provided that the original author and source are credited.
Metrics
-
- 4,117
- views
-
- 671
- downloads
-
- 35
- citations
Views, downloads and citations are aggregated across all versions of this paper published by eLife.
Citations by DOI
-
- 35
- citations for umbrella DOI https://doi.org/10.7554/eLife.32965
Download links
A two-part list of links to download the article, or parts of the article, in various formats.
Downloads (link to download the article as PDF)
Open citations (links to open the citations from this article in various online reference manager services)
Cite this article (links to download the citations from this article in formats compatible with various reference manager tools)
Age-related islet inflammation marks the proliferative decline of pancreatic beta-cells in zebrafish
eLife 7:e32965.
https://doi.org/10.7554/eLife.32965


