Age-related islet inflammation marks the proliferative decline of pancreatic beta-cells in zebrafish
- Technische Universität Dresden, Germany
- German Center for Diabetes Research (DZD e.V.), Germany
- Technische Universität Dresden, German Center for Diabetes Reseach (DZD e.V.), Germany
- King’s College London, United Kingdom
- Imperial College London, United Kingdom
- University of Birmingham, United Kingdom
- Institute of Metabolism and Systems Research, University of Birmingham, United Kingdom
Figures
Figure 1 with 1 supplement
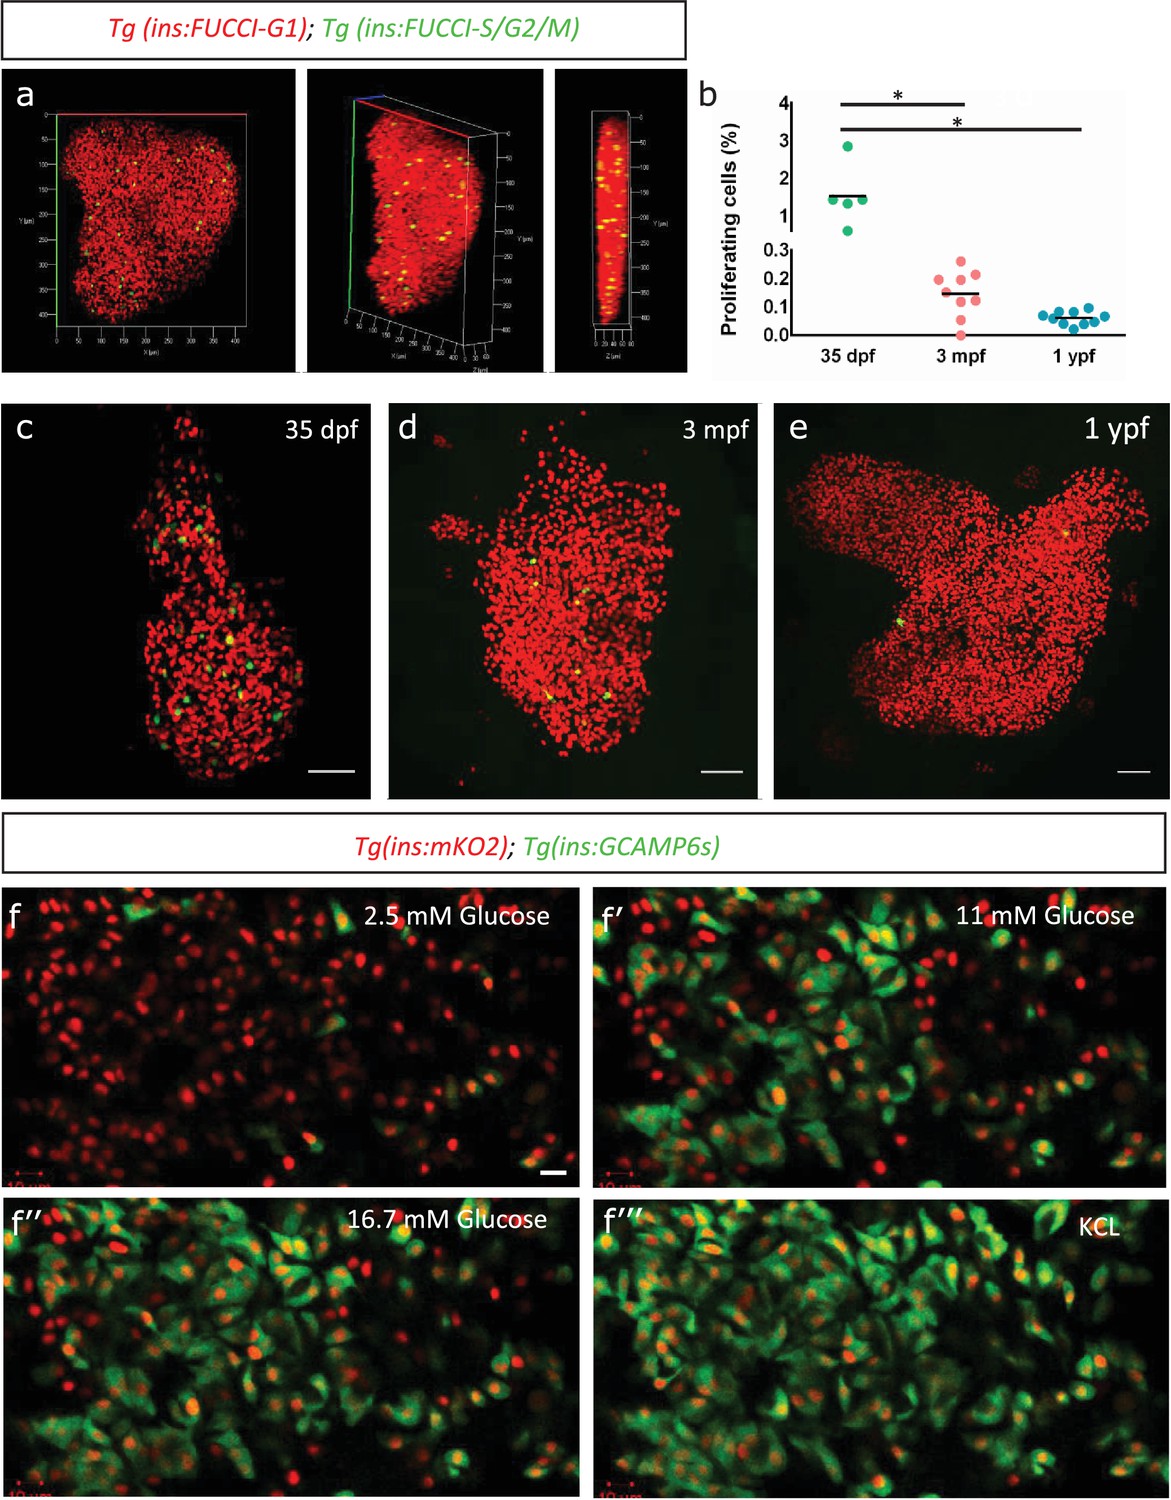
Beta-cell proliferation declines with age.
(a) 3D-rendering of a primary islet from Tg(ins:Fucci-G1);Tg(ins:Fucci-S/G2/M) animals at 3 mpf showing nuclear Tg(ins:Fucci-G1) (red) and Tg(ins:Fucci-S/G2/M) (green) expression. (b) Quantification of percentage of Tg(ins:Fucci-S/G2/M)-positive and Tg(ins:Fucci-G1)-negative (green-only) beta-cells at 35 dpf (n = 5), 3 mpf (n = 9) and 1 ypf (n = 10) animals. Each dot represents one animal. Horizontal bars represent mean values (one-way ANOVA, *p<0.05). (c, d, e) Confocal projection of whole-mount islets from Tg(ins:Fucci-G1);Tg(ins:Fucci-S/G2/M) animals at 35 dpf, 3 mpf and 1 ypf. Anterior to the top. Scale bar 50 µm. (f) Ex vivo live-imaging of beta-cells from Tg(ins:nlsRenilla-mKO2);Tg(ins:GCaMP6s) animals at 3 mpf. Beta-cells (red) were stimulated with 2.5 (basal) mM D-Glucose, (f’) 11 mM D-glucose, (f’’) 16.7 mM D-glucose and (f’’’) depolarized using 30 mM KCl while monitoring GCAMP6s-fluorescence (green). Scale bar 10 µm.
Figure 1—figure supplement 1
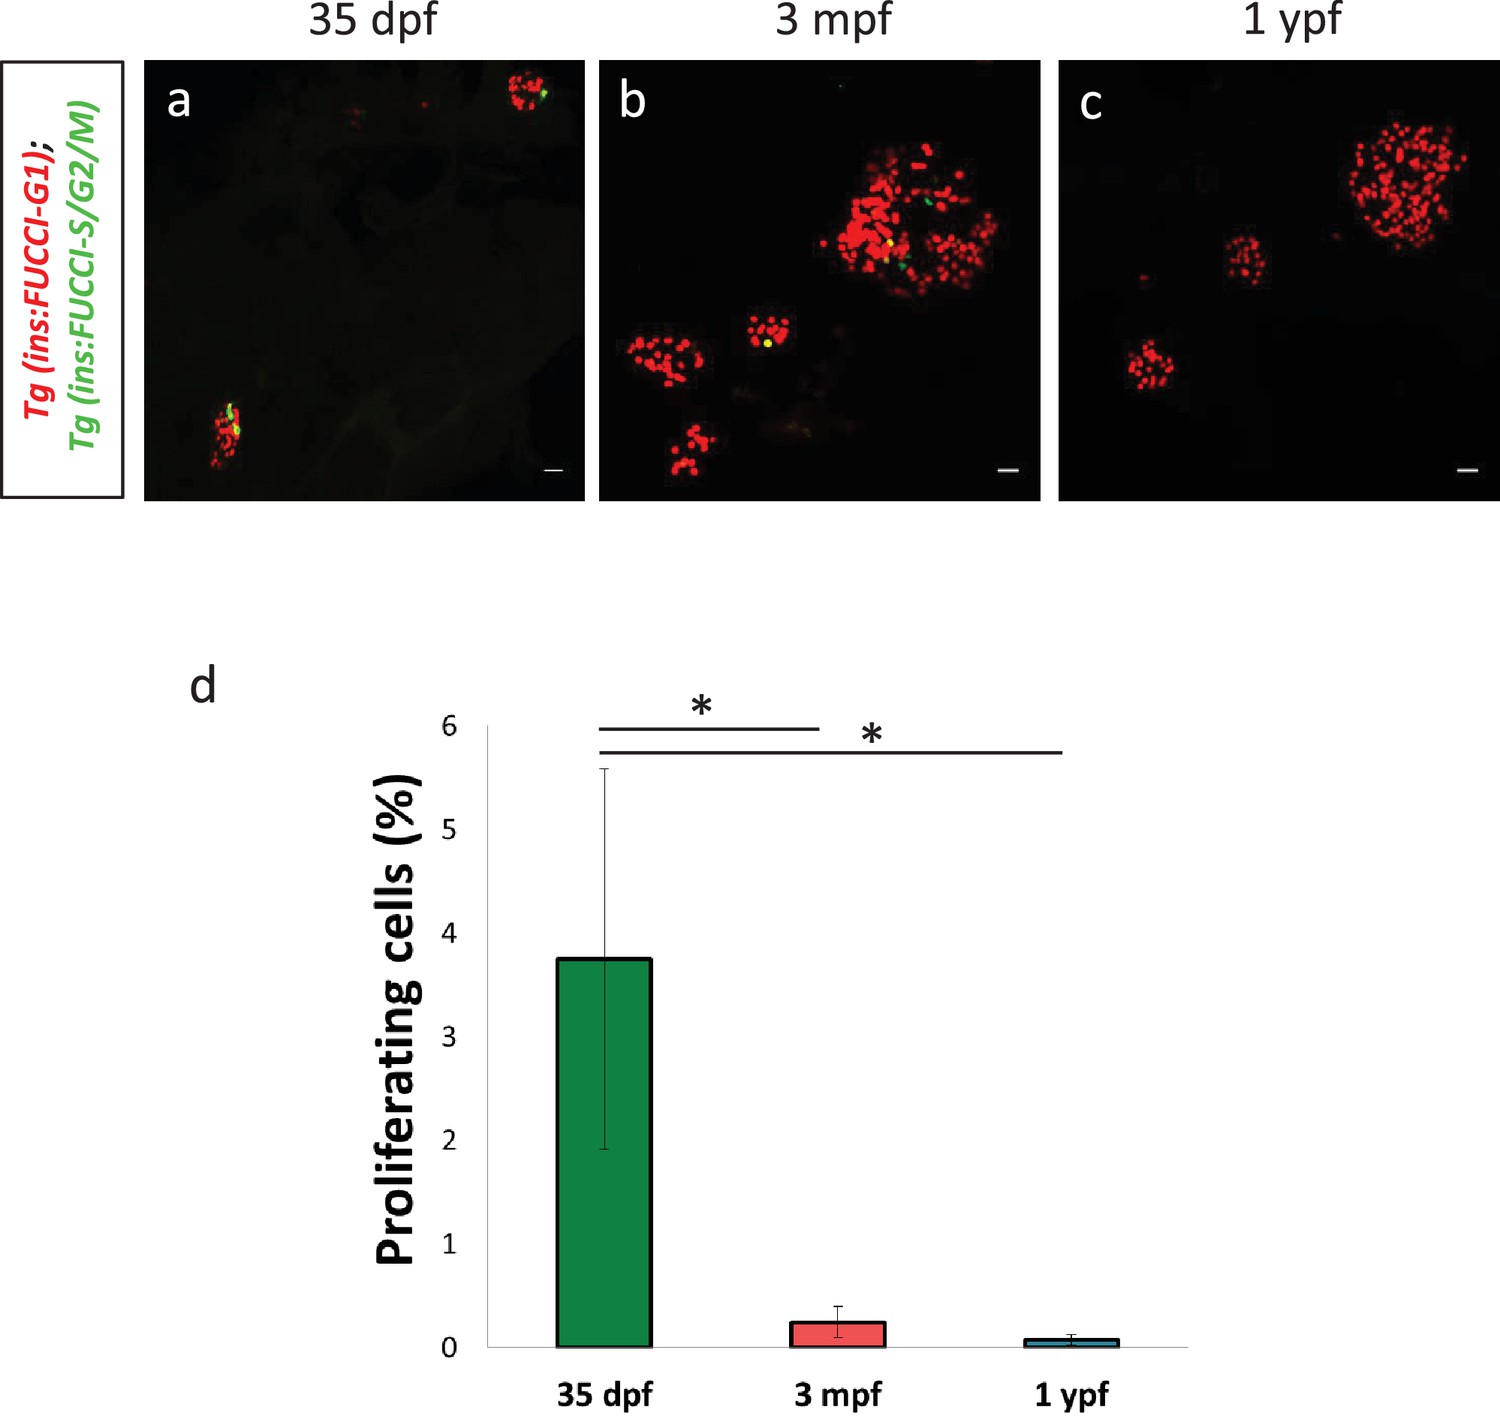
Beta-cell proliferation declines with age in secondary islets.
(a,b) Confocal projection of whole-mount secondary islets from Tg(ins:Fucci-G1);Tg(ins:Fucci-S/G2/M) animals at 35 dpf, 3 mpf and 1 ypf. Scale bar 20 µm. (c) Quantification of percentage of Tg(ins:Fucci-S/G2/M)-positive and Tg(ins:Fucci-G1)-negative (green-only) beta-cells from 35 dpf (n = 8 fish, secondary islets = 16), 3 mpf (n = 8 fish, secondary islets = 70) and 1 ypf (n = 8 fish, secondary islets = 76) animals. Error bars show s.e.m. (one-way ANOVA, *p<0.05).
Figure 2 with 1 supplement

Transcriptome profiling of younger and older beta-cells.
(a) Schematic showing isolation and FAC-sorting of beta-cells from Tg(ins:nlsRenilla-mKO2) animals at 3 mpf and 1 ypf followed by high-throughput mRNA-Sequencing. (a’) Heatmap depicting differentially regulated genes among the beta-cells at 1 ypf and 3 mpf involved in beta-cell proliferation, function and inflammation (asterisks denote genes vaildated by single-cell RT-qPCR). (b) Volcano plot representing the distribution of genes that were differentially regulated in beta-cells from 1 ypf and 3 mpf (1.5-log2fold change, p<0.05). (c) The biological categories of enriched genes in beta-cells at one ypf (1.5-log2fold change, p<0.05) based on literature survey. (c’) Unbiased gene-ontology analysis using DAVID of genes enriched in beta-cells at 1 ypf (p<0.05). (d) Gene expression analysis was carried out using single-cell RT-qPCR. Violin plots denote expression distribution of the candidate genes. The Y-axis shows -log10(Ct) values of transcript levels in single beta-cells. The X-axis shows gene names and the respective developmental stages. The percentage values under each violin plot denote the proportion of beta-cells with detectable transcript levels. The cycle threshold for detectable gene expression was set as Ct = 40. The value −1.6 (-log10(40)) on the Y-axis represents undetectable expression as measured by single-cell RT-qPCR (see Materials and methods). Each dot represents one beta-cell. Significance testing for differences in proportion of cells with detectable gene expression at each stage was performed using Pearson’s Chi-Square test (**p<0.01, ***p<0.001).
Figure 2—figure supplement 1
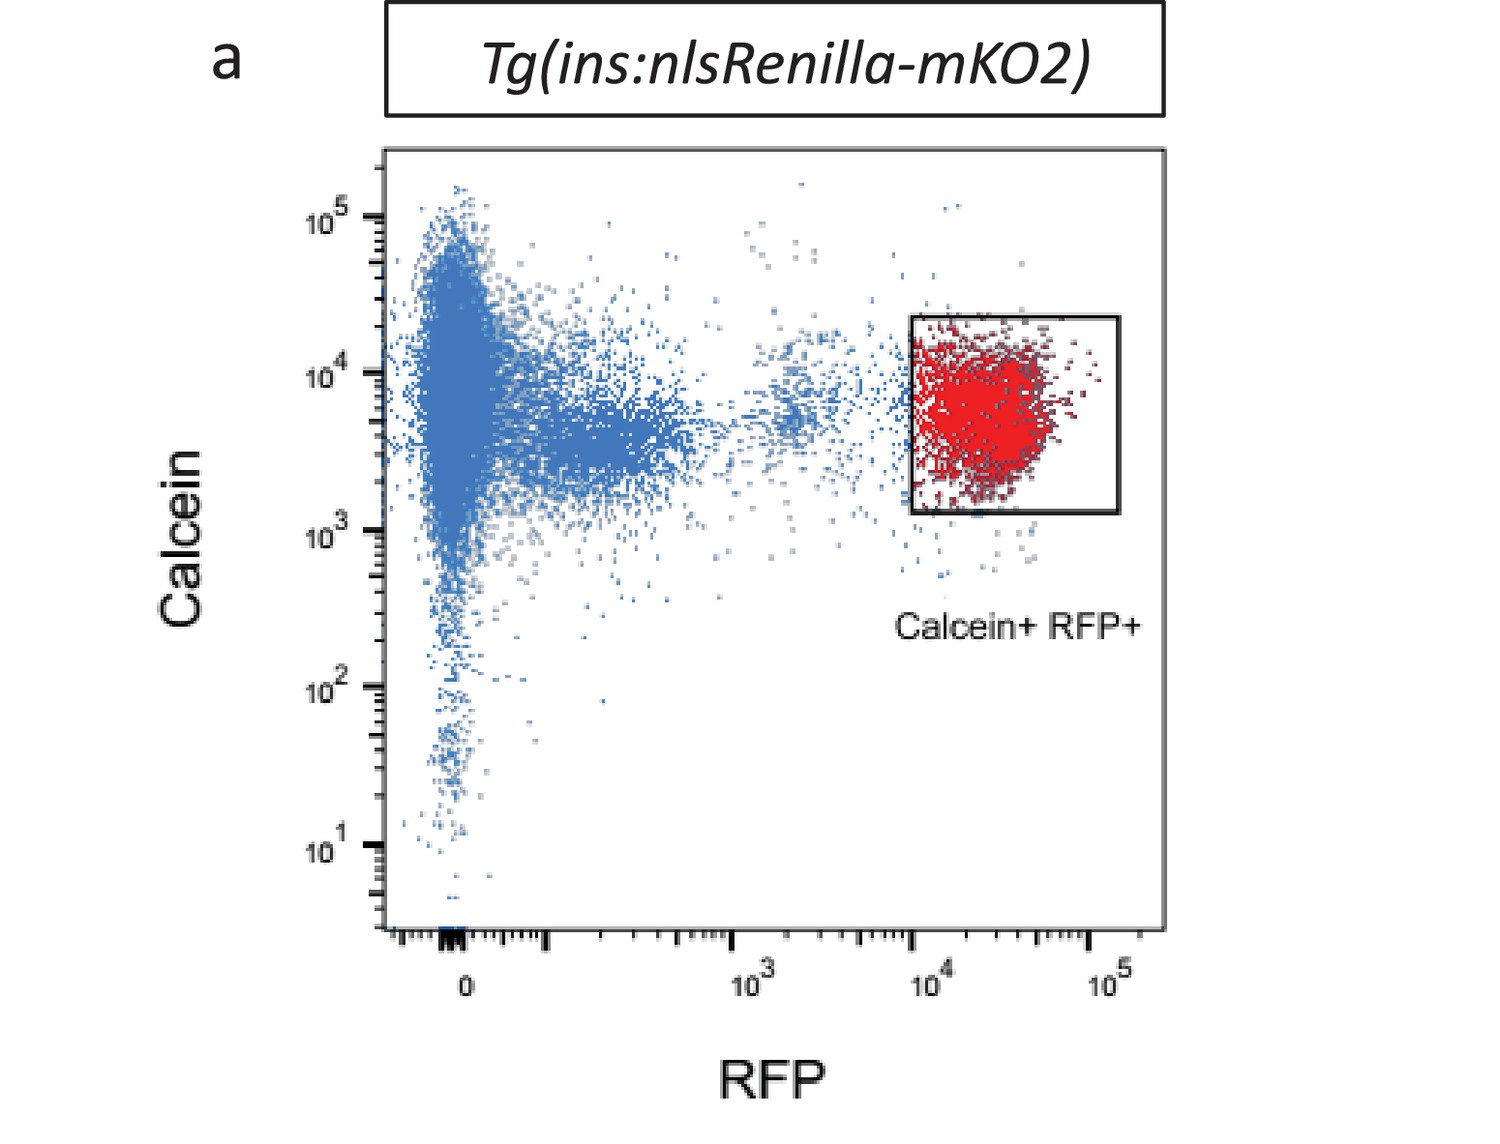
Fluorescent activated cell sorting of beta-cells.
(a) Fluorescent activated cell sorting (FACS) of RFP-positive and calcein-positive beta-cells from Tg(ins:nlsRenilla-mKO2) animals.
Figure 3 with 3 supplements

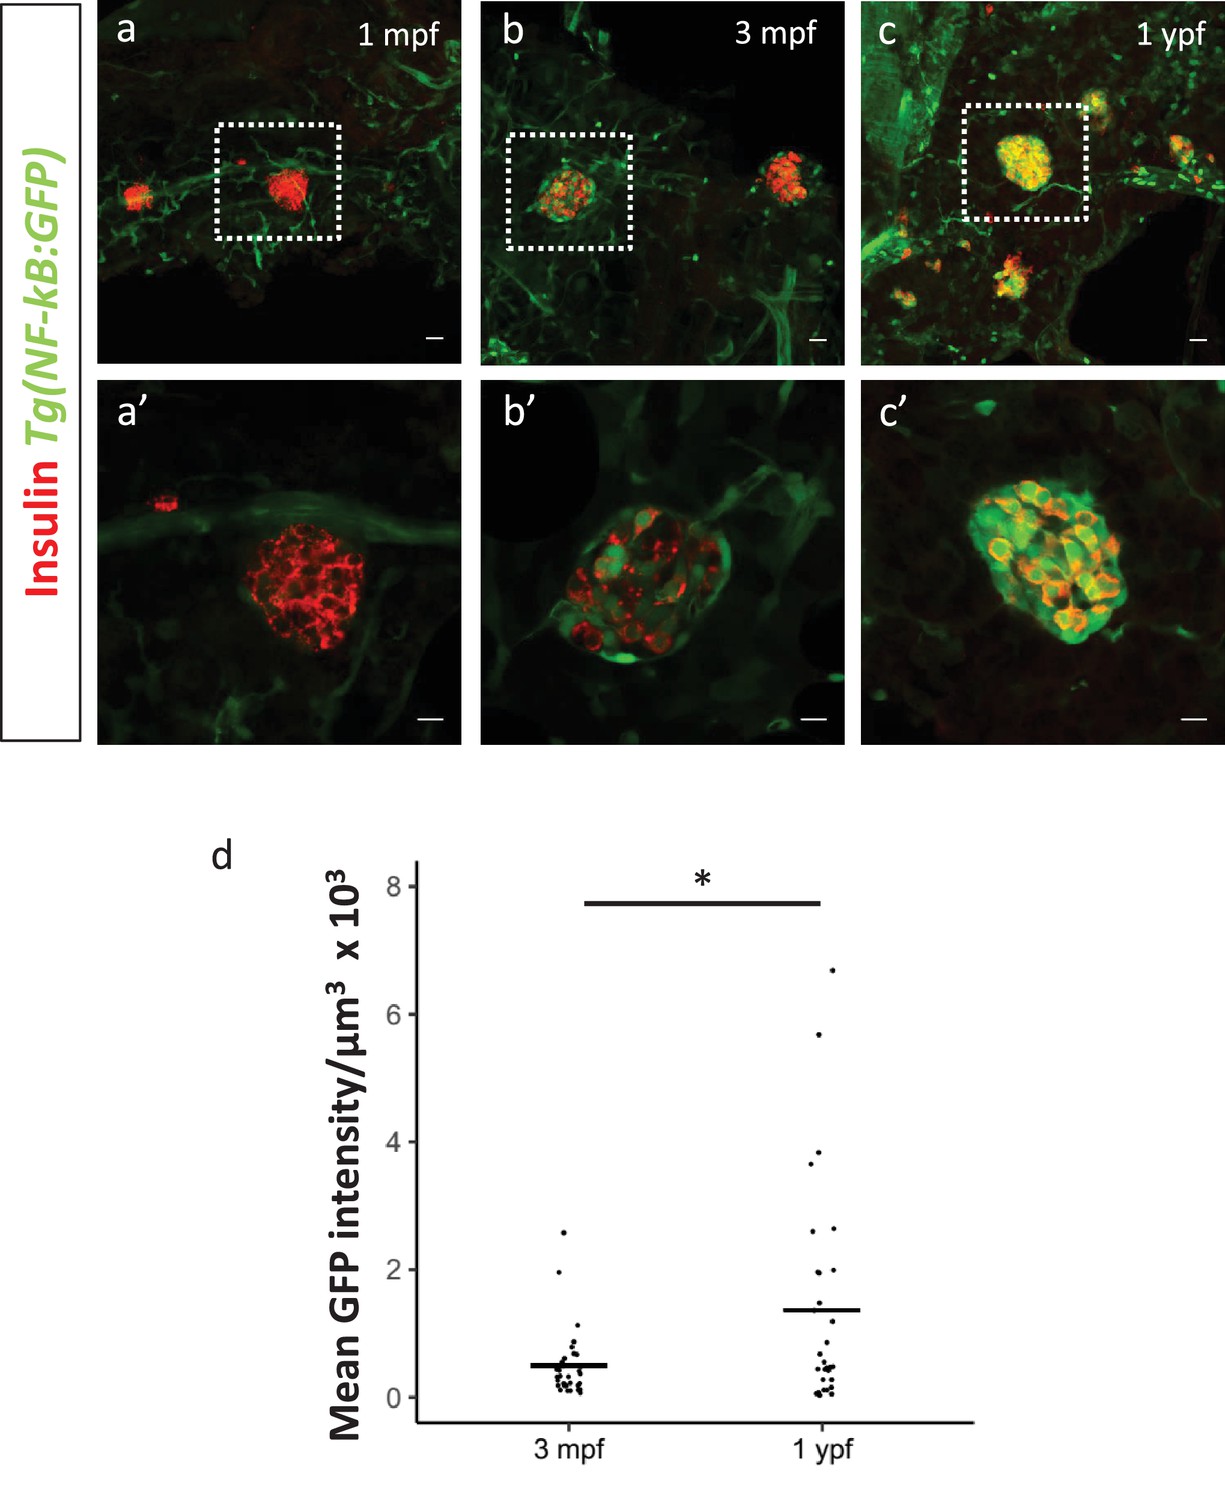
An inflammation reporter reveals heterogeneous activation of NF-kB signaling in beta-cells with age.
(a) The images show single confocal planes from islets of 5 dpf larvae. The tnfrsf1b coding sequence was expressed under the control of the insulin promoter. The plasmid was injected in Tg(NF-kB:GFP) embryos at the one-cell-stage, leading to mosaic and stochastic expression of the construct in beta-cells. The Tg(NF-kB:GFP) reporter expresses GFP (green) under the control of six tandem repeats of NF-kB DNA-binding sites. Beta-cells were labelled using an insulin antibody (red). Arrows indicate GFP-positive beta-cells. Scale bar 5 µm. (b) The graph shows the percentage of GFP-positive and insulin-positive cells in uninjected controls (n = 5) and tnfrsf1b injected animals (n = 6) at 5 dpf. Horizontal bars represent mean values. (c–e) Confocal stack of islets from Tg(NF-kB:GFP) animals at 1 mpf, 3 mpf and 1 ypf. Beta-cells were labeled using an insulin antibody (red). NF-kB:GFP reporter expression is shown in green. Scale bars 20 µm. (c’–e’) Insets show high magnification single planes of the confocal stacks (corresponding to the regions shown using white dotted-lines in the top panels). Scale bar 10 µm. (f–g) Beta-cells from 3 mpf Tg(NF-kB:GFP) animals were labeled with TSQ (Zn2+ labeling dye) and analyzed using FACS. The graph shows GFP intensity (along the X-axis) and the distribution of beta-cells at 3 mpf and 1 ypf. Horizontal lines indicate the division point between GFPlow and GFPhigh levels. Percentage values represent proportion of cells with GFPlow or GFPhigh expression.
Figure 3—figure supplement 1
Activation of NF-kB signaling in beta-cells of the secondary islets with age.
(a,b,c) Confocal stack of secondary islets from Tg(NF-kB:GFP) animals at 1 mpf, 3 mpf and 1 ypf. Beta-cells were labeled using an insulin antibody (red). NF-kB:GFP reporter expression is shown in green. Scale bars 20 µm. (a’,b’,c’) Insets show high-magnification single planes of the confocal stacks corresponding to the regions outlined using white dotted-lines in the top panels. Scale bar 10 µm. (d) Graph showing the total normalized GFP fluorescence intensity of the secondary islets from 3 mpf (n = 9 fish, secondary islets = 32) and 1 ypf (n = 8, secondary islets = 30) animals. Each dot represents one islet (two-tailed t-test, *p<0.05).
Figure 3—figure supplement 2
Fluorescent activated cell sorting of NF-kB:GFPhigh and NF-kB:GFPlow beta-cells.
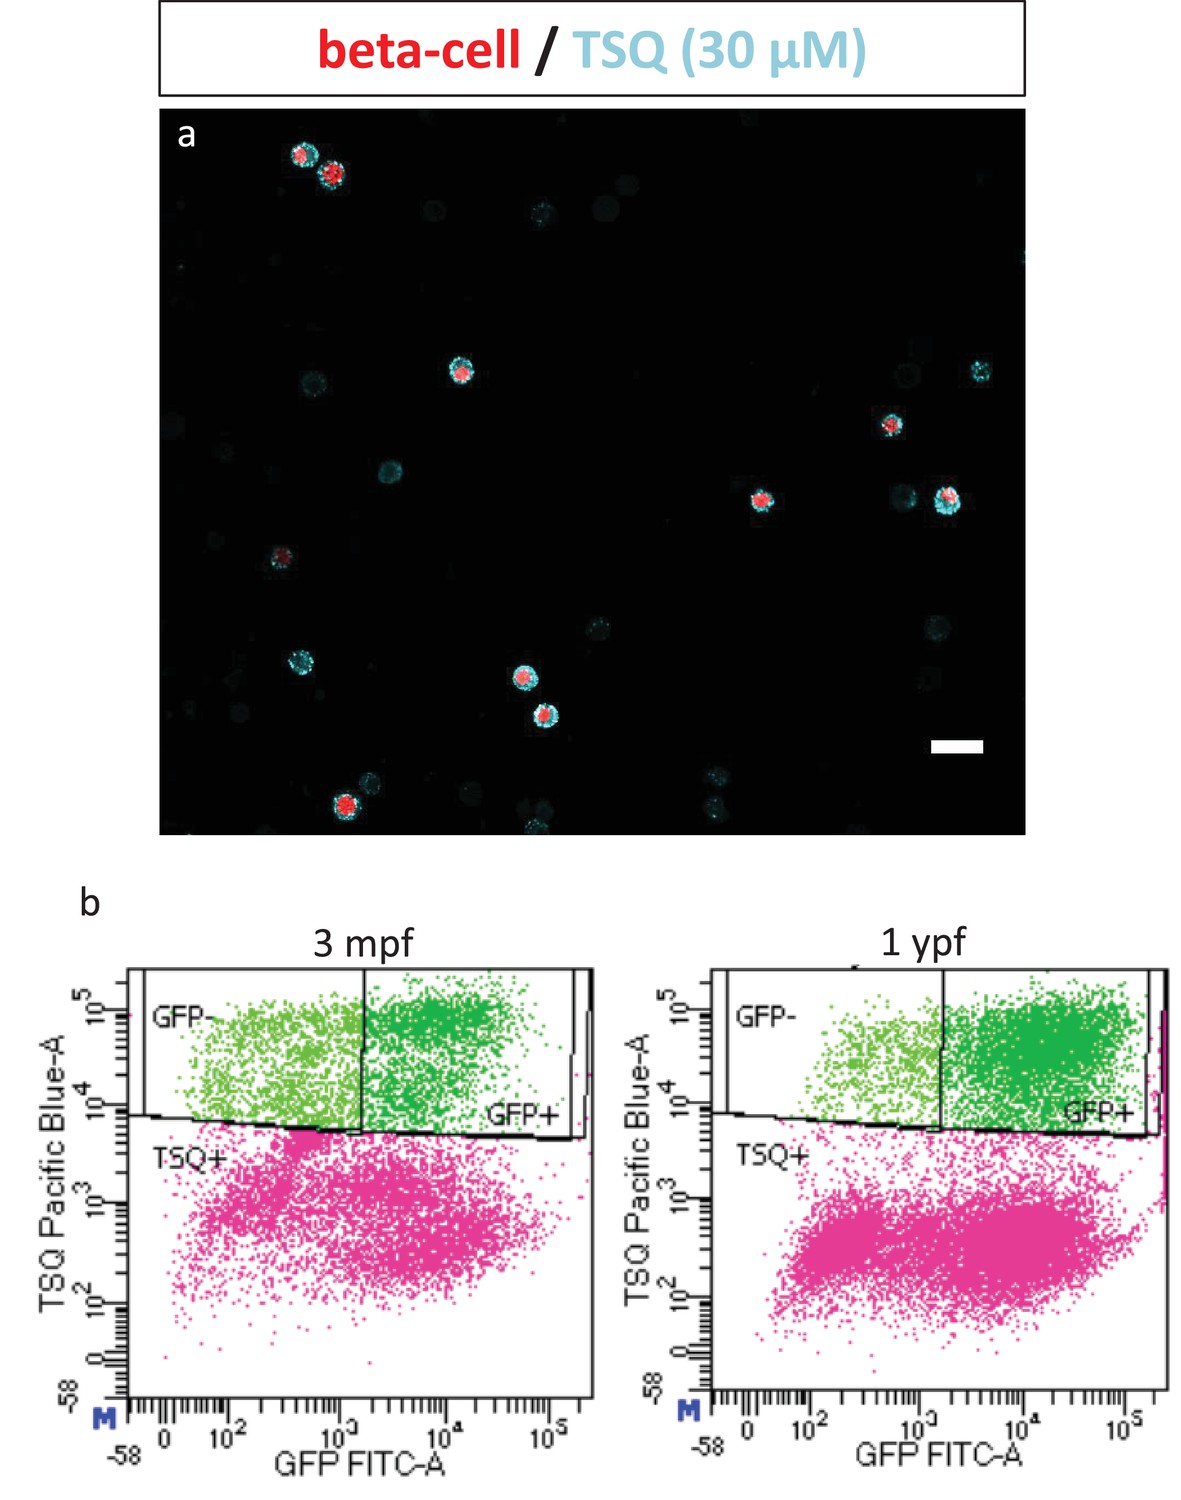
(a) Confocal image of dissociated cells from dissected islets of 3 mpf Tg(ins:nlsRenilla-mKO2) animals that were labeled with TSQ (Zn2+ labeling dye). Islets were incubated with TSQ after dissociation and imaged using a confocal microscope. Beta-cells show RFP expression (red) while cells rich in Zn2+ are labeled with TSQ (cyan). TSQ strongly labels all beta-cells and weakly labels some unknown endocrine cells. (b) Fluorescent activated cell sorting (FACS) of live TSQ-positive GFPhigh and GFPlow cells from Tg(NF-kB:GFP) animals at 3 mpf and 1 ypf. Dead cells were labelled using far-red stain DRAQ7.
Figure 3—figure supplement 3
NF-kB:EGFP mRNA levels in beta-cells increase with age.
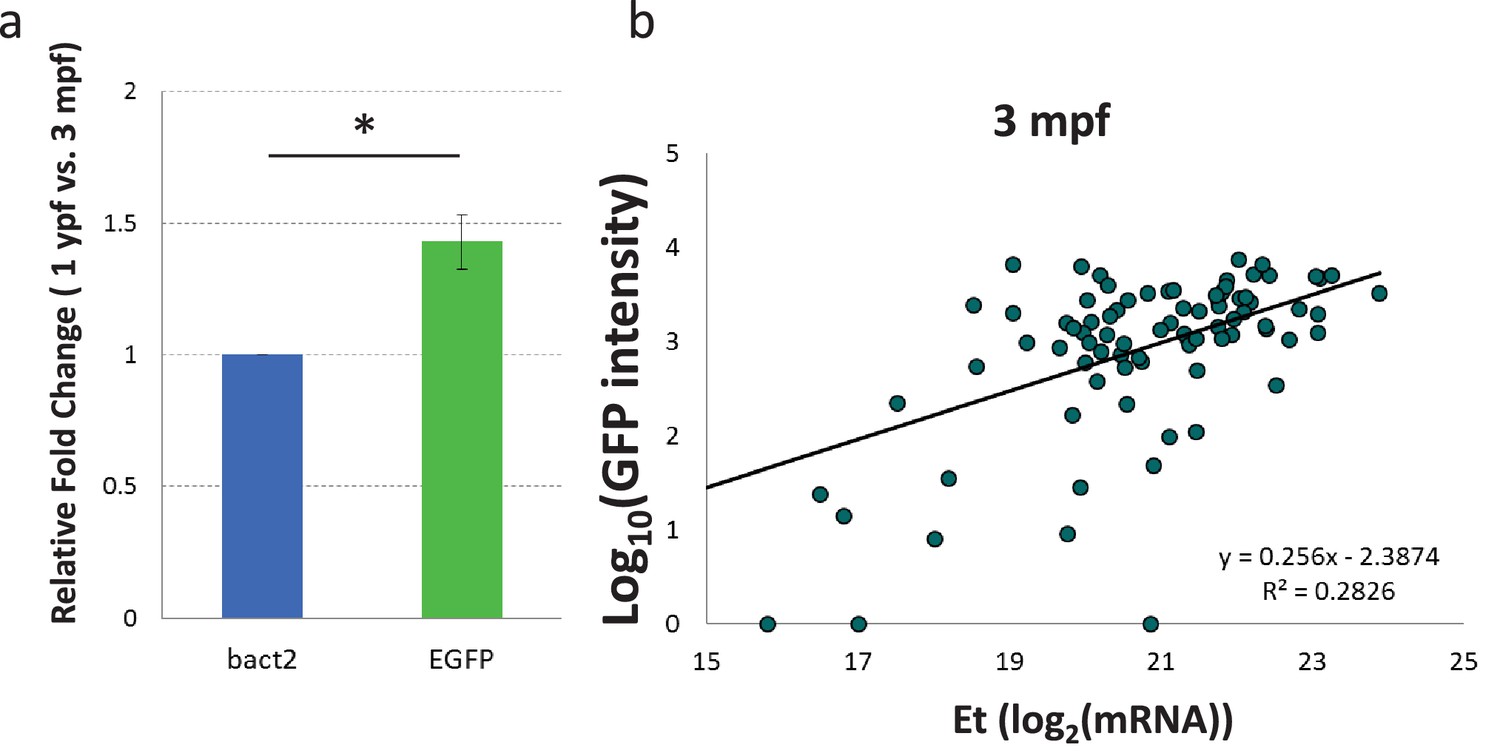
(a) Graph showing the relative fold change increase in EGFP mRNA levels in beta-cells from 1 ypf compared to 3 mpf animals, as measured using RT-qPCR (n=5 biological replicates from three fish each, 1000 cells for each condition). Error bars show SD (two-tailed paired t-test, *p<0.05). (b) The graph shows the fluorescence levels of individual FAC-sorted beta-cells from Tg(nF-kB:GFP);Tg(ins:mCherry) animals as log10(GFP intensity) (along the Y-axis) and Expression threshold (Et) values of GFP mRNA (along X-axis) measured using single-cell RT-qPCR. Line indicates the correlation between GFP fluorescence intensity and GFP-mRNA expression levels in single cells. Each dot represents one beta-cell. R2 = 0.28.
Figure 4 with 1 supplement
Immune cells infiltrate the islet during development and persist throughout adult life.
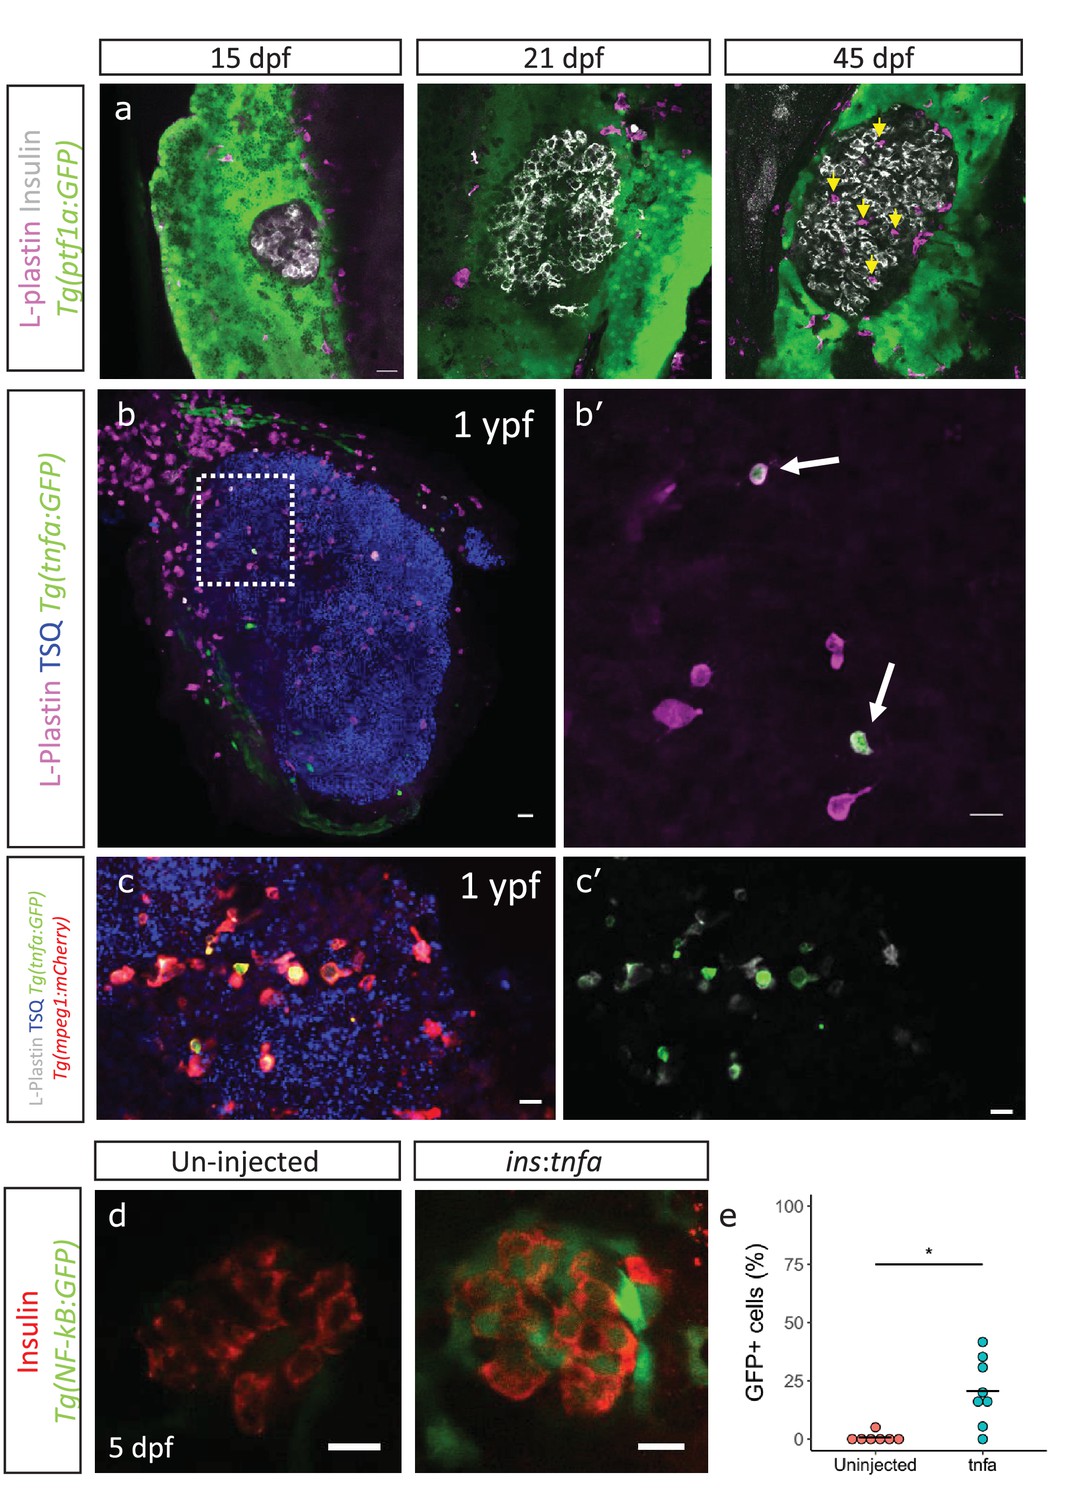
(a) Confocal images of pancreata from 15, 21 and 45 dpf animals. Beta-cells were labeled using an insulin antibody (grey), leukocytes were labeled using an L-plastin antibody (magenta) and Tg(ptf1a:GFP) marks the acinar cells (green). Immune cells are present within the islet at 45 dpf (arrows). (b) Confocal images of whole islets from Tg(tnfα:GFP) animals at 1 ypf. Islets were labeled using TSQ (Zn2+ labeling dye) (blue), leukocytes were labelled with an L-plastin antibody (magenta) and Tg(tnfα:GFP) marks cells expressing tnfα (green). Scale bars 20 µm. (b’) Insets show high-magnification single planes from the confocal stacks (corresponding to the area marked using a white dotted-line in b). Scale bar 10 µm. (c–c’) Confocal image of a one ypf islet showing a single plane. The TgBAC(tnfα:GFP) line marks the tnfα-positive cells (green), whereas Tg(mpeg1:mCherry) marks the macrophages (red). The L-plastin antibody marks all leukocytes (grey) and TSQ (Zn2 +labeling dye) was used to mark the islet (n = 5). Scale bar, 10 µm. (d) Confocal images showing islets at five dpf. The tnfα cDNA was expressed under the insulin promoter. The plasmid was injected in Tg(NF-kB:GFP) embryos at the one-cell-stage and the islets were analyzed at 5 dpf. Beta-cells were labeled with an insulin antibody (red). Tg(NF-kB:GFP) reporter expression is shown in green. (e) The graph shows the percentage of GFP and insulin double-positive cells in un-injected controls (n = 7) and ins:tnfα injected animals (n = 8) at five dpf. Horizontal bars represent mean values (two-tailed t-test, *p<0.05).
Figure 4—figure supplement 1
Immune cells infiltrate the islet during development.
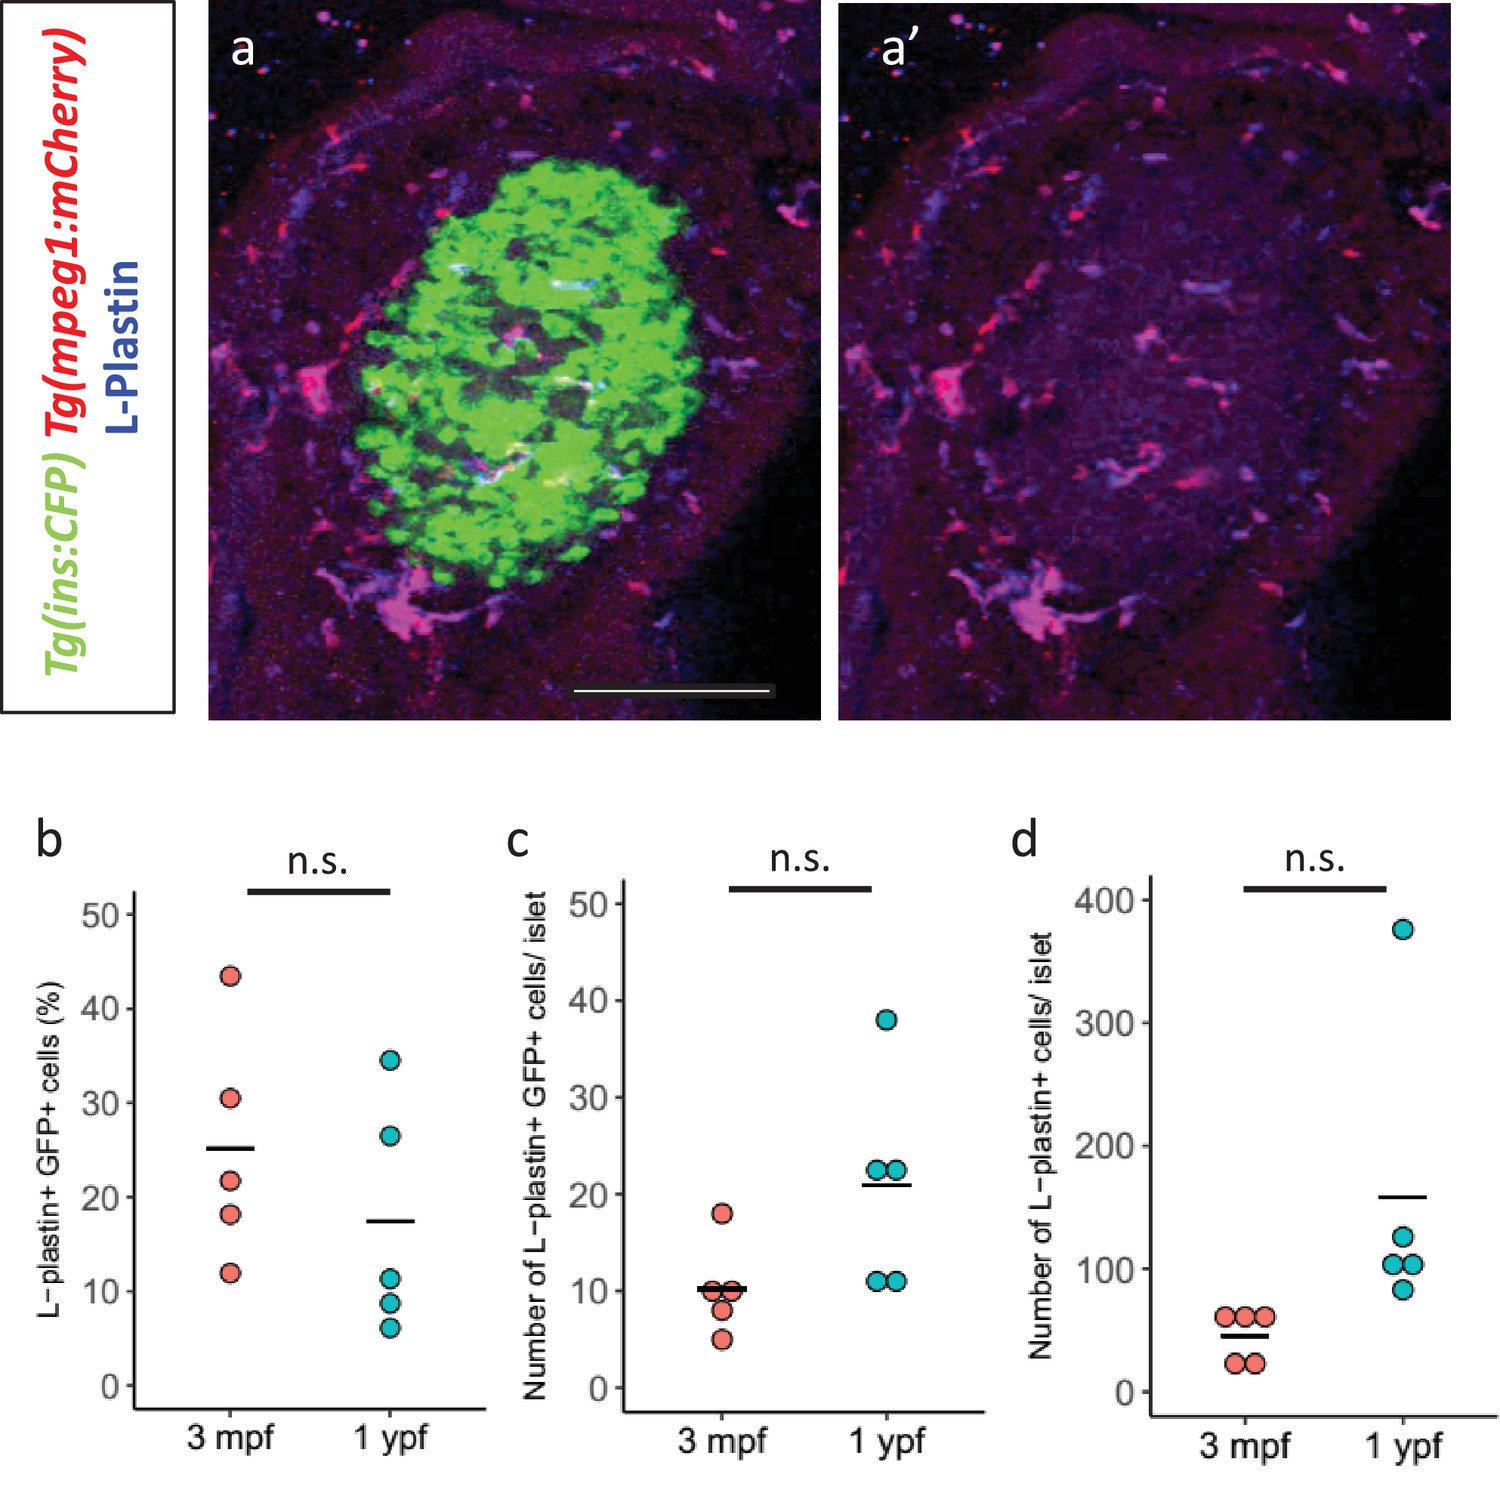
(a,a’) Confocal image of a juvenile islet. Tg(ins:CFP-NTR) line marks the beta-cells with CFP (green), leukocytes were labelled with the L-plastin antibody (blue) and Tg(mpeg1:mCherry) marks the macrophages (red). (b) Quantification of the percentage of TgBAC(tnfa:GFP) and L-plastin double-positive cells over the total number of L-plastin-positive cells in the islets of TgBAC(tnfa:GFP) animals at 3 mpf (n = 5) and 1 ypf (n = 5). Horizontal bars represent mean values (two-tailed t-test, p>0.05). (c) Quantification of the total number of TgBAC(tnfα:GFP)-positive and L-plastin double-positive cells at 3 mpf (n = 5) and 1 ypf (n = 5). Horizontal bars represent mean values (two-tailed t-test, p>0.05). (d) Quantification of the total number of L-plastin positivecells at 3 mpf (n = 5) and 1 ypf (n = 5). Horizontal bars represent mean values (two-tailed t-test, p>0.05).
Figure 5 with 2 supplements
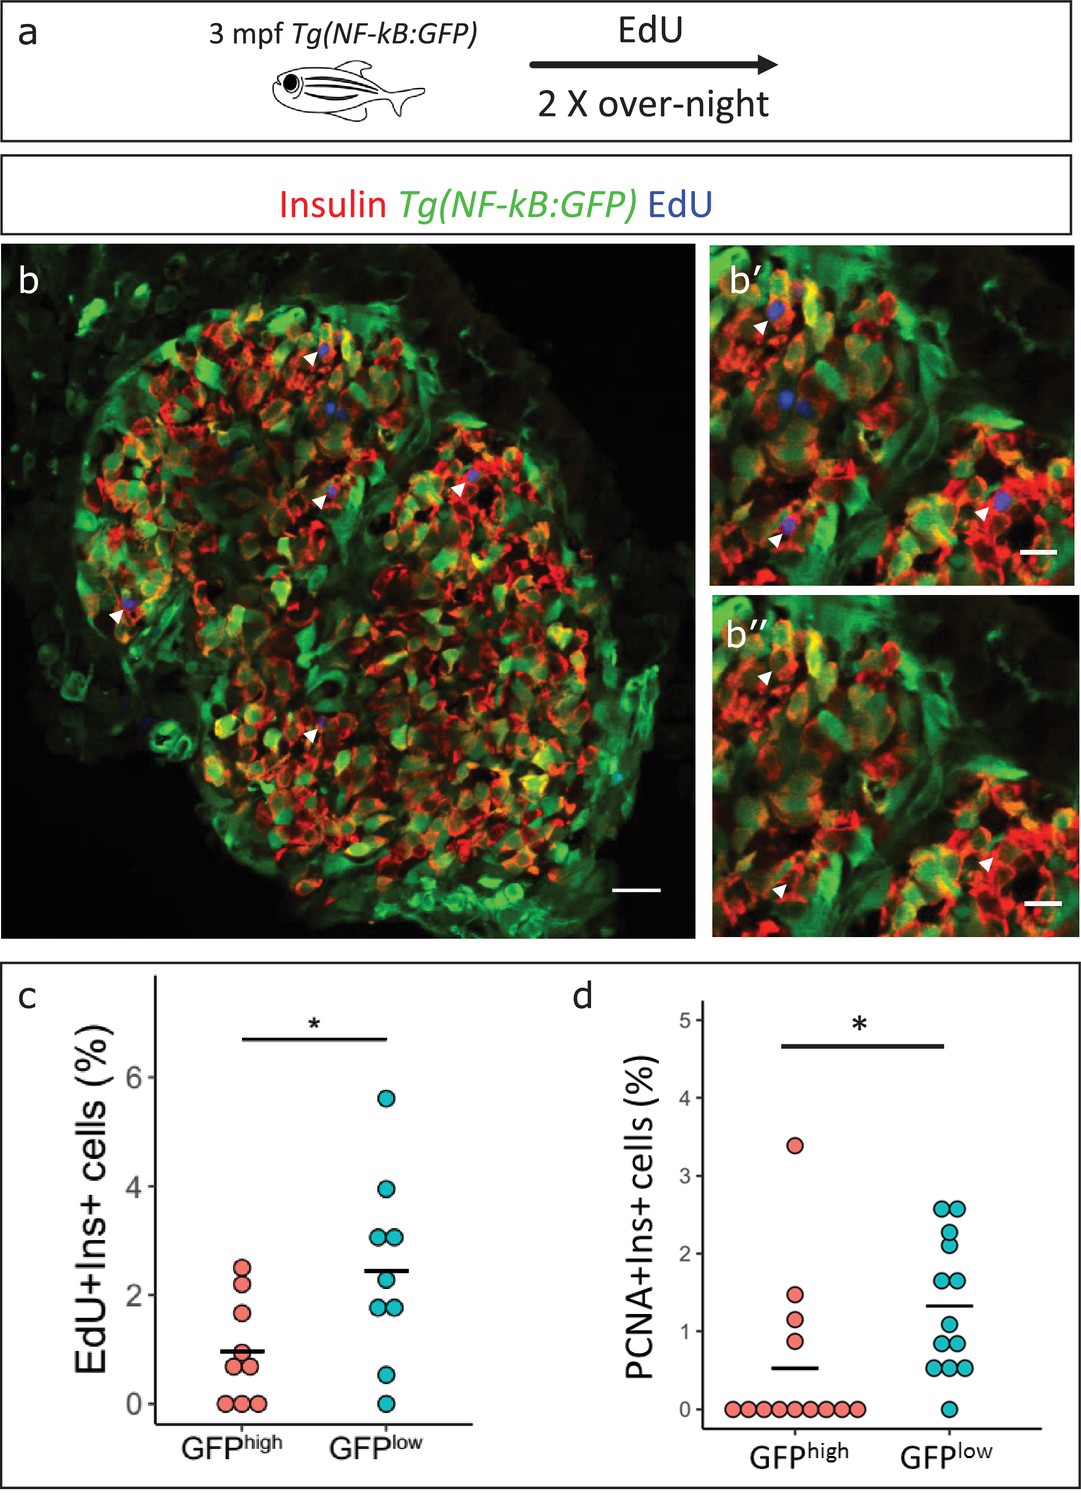
NF-kB:GFPhigh beta-cells proliferate less than their neighbors.
(a) Schematic showing the EdU (5-ethynyl-2′-deoxyuridine) incorporation assay. Tg(NF-kB:GFP) animals were incubated in EdU at 3 mpf for two consecutive nights and fed during each day. (b) EdU incorporation assay was performed to mark the proliferating beta-cells in Tg(NF-kB:GFP) animals at 3 mpf. The confocal image (single plane) shows an overview of a section through the islet. Beta-cells were labeled with an insulin antibody (red), a GFP antibody (green) and EdU (blue). Arrowheads point to EdU-positive beta-cells. (b’–b’’) The insets show higher magnification images with and without the EdU channel. EdU incorporation can be observed in some of the GFPlow cells (white arrow-heads). (c) An insulin-positive cell was first located by going through individual sections in the confocal z-stack. The optical section containing the largest area of the nucleus was chosen as the center of the cell. A region-of-interest (ROI) was drawn around the nucleus and the fluorescence intensities of the GFP and DAPI channels were recorded. The normalized GFP intensity was calculated as a ratio of mean GFP intensity and mean DAPI intensity for each ROI. The average total normalized GFP-intensity of each islet was set as a threshold for dividing the cells into GFPhigh and GFPlow populations. The graph shows the percentage of EdU and insulin double-positive cells among the GFPhigh and GFPlow populations. Each dot represents one islet (n = 9). Horizontal bars represent mean values (two-tailed t-test, *p<0.05). (d) The graph shows the percentage of PCNA and insulin double-positive cells among the GFPhigh and GFPlow populations. Each dot represents one islet (n = 13). Horizontal bars represent mean values (two-tailed t-test, *p<0.05). See also Figure 5—figure supplement 2 for representative PCNA antibody staining.
Figure 5—figure supplement 1
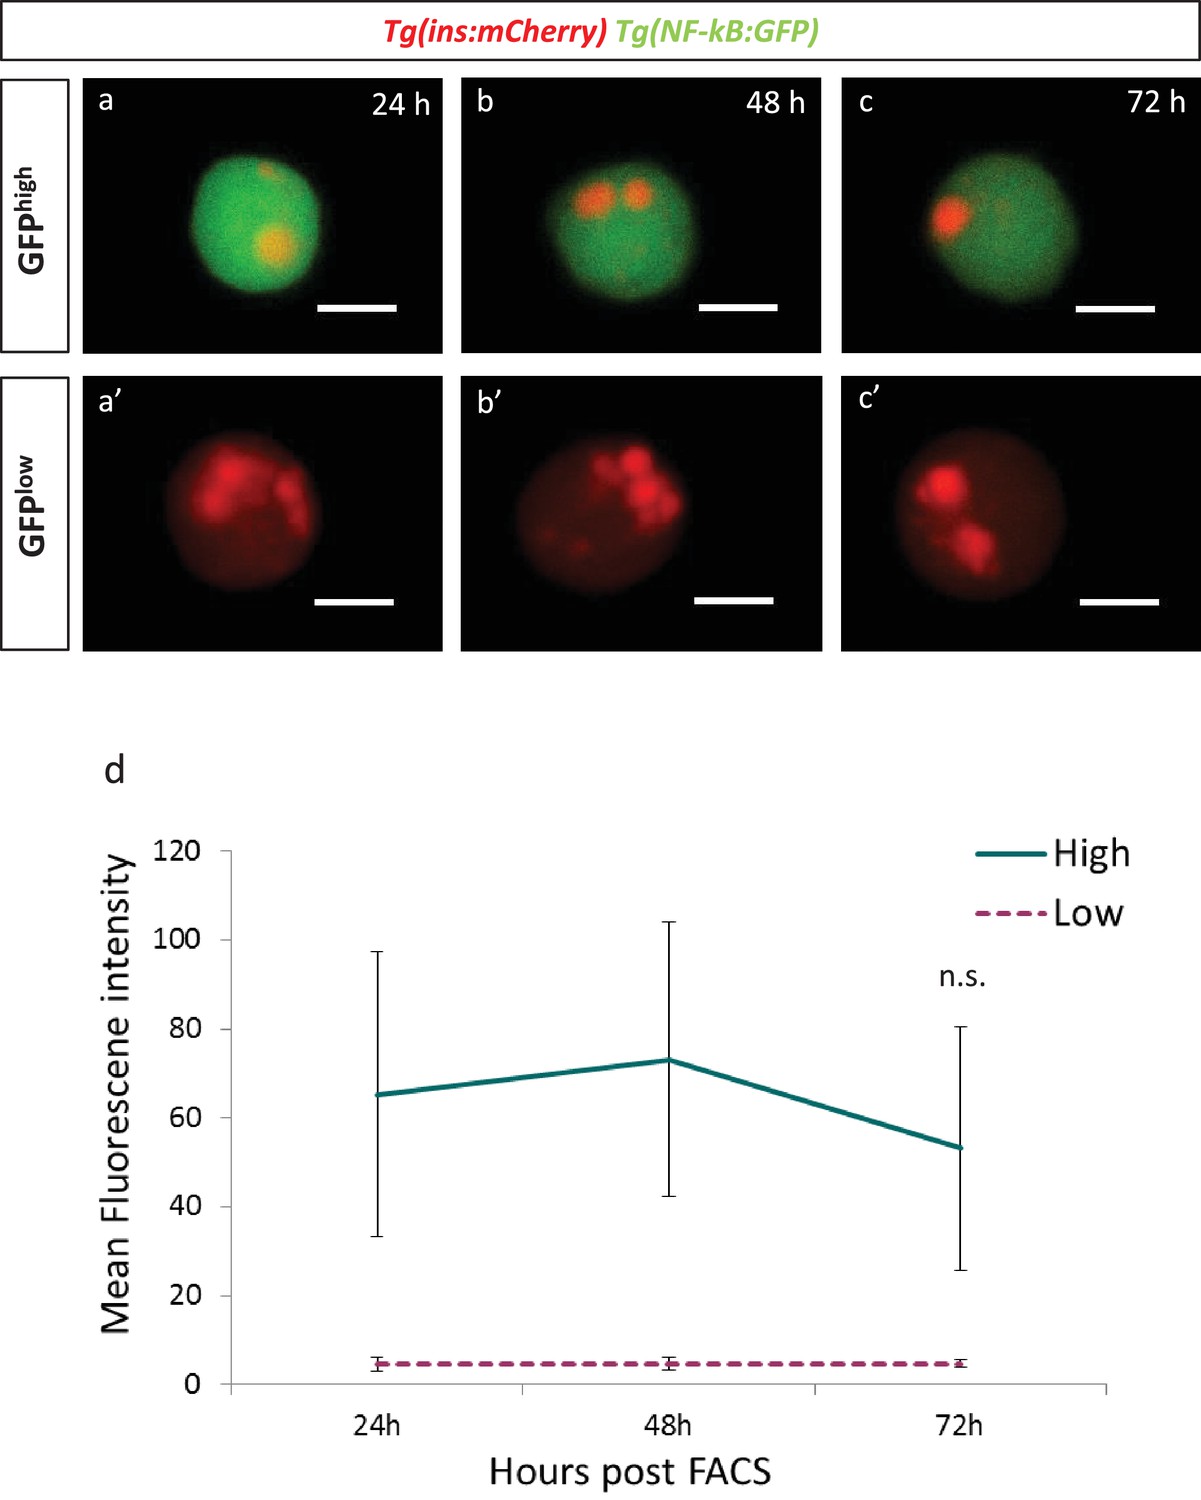
The GFP fluorescence of the transgenic reporterTg(NF-kB:GFP)remains stable for 72 hours in beta-cells.
(a,b,c) Beta-cells from Tg(NF-kB:GFP);Tg(ins:mCherry) animals at 3 mpf were FAC-sorted as single cells in 384-well plates and followed over 72 hr. NF-kB:GFPhigh cells at 24, 48 and 72 hr post-FAC-sorting. Scale bar 5 µm. (a’,b’,c’) NF-kB:GFPlow cells at 24, 48 and 72 hr post-FAC-sorting. Scale bar 5 µm. (d) Quantification showing the mean GFP fluorescence intensity of GFPhigh and GFPlow cells (n = 7 GFPhigh cells and n = 5 GFPlow cells).
Figure 5—figure supplement 2
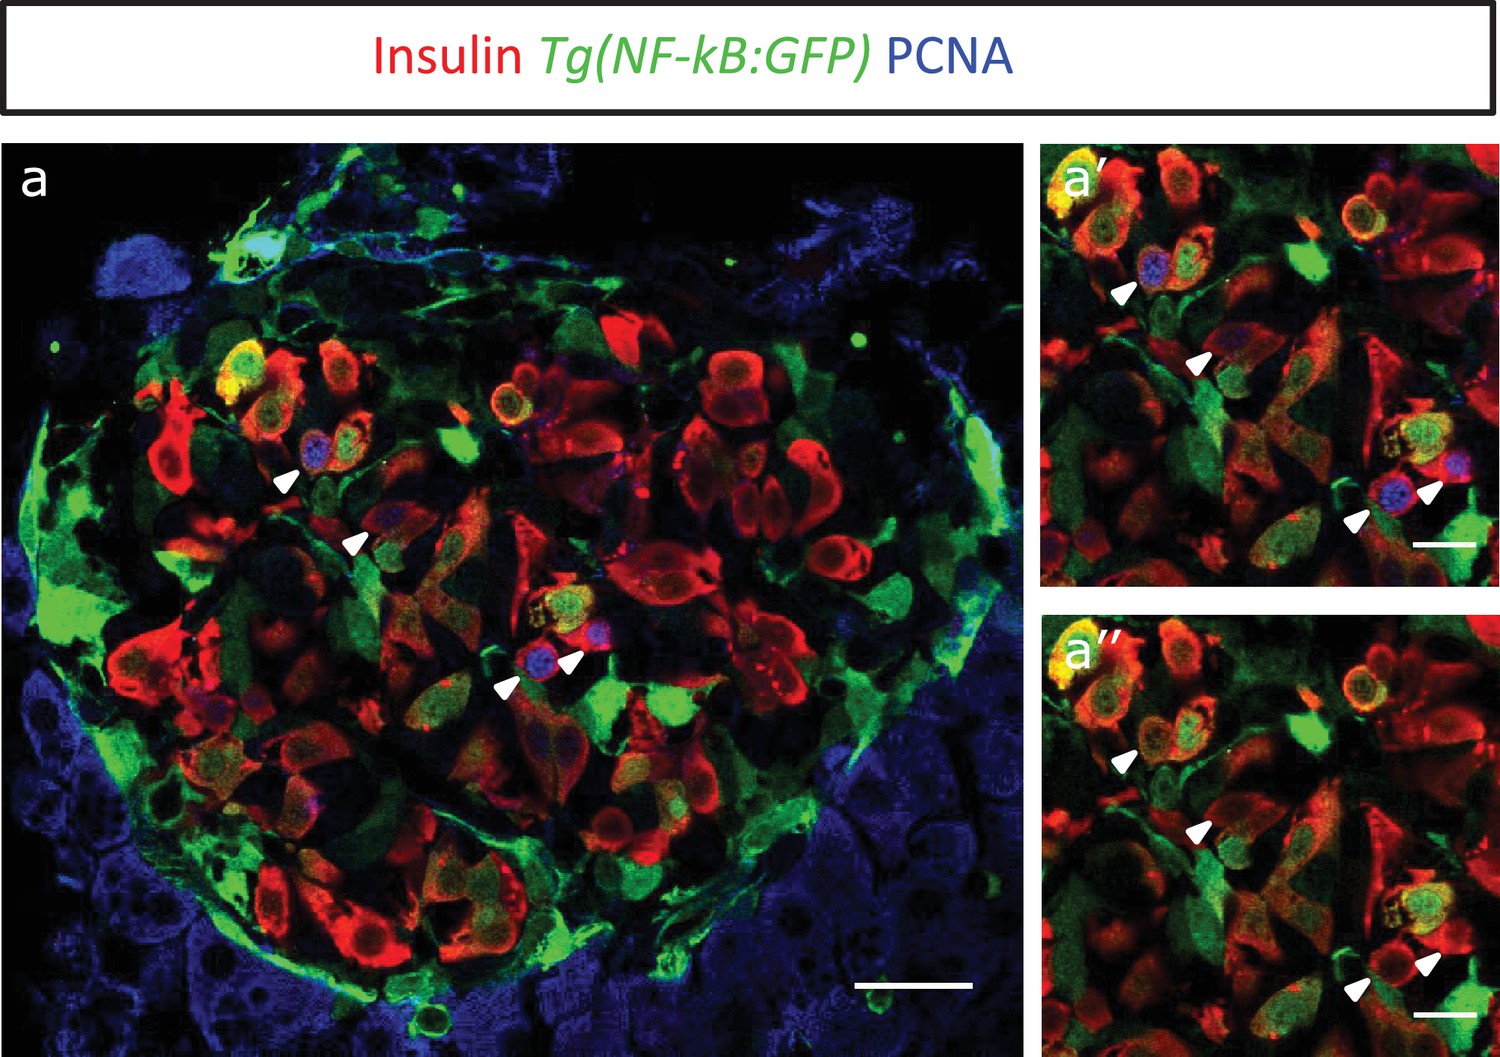
Proliferating cell nuclear antigen (PCNA) antibody staining shows that NF-kB:GF Phighbeta-cells proliferate less than NF-kB:GFP low beta-cells.
(a) Islets were stained for PCNA to mark the proliferating beta-cells in Tg(NF-kB:GFP) animals at 3 mpf. The confocal image (single plane) shows an overview of a section through the islet. The sections were stained with an insulin antibody (red), a GFP antibody (green) and PCNA (blue). (a’–a’’) The insets show higher magnification images. PCNA can be observed in some of the GFPlow cells (white arrow-heads).
Figure 6 with 2 supplements
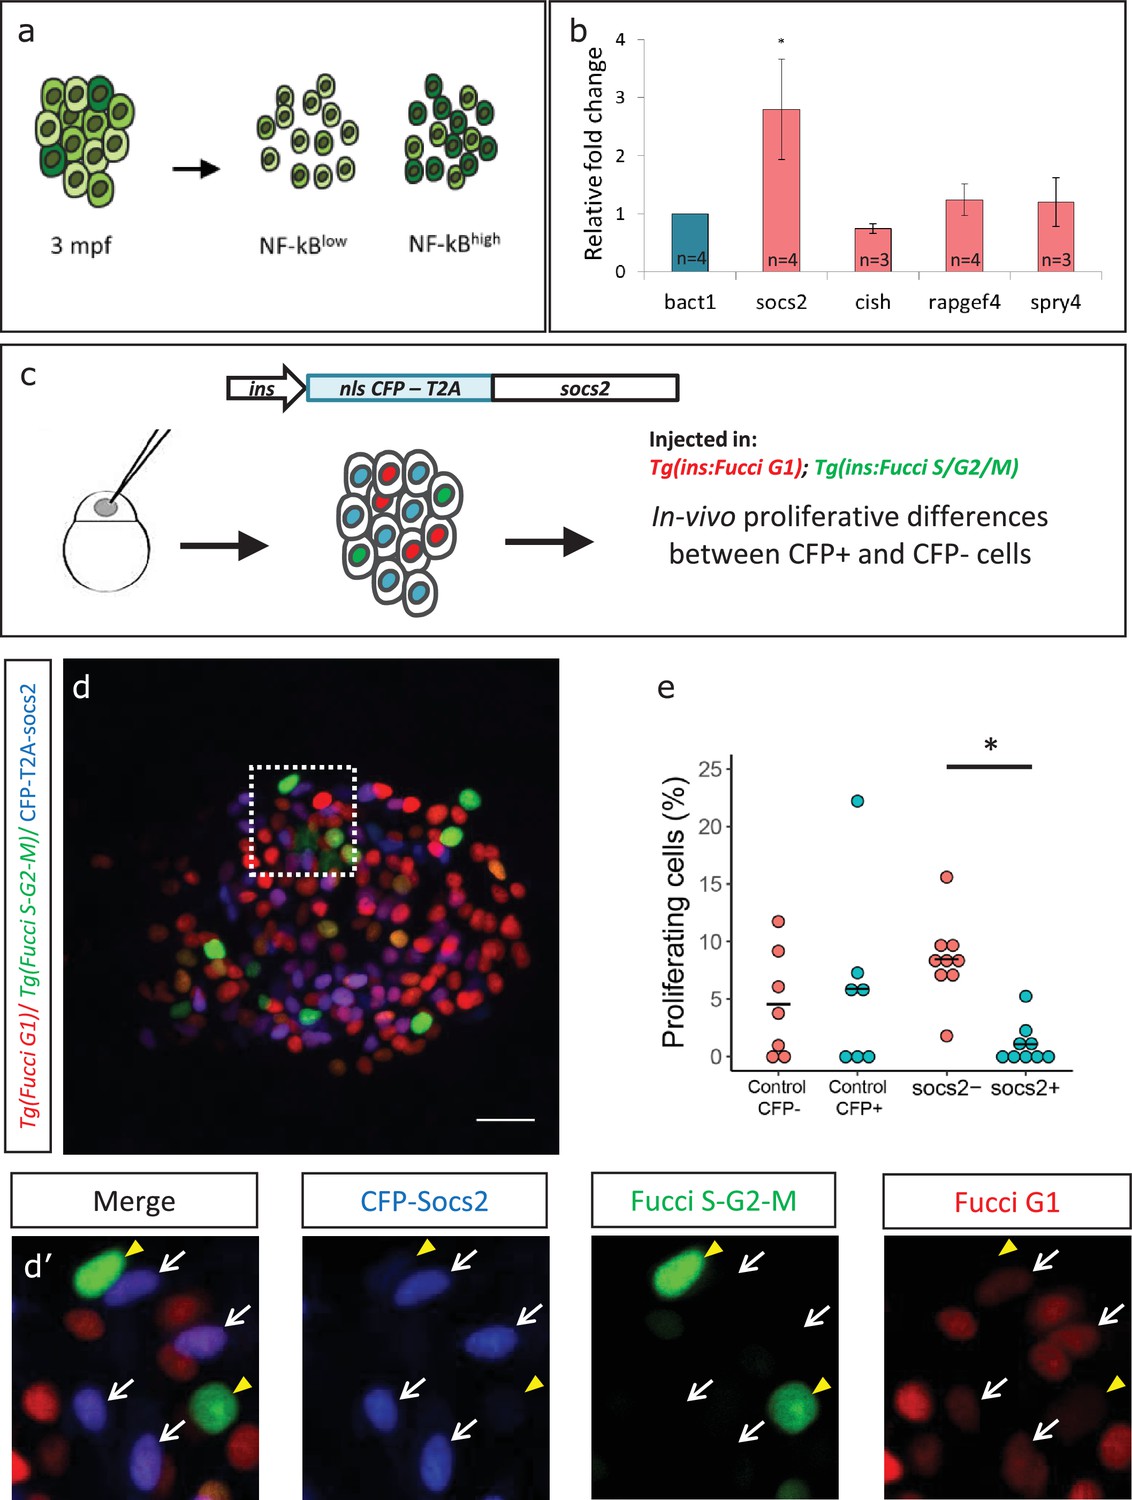
Socs2 is enriched in NF-kB:GFPhigh cells and inhibits beta-cell proliferation in a cell-autonomous manner.
(a) Schematic showing the sorting of beta-cells from the double transgenic line Tg(ins:mCherry);Tg(NF-kB:GFP) at 3 mpf into GFPhigh and GFPlow cells using FACS. (b) Bulk RT-qPCR was performed on the GFPhigh and GFPlow beta-cells (n = 3 to 4 biological replicates, n = 3 animals per replicate, 1000 cells per condition). Candidate genes significantly enriched in beta-cells at 1 ypf were chosen to be compared between the GFPhigh and GFPlow populations at 3 mpf. The graph shows relative fold-change between GFPhigh and GFPlow cells. The expression of all genes was normalized to β-actin expression before calculating fold-change. socs2 shows higher expression in the GFPhigh cells. Error bars, SD (two-tailed paired t-test, *p<0.05). (c) Schematic showing the method for mosaic overexpression of candidate genes in beta-cells. The socs2 coding sequence is linked to nuclear-CFP using a T2A sequence. The entire construct was expressed under the insulin promoter. This construct was injected in one-cell-stage-embryos from Tg(ins:Fucci-G1);Tg(ins:Fucci-S/G2/M) animals leading to mosaic and stochastic expression of socs2 in beta-cells during islet development. Control animals were injected with plasmid containing only nuclear-CFP sequence (See Figure 6—figure supplement 2). (d) Confocal projections showing mosaic expression of socs2-T2A-CFP (blue) at 23 dpf (blue). Proliferating beta-cells are marked by Tg(ins:Fucci-S/G2/M) expression (green) and absence of Tg(ins:Fucci-G1) expression (red). Anterior to the left. Scale bar 10 µm. (d’) Insets show higher magnification single planes from the confocal stacks (white dotted-line in d) with separate channels. The proliferating beta-cells are CFP-negative (yellow arrowheads), whereas some of the non-proliferating cells are CFP-positive (white arrowheads) (e) Quantification of the percentage of Tg(ins:FUCCI-S/G2/M)-positive and Tg(ins:FUCCI-G1)-negative (green only) beta-cells. The socs2 expressing β-cells exhibit reduced cell-cycle progression compared to wild-type neighbors (n = 9). Horizontal bars represent mean values (two-tailed t-test, *p<0.05).
-
Figure 6—source data 1
This spreadsheet contains the Relative Fold Change between NF-kB:GFPhigh and NF-kB:GFPlow beta-cells used to generate the bar plots and average data shown in Figure 6b.
- https://doi.org/10.7554/eLife.32965.018
Figure 6—figure supplement 1
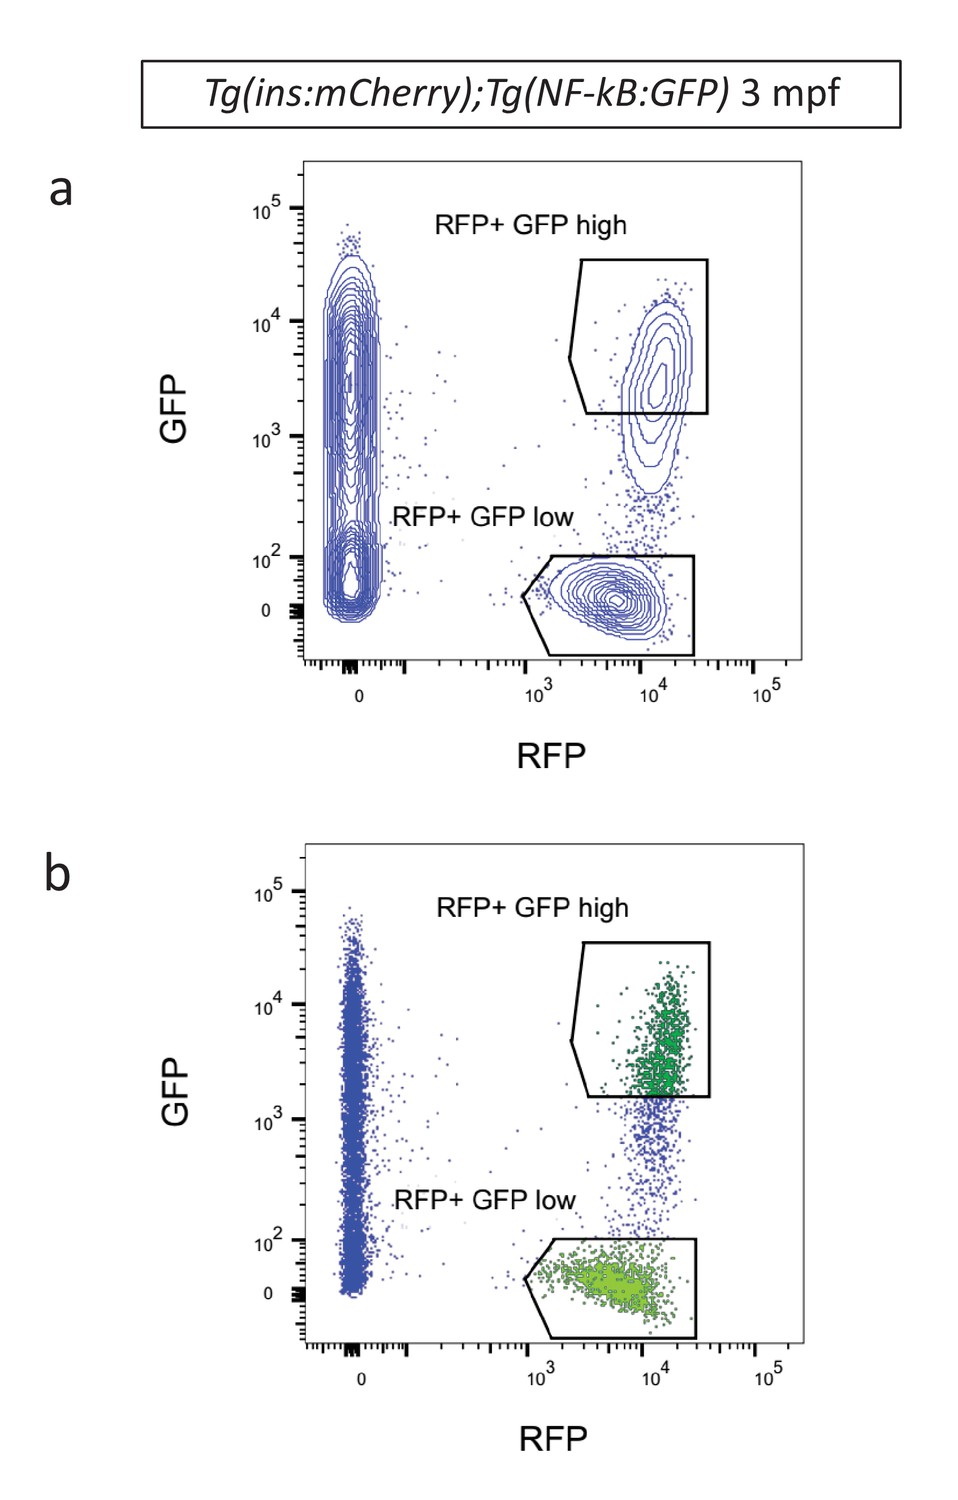
Fluorescent activated cell sorting of NF-kB:GFPhigh and NF-kB:GFPlowbeta-cells.
(a) Contour plot showing FACS of live RFP-positive GFPhigh and GFPlow cells from Tg(NF-kB:GFP);Tg(ins:mCherry) animals at 3 mpf. Live cells were labeled with calcein. (b) Dot plot shows FACS of live RFP-positive GFPhigh and GFPlow cells from Tg(NF-kB:GFP);Tg(ins:mCherry) animals at 3 mpf.
Figure 6—figure supplement 2
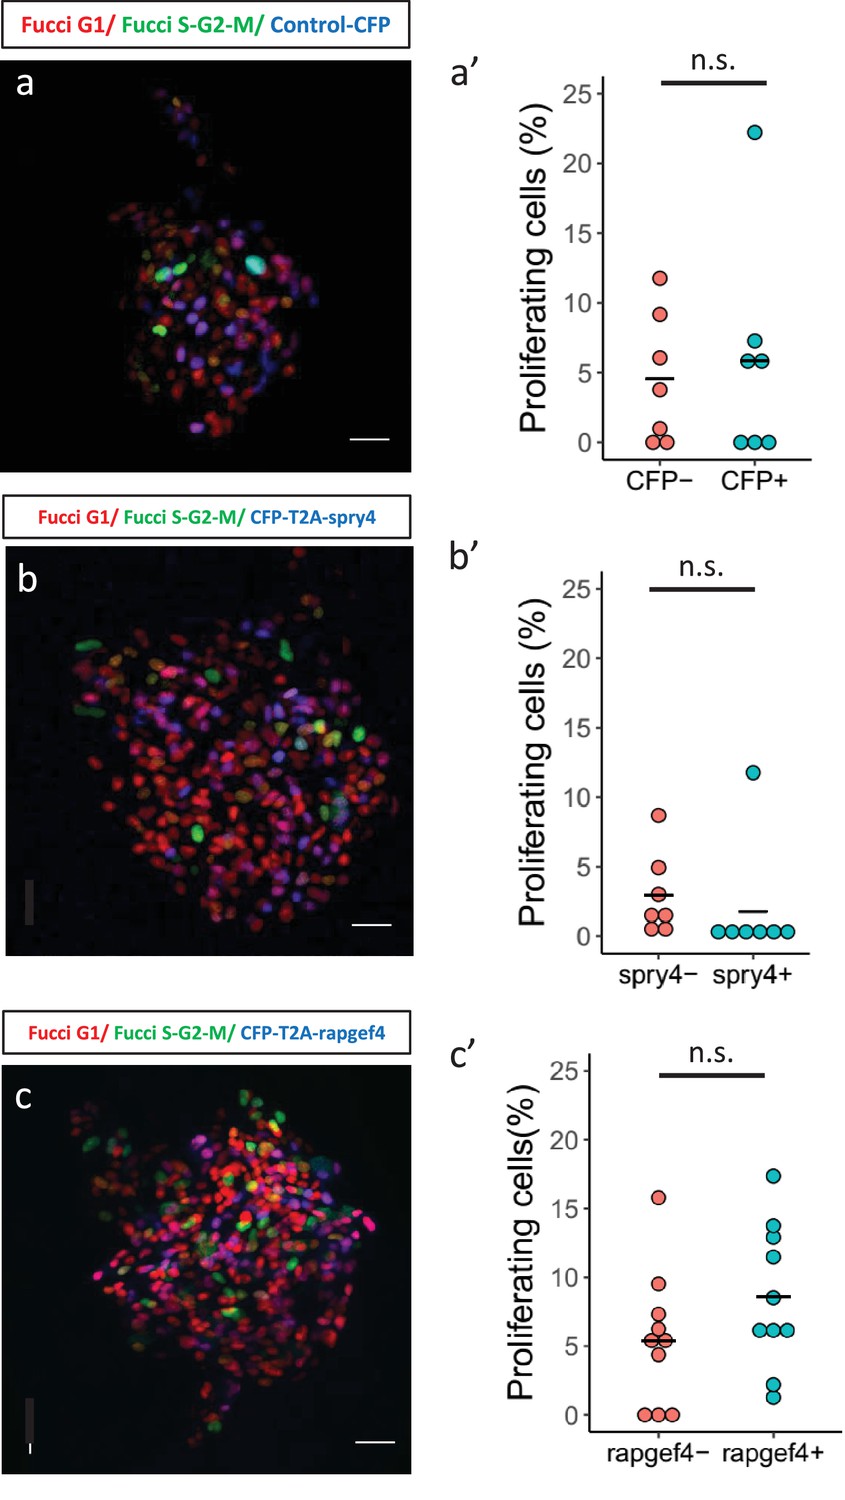
Mosaic expression of candidate genes in beta-cells to study their effect on proliferation.
(a,b,c) Confocal images showing mosaic expression of nuclear-CFP (a), CFP-T2A-spry4 (b) and CFP-T2A-rapgef4 (c) at 23 dpf. Tg(ins:Fucci-G1) expression is shown in red, Tg(ins:Fucci-S/G2/M) expression in green and CFP expression in blue. Anterior to the top. Scale bar 20 µm. (a’,b’,c’) Quantification of the percentage of Tg(ins:FUCCI-S/G2/M)-positive and Tg(ins:FUCCI-G1)-negative (green only) beta-cells among the CFP-positive and CFP-negative sub-populations for each experiment shown in the left-hand panels. Horizontal bars represent mean values (two-tailed t-test, p>0.05).
Figure 7
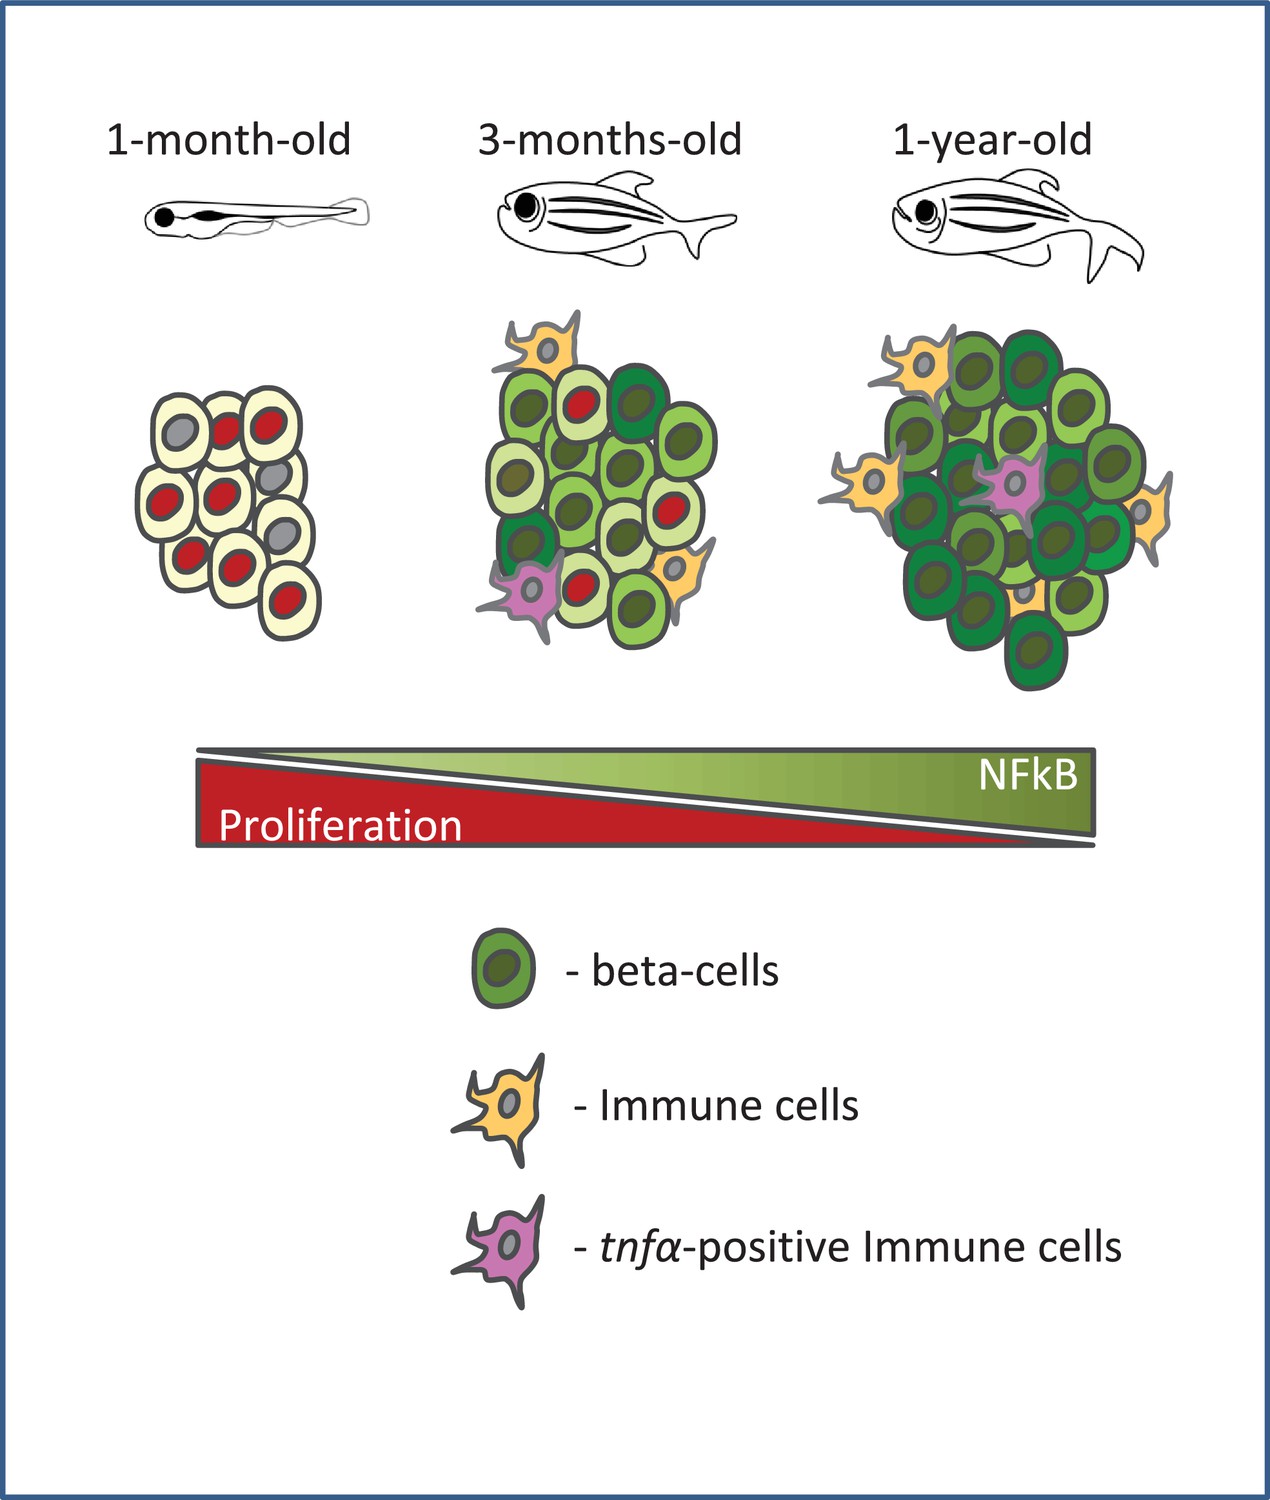
A schematic summarizing our model.
Beta-cell proliferation declines with age together with a concurrent increase in NF-kB signaling. The activation of NF-kB signaling is heterogeneous among beta-cells and correlates with their proliferative heterogeneity. In particular, beta-cells with higher NF-kB activity proliferate less compared to neighbors with lower activity, and express higher levels of socs2, which can inhibit beta-cell proliferation. Furthermore, the crosstalk with tnfα-positive immune cells in the islet provides a potential source of inflammation and NF-kB activation in beta-cells.
Tables
Key resources table
| Reagent type (species) or resource | Designation | Source or reference | Identifiers | Additional information |
|---|---|---|---|---|
| Gene (Danio rerio) | flag-tnfrsf1b | synthesized from GenScript | ||
| Gene (Danio rerio) | tnfα | Dharmacon | MDR1734-202796946 | ZGC tnfa cDNA (CloneId:8148192) |
| Gene (Danio rerio) | cpf-T2A | synthesized from GenScript | ||
| Genetic reagent (Danio rerio) | Tg(ins:FUCCI-G1)s948 | PMID: 23791726 | ||
| Genetic reagent (Danio rerio) | Tg(ins:FUCCI-S/G2/M)s946 | PMID: 23791726 | ||
| Genetic reagent (Danio rerio) | Tg(NF-kB:GFP) | PMID: 21439961 | ||
| Genetic reagent (Danio rerio) | TgBAC(tnfα:GFP) | PMID: 25730872 | ||
| Genetic reagent (Danio rerio) | Tg(ins:nlsRenilla-mKO2) | PMID: 28939870 | ||
| Genetic reagent (Danio rerio) | Tg(ins:gCaMP6s; cryaa:mCherry) | PMID: 28939870 | ||
| Genetic reagent (Danio rerio) | Tg(ins: loxP:mCherrySTOP:loxP:H2B-GFP) | PMID: 21497092 | ||
| Genetic reagent (Danio rerio) | Tg(mpeg1:mCherry) | PMID: 21084707 | ||
| Genetic reagent (Danio rerio) | Tg(ins:CFP-NTR) | PMID: 17326133 | ||
| Antibody | anti-insulin | Dako | A0564 | guinea pig (1:200) |
| Antibody | anti-EGFP | Abcam | ab13970 | chicken (1:500) |
| Antibody | anti-PCNA | Dako | M0879 | mouse (1:500) |
| Antibody | anti-L-plastin | Biozol | LS-C210139-250 | rabbit (1:1000) |
| Antibody | Alexa Fluor488, 568 and 647 secondaries | Molecular Probes | (1:300) | |
| Recombinant DNA reagent | ins:Flag-tnfrsf1b;cryaa:RFP (plasmid) | This paper | cloned into ins:MCS2;cryaa:RFP | |
| Recombinant DNA reagent | ins:tnfα;cryaa:CFP (plasmid) | This paper | cloned by replacing mCherry-zCdt1 with tnfα in ins:mCherry-zCdt1;cryaa:CFP | |
| Recombinant DNA reagent | ins:CFP-T2A-socs2;cryaa:RFP (plasmid) | This paper | cloned into ins:MCS2;cryaa:RFP | |
| Recombinant DNA reagent | ins:CFP-T2A-rapgef4;cryaa:RFP (plasmid) | This paper | cloned into ins:MCS2;cryaa:RFP | |
| Recombinant DNA reagent | ins:CFP-T2A-spry4;cryaa:RFP (plasmid) | This paper | cloned into ins:MCS2;cryaa:RFP | |
| Recombinant DNA reagent | ins:mAG-zGeminin;cryaa:RFP (plasmid) | PMID: 23791726 | ||
| Recombinant DNA reagent | ins:MCS2;cryaa:RFP (plasmid) | PMID: 28939870 | ||
| Recombinant DNA reagent | ins:mCherry-zCdt1;cryaa:CFP (plasmid) | PMID: 23791726 | ||
| Software, algorithm | edgeR package | PMID:19910308 | ||
| Other | TSQ (N-(6-Methoxy-8-Quinolyl)-p-Toluenesulfonamide) | ThermoFisher | M-688 | 30 µM |
Additional files
-
Supplementary file 1
List of genes differentially expressed from RNA-Seq of beta-cells at 3 mpf and 1 ypf (log2FC ± 1.5).
- https://doi.org/10.7554/eLife.32965.020
-
Supplementary file 2
List of primer sequences of genes validated using single-cell RT-qPCR and bulk RT-qPCR.
- https://doi.org/10.7554/eLife.32965.021
-
Transparent reporting form
- https://doi.org/10.7554/eLife.32965.022
Download links
A two-part list of links to download the article, or parts of the article, in various formats.
Downloads (link to download the article as PDF)
Open citations (links to open the citations from this article in various online reference manager services)
Cite this article (links to download the citations from this article in formats compatible with various reference manager tools)
Age-related islet inflammation marks the proliferative decline of pancreatic beta-cells in zebrafish
eLife 7:e32965.
https://doi.org/10.7554/eLife.32965


