Sorting of a multi-subunit ubiquitin ligase complex in the endolysosome system
- University of Michigan, United States
Figures
Figure 1
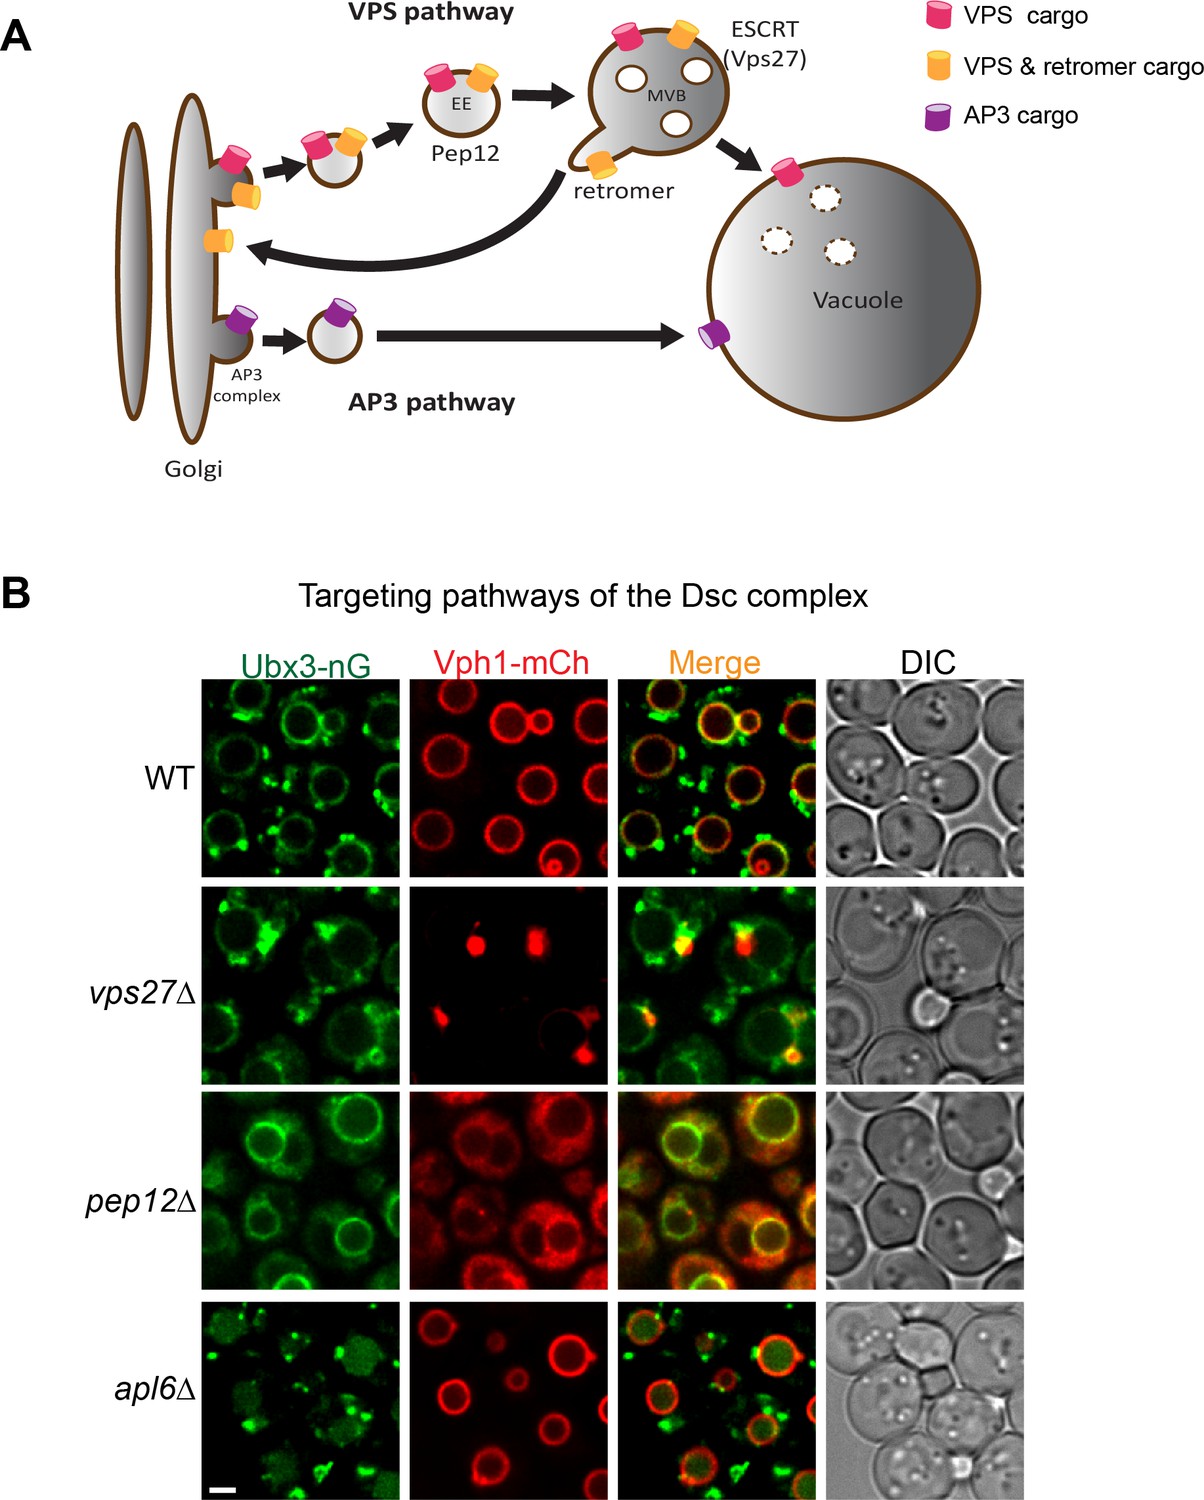
Targeting pathways utilized by the Dsc complex.
(A) A cartoon model showing two conserved pathways (VPS and AP3) for transporting proteins from Golgi to vacuole. Some VPS cargoes can be recycled from the endosome to Golgi by the retromer complex before reaching the vacuole. EE: early endosome, MVB: multivesicular body. (B) Localization of Ubx3-nG and Vph1-mCh in WT, vps27∆, pep12∆, and apl6∆ strain cells. Scale bar: 2 µm.
Figure 2 with 1 supplement
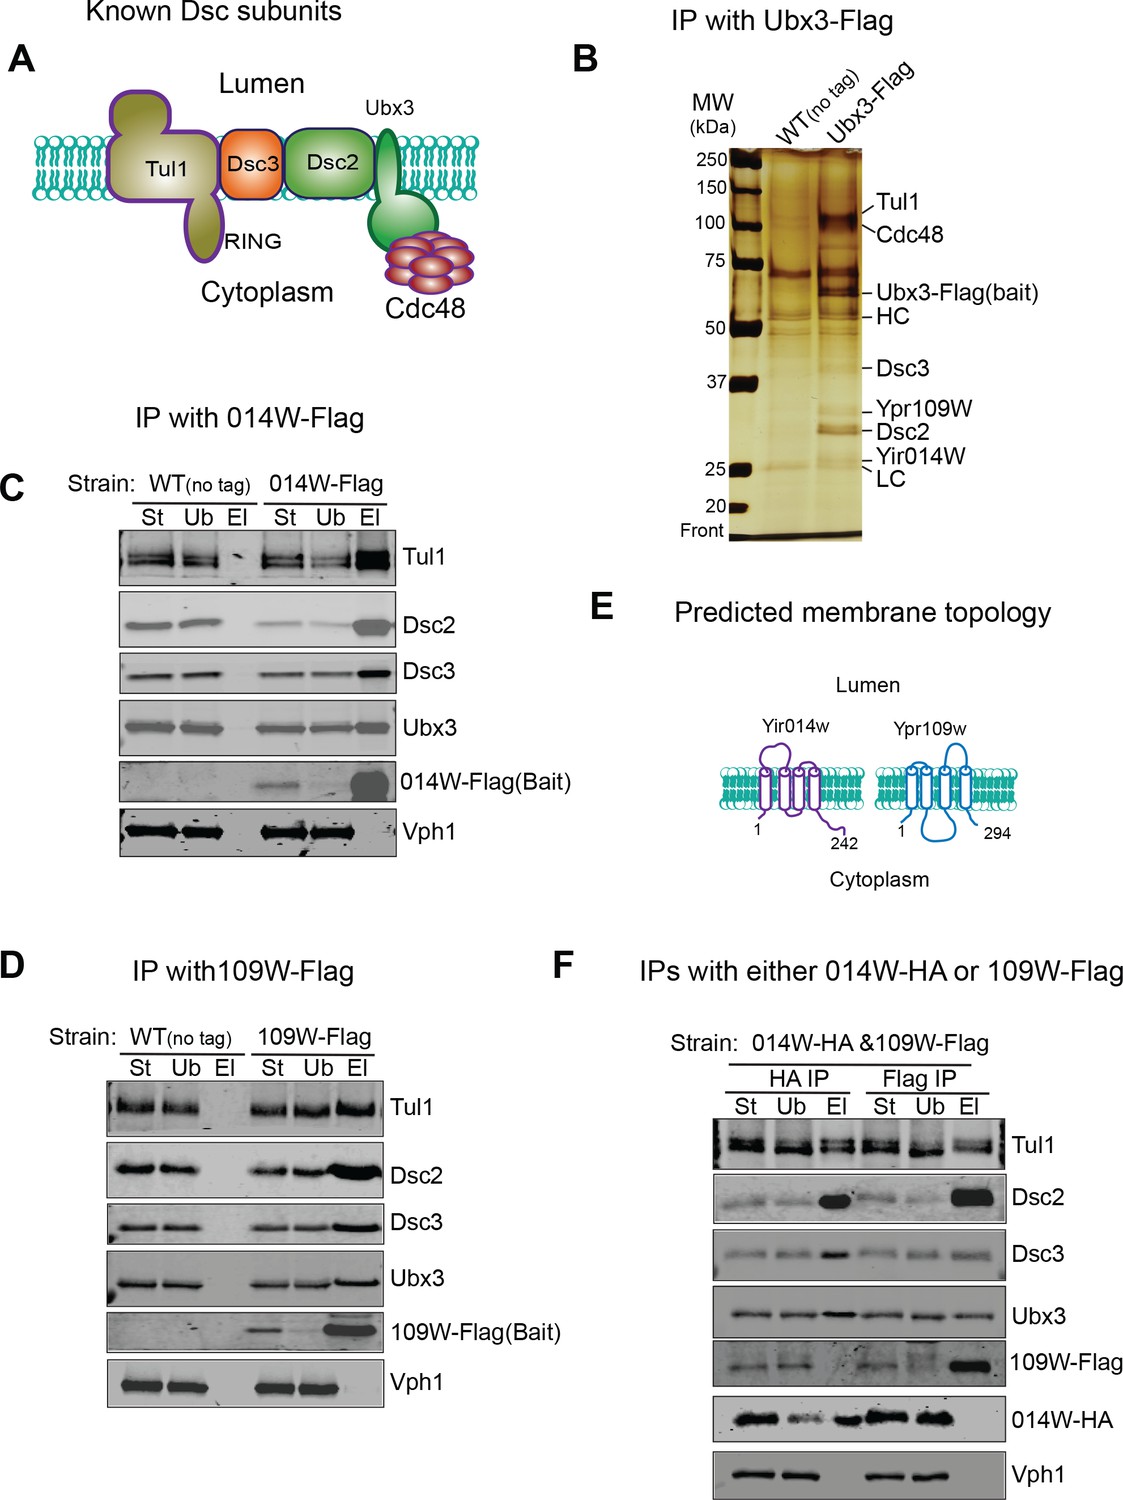
Identification of two new Dsc components.
(A) A cartoon model showing known Dsc components in budding yeast. (B) A silver staining gel showing that Ypr109W and Yir014W co-immunoprecipitate with Ubx3-Flag, together with other known Dsc components. HC, heavy chain. LC, light chain. (C) 014W-Flag can selectively pull down known Dsc components. (D) 014W-Flag can selectively pull down with known Dsc components. (E) Cartoon representations of 014W and 109W. Both proteins are predicted to be tetra-spanning membrane proteins. (F) 014W-HA and 109W-Flag do not pull down each other. St: Starting material. Ub: Unbound. El: Elution.
Figure 2—figure supplement 1
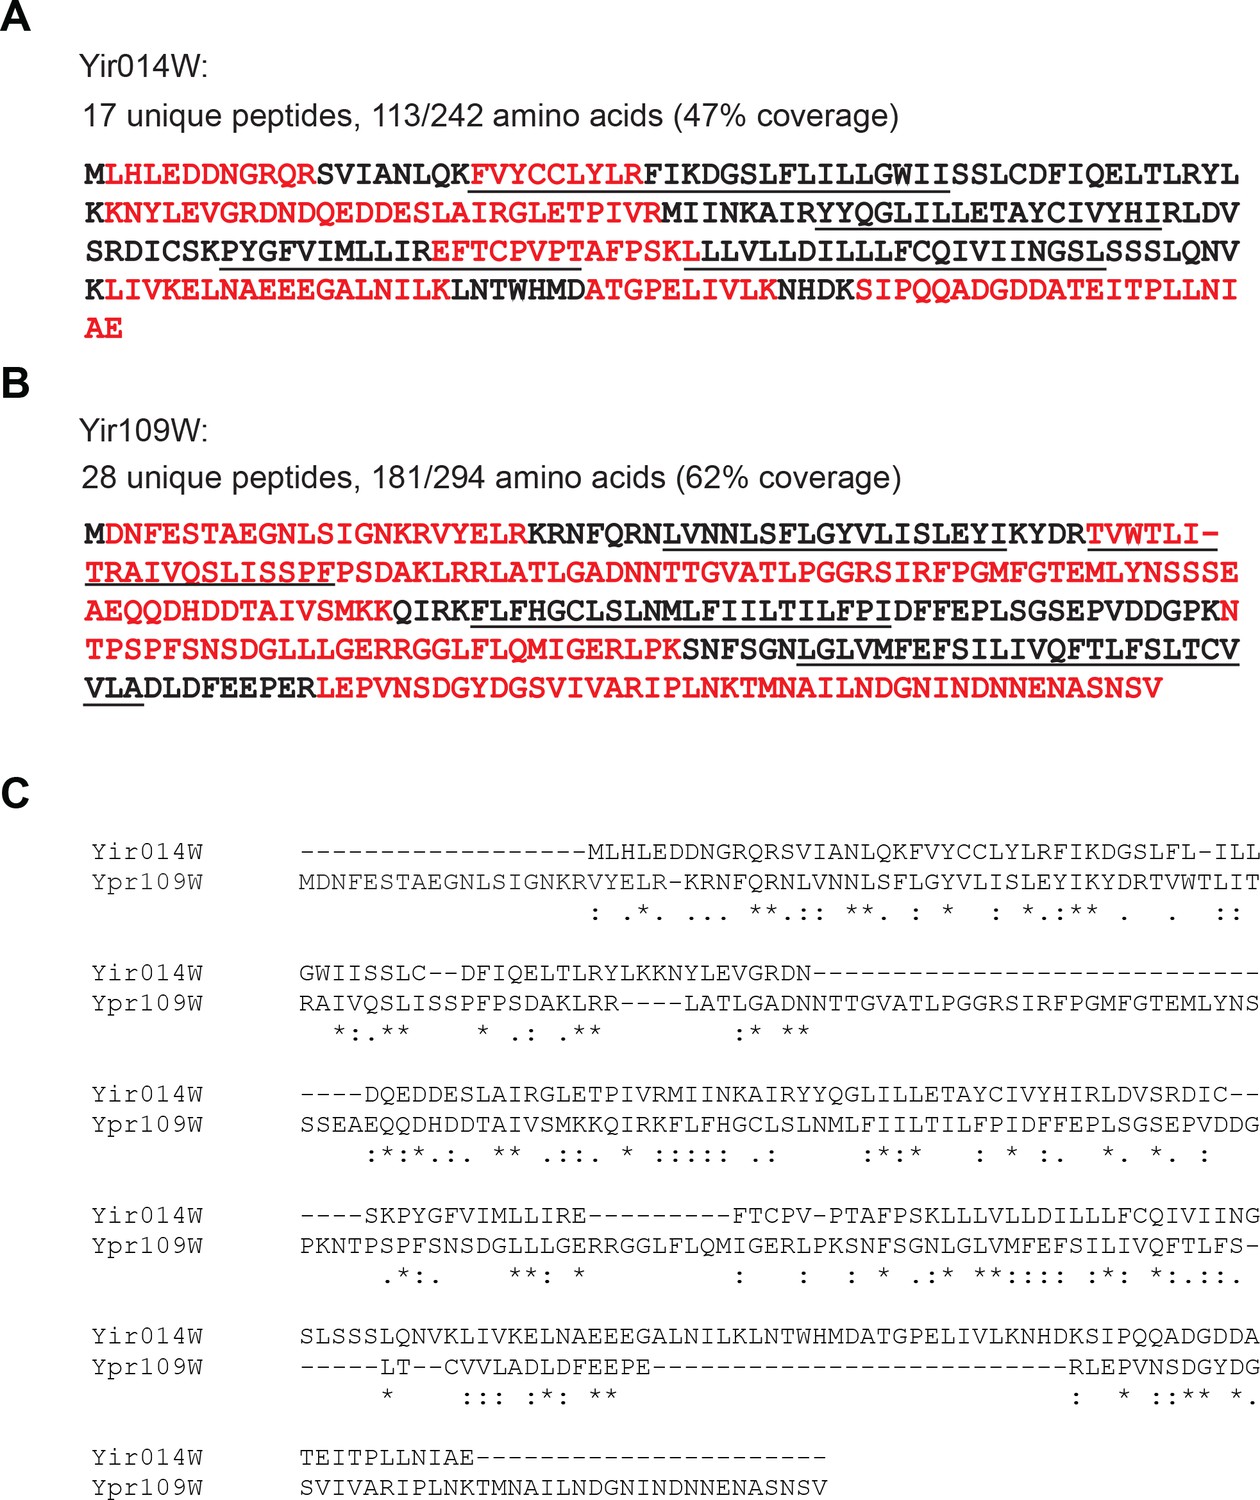
Identification of two new Dsc subunits by mass spectrometry.
(A) Mass spectrometry peptide coverage for Yir014W. The peptides identified by mass spectrometry are highlighted in red. The underlined sequences are the predicted transmembrane helices. (B) Mass spectrometry peptide coverage for Ypr109W. The peptides identified by mass spectrometry are highlighted in red. The underlined sequences are the predicted transmembrane helices. (C) Sequence similarity between Yir014W and Ypr109W. The alignment was performed with Clustal Omega (Sievers et al., 2011).
Figure 3
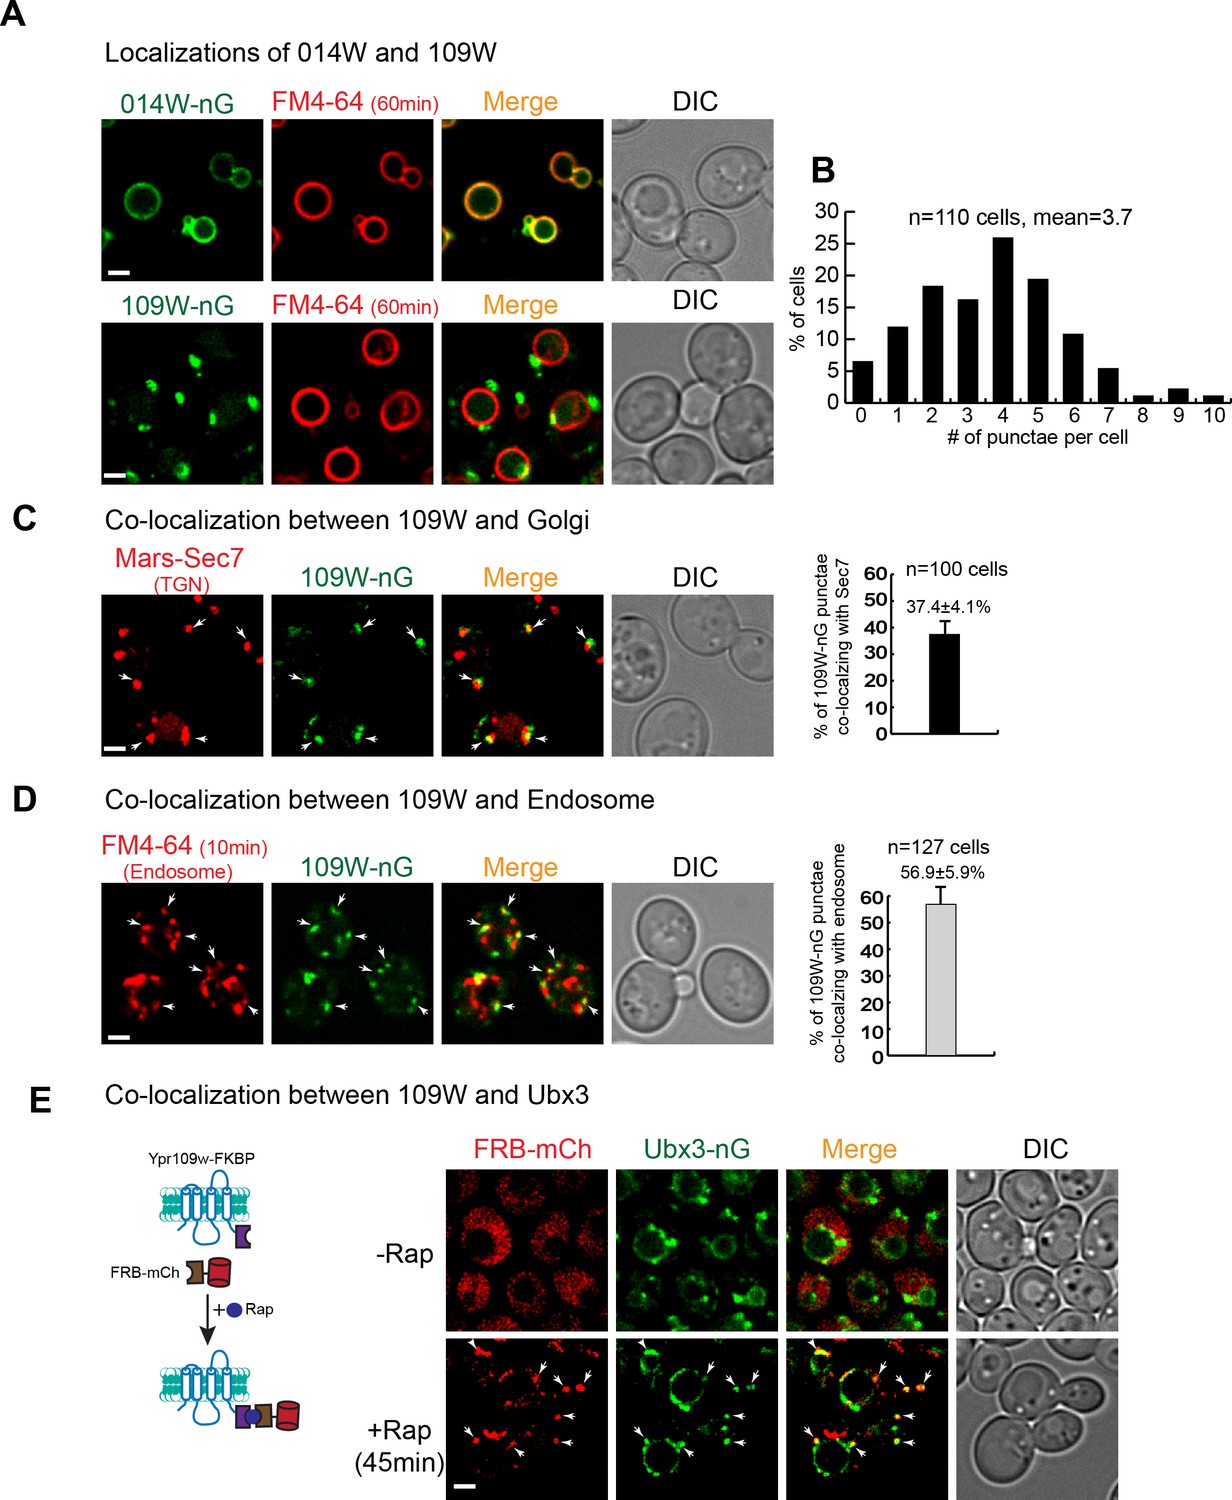
109W and 014W have distinct subcellular localizations.
(A) 014W-nG co-localizes with FM4-64 labelled vacuole membrane, whereas 109W-nG localizes to the intracellular punctae. (B) Quantification of the number of 109 W-nG punctae. (C) Left, 109W-nG partially co-localizes with Mars-Sec7 labelled trans-Golgi (white arrows). Right, quantification of the co-localization. Error bar represents the Standard Error of the Mean (SEM). (D) Left, 109W-nG partially co-localizes with FM4-64 labelled endosomes (white arrows). Right, quantification of the co-localization. Error bar represents the SEM. (E) Co-localization between 109W and Ubx3 using rapamycin induced co-localization (RICo) assay. Left: A cartoon diagram showing the principle of the assay. Right: FRB-mCherry localization before and after rapamycin treatment. White arrows indicate the co-localization. Scale bar: 2 µm.
-
Figure 3—source data 1
The source data for the quantification of 109W-nG punctae in Figure 3B.
- https://doi.org/10.7554/eLife.33116.007
-
Figure 3—source data 2
The source data for the quantification of co-localization in Figure 3C-D.
- https://doi.org/10.7554/eLife.33116.008
Figure 4 with 1 supplement
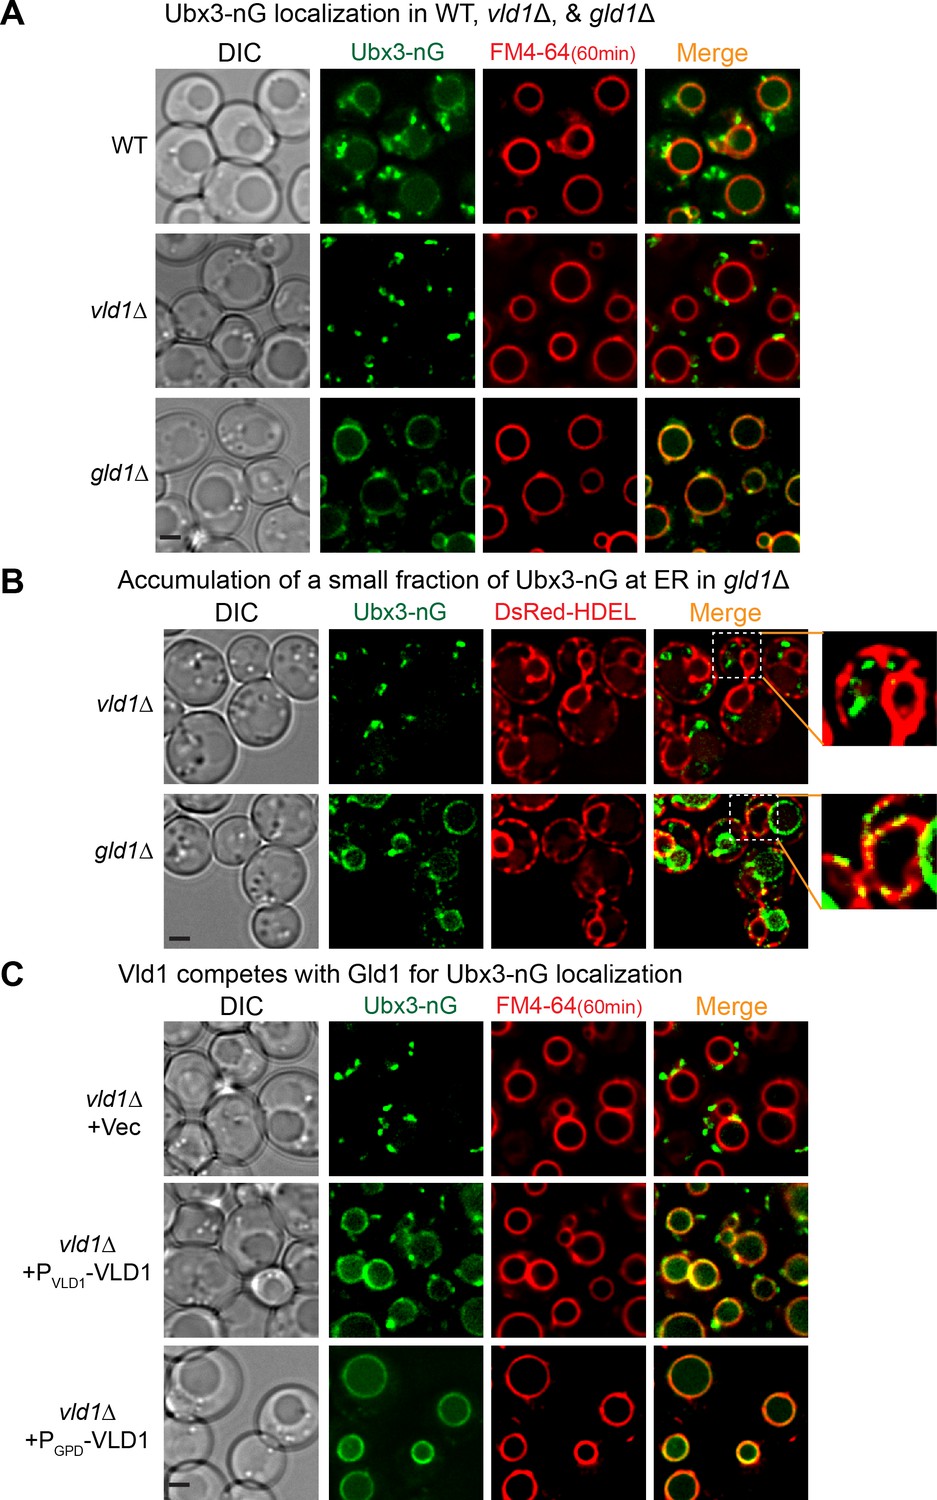
Vld1 competes with Gld1 to determine the Dsc subcellular localizations.
(A) Localization of Ubx3-nG after either VLD1 or GLD1 deletion. Note a small amount of punctae are also observed outside the vacuole in gld1∆ cells. (B) The small Ubx3-nG punctae in the gld1∆ cells co-localize with ER marker, DsRed-HDEL, whereas the punctae in vld1∆ cells do not co-localize with ER marker. (C) A competition assay to show elevating the Vld1 expression level in vld1∆ cells gradually diverts Ubx3-nG from punctae to vacuole membrane. Scale bar: 2 µm.
Figure 4—figure supplement 1
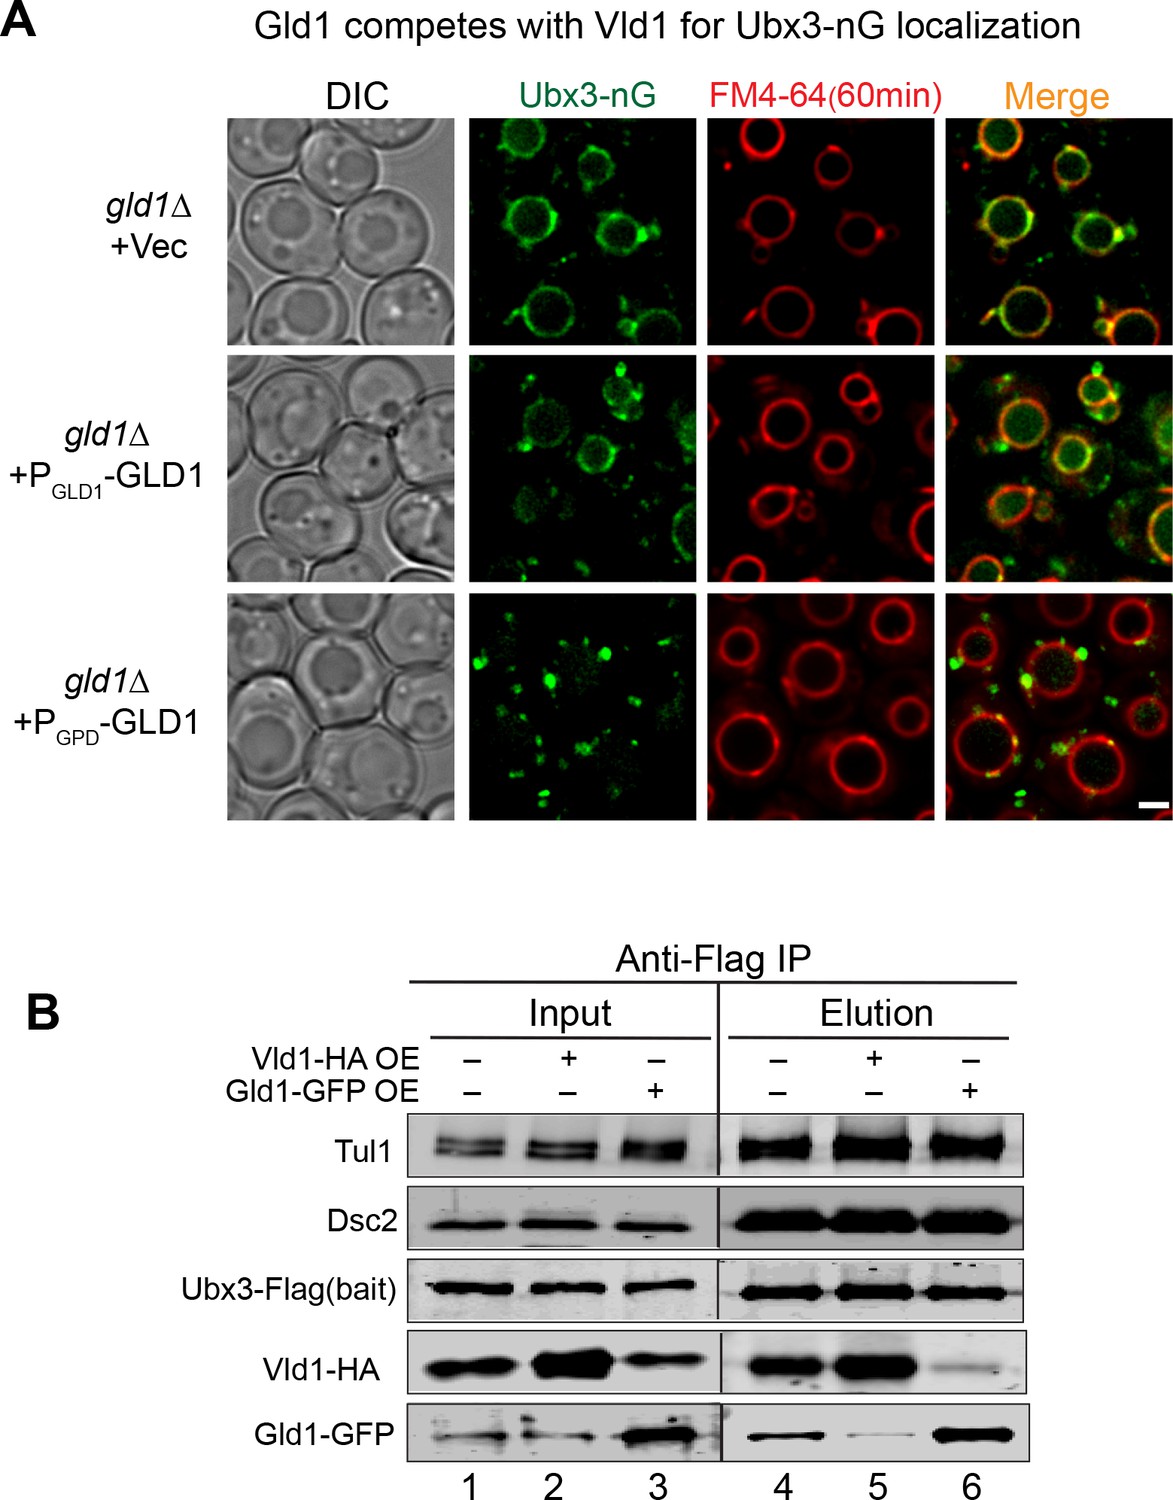
Gld1 competes with Vld1 to determine the subcellular localization of the Dsc complex.
(A) A competition assay to show the localization of Ubx3-nG in strains with different GLD1 expression levels. The vacuoles were labeled with FM4-64. Vec: empty vector. (B) Immunoprecipitation experiments to show the interactions between Ubx3-Flag and other Dsc components in WT, Vld1-HA overexpression, and Gld1-GFP overexpression strains. Note for the Input, 1OD600 cells were loaded for each sample except Vld1-HA, lane 2 and Gld1-GFP OE, lane 3. Only 0.1 OD600 cells were loaded for these two samples due to the overexpression. Scale bar: 2 µm.
Figure 5

The Golgi/endosome and vacuole subcomplexes are functionally independent.
(A) Subcellular localizations of GFP-Yif1 before (0 hr) and after (4 hr) amino acid starvation. (B) Western blot analysis of the GFP-Yif1 starvation assay. 1 OD600 cells were loaded in each lane. (C) Subcellular localizations of Cot1-GFP before (0 hr) and after (8 hr) Zn2+ withdrawal. (D) Western blot analysis of the Cot1-GFP degradation assay. Same volume of cells was loaded, with 0.25 OD600 cells loaded at 0 hr. Scale bar: 2 µm.
Figure 6 with 2 supplements
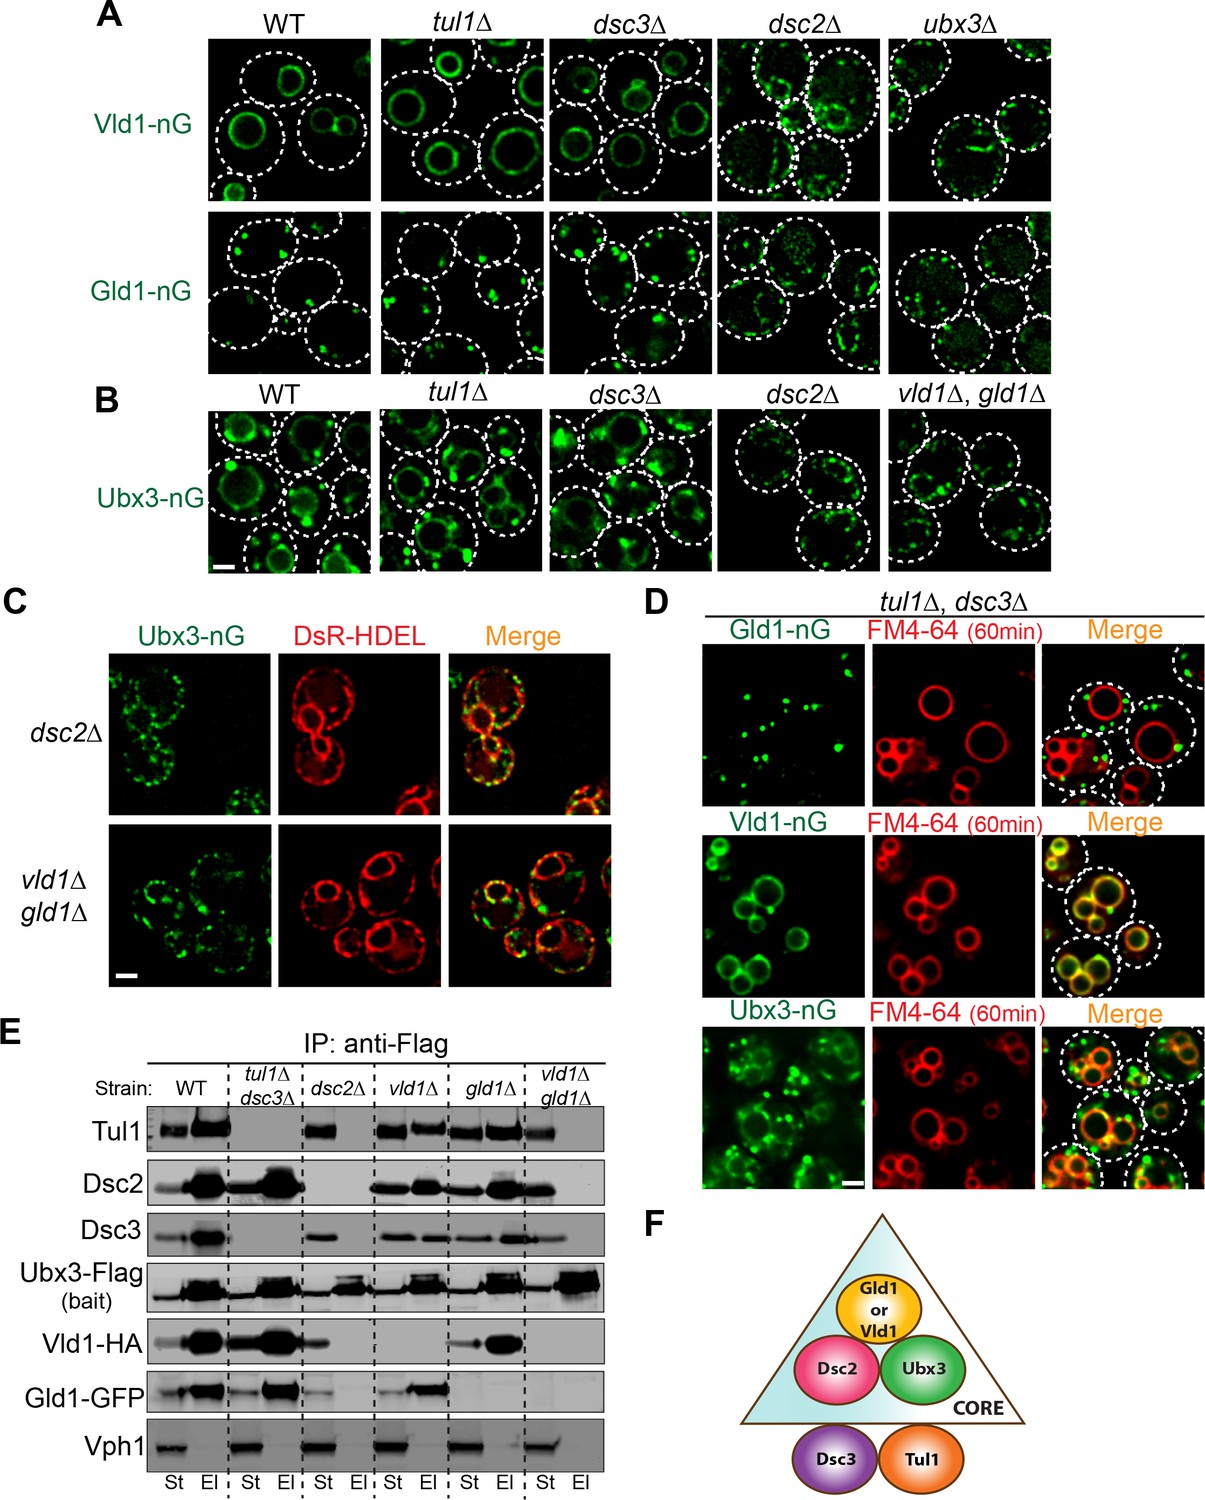
Two core complexes that determine the subcellular localizations.
(A) Deletion analysis for Vld1-nG and Gld1-nG localizations. (B) Deletion analysis for Ubx3-nG localization. (C) Co-localization between the Ubx3-nG punctae and ER marker DsRed-HDEL in either dsc2∆ or vld1∆ gld1∆ strains. (D) Double deletion of TUL1 and DSC3 did not change the localization patterns of Vld1-nG, Gld1-nG, or Ubx3-nG. (E) Western blot analysis of the Dsc complex assembly after deleting indicated Dsc components. St: Starting material, El: Elution. (F) A model to summarize the core complex concept. White dashed lines indicate the periphery of yeast cells. Scale bar: 2 µm.
Figure 6—figure supplement 1
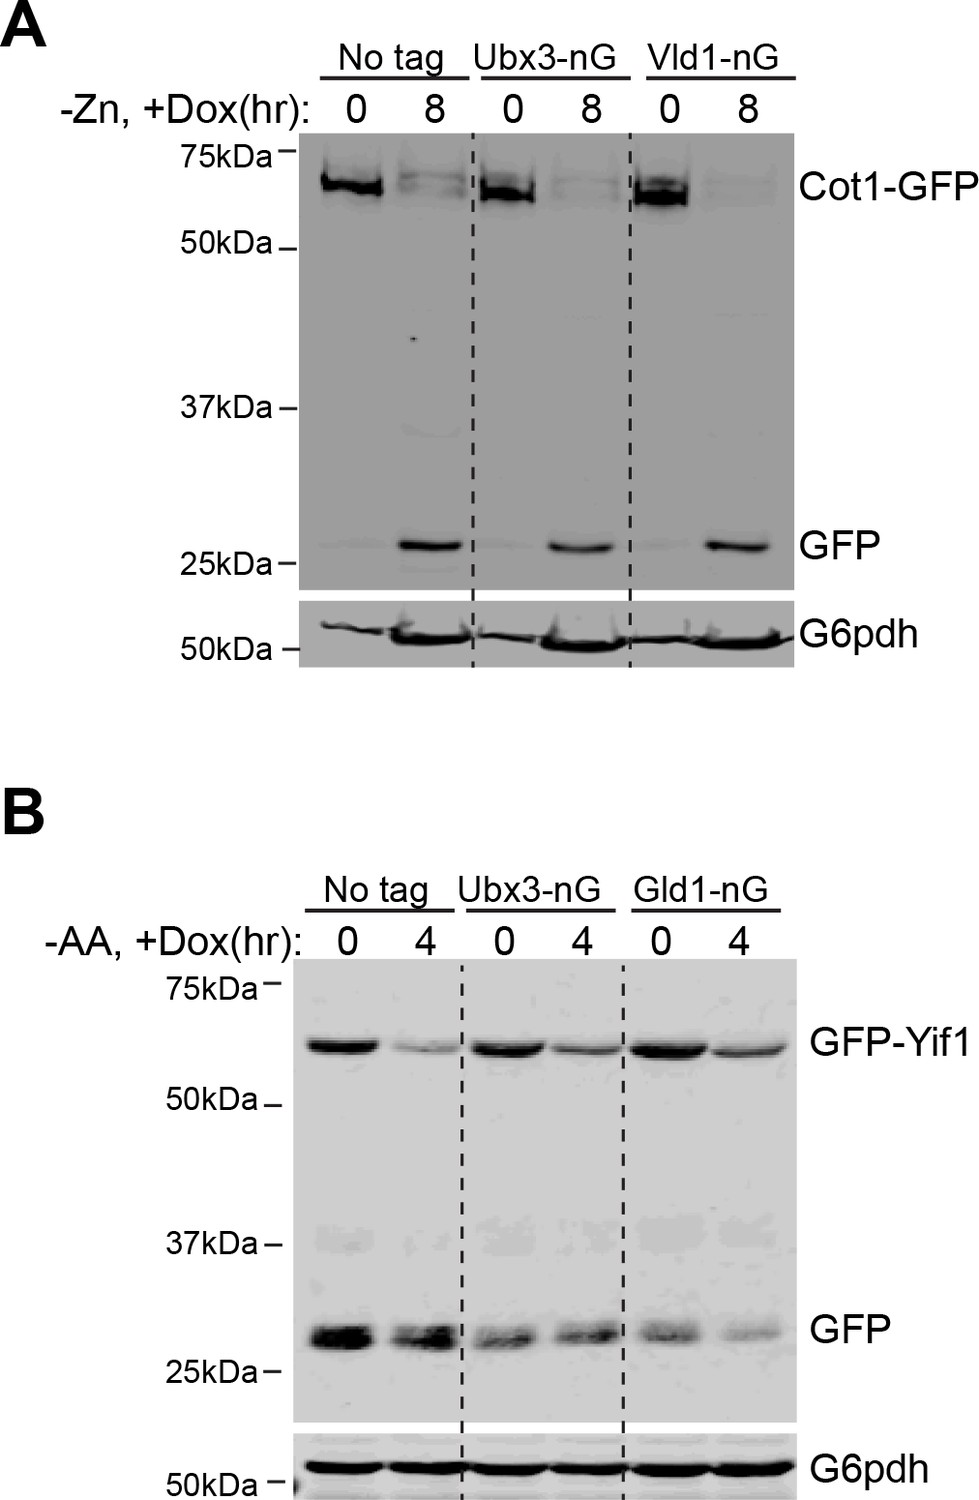
Ubx3, Vld1 and Gld1 still support the degradation of Cot1-GFP and GFP-Yif1 after neonGreen tagging.
(A) Western blot analysis of the Cot1-GFP degradation after Zn2+ withdrawal in WT, Ubx3-nG, and Vld1-nG strains. Same volume of cells was loaded for each group, with 0.25 OD600 cells loaded at 0 hr. (B) Western blot analysis of the GFP-Yif1 degradation after amino acid starvation in WT, Ubx3-nG, and Gld1-nG strains. Same volume of cells was loaded, with 0.5 OD600 cells loaded at 0 hr.
Figure 6—figure supplement 2
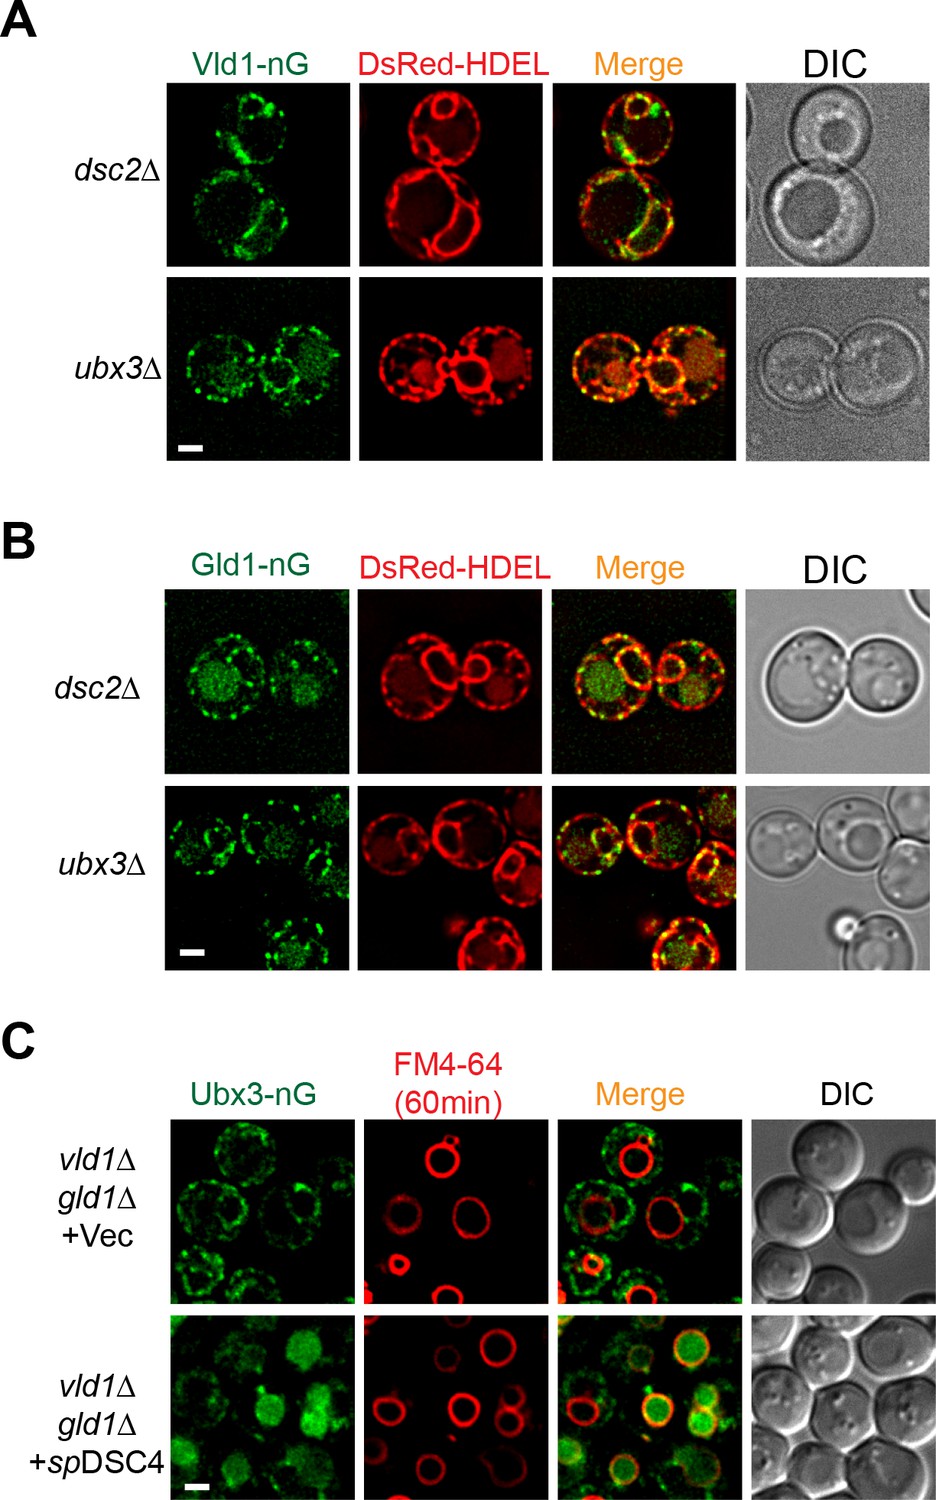
Both Vld1-nG and Gld1-nG are trapped in the ER after deleting either DSC2 or UBX3.
(A) Co-localization of Vld1-nG punctae with the ER marker DsRed-HDEL in either dsc2∆ or ubx3∆ strains. (B) Co-localization of Gld1-nG punctae with the ER marker DsRed-HDEL in either dsc2∆ or ubx3∆ strains. (C) Localization of Ubx3-nG in vld1∆ gld1∆ cells expressing either an empty vector or spDsc4. The vacuoles were labeled with fluorescent dye FM4-64. Scale bar: 2 µm.
Figure 7
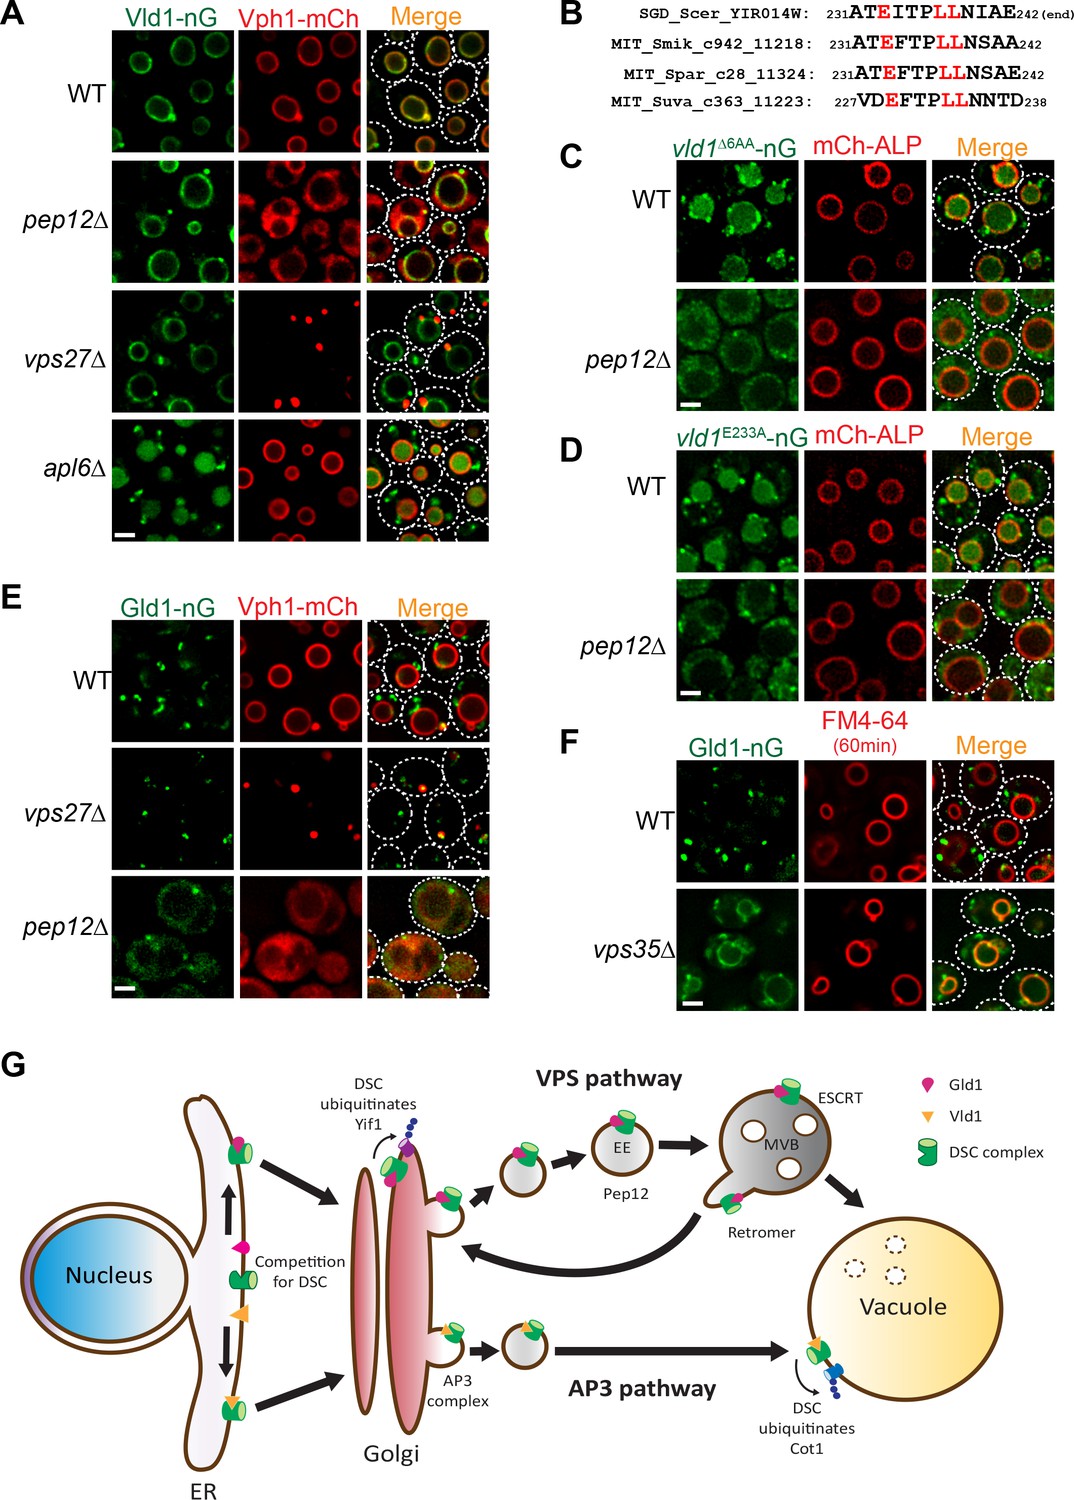
Vld1 and Gld1 subcomplexes travel through the AP3 and VPS pathways, respectively.
(A) Subcellular localizations of Vld1-nG and Vph1-mCh in WT, pep12∆, vps27∆, and apl6∆ cells. (B) Vld1 contains a conserved acidic di-leucine motif at its C-terminus. (C) Subcellular localizations of vld1∆6AA-nG (last 6 amino acids of Vld1 deleted) in WT cell and pep12∆ cells. (D) A single E233 to A mutation caused the trafficking defects of vld1E233A-nG in both WT and pep12∆ cells. (E) Subcellular localizations of Gld1-nG and Vph1-mCh in WT, vps27∆, and pep12∆ cells. (F) Subcellular localizations of Gld1-nG in WT and vps35∆ cells. (G) A model summarizing the key findings of this study. White dashed lines indicate the periphery of yeast cells. Scale bar: 2 µm.
Tables
Key resources table
| Reagent type (species) or resource | Designation | Source or reference | Identifiers | Additional information |
|---|---|---|---|---|
| Strain, strain background (54 yeast strains) | please find in Supplementary file 1 | |||
| Transfected construct (11 yeast constructs) | please find in Supplementary file 1 | |||
| Antibody | rabbit anti-G6PDH | Sigma-Aldrich | A9521 | |
| Antibody | mouse anti-GFP | Santa Cruz Biotechnology, Inc. | SC9996 | |
| Antibody | mouse anti-Flag | Sigma-Aldrich | F7425 | |
| Antibody | rabbit anti-HA | Life technologies | 715500 | |
| Antibody | mouse anti-HA | Sigma-Aldrich | 12CA5 | |
| Antibody | mouse anti-Vph1 | Invitrogen | 10D7 | |
| Antibody | rabbit anti-GFP | Torrey Pines Biolabs | TP401 | |
| Antibody | M2 anti-FLAG resin | Sigma-Aldrich | A2426 | |
| Antibody | anti-HA resin | Sigma-Aldrich | E6779 | |
| Peptide | 3xFlag peptide | Sigma-Aldrich | F3290 | |
| Chemical compound | Rapamycin | LC Laboratories | ASW-135 | |
| Chemical compound | Doxycycline | Fisher BioReagents | 162209 | |
| Chemical compound | zymolyase | Amsbio | 120493–1 | |
| Chemical compound | FM4-64 | Invitrogen | T3166 | |
| Chemical compound | Protease Inhibitor Cocktail | Roche | 21169500 |
Additional files
-
Supplementary file 1
Yeast strains and plasmids used in this study.
- https://doi.org/10.7554/eLife.33116.016
-
Transparent reporting form
- https://doi.org/10.7554/eLife.33116.017
Download links
A two-part list of links to download the article, or parts of the article, in various formats.
Downloads (link to download the article as PDF)
Open citations (links to open the citations from this article in various online reference manager services)
Cite this article (links to download the citations from this article in formats compatible with various reference manager tools)
Sorting of a multi-subunit ubiquitin ligase complex in the endolysosome system
eLife 7:e33116.
https://doi.org/10.7554/eLife.33116


