A sleep state in Drosophila larvae required for neural stem cell proliferation
- Perelman School of Medicine at the University of Pennsylvania, United States
- University of Pennsylvania, United States
Figures
Figure 1 with 1 supplement
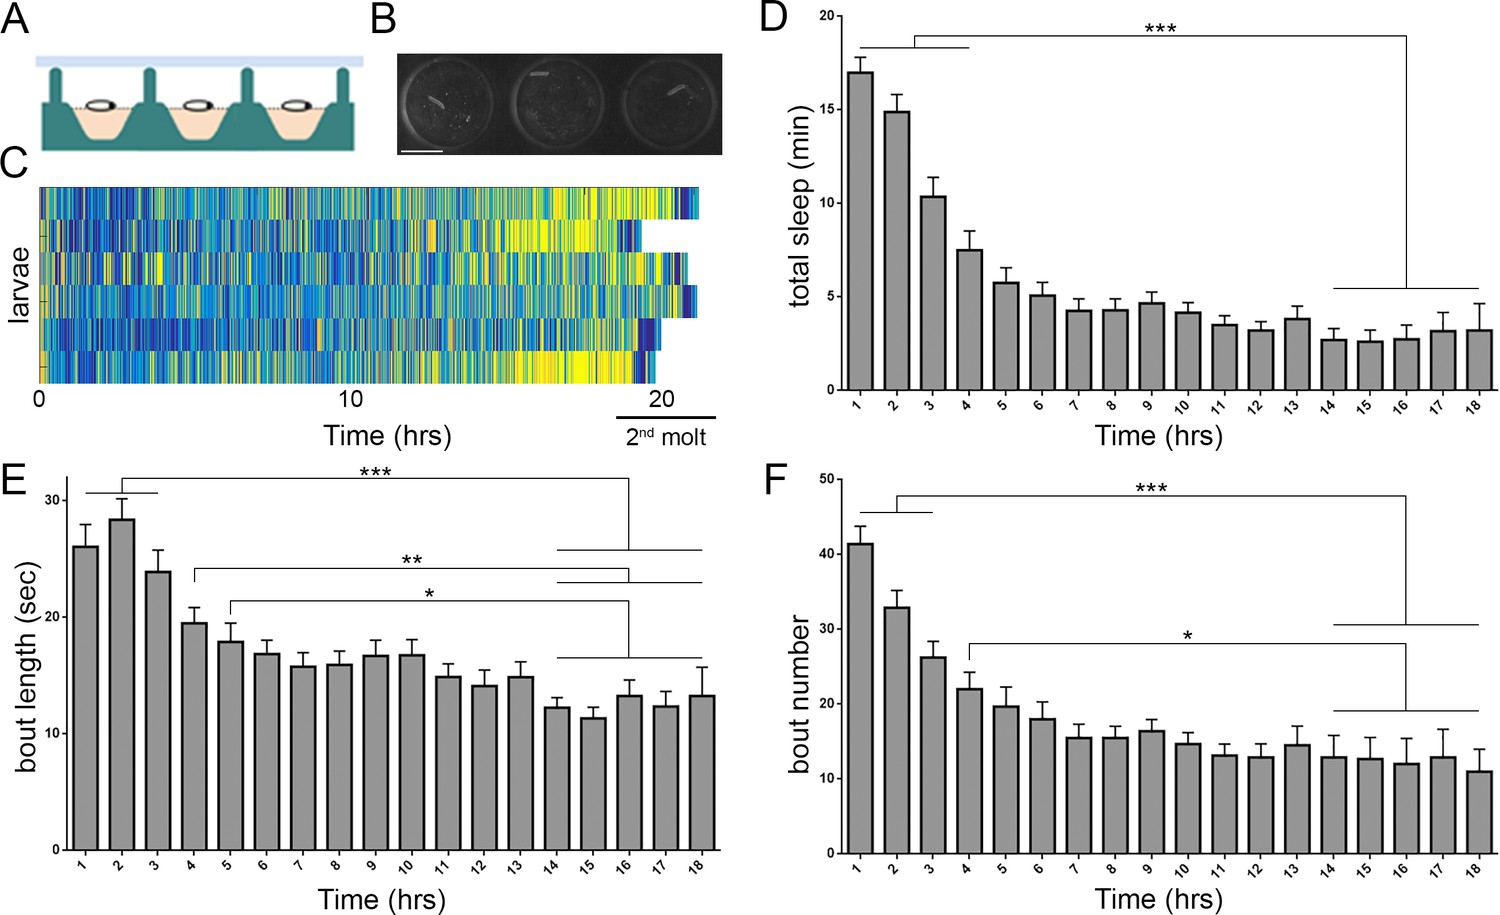
Prolonged monitoring of larval behavior in LarvaLodge devices.
(A) Schematic of a cross section through the device. PDMS (silicone) is in green, agar in pink, and ceiling above in light blue. (B) Image of 3 LarvaLodge wells containing individual second instar larvae. (C) Heat map of activity of 6 larvae monitored from early second instar through second molt (blue = inactive, yellow = high activity). Quantification of total quiescence (D), quiescence bout length (E), and quiescence bout number (F) in hourly bins throughout the second instar stage (n = 20 larvae). In this and other figures, *p≤0.05; **p<0.01; ***p<0.001; error bars = SEM. Scale bar = 5 µm.
Figure 1—figure supplement 1
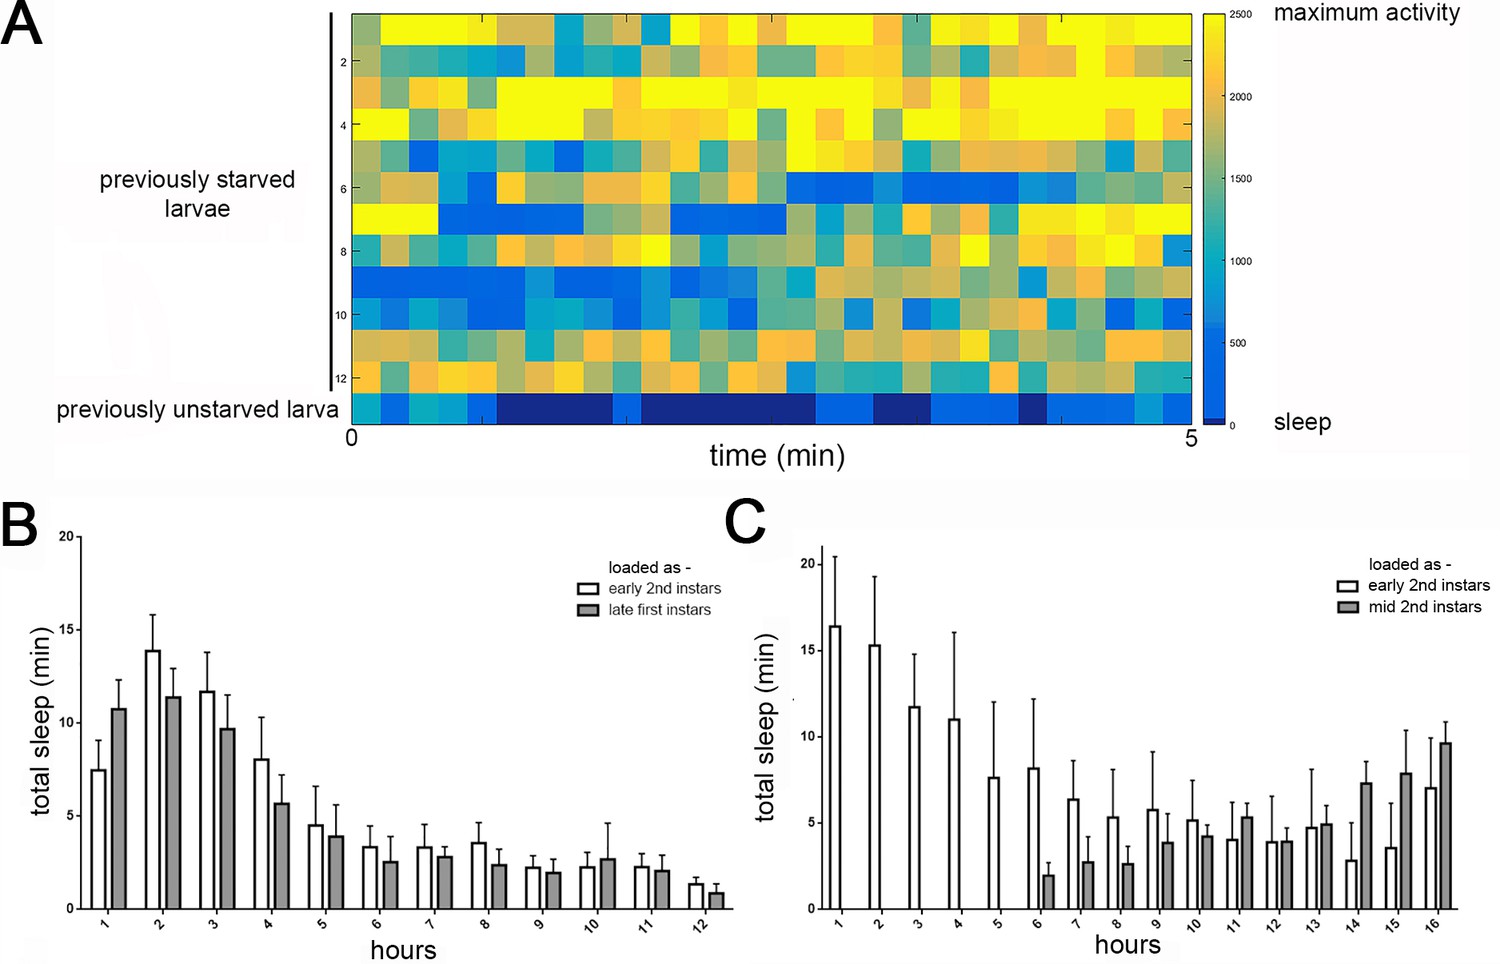
Detection of feeding and temporal distribution of quiescence in LarvaLodges.
(A) Activity heat map of 12 previously starved larvae during a period of confirmed feeding demonstrates that feeding behaviors are detected as activity in our system, without periods mistaken for behavioral quiescence (i.e., no dark blue). Bottom row shows the activity of a previously unstarved larva exhibiting typical periods of quiescence (dark blue). (B) Increased quiescence in early second instar larvae is observed whether animals are loaded in the LarvaLodge as newly-molted second instars (white bars) or late first instars and allowed to molt into second instars (gray bars). All sleep data is during the second instar period, with hours on the x-axis representing length of sleep assay beginning 2 hr after the molt to second instar. (C) Reduced quiescence in mid/late second instar larvae is observed whether animals are loaded in LarvaLodge as newly-molted second instars (white bars) or mid second instars (gray bars), demonstrating that reduced sleep as mid/late second instars reflects an endogenous developmental sleep pattern, not temporal proximity to handling of the larvae.
Figure 2

Drosophila larval quiescence meets behavioral criteria for sleep.
Image of a larva before (A) and after (B) postural change associated with sleep. Yellow arrow indicates head retraction. Quantification of postural change frequency associated with 18 s sleep bout length (C) (n = 104 sleep episodes) or ≥36 s sleep bout length (D) (n = 107 sleep episodes) (white=% sleep episodes with postural change (+PC); light gray = no postural change (-PC); dark gray = not determined). (E) Quantification of larval length/width ratio before and after postural change. (F) Percentage of larvae aroused from quiescence using a high intensity (black bar, n = 187 sleep episodes) or low intensity stimulus (gray, n = 119 sleep episodes).~20% of larvae wake spontaneously in absence of a stimulus (white, n = 312). (G) Probability of spontaneous activity (black) or continued quiescence (gray) following a defined period of inactivity (n = 274, 88, 53, 59, 52 quiescent episodes from left to right).
Figure 3 with 2 supplements
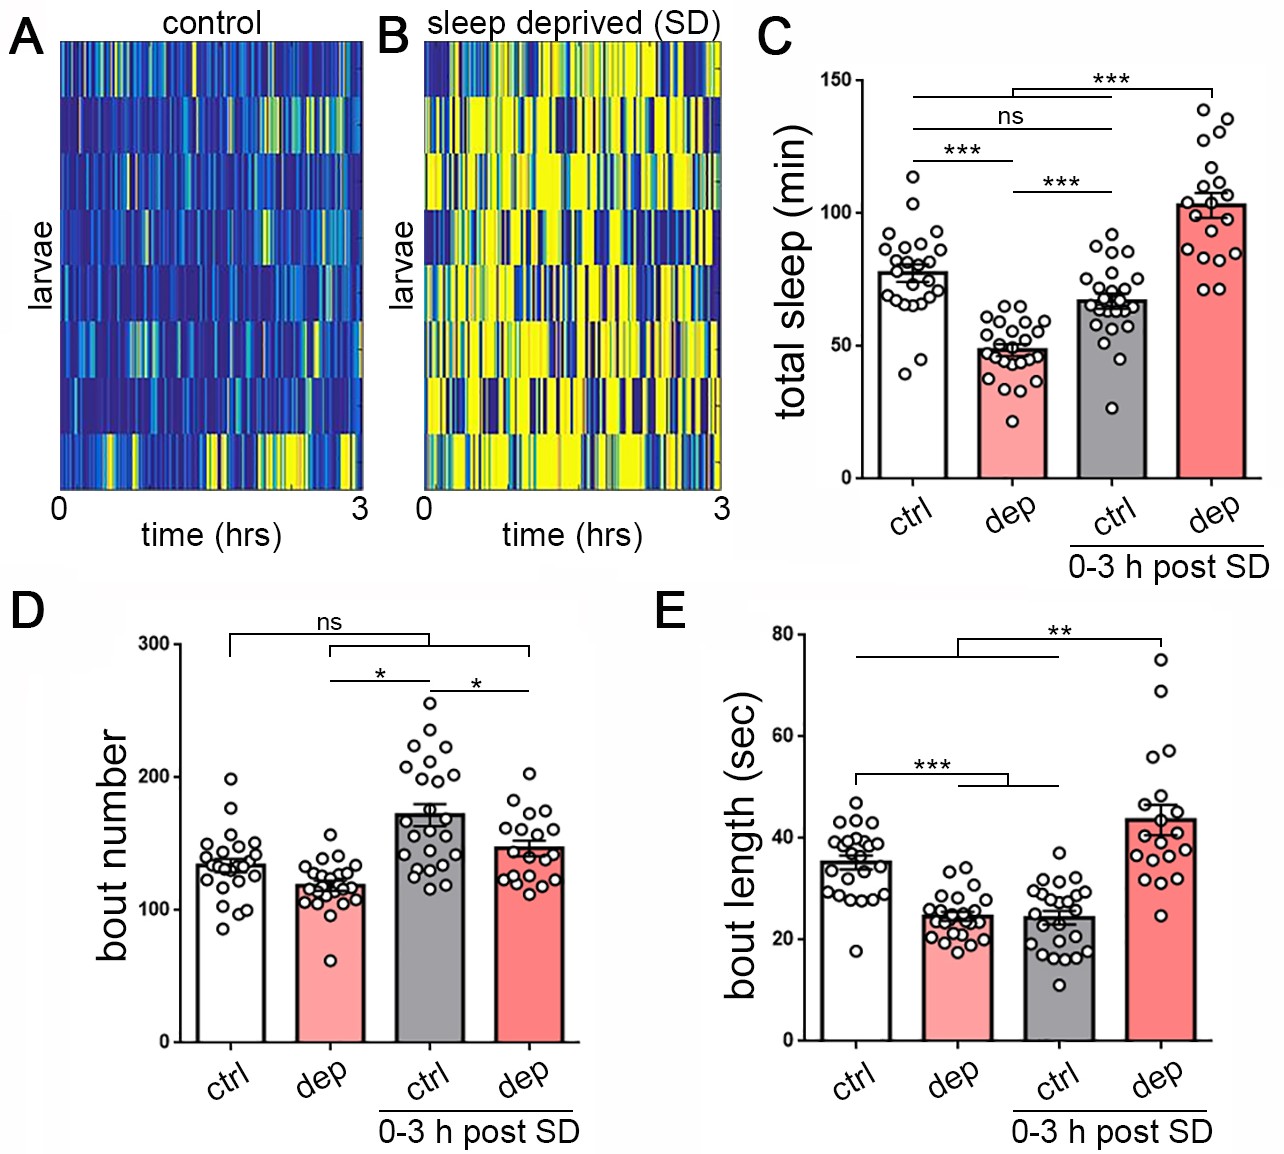
Homeostatic sleep rebound following enforced sleep loss in Drosophila larvae.
(A, B) Activity heat map of 8 control larvae (A) and eight sleep-deprived larvae (B) during light-based sleep deprivation assay demonstrates reduced quiescence (blue) and increased activity (yellow) throughout the 3 hr deprivation period. (C) Quantification of sleep deprivation (SD) over 3 hr with a repetitive light stimulus (white = control, n = 24 larvae; light red = deprived, n = 24) and subsequent sleep rebound (dark red = previously deprived, n = 18; gray = non deprived assayed during the same period, n = 24). (D,E) Quantification of sleep bout number and length during the 3 hr deprivation period and subsequent rebound (0–3 hr post SD) demonstrates that sleep loss derives from reduced sleep bout length (E). Increased total sleep during the rebound period is more consolidated, with reduced bout number (D) and increased bout length (E).
Figure 3—figure supplement 1
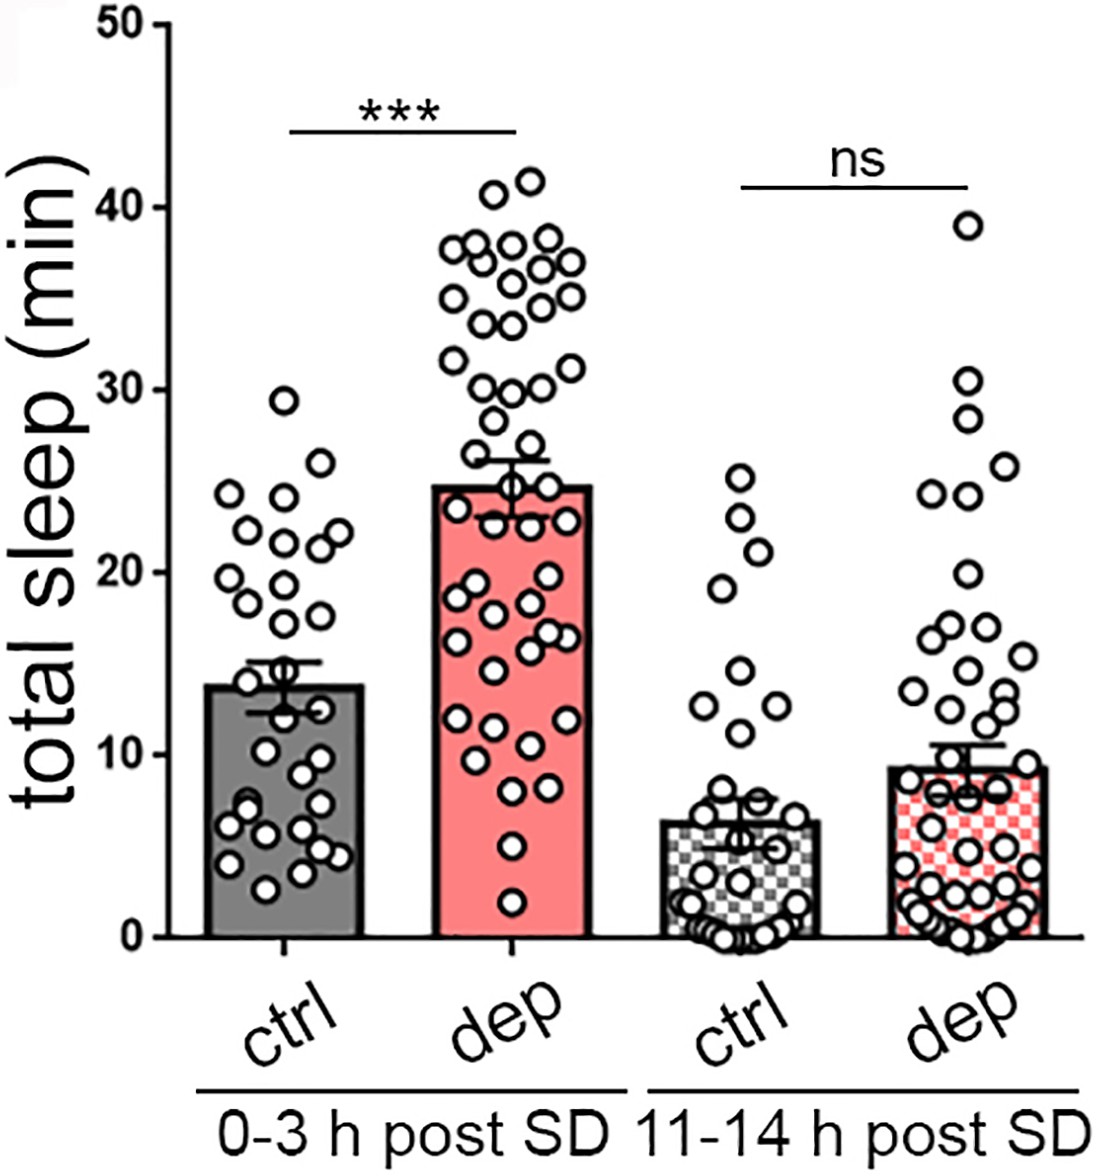
Homeostatic sleep rebound following mechanical sleep deprivation (SD).
Following mechanical sleep deprivation, larvae also exhibit increased total sleep (0–3 hr post SD). Long-term monitoring after sleep deprivation demonstrates the absence of permanent effects on sleep (11–14 hr post SD).
Figure 3—figure supplement 2
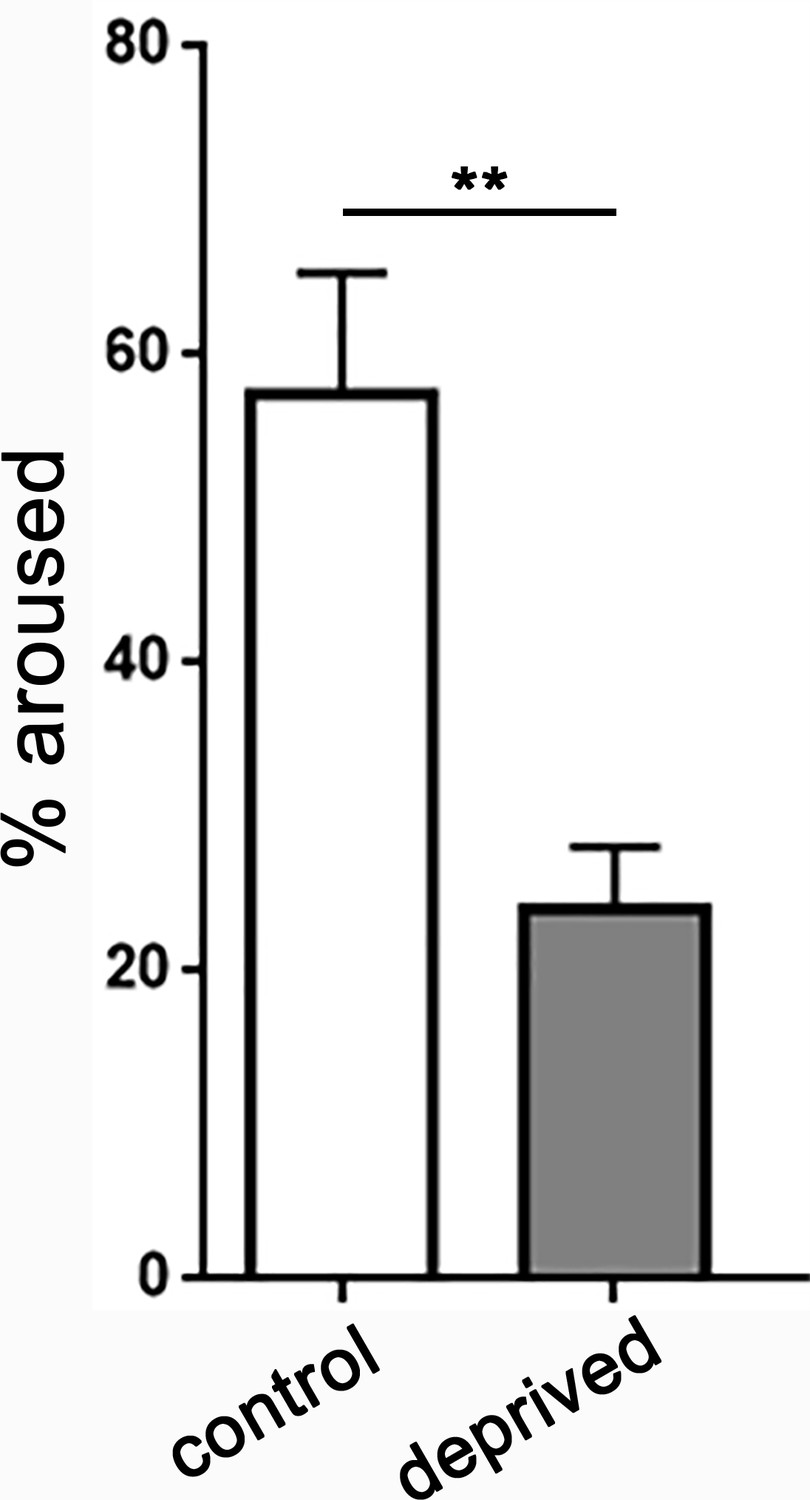
Increased sleep depth following sleep deprivation.
Quantifying the percentage of larvae aroused from quiescence using a low intensity stimulus (irradiance 3.98 µW/mm2) demonstrates increased arousal threshold in sleep deprived larvae (n = 245 sleep episodes) compared to non-deprived controls (n = 124).
Figure 4 with 2 supplements
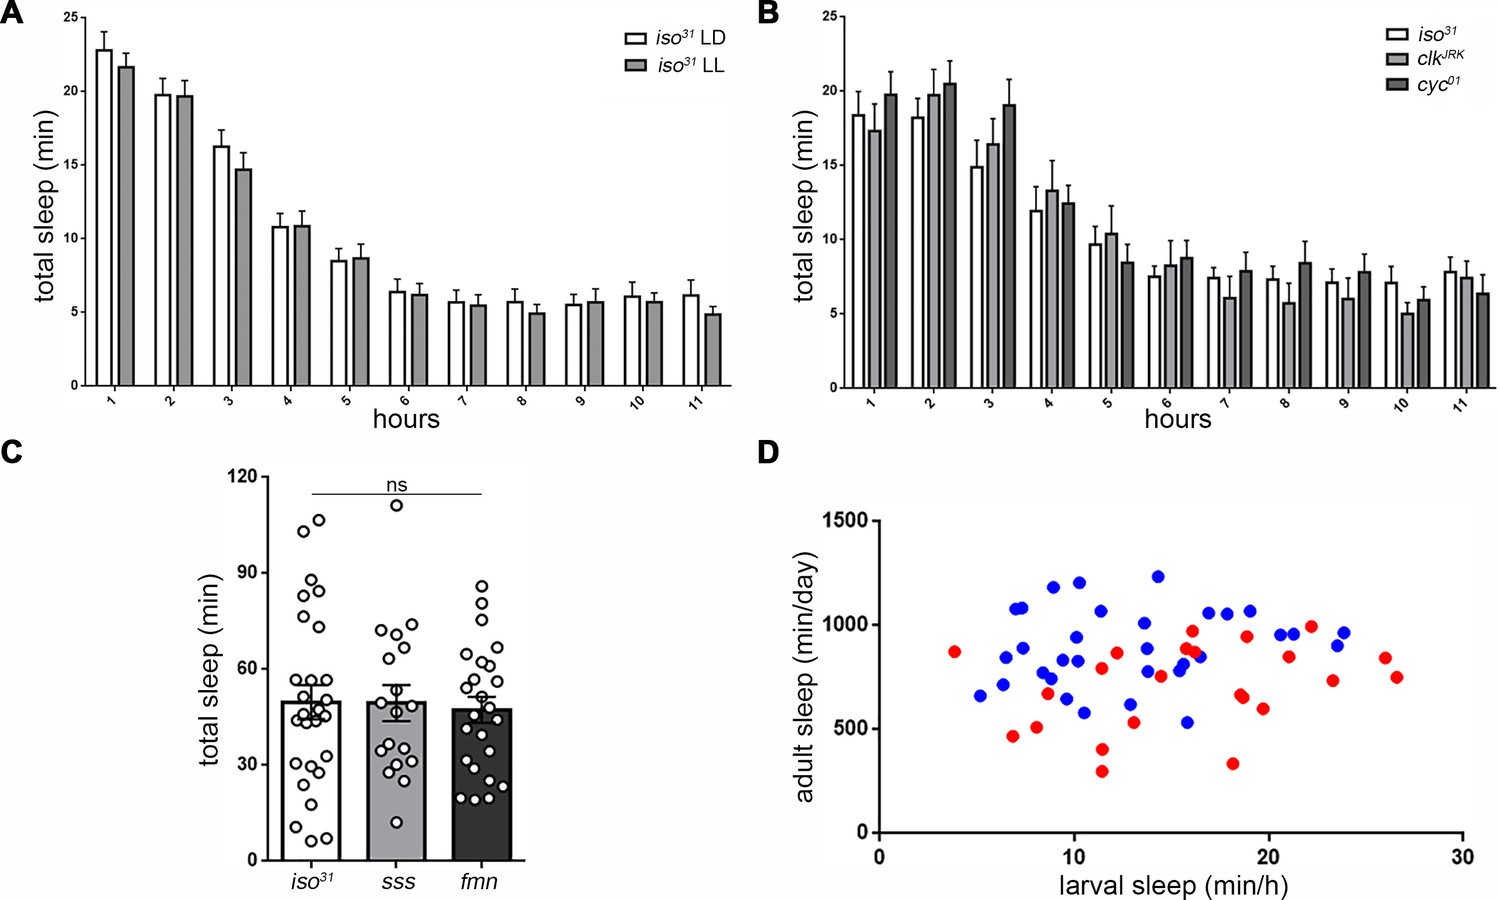
Sleep regulatory mechanisms are distinct between larval and adult stages in Drosophila.
(A) Quantification of sleep in hourly bins demonstrates that sleep amount and distribution are unchanged with rearing of embryos/larvae in constant light (LL; n = 27) compared to normal 12:12 light:dark cycles (LD; n = 29). (B) Sleep is unaffected in molecular clock mutants clkJrk and cyc01 (n = 16,18,21). All sleep assays were conducted in constant dark under infrared light condition. (C) Quantification of larval total sleep over 6 hr in mutants known to be short-sleepers as adults (iso31 controls, sleepless [sss], and fumin [fmn]; n = 27,18,24 larvae from left to right). (D) No correlation is found between larval and adult sleep time (slope of linear regression line is not significantly different from zero). Sleep is sexually dimorphic in adults (Female (F) < Male (M); the red points (F) are distributed on the y axis lower than the blue points (M)), but not in larvae (red and blue points are evenly distributed on the x axis) (M; n = 34; F; n = 25).
Figure 4—figure supplement 1
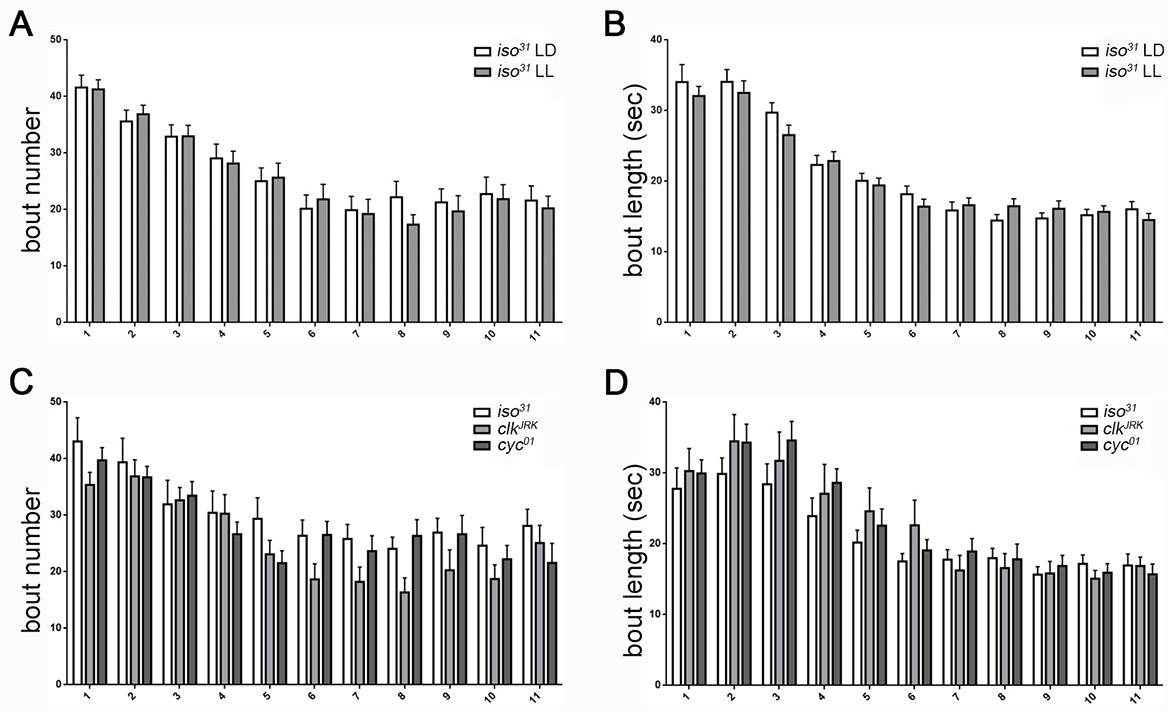
Temporal distribution of larval sleep is independent of the circadian clock.
(A,B) Quantification of sleep in hourly bins demonstrates that sleep metrics and patterns are unchanged with rearing of embryos/larvae in constant light (LL; n = 27) compared to normal 12:12 light:dark cycles (LD; n = 29). (C,D) Sleep pattern is unaffected in molecular clock mutants clkJrk and cyc01 (n = 16,18,21). All sleep assays were conducted in constant dark under infrared light conditions.
Figure 4—figure supplement 2

Drosophila larval sleep in adult sleep mutants.
(A,B) The adult short-sleeping mutant sleepless (sss) exhibits similar larval sleep metrics to genetic controls (iso31). The adult short-sleeping mutant fumin (fmn), despite having fragmented sleep in adulthood, actually shows significantly more consolidated sleep (fewer, longer sleep bouts) in larval stages compared to controls, though overall sleep amount is unchanged (Figure 4A) (n = 27,18,23 in A and B).
Figure 5 with 4 supplements
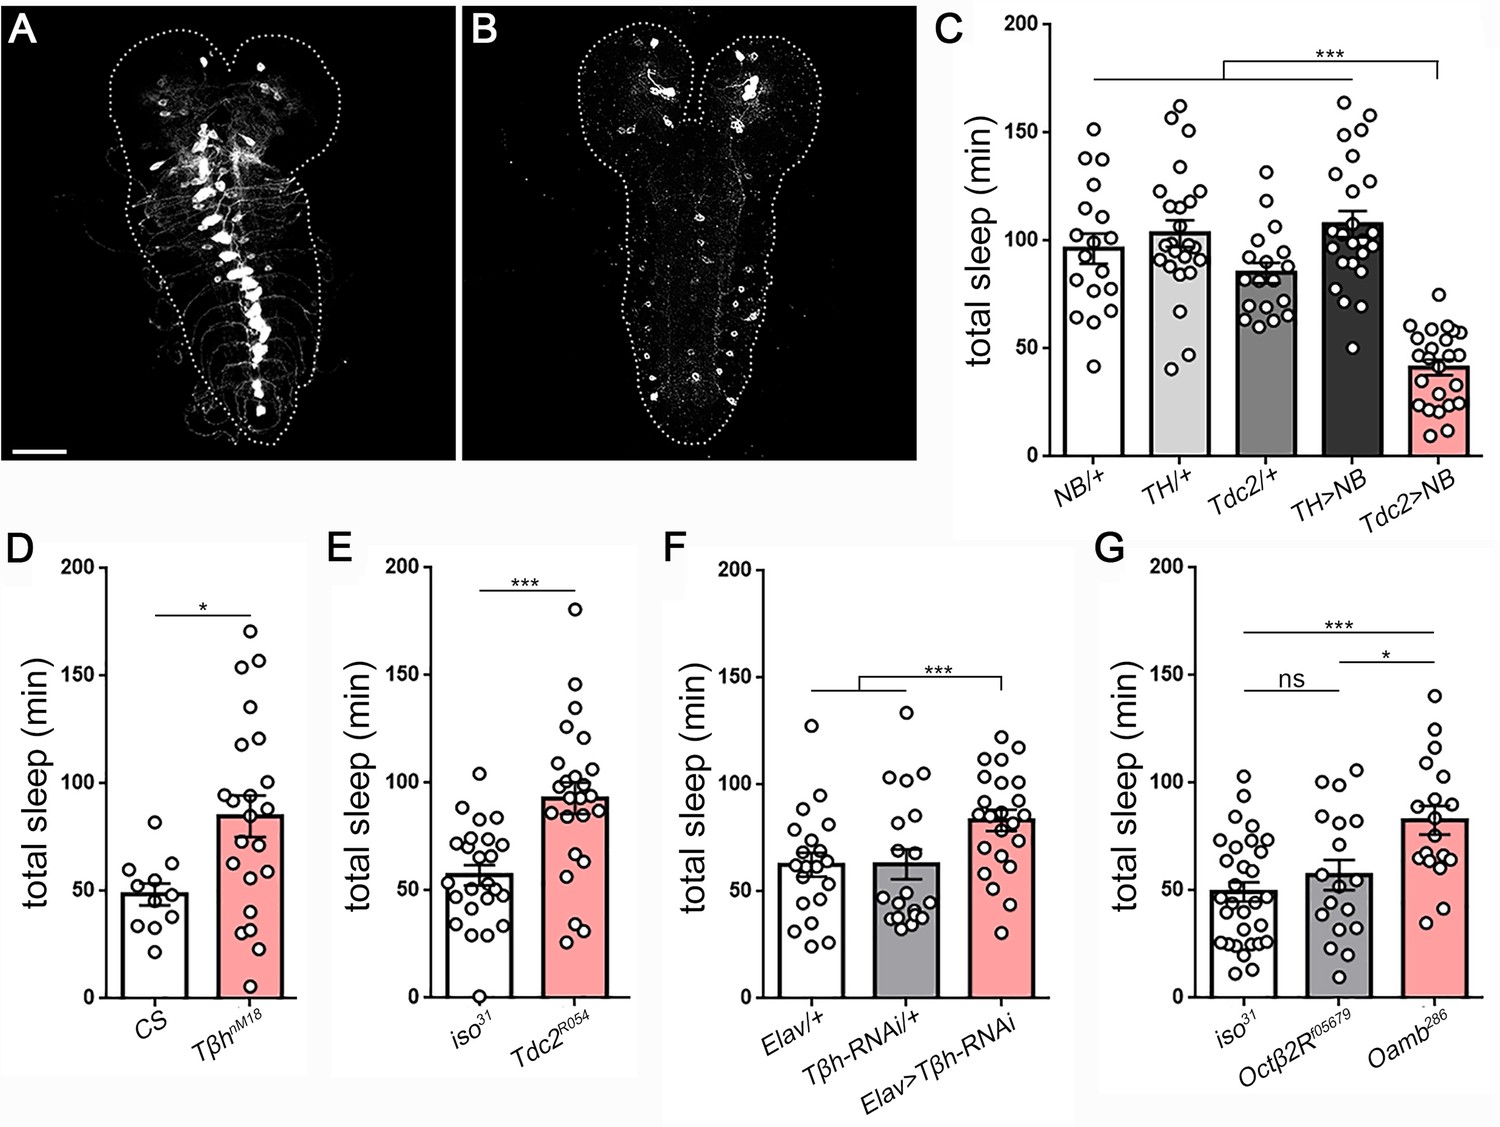
Octopamine controls sleep/wake in Drosophila larvae.
Second instar larval brain and ventral nerve cord showing GFP expression in (A) octopamine neurons (Tdc2-GAL4 > UAS-CD8::GFP) and (B) dopamine neurons (TH-GAL4 >UAS-CD8::GFP). Scale bar = 50 µm. (C) Total sleep with activation of octopamine neurons (red bar; Tdc2-GAL4 > UAS NachBac [Tdc2 >NB]) or dopamine neurons (TH-GAL4 >UAS NachBac [TH >NB]), and genetic controls (n = 18,24,18,24,24). Larval sleep in Tβh mutants (D) (n = 11,21), Tdc2 mutants (E) (n = 24,24), following Tβh knockdown in the nervous system (Elav-GAL4 >UAS-Tβh RNAi) (F) (n = 20,21,23), and in octopamine receptor mutants (G) (n = 30,18,19).
Figure 5—figure supplement 1
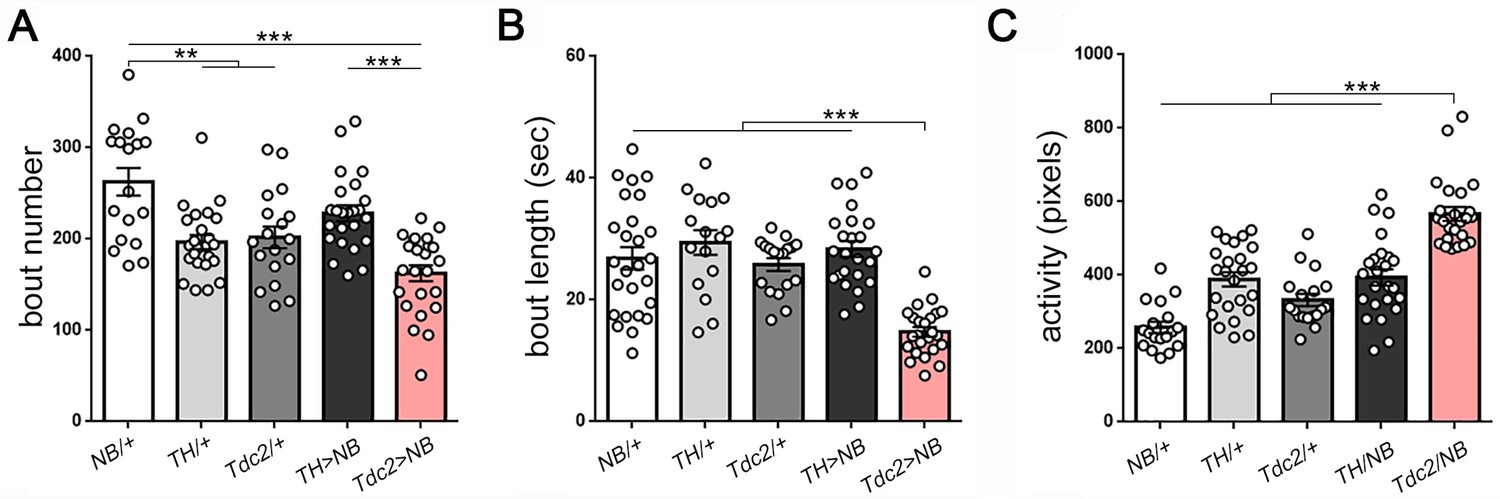
Activation of octopamine neurons reduces sleep in Drosophila larvae.
(A–C) Reduced sleep with activation of octopamine neurons (red bar; Tdc2-GAL4 > UAS NachBac [Tdc2 > NB]) results primarily from decreased bout length compared to all genetic controls (B) (A–C): n = 18,24,18,24,24).
Figure 5—figure supplement 2
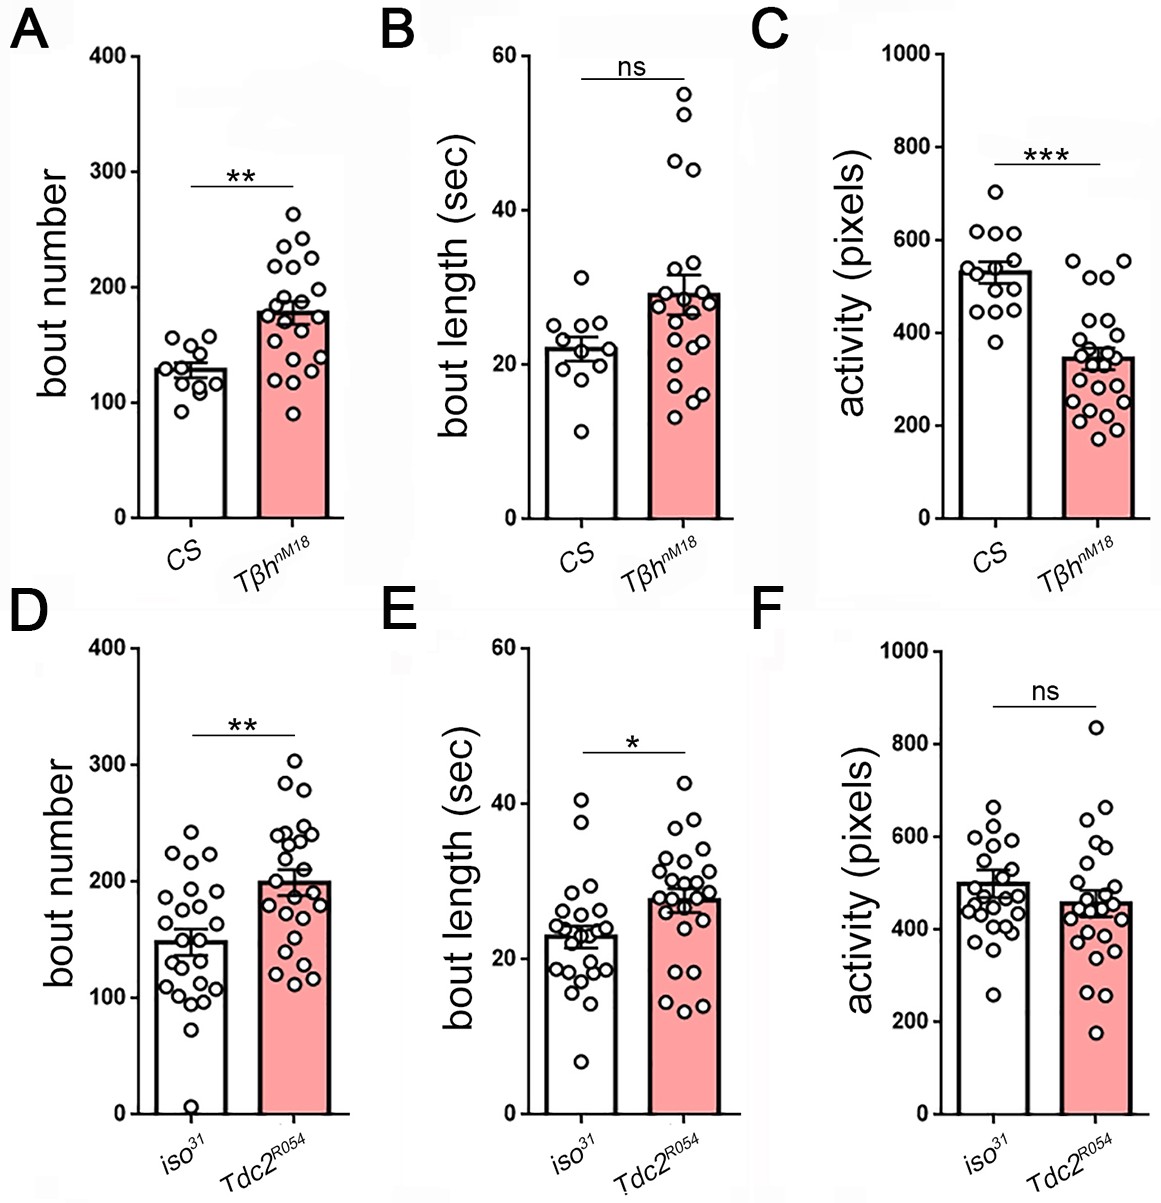
Measures of larval sleep quality in octopamine synthesis mutants.
Larval sleep bout number and length in Tβh (A,B): n = 11,21) and Tdc2 mutants (D,E): n = 24,24). Activity is reduced in Tβh (C) but not in Tdc2 (F) mutants, demonstrating that activity is dissociable from sleep.
Figure 5—figure supplement 3
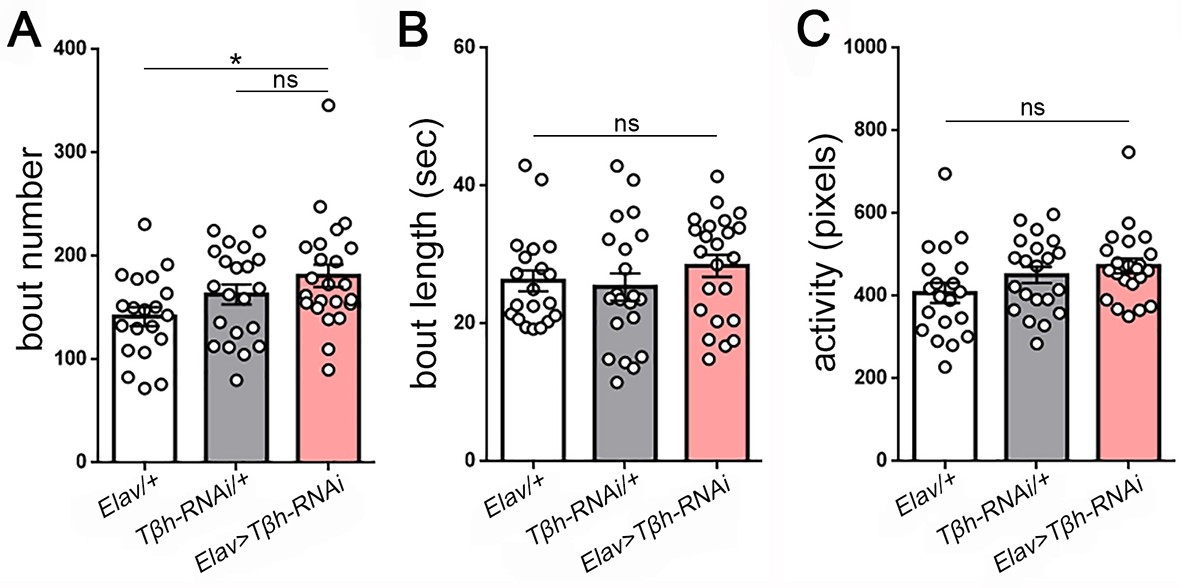
Measures of larval sleep quality following knockdown of Tβh in the nervous system.
(A–C) Increased sleep following Tβh knockdown in the nervous system (Elav-GAL4 > UAS-Tβh RNAi) results from non-significant increases in both bout number and length (n = 20,21,23).
Figure 5—figure supplement 4
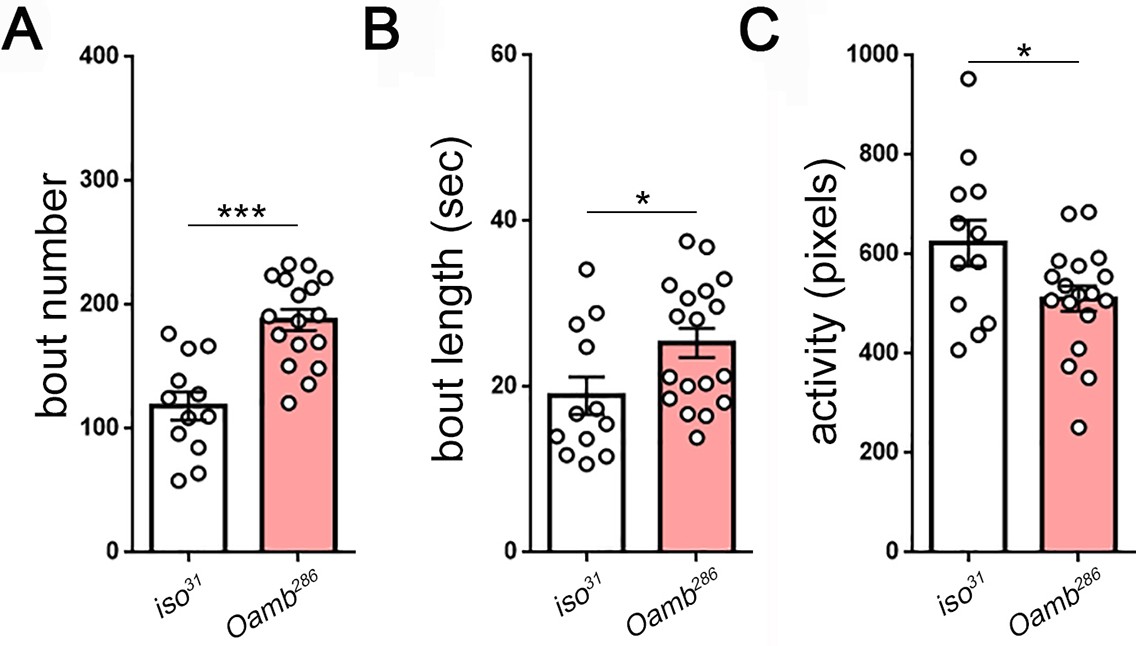
Measures of larval sleep quality in OAMB mutants.
(A–C) Increased sleep in Oamb mutants results from increased sleep bout number and length (n = 12,18).
Figure 6 with 1 supplement
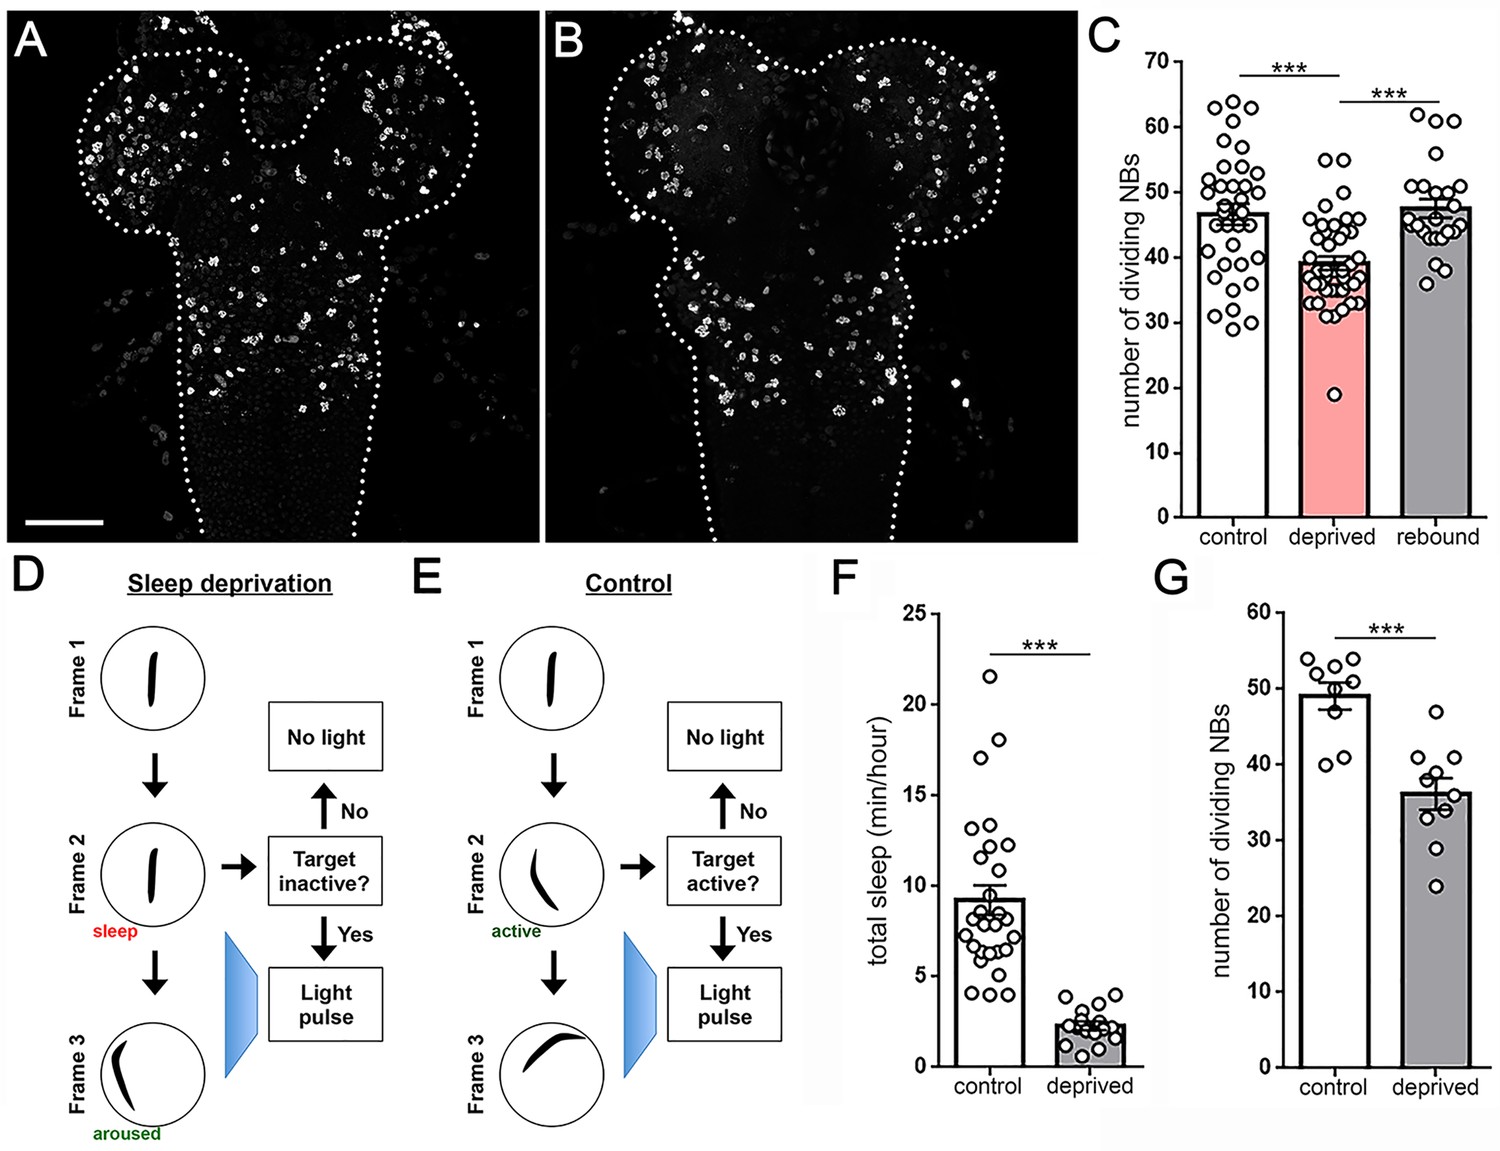
Larval sleep deprivation attenuates proliferation of neural progenitor cells.
Image of second instar larval brain and ventral nerve cord (dashed outline) labeled with anti-PH3 (dividing cells) following normal sleep (A) or 3 hr of sleep deprivation (B). (C) Quantification of dividing cells in controls, after sleep deprivation, and following recovery sleep (n = 35, 42, 24 larvae per condition). (D,E) Schematic of closed-loop sleep deprivation system (D) and control (E). (F) Total sleep per hour in larvae exposed to light stimulus in a closed-loop system during only wake (control, n = 28) or only sleep (deprived, n = 16). (G) Quantification of dividing cells in controls (n = 9) or after sleep deprivation (n = 10) using a closed-loop system. Scale bar = 40 µm.
Figure 6—figure supplement 1
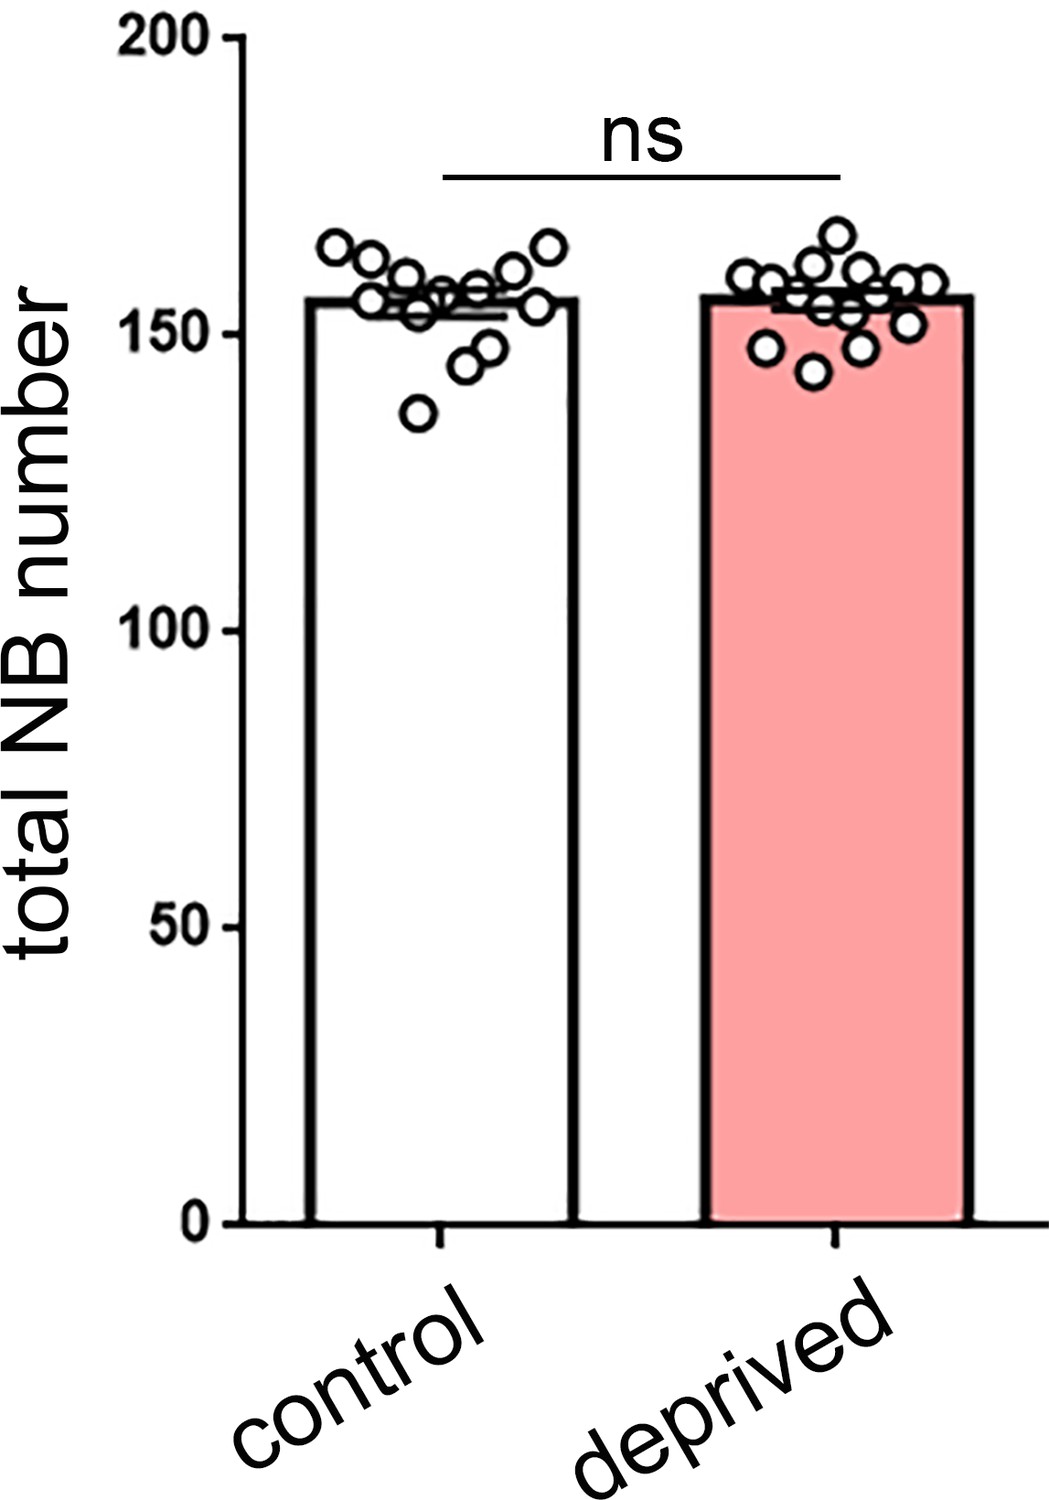
Total neuroblast number is not altered by sleep deprivation.
Quantification of total neuroblast (NB) number in control (n = 13) or sleep-deprived (n = 15) larvae demonstrates that the total pool of NBs (dividing and non-dividing) is not changed following sleep deprivation. p=0.872.
Author response image 1

Labeling of MB neuroblasts (NBs) in second instar larval brains.
Each panel (A-D) is a single hemisphere from four different second instar larval brains. MB lineages (green) are labeled by EdU that was pulsed for 2 hours during mid first instar stages. All NBs are labeled with anti-Deadpan (red), and dividing cells are labeled with anti-PH3 (magenta). MB NBs (yellow arrows) can be identified by location with regard to MB lineages. Most MB NBs at any point in time do not appear to be actively dividing (absence of PH3). Rarely (D, white arrow) we were able to clearly identify a MB NBs that was PH3+. Scale bar = 10μm.
Author response image 2
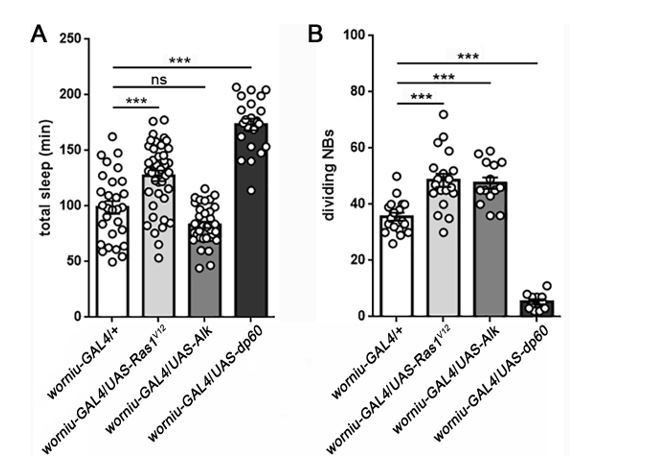
Sleep following manipulation of NB division.
Total sleep (A) and quantification of number of dividing NBs (B) shows that the relationship between proliferation rate and sleep is mixed. Expression of UAS-Ras1V12or UAS-Alk in NBs (using worniu-GAL4) results in a comparable increase in NB division, but only UAS-Ras increases sleep. In contrast, expression of UAS-dp60 causes a dramatic reduction in dividing NBs, but sleep is increased. For sleep experiments, n=29, 41, 35, 22 larvae from left to right. For measurement of dividing NBs, n=18, 19, 14, 11 brains from left to right. ***P<0.0001. ANOVA with Tukey’s test. (We thank Dr. Sarah Siegrist for worniu-GAL4 and UAS-dp60).
Videos
Video 1
Time-lapse video of twenty second instar larvae in the LarvaLodge.
For this and all videos, frames are acquired every 6 s and videos are shown at six frames per second (36x faster than real time).
Video 2
Time-lapse (36x) of a second instar larva exhibiting transitions between activity and quiescence.
Quiescence bouts occur at 00:07 and 00:15. The quiescent bout occurring from 00:07 to ~ 00:12 lasts ~ 180 s.
Video 3
Time-lapse (36x) of a second instar larva demonstrating feeding behaviors, which are detected as activity in our system.
Feeding begins at time = 00:12 and is characterized by pumping and sweeping head motions, during which the underlying food begins to disappear.
Video 4
Time-lapse (36x) of a second instar larva exhibiting a postural change (head retraction) associated with quiescence.
Quiescence bout begins at 00:09, followed by postural change at 00:11, and then continued quiescence.
Video 5
Time-lapse (36x) of a second instar larva demonstrating rapid reversibility of quiescence.
Quiescence begins at 00:02, and the light stimulus occurs at 00:05.
Tables
Key resources table
| Reagent type (species) or resource | Designation | Source or reference | Identifiers | Additional information |
|---|---|---|---|---|
| gene (Drosophila melanogaster) | clock | NA | FLYB:FBgn0023076 | |
| gene (D. melanogaster) | cycle | NA | FLYB:FBgn0023094 | |
| gene (D. melanogaster) | sleepless | NA | FLYB:FBgn0260499 | |
| gene (D. melanogaster) | DAT | NA | FLYB:FBgn0034136 | |
| gene (D. melanogaster) | Oamb | NA | FBgn0024944 | |
| gene (D. melanogaster) | Octβ2R | NA | FBgn0038063 | |
| gene (D. melanogaster) | Tdc2 | NA | FBgn0050446 | |
| gene (D. melanogaster) | Tbh | NA | FBgn0010329 | |
| genetic reagent (D. melanogaster) | iso31 | Dr. Amita Sehgal | ||
| genetic reagent (D. melanogaster) | clockjrk | Allada et al., 1998 | FLYB:FBal0090722 | |
| genetic reagent (D. melanogaster) | cyc01 | Rutila et al., 1998 | FBal0195440 | |
| genetic reagent (D. melanogaster) | sssP1 | Koh et al., 2008 | FBal0121566 | |
| genetic reagent (D. melanogaster) | fumin | Kume et al., 2005 | FBal0197506 | |
| genetic reagent (D. melanogaster) | Oamb286 | Lee et al., 2003 | FBal0152344 | |
| genetic reagent (D. melanogaster) | Octβ2Rf05679 | Bloomington Drosophila Stock Center | FBal0161089 | |
| genetic reagent (D. melanogaster) | Tdc2R054 | Cole et al., 2005 | ||
| genetic reagent (D. melanogaster) | TbhnM18 | Monastirioti et al., 1996 | FBal0061578 | |
| genetic reagent (D. melanogaster) | UAS-NachBac | Nitabach et al., 2006 | FBtp0021523; BDSC:9469 | |
| genetic reagent (D. melanogaster) | TH-Gal4 | Friggi-Grelin et al., 2003 | FBtp0114847; BDSC:8848 | |
| genetic reagent (D. melanogaster) | Tdc2-Gal4 | Bloomington Drosophila Stock Center | FBtp0056985; BDSC:9313 | |
| genetic reagent (D. melanogaster) | Elav-Gal4 | Bloomington Drosophila Stock Center | FBtp0000743; BDSC:8765 | |
| genetic reagent (D. melanogaster) | UAS-CD8::GFP | Bloomington Drosophila Stock Center | FBtp0002652 | |
| genetic reagent (D. melanogaster) | Tbh-RNAi | Vienna Drosophila Resource Center | FBst0478893; VDRC:107070 | |
| antibody | anti-Miranda | Abcam | Abcam:ab197788 | (1:50) |
| antibody | anti-Ph3 | Invitrogen | Invitrogen: PA5-17869 | (1:1000) |
| antibody | anti-GFP | ThermoFisher Scientific | ThermoFisher Scientific: A-11122 | (1:1000) |
Additional files
-
Source code 1
Matlab code ‘Arousal and Sleep Deprivation’ was used to apply blue light stimulus with various length and interval to achieve either sleep deprivation or to produce arousal stimulus.
- https://doi.org/10.7554/eLife.33220.024
-
Source code 2
Matlab code ‘Closed Loop Analysis’ was applied to perform closed loop sleep deprivation, delivering the blue light stimulus whenever a >6 s period of quiescence was detected.
- https://doi.org/10.7554/eLife.33220.025
-
Source code 3
Matlab code ‘Closed Loop Awake Stimulus’ was used for control experiments to deliver the arousal stimulation whenever a > 18 s period of continuous activity was detected.
- https://doi.org/10.7554/eLife.33220.026
-
Transparent reporting form
- https://doi.org/10.7554/eLife.33220.027
Download links
A two-part list of links to download the article, or parts of the article, in various formats.
Downloads (link to download the article as PDF)
Open citations (links to open the citations from this article in various online reference manager services)
Cite this article (links to download the citations from this article in formats compatible with various reference manager tools)
A sleep state in Drosophila larvae required for neural stem cell proliferation
eLife 7:e33220.
https://doi.org/10.7554/eLife.33220


