IFN-λ prevents influenza virus spread from the upper airways to the lungs and limits virus transmission
- Medical Center, University of Freiburg, Germany
- Albert Ludwigs University Freiburg, Germany
- Aarhus University, Denmark
- University of Geneva, Switzerland
- University of Freiburg, Germany
Figures
Figure 1 with 1 supplement
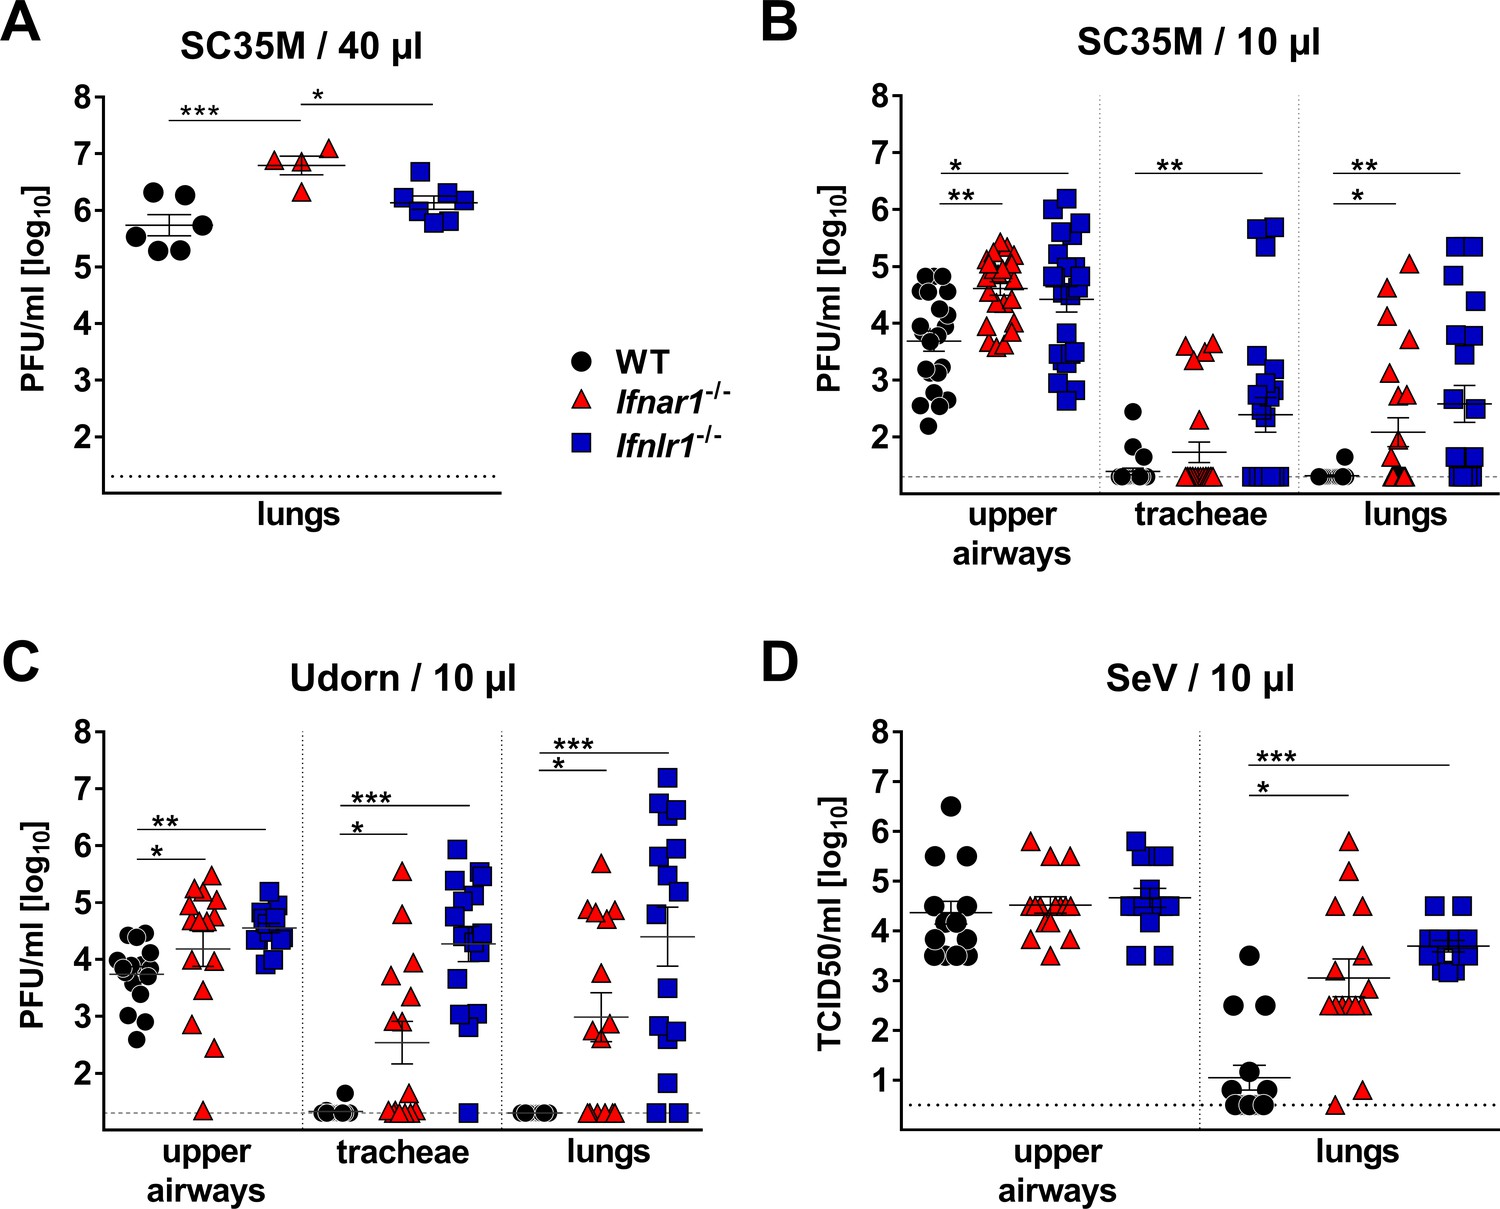
IFN-λ prevents virus spread from the upper airways to the lungs of mice.
(A) Standard intranasal delivery of virus inoculum: WT (n = 6), Ifnar1−/− (n = 4) and Ifnlr1−/− (n = 7) mice were intranasally infected with 104 PFU of SC35M in a volume of 40 µl, and viral titers in the lungs were determined on day three post infection by plaque assay. (B–D) Selective virus delivery to the upper respiratory tract: (B) WT (n = 22), Ifnar1−/− (n = 23) and Ifnlr1−/− (n = 23) mice were intranasally infected with 104 PFU of SC35M in a volume of 10 µl. Mice were sacrificed on day five post infection, and viral titers in the upper airways, tracheae and lungs were determined by plaque assay. Pooled results from three independent experiments are shown. (C) WT (n = 16), Ifnar1−/− (n = 15) and Ifnlr1−/− (n = 16) mice were intranasally infected with 5 × 10³ PFU of Udorn in a volume of 10 µl. Mice were sacrificed on day five post infection, and viral titers in the upper airways, tracheae and lungs were determined by plaque assay. Pooled results from two independent experiments are shown. (D) WT (n = 15), Ifnar1−/− (n = 15) and Ifnlr1−/− (n = 15) mice were intranasally infected with 103 TCID50 of SeV in a volume of 10 µl. Mice were sacrificed on day five post infection, and viral titers in the upper airways and lungs were determined by the TCID50 method. Pooled results from two independent experiments are shown. Symbols represent individual mice, and bars represent means ± SEM. Statistical analysis: One-way ANOVA with Tukey’s multiple comparisons was used to compare viral titers in the upper airways: asterisks indicate p-values: ***p<0.001, **p<0.01, *p<0.05. Fisher's exact test was used to compare events of virus spread: circles indicate p-values: °°°p<0.001, °°p<0.01, °p<0.05.
Figure 1—figure supplement 1
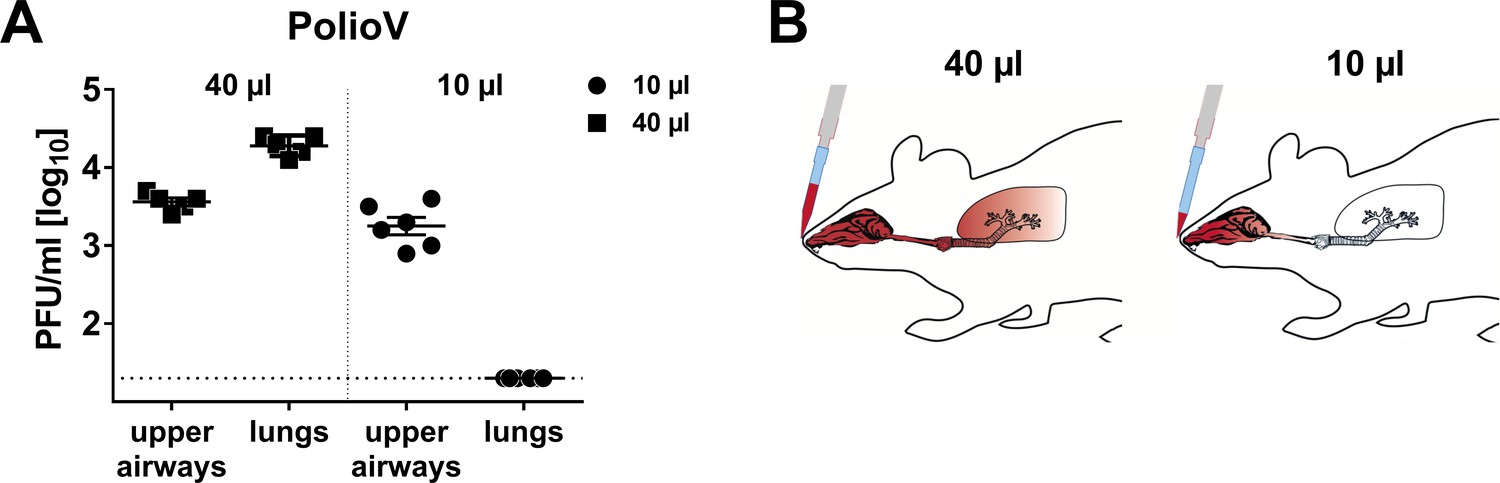
Selective infection of the upper respiratory tract can be achieved by applying the virus inoculum in a small volume.
(A) 10 µl or 40 µl of inoculum containing 106 PFU/ml of poliovirus were administered intranasally to the airways of mice. 5 min after virus administration, the animals were sacrificed, and viral titers in tissue homogenates of the upper airways and lungs were determined by plaque assay. Symbols represent individual mice, and bars represent means ± SEM. (B) Schematic depicting the interdependence of inoculum size and virus delivery to distinct parts of the respiratory tract.
Figure 2
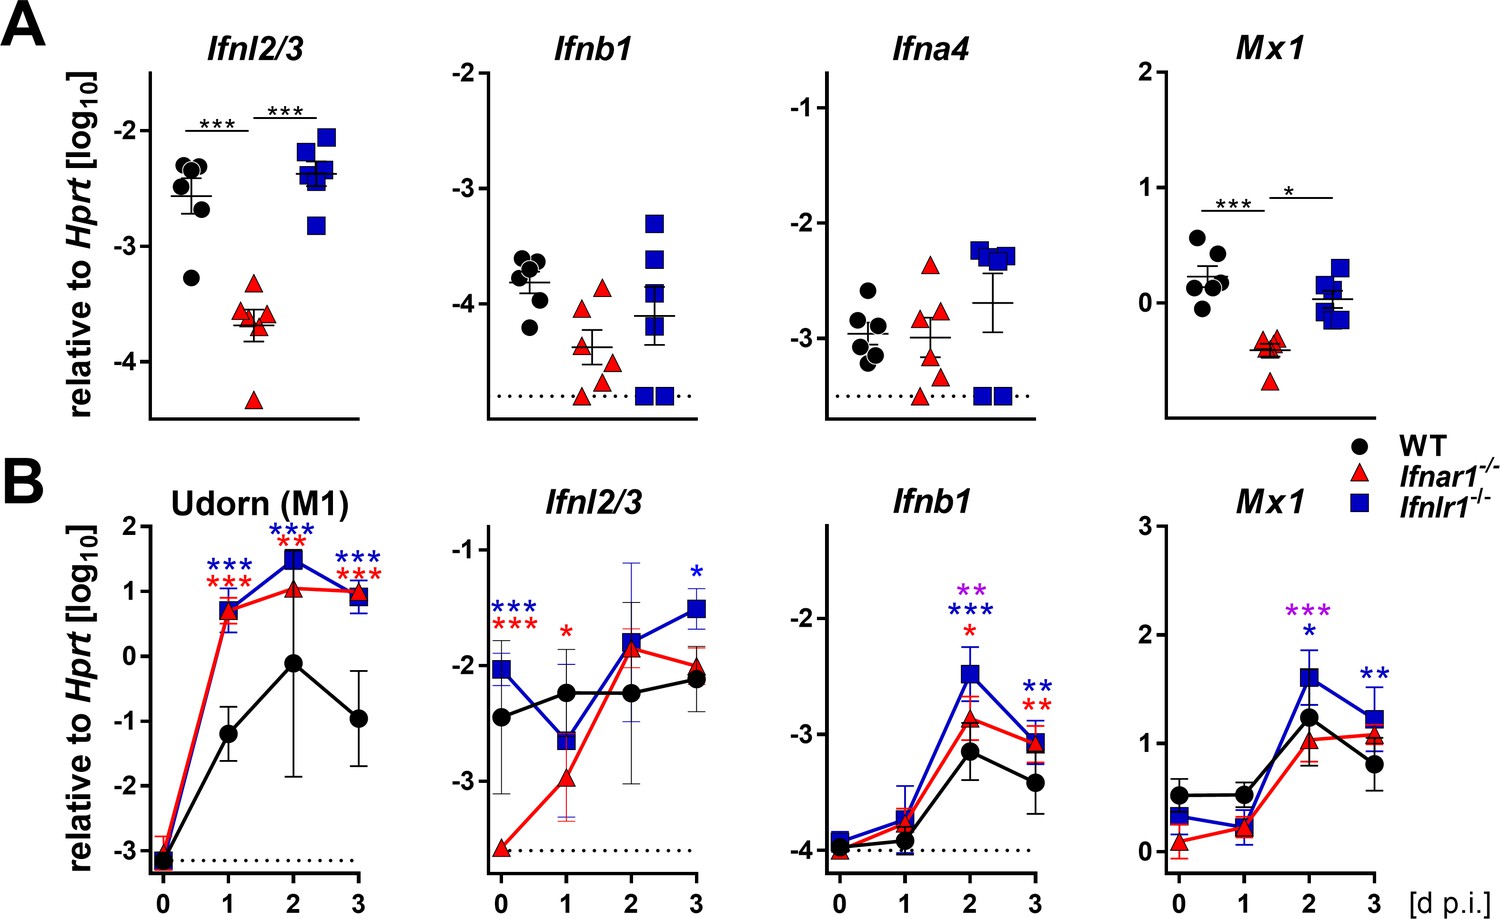
Basal expression of IFN-λ genes is reduced in Ifnar1−/− mice.
(A) Basal expression of type I (Ifnb1 and Ifna4), type III IFNs (Ifnl2/3) and Mx1 was measured by RT-qPCR in snout homogenates of WT (n = 6), Ifnar1−/− (n = 6) and Ifnlr1−/− (n = 6). Gene expression levels are shown relative to the housekeeping gene Hprt. Symbols represent individual mice, and bars represent means ± SEM. Statistical analysis: One-way ANOVA with Tukey’s multiple comparisons; asterisks indicate p-values: ***p<0.001, *p<0.05. (B) WT (n = 21), Ifnar1−/− (n = 22) and Ifnlr1−/− (n = 23) mice were intranasally infected with 104 PFU of Udorn in a volume of 10 µl. Mice were sacrificed at the indicated time points (n = 5–7) and snout homogenates were processed for RT-qPCR. Expression levels of mRNAs encoding viral M1 protein or cellular gene products IFN-λ2/3, IFN-β and Mx1 are shown relative to transcription of the Hprt housekeeping gene. Symbols represent means ± SD. Red or blue asterisks indicate statistically significant differences between WT and Ifnar1−/− or Ifnlr1−/−, respectively; purple asterisks indicate differences between Ifnar1−/− and Ifnlr1−/−. Statistical analysis: Two-way ANOVA; asterisks indicate p-values: ***p<0.001, **p<0.01, *p<0.05.
Figure 3
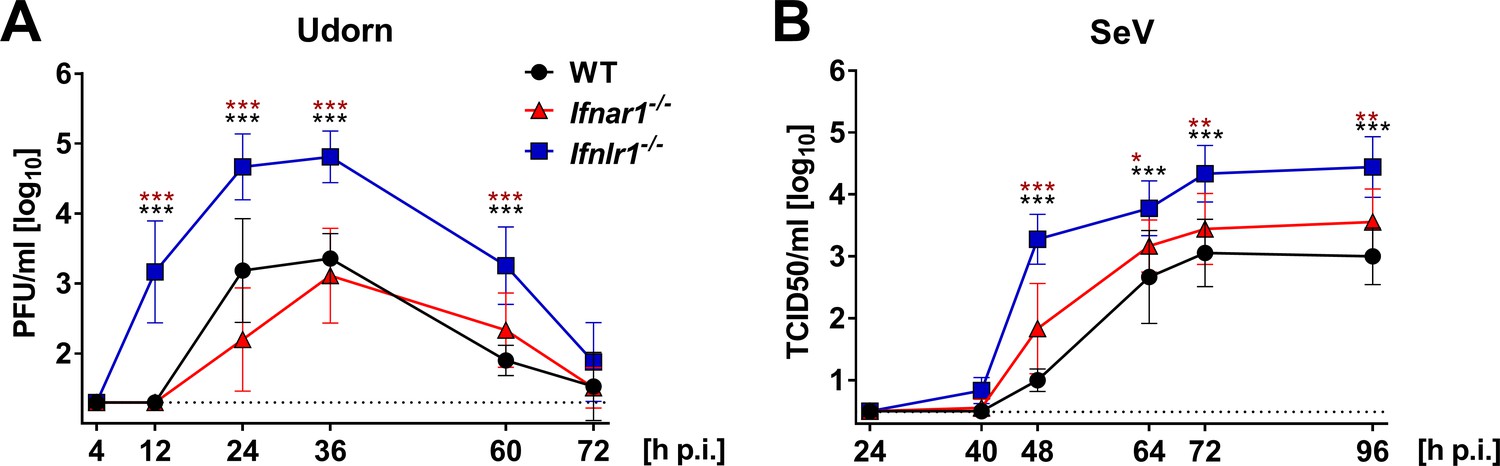
Ifnlr1−/− mice secrete high amounts of infectious virus.
(A) WT (n = 7), Ifnar1−/− (n = 9) and Ifnlr1−/− (n = 9) mice were intranasally infected with 105 PFU of Udorn in a volume of 10 µl. (B) WT (n = 6), Ifnar1−/− (n = 6) and Ifnlr1−/− (n = 6) mice were intranasally infected with 103 TCID50 of SeV in a 10 µl volume. Nasal swabs were taken at the indicated time points post infection. Infectious virus recovered from the swabs was quantified by plaque assay (Udorn) or the TCID50 method (SeV). Symbols represent means ±SD. Statistical analysis: Two-way ANOVA; black asterisks indicate significant differences between WT and Ifnlr1−/−, red asterisks indicate significant differences between Ifnar1−/− and Ifnlr1−/−. P-values: ***p<0.001, **p<0.01, *p<0.05.
Figure 4
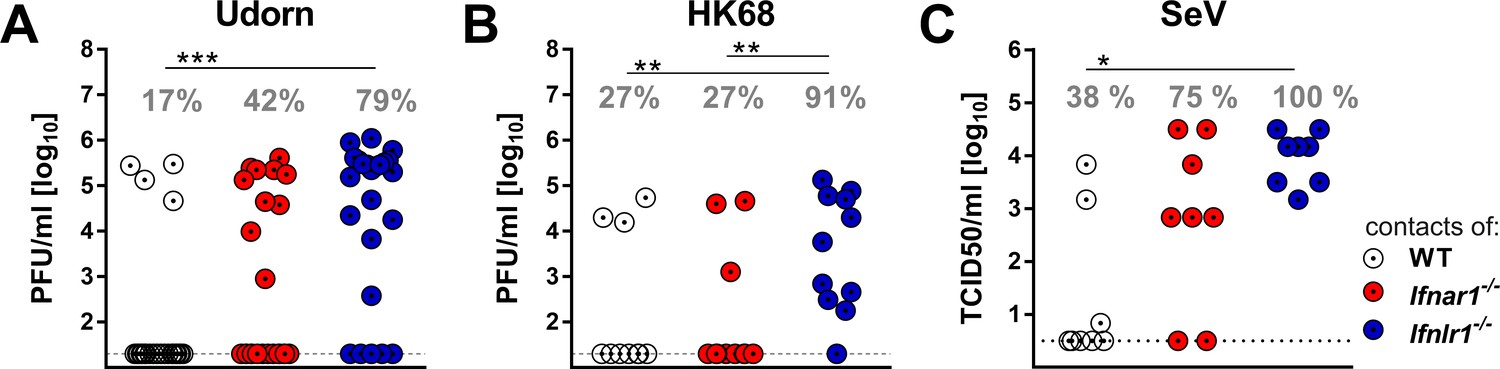
IFN-λ limits contact transmission of respiratory viruses among mice.
WT, Ifnar1−/− and Ifnlr1−/− mice were intranasally infected with (A) 105 PFU of Udorn, (B) 105 PFU of HK68 or (C) 103 TCID50 of SeV in a volume of 10 µl. At 24 hr post infection, the infected mice were cohoused with naive Ifnar1−/−Ifnlr1−/− contact mice for 4 days (Udorn and HK68) or 6 days (SeV). Viral titers in the upper airways of individual contact mice are plotted, and calculated rates of successful virus transmission are indicated. Statistical analysis: Fisher's exact test; asterisks indicate p-values: ***p<0.001, **p<0.01, *p<0.05.
Figure 5 with 2 supplements
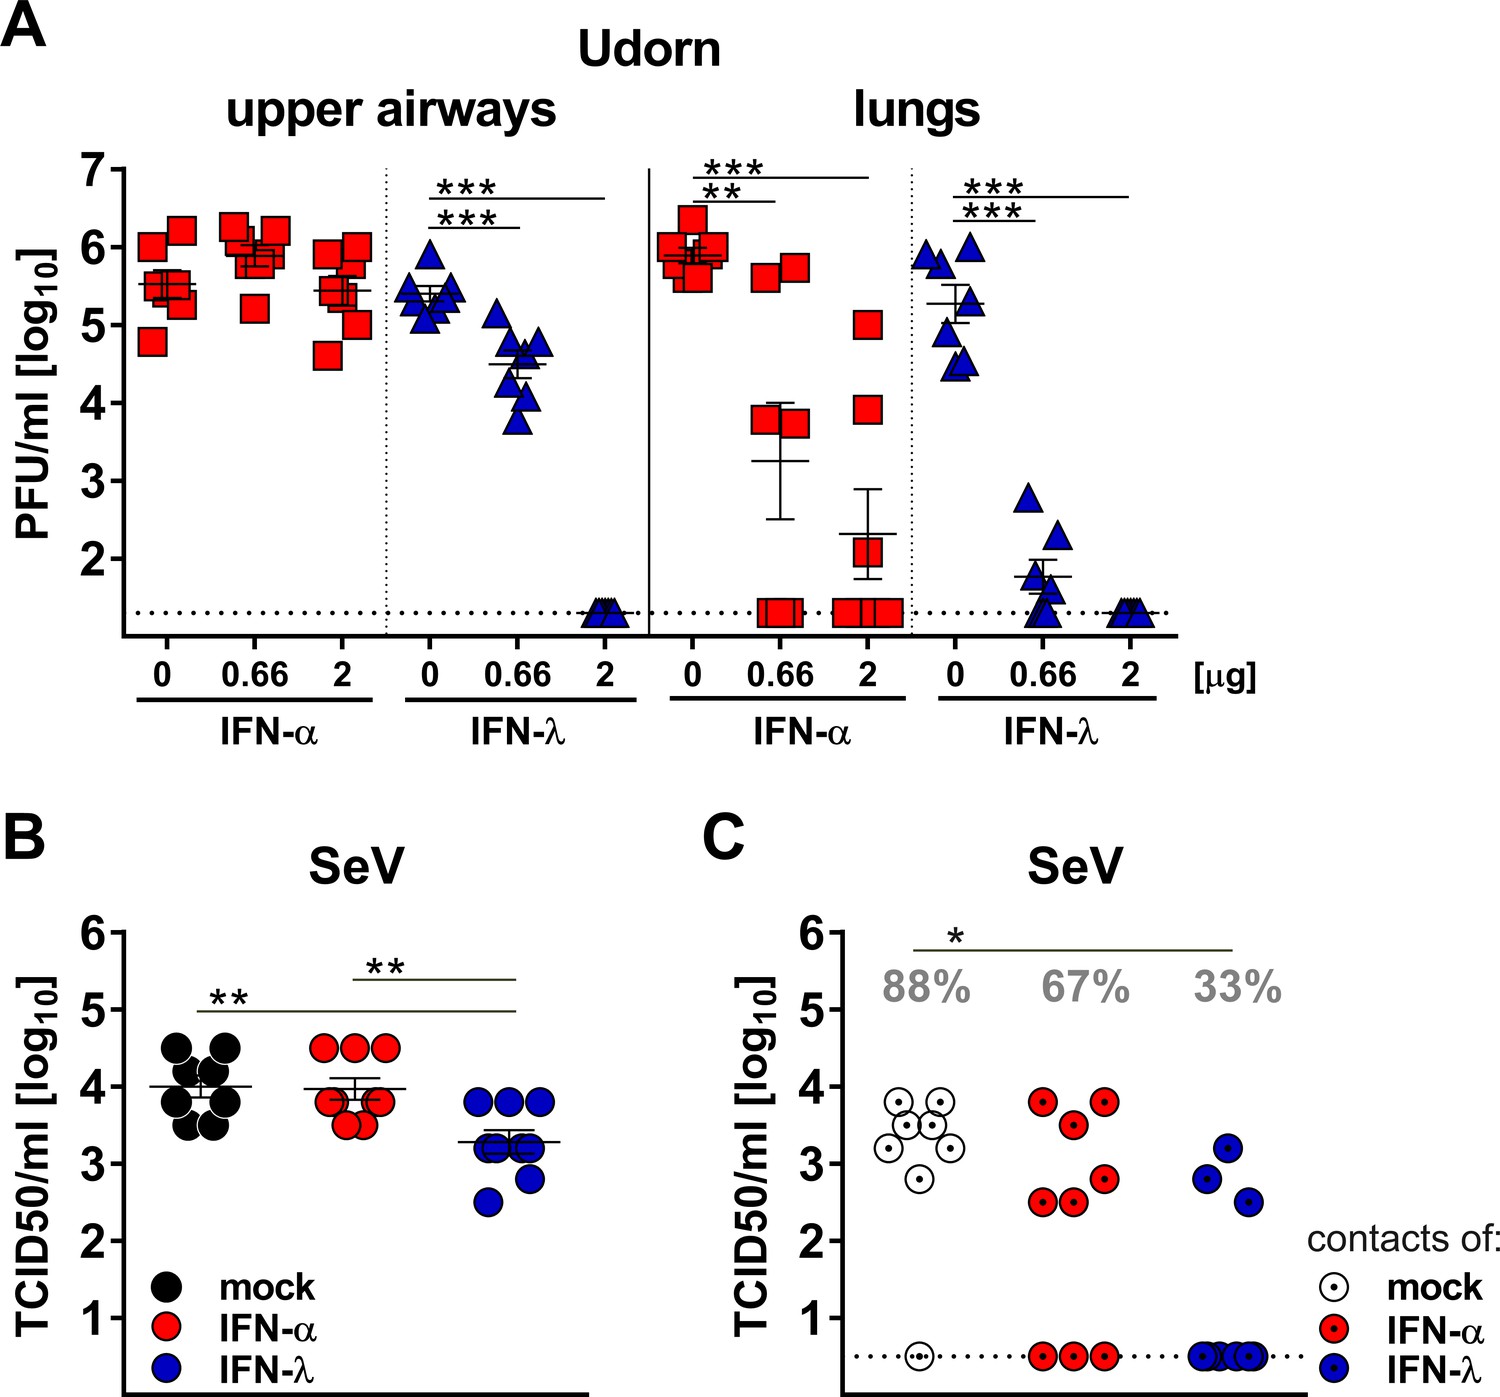
Virus defense in the upper respiratory tract strongly relies on IFN-λ.
(A) Groups (n = 7) of Ifnar1−/− (blue triangles) and Ifnlr1−/− mice (red squares) were intranasally treated with 40 µl of saline solution (mock) or with two different doses of IFN-α or IFN-λ as indicated. After 18 hr, the mice were infected with 105 PFU of Udorn in a 40 µl volume. On day three post infection, viral loads in the upper airways and lungs were determined by plaque assay. (B–C) Groups of WT mice (n = 8–9) were treated intranasally with 20 µl containing saline (mock), 3 µg of IFN-α or 3 µg of IFN-λ. After 18 hr, the mice were infected intranasally with 104 TCID50 of SeV in a volume of 10 µl. At 24 hr post infection, infected mice were cohoused with naive Ifnar1−/−Ifnlr1−/− contact mice. On day five post cohousing, all animals were sacrificed and virus titers in the upper airways of directly infected mice (panel B) and contact mice (panel C) were determined by the TCID50 method. Grey numbers indicate the calculated frequency of successful virus transmission. Statistical analysis: (A–B) One-way ANOVA with Tukey’s multiple comparisons; (C) Fisher's exact test. Asterisks indicate p-values: ***p<0.001, **p<0.01, *p<0.05. Symbols represent values of individual mice, and bars represent means ± SEM.
Figure 5—figure supplement 1

IFN-λ efficiently inhibits influenza virus replication in the upper airways under low dose infection conditions.
WT (n = 5), Ifnar1−/− (n = 6) and Ifnlr1−/− (n = 8) mice were intranasally infected with 100 PFU of Udorn in a 10 µl volume. Upper airways were collected on day five post infection, and viral loads were determined by plaque assay. Symbols represent individual mice, and bars represent means ± SEM.
Figure 5—figure supplement 2

IFN-λ and IFN-α have comparable potency on primary airway epithelial cells.
The biological activities of IFN-α and mouse IFN-λ preparations were determined by stimulating primary AEC cultures for 4 hr with the indicated concentrations of these cytokines. Induction of the IFN-stimulated genes Isg15, Stat1 and Mx1 was assessed by RT-qPCR; values are represented as gene expression levels relative to Hprt. Representative data of two independent experiments is shown.
Figure 6 with 1 supplement

IFN-λ but not IFN-α confers long-lasting antiviral protection in the upper airways.
(A) WT mice (n = 4–5) were treated by the subcutaneous route with 3 µg IFN-α, 3 µg IFN-λ or saline solution 18 hr before intranasal challenge with 103 TCID50 of SeV in a 40 µl volume. Groups of mice were sacrificed on days 2, 4 or 6 post infection (dp.i.), and viral titers in nasal swabs (left panel), upper airways (middle panel) and lungs (right panel) were determined by the TCID50 method. Symbols represent means ±SD. Red or blue asterisks indicate statistically significant differences between mock and IFN-α- or IFN-λ-treated groups, respectively; purple asterisks indicate differences between IFN-α- or IFN-λ-treated groups. Statistical analysis: One-way ANOVA with Tukey’s multiple comparisons; p-values: ***p<0.001, **p<0.01, *p<0.05. (B) Ifnar1−/− (blue triangles, n = 5–6) or Ifnlr1−/− mice (red squares, n = 5) were treated by the intranasal route with 2 µg IFN-λ or 2 µg IFN-α, respectively, before intranasal challenge with 4 × 10⁵ PFU of Udorn in a 40 µl volume. Mice treated with saline (Ø) served as controls. Mice were sacrificed at 24 hr (left panel) or 72 hr (right panel) post infection (p.i.), and viral titers in the upper airways and lungs were determined by plaque assay. Symbols represent individual mice, and bars represent means ± SEM. Statistical analysis: One-way ANOVA with Tukey’s multiple comparisons; p-values: ***p<0.001, **p<0.01, *p<0.05. (C) IFN-mediated induction of Mx1 was determined by stimulating differentiated primary airway epithelial cells derived from mouse tracheae for the indicated time points with 1 ng/ml of either IFN-α or IFN-λ. Mx1 induction was assessed by RT-qPCR; values are represented as gene expression levels relative to unstimulated controls (mock). Symbols represent single wells; line indicates mean. Representative data of two independent experiments is shown. Statistical analysis: Two-way ANOVA; asterisks indicate significant differences between IFN-α- and IFN-λ-treated cells. P-values: ***p<0.001, **p<0.01, *p<0.05.
Figure 6—figure supplement 1
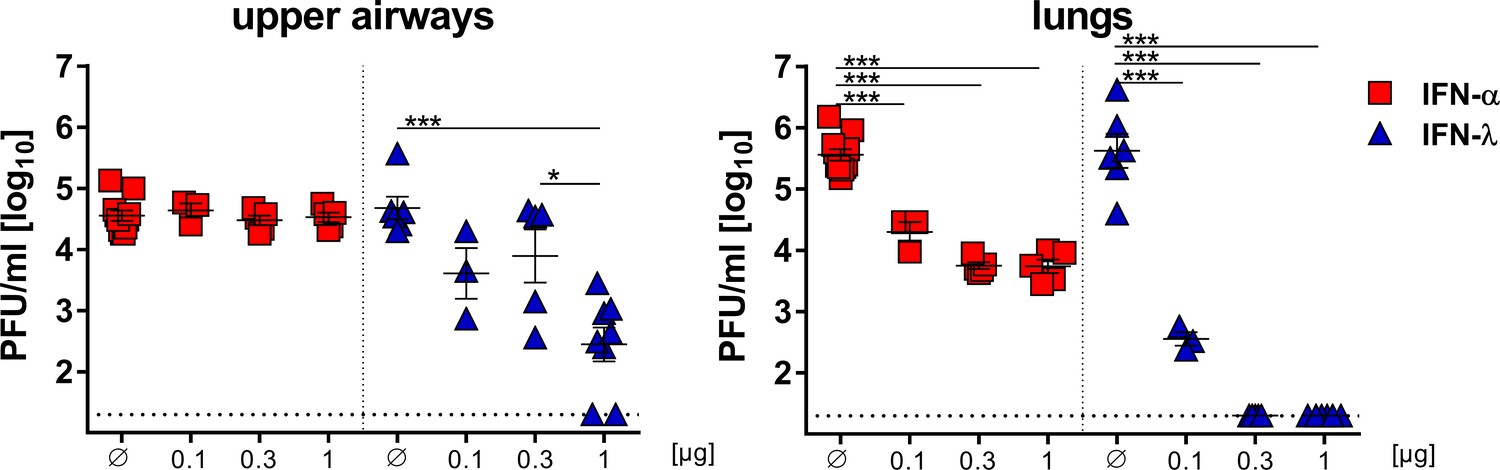
IFN-λ but not IFN-α confers antiviral protection in the upper airways.
Ifnar1−/− (blue triangles) or Ifnlr1−/− mice (red squares) were treated subcutaneously with the indicated amounts of IFN-λ or IFN-α, respectively. 18 hr later, the animals were infected intranasally with 105 PFU of Udorn in a 40 µl volume. Mice treated with saline (Ø) served as controls. Animals were sacrificed 3 days post infection, and viral titers in upper airways (left panel) and lungs (right panel) were determined by plaque assay. Symbols represent individual mice, and bars represent means ± SEM. Statistical analysis: One-way ANOVA with Tukey’s multiple comparison test; p-values: ***p<0.001, **p<0.01, *p<0.05.
Figure 7 with 1 supplement
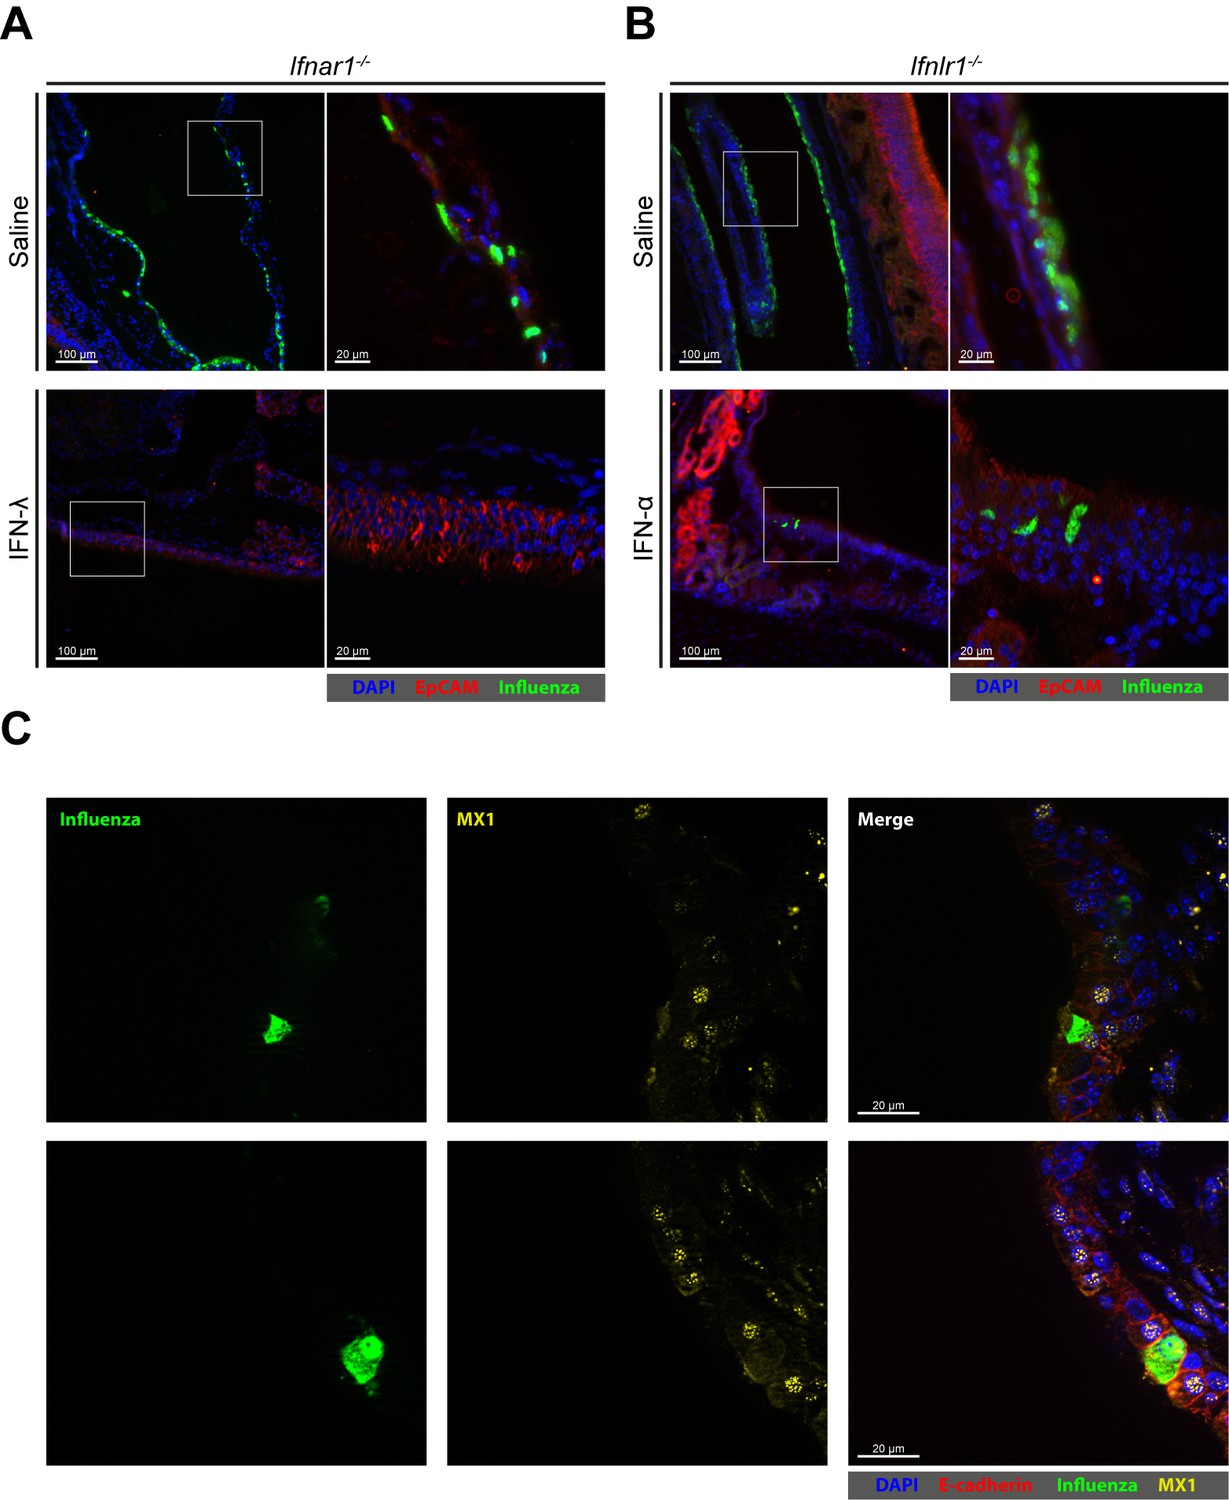
Few epithelial cells in upper airways of IFN-α-treated mice remain susceptible to viral infection.
(A) Ifnar1−/− and (B) Ifnlr1−/− mice were treated intranasally with either saline, 2 µg IFN-λ or 2 µg IFN-α before infection with 105 PFU of Udorn. The animals were sacrificed at 24 hr post infection, and heads were processed for cryosections. Thin-sections were stained for EpCAM (red), influenza virus antigens (green) and DAPI (blue). Merged pictures are presented at low magnification (left panels), and boxed areas are shown at higher magnification (right panels). (C) WT mice were treated intranasally with 2 μg IFN-α before infection with 105 PFU of Udorn. The animals were sacrificed at 24 hr post infection, and heads were processed for cryosections. Thin-sections were stained for E-cadherin (red), influenza virus antigens (green), MX1 (yellow) and DAPI (blue). Single staining for virus antigen (left panels) and MX1 (middle panels) as well as merged pictures of the same fields (right panels) are shown.
Figure 7—figure supplement 1
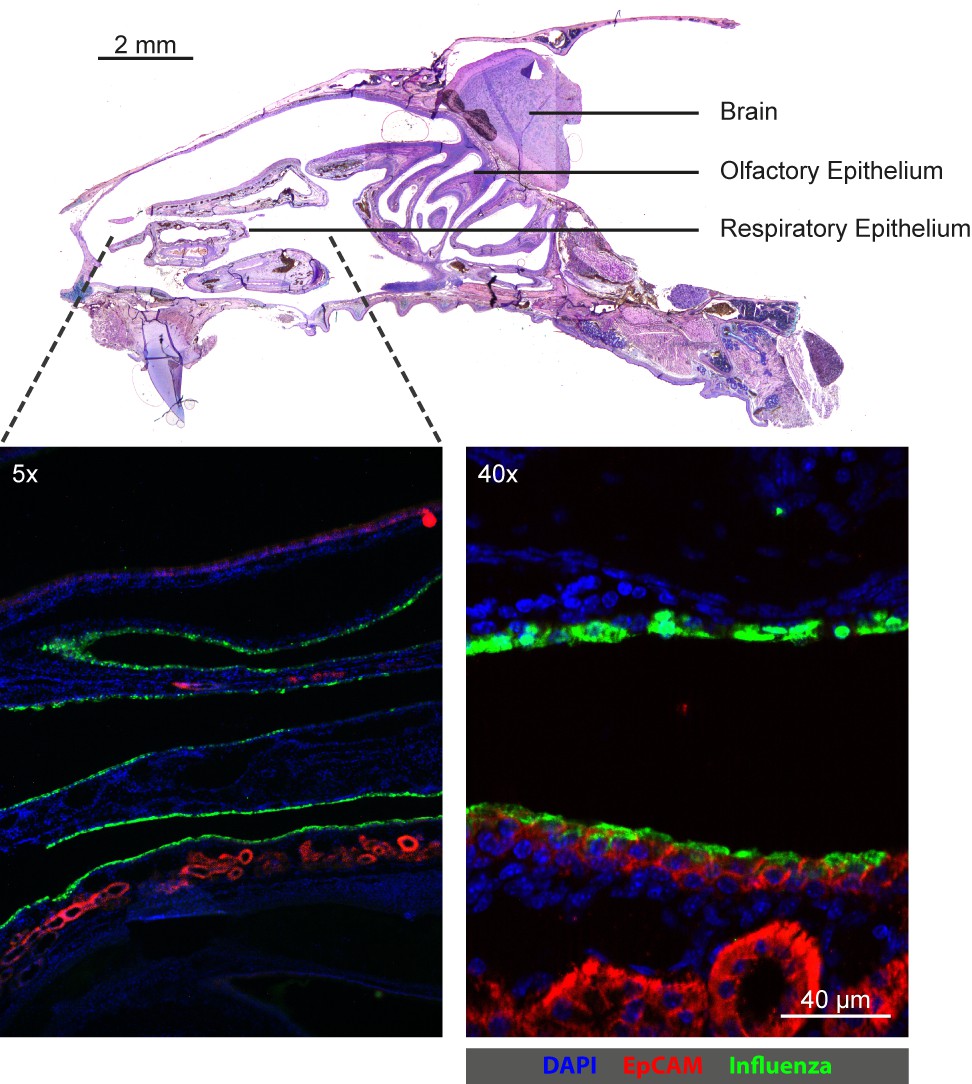
Udorn replicates preferentially in the rostral naso- and maxilla-turbinates.
Ifnar1−/− Ifnlr1−/− mice were intranasally infected with 105 PFU of Udorn and sacrificed 24 h later. Heads of animals were collected, processed for cryosections and subjected to Periodic acid–Schiff staining (top panel) or immune-stained (bottom panels) for EpCAM (red), influenza virus antigen (green) and DAPI (blue).
Additional files
-
Transparent reporting form
- https://doi.org/10.7554/eLife.33354.015
Download links
A two-part list of links to download the article, or parts of the article, in various formats.
Downloads (link to download the article as PDF)
Open citations (links to open the citations from this article in various online reference manager services)
Cite this article (links to download the citations from this article in formats compatible with various reference manager tools)
IFN-λ prevents influenza virus spread from the upper airways to the lungs and limits virus transmission
eLife 7:e33354.
https://doi.org/10.7554/eLife.33354


