Rev7 and 53BP1/Crb2 prevent RecQ helicase-dependent hyper-resection of DNA double-strand breaks
- Yale School of Medicine, United States
Figures
Figure 1 with 3 supplements
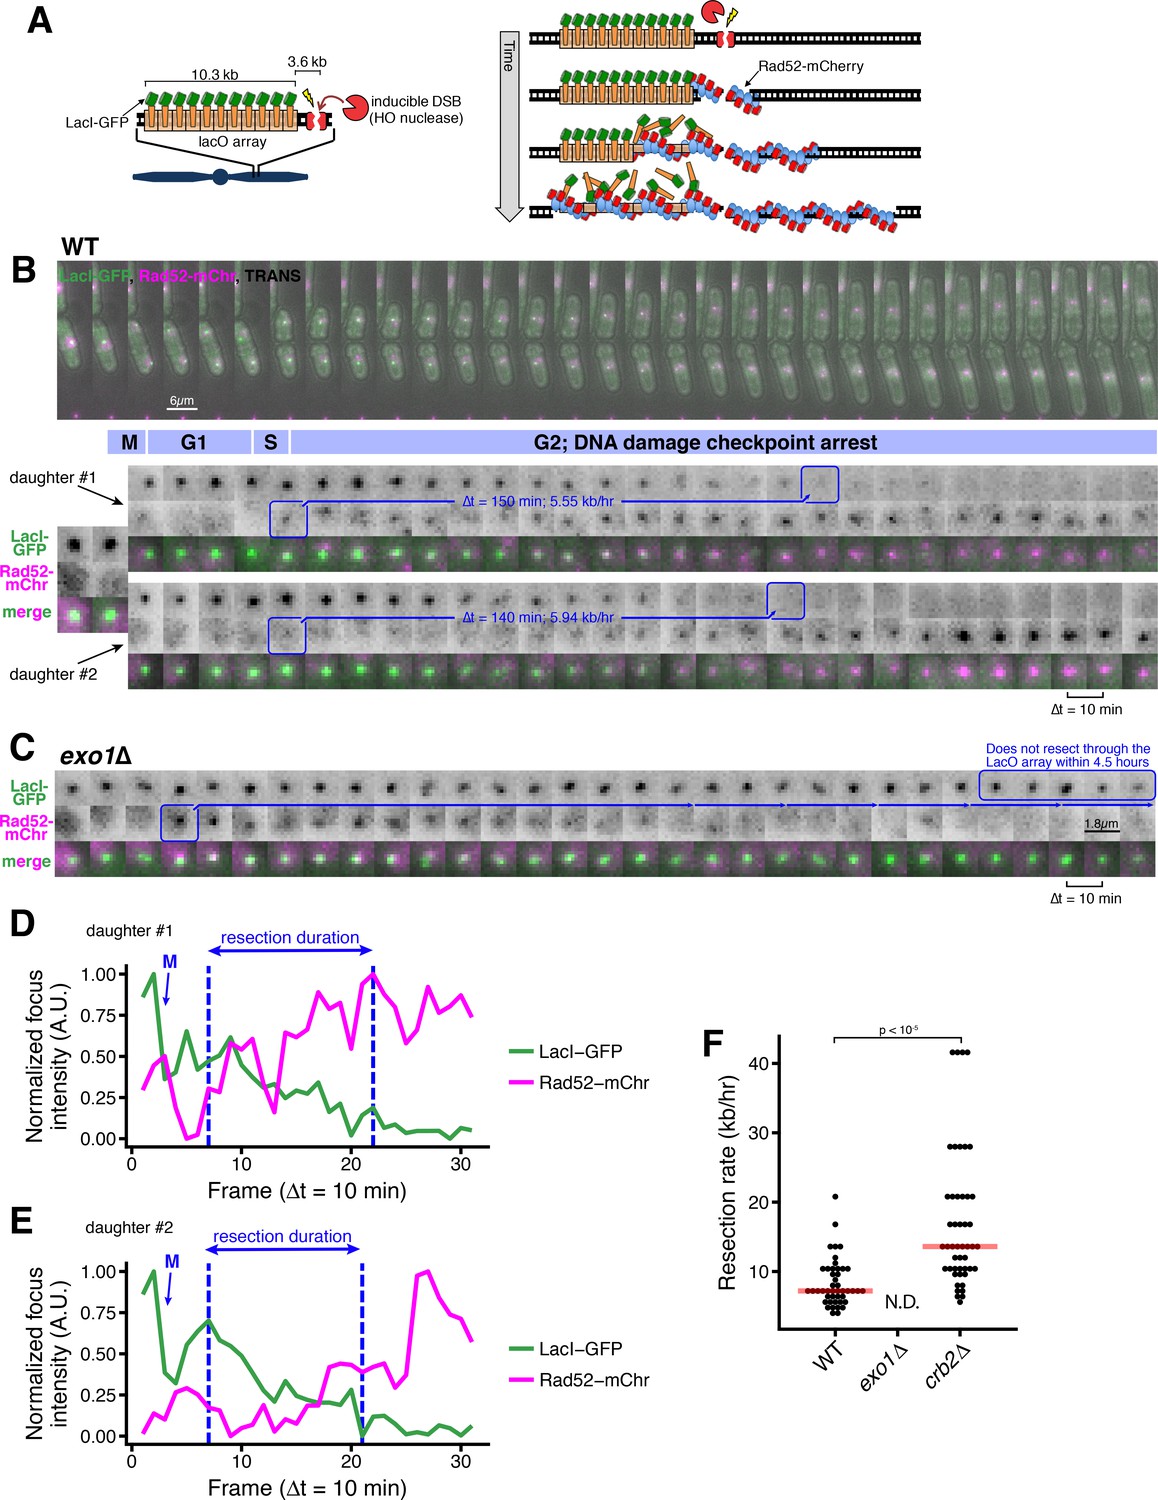
A microscopy-based assay to measure long-range resection in single cells.
(A) Design of the LacO resection assay in S. pombe. HO endonuclease cut cite (HOcs) and LacO integration at the Mmf1 locus on Chr II allows live-cell measurements of resection rates. Rad52-mCherry loads on DSB ends after resection initiation, and LacI-GFP is displaced as resection creates long tracts of ssDNA through the LacO array. (B) DSB resection events in two WT daughter cells. The majority of the S. pombe cell cycle is spent in G2, and all DSBs are observed in S/G2 based on the timing of mitosis and cell fission. Images shown are maximum intensity Z-projections acquired at 10-min time intervals. Blue annotations denote the starting point of resection (first frame with a detectable Rad52 focus, shortly after resection begins) and the end point (first frame with total loss of the LacO/LacI-GFP focus) of individual resection events. These start/end frames mark the total duration of resection through the 13.87 kb distance between the HOcs and the distal end of the repetitive LacO array and are used to compute resection rate (kb/hr) for individual cells. (C) Representative resection-deficient exo1∆ cell that that loads on-target Rad52-mCherry but does not lose the LacO/LacI-GFP focus. Because resection of the LacO array is too slow to be completed during the window of data acquisition, we are not able to quantify the rate of resection in exo1∆ cells. (D and E) Quantification of LacO/LacI-GFP focus and Rad52-mCherry focus intensities over time for the cells shown in (B). The arrow and ‘M’ show the time of mitotic division, which leads to a decrease in GFP intensity. Quantification used full Z-stack images (not maximum intensity projections shown in B) at subpixel resolution with background normalization. See Materials and methods for more details. (F) Single-cell measurements of resection rate using the LacO resection assay. Horizontal red bars mark the median resection rate for each genotype. exo1∆ rates cannot be determined (N.D.) because resection through the LacO array does not complete within 5 hr of data acquisition. p-values shown are from pairwise two-tailed t-tests, using a Bonferroni correction for multiple comparisons. Number of biological replicates and counts of analyzed cells can be found in Supplementary file 2.
Figure 1—figure supplement 1

Design and validation of the LacO and HO cut site integrations.
(A) Map of LacO array integration and HO cut cite integration in S.pombe (Chr II: 3,442,981 and Chr II: 3,446,249, respectively) drawn to scale (note: only 6 of the ~256 LacO repeats are shown). (B) Verification of LacO array length after integration into S. pombe by HincII digest and southern blot with a LacO-targeted probe. Circled lanes: (i) MKSP1381: the S. pombe strain with a complete 10.3 kb LacO array integration used to derive all LacO assay strains used in this study; (ii) MKSP1173: a strain where the LacO array contracted upon integration to <5 kb (not used for LacO resection assay); (iii) pSR10_ura4_10.3 kb and (iv) pSR10_ura4_5.6 kb are plasmids with LacO arrays of known size. Linearized pSR10_ura4_10.3 kb was integrated into S. pombe.
Figure 1—figure supplement 2
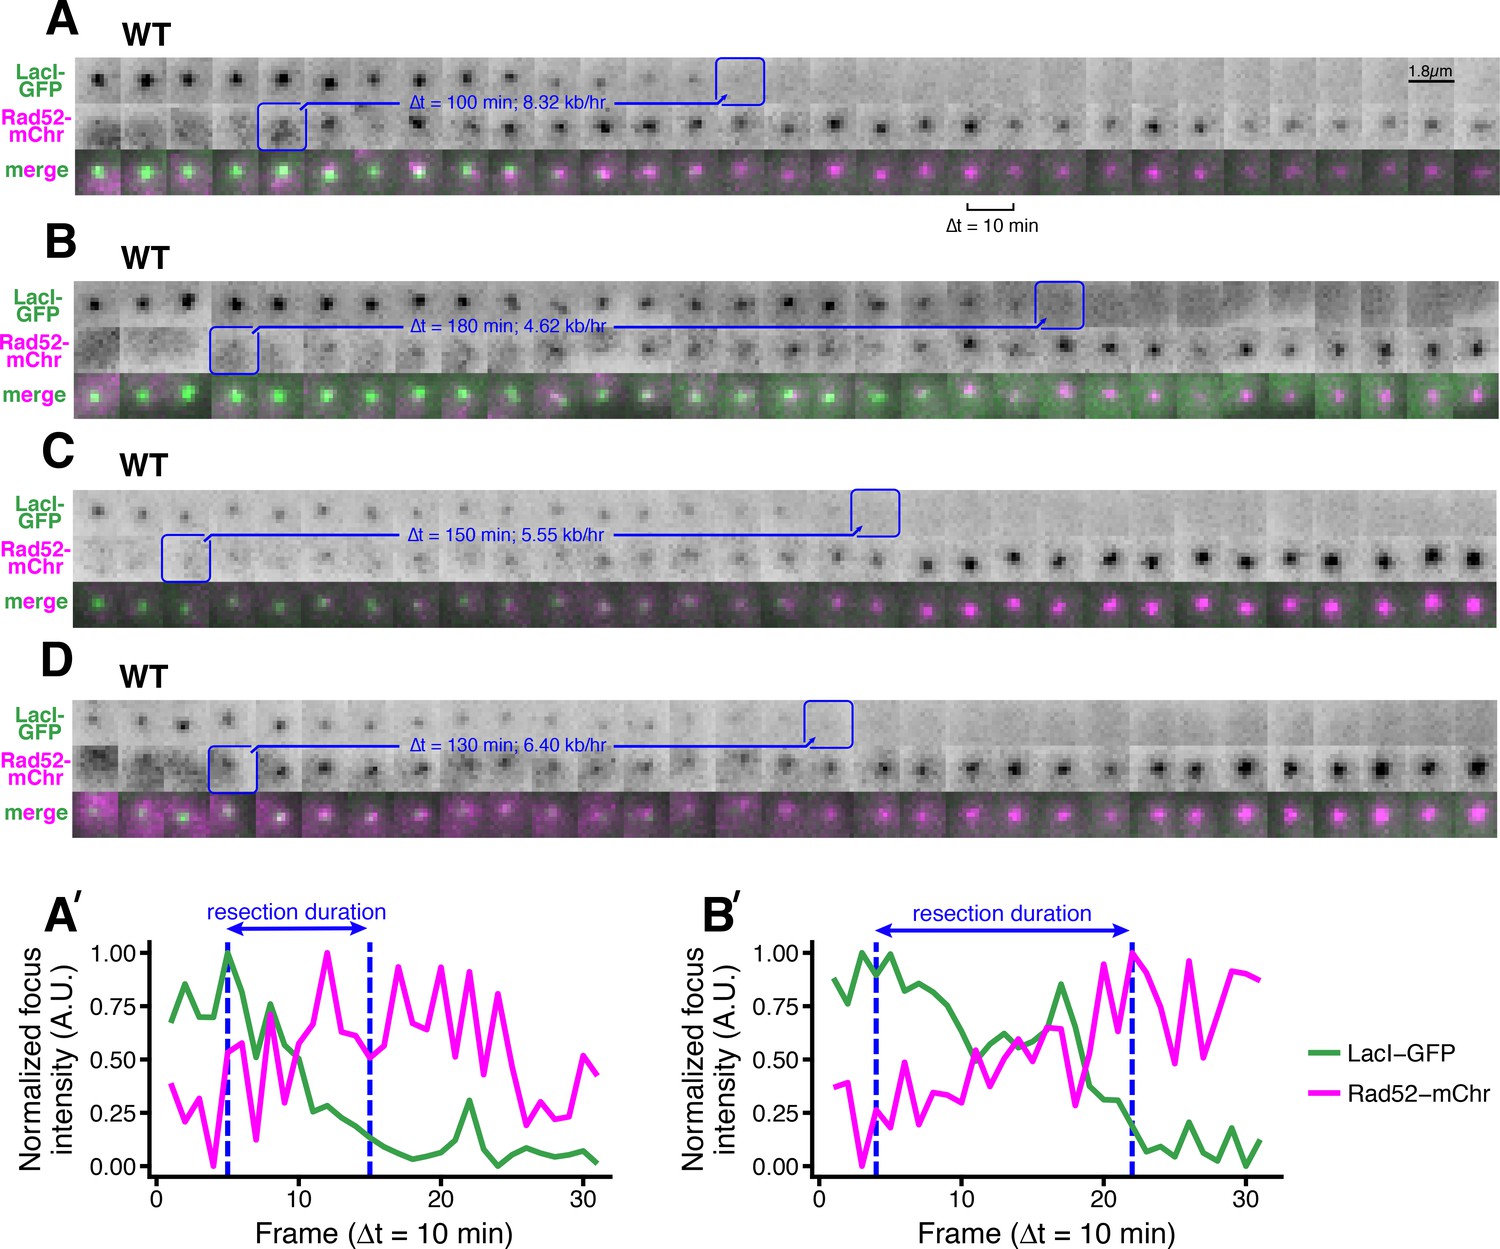
Additional examples of the LacO resection assay in individual WT cells.
(A–D) As in Figure 1B, the blue annotations denote the starting point of resection (first frame with a detectable Rad52 focus, which formation shortly after resection begins) and the end point (first frame with total loss of the LacO/LacI-GFP focus) of individual resection events. These start/end frames mark the total duration of resection through the 13.87 kb distance between the HOcs and the distal end of the repetitive LacO array, and are used to compute resection rate (kb/hr) for individual cells. (A’, B’) Additional examples of the subpixel quantification of focus intensity for (A) and (B), respectively, as described in Figure 1D,E and in the Materials and methods.
Figure 1—figure supplement 3

Validation and characterization of the LacO resection assay.
(A) qPCR using primers spanning the HO cut site to monitor the efficiency DSB induction efficiency at 180 min after HO induction by uracil addition. (B) Diagram of the qPCR assay. Resection at the HO-induced DSB generates ssDNA through the ApoI site 168 nt from the HO cut cite, protecting from ApoI digestion. (C) Kinetics of resection assessed by qPCR and Rad52 loading. Percentage of chromosomes that have undergone 168 nt of resection at the HO cut cite over time, measured by the ApoI-site protection-based qPCR assay (bars, left y-axis). Error bars show SEM for three technical qPCR replicates. Corresponding data for Rad52-mCherry focus formation in the LacO resection assay (red line, right y-axis). (D–G) Representative images showing that LacO arrays as short as 1 kb in length are easily detectible under these imaging conditions. (D) is an image of LacO/LacI-GFP foci for a 10.3 kb LacO array (the same one used in the resection assay throughout). (E) is a comparision showing a still readily visible 1 kb LacO array, whereas (F) is a cell with LacI-GFP expression but no LacO array, showing the pan-nuclear background signal if LacI-GFP is allowed to diffuse throughout the nucleus without LacO binding. (D-E) are maximum intensity Z projections with similar exposure and contrast. (G) Is a control strain without any LacI-GFP expression that is imaged under longer exposure conditions and shown as a single Z slice in the middle of the cells to highlight the very faint autofluorescence in the cytoplasm but absent in the nucleus that is characteristic of fluorescent microscopy in S. pombe. Scale bars = 5 µm. (H) The rate of resection is equivalent on both the LacO and non-LacO sides of the HOcs in WT cells. Average long-range resection at the population level assessed by an orthogonal qPCR assay that quantifies the percentage of chromosomes that have undergone resection through ApoI sites at various distances from the HOcs. Resection to single-stranded DNA through an ApoI site protects that site from digestion by the double-strand-specific nuclease, ApoI. Error bars show 95% CIs for three technical qPCR replicates. (I) Resection rates, measured by a population-based qPCR assay, at various distances from the HOcs in exo1∆ and ctp1∆ cells 90 min after HO induction by uracil addition. Resection to single-stranded DNA through an ApoI site at the indicated positions relative to the HO cut site protects that site from digestion by the double-strand-specific nuclease, ApoI. Error bars show 95% CIs for three technical qPCR replicates. (J) On-target Rad52-mCherry foci form at reduced rates in exo1∆ cells. p-value shown is from pairwise two-tailed t-tests, using a Bonferroni correction for multiple comparisons. Number of biological replicates and counts of analyzed cells can be found in Supplementary file 2.
Figure 2 with 1 supplement
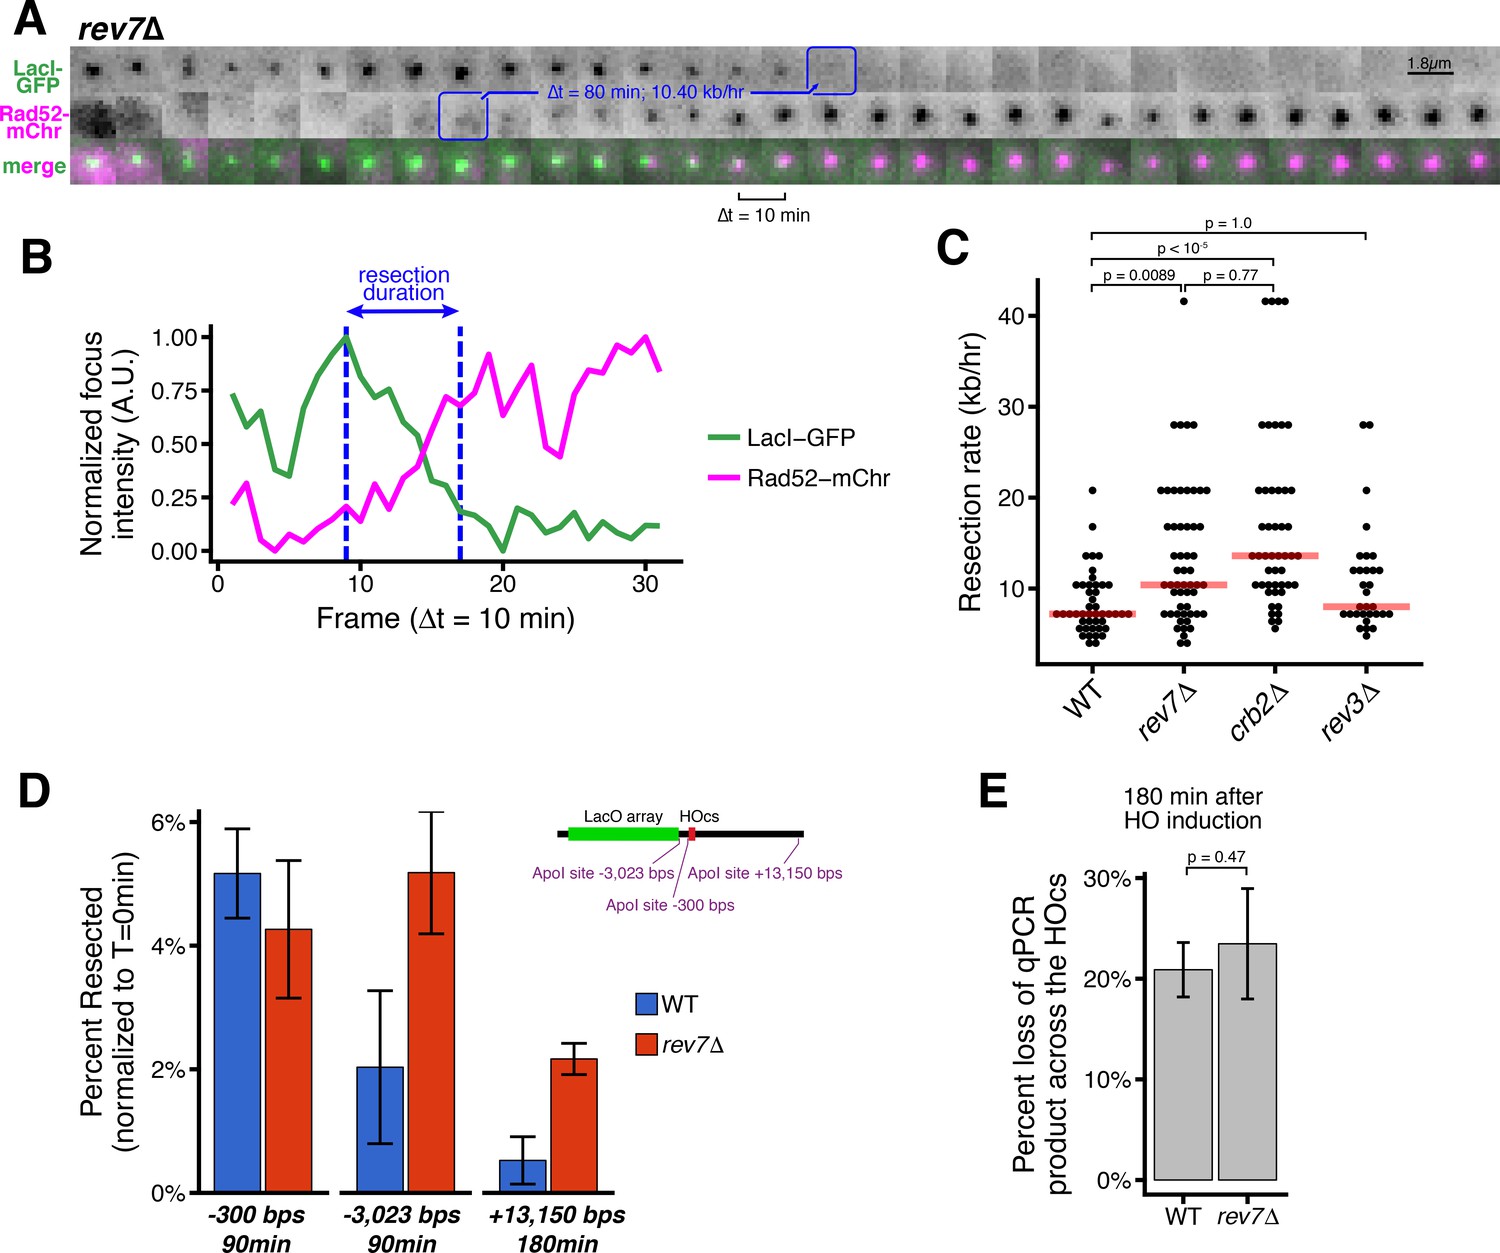
Loss of Rev7 causes an increase in long-rage resection comparable to the loss of Crb2.
(A) Representative timeseries of resection through the LacO array in a single rev7∆ cell. Blue annotations mark the beginning and end of the resection event, as in Figure 1B. (B) Subpixel quantification of focus intensity for the rev7∆ cell resection event shown in (A). Quantification is as described in Figure 1D,E and in the Materials and methods. (C) Single-cell measurements of resection rate using the LacO resection assay. Horizontal red bars mark the median resection rate for each genotype. p-values shown are from pairwise two-tailed t-tests, using a Bonferroni correction for multiple comparisons. Number of biological replicates and counts of analyzed cells can be found in Supplementary file 2. (D) The long-range rate of resection in rev7∆ and WT cells, measured with an ApoI protection qPCR assay on a population level. ApoI cut site distances from the HOcs are indicated and shown in the diagram at right. Error bars show 95% CIs for at least three technical qPCR replicates across two or more biological replicates. (E) Similar to D, qPCR primers spanning the HOcs itself are used to monitor the efficiency of the HO cutting to form DSBs at 180 min after HO induction by uracil addition.
Figure 2—figure supplement 1
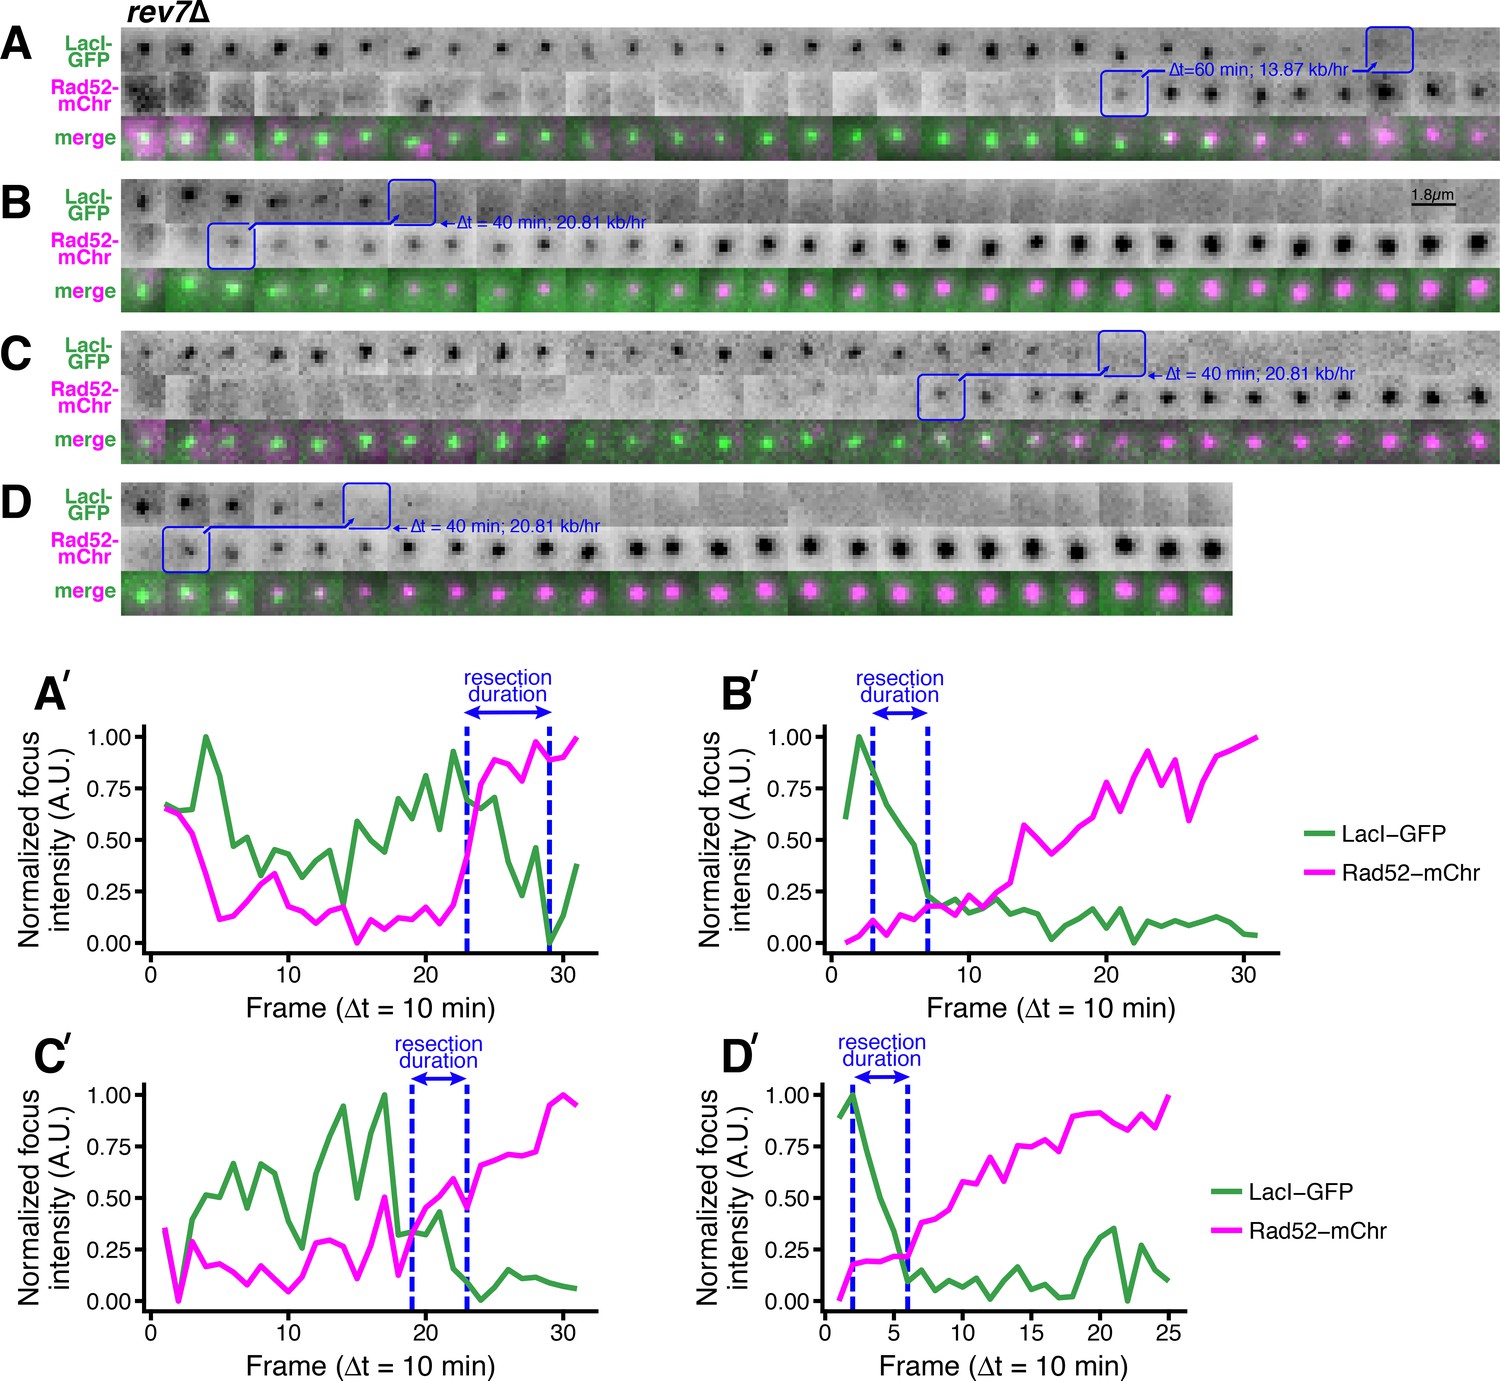
Additional examples of rapid long-range resection through the LacO array in rev7∆ cells.
(A–D) Blue annotations mark the beginning and end of individual resection events, as in Figure 1B. (A’–D’) Corresponding subpixel quantification of focus intensity, as described in Figure 1D,E and in the Materials and methods.
Figure 3 with 2 supplements
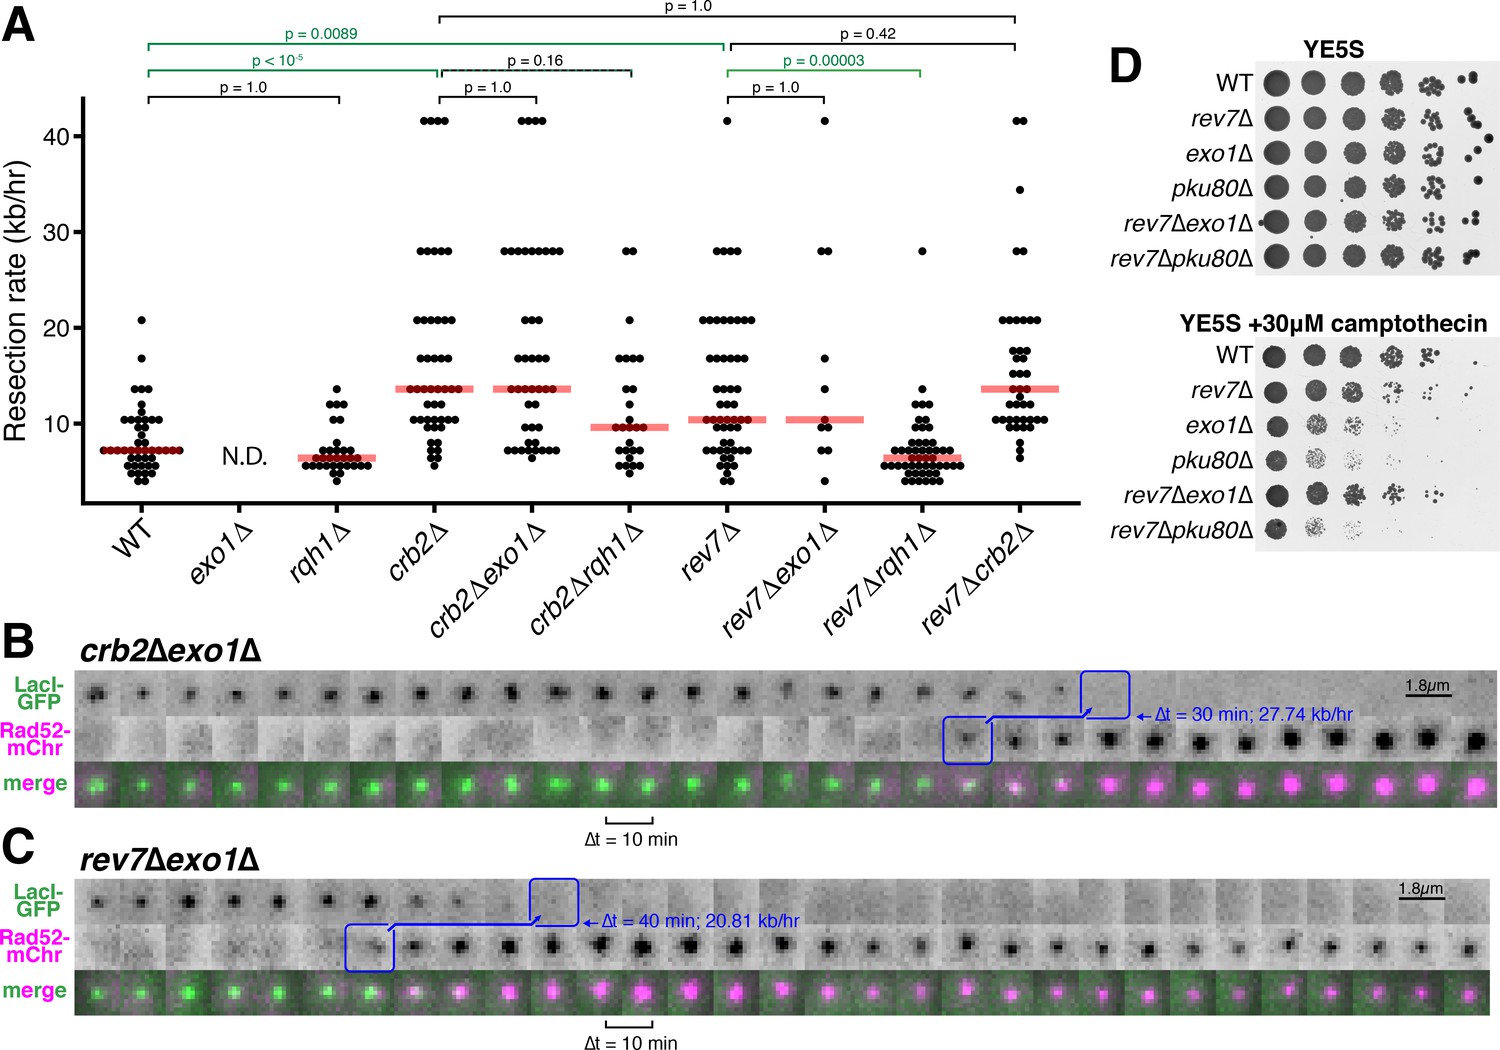
Rev7 and Crb2 act through the RecQ helicase, Rqh1, and not Exo1, to inhibit long-range resection.
(A) Epistasis analyses of long-range resection rates from single-cell measurements. exo1∆ rates cannot be determined (N.D.) because resection through the LacO array does not complete within 5 hr of data acquisition. Red bars show median resection rates and p-values are from pairwise two-tailed t-tests, using a Bonferroni correction for multiple comparisons (significant comparisons shown in green). (B,C) Very rapid resection through the 10.3 kb LacO array is common in crb2∆exo1∆ (B) and rev7∆exo1∆ (C) cells, in contrast to exo1∆ single mutants that do not completely resect the LacO array within 5 hr (see Figure 1C). (D) Growth assay on rich media with and without camptothecin. Loss of Rev7 can rescue the severe growth defect of exo1∆ cells.
Figure 3—figure supplement 1
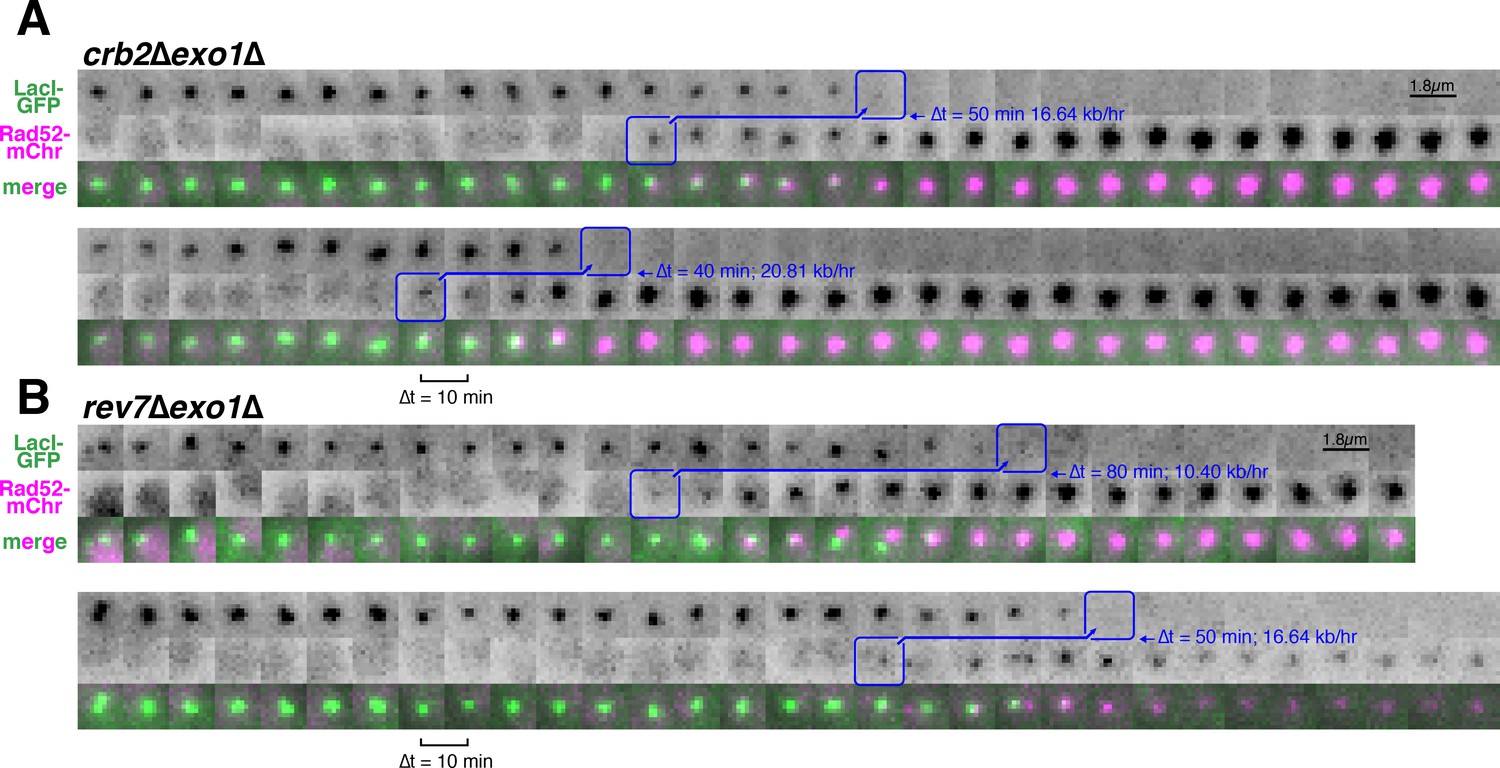
Additional examples of very rapid, Exo1-independent resection through the LacO array in the absence of Crb2 or Rev7.
(A) Examples of resection in individual crb2∆exo1∆ and (B) rev7∆exo1∆ cells.
Figure 3—figure supplement 2

Epistasis analysis including non-exactly determined resection events.
(A) Diagram of exactly and non-exactly determined resection events. The LacO resection assay is limited to 5 hr due to photobleaching. Thus, many resection events will start before the first frame or end after the last frame of data acquisition (red). Longer durations (slower resection) are more likely to extend past the first or last frame, and the lower threshold for exactly determined resection rates is 2.8 kb/hr for 5 hr of data acquisition. (B) Duration of individual resection events through the 10.3 kb LacO array (secondary y-axis shows resection rate). Minimum possible durations are shown in red. Of particular note, many slow crb2∆rqh1∆ events have longer durations (slower rates) and thus they cannot be exactly determined. See Supplementary file 2 for number of biological replicates and counts of analyzed cells.
Author response image 1
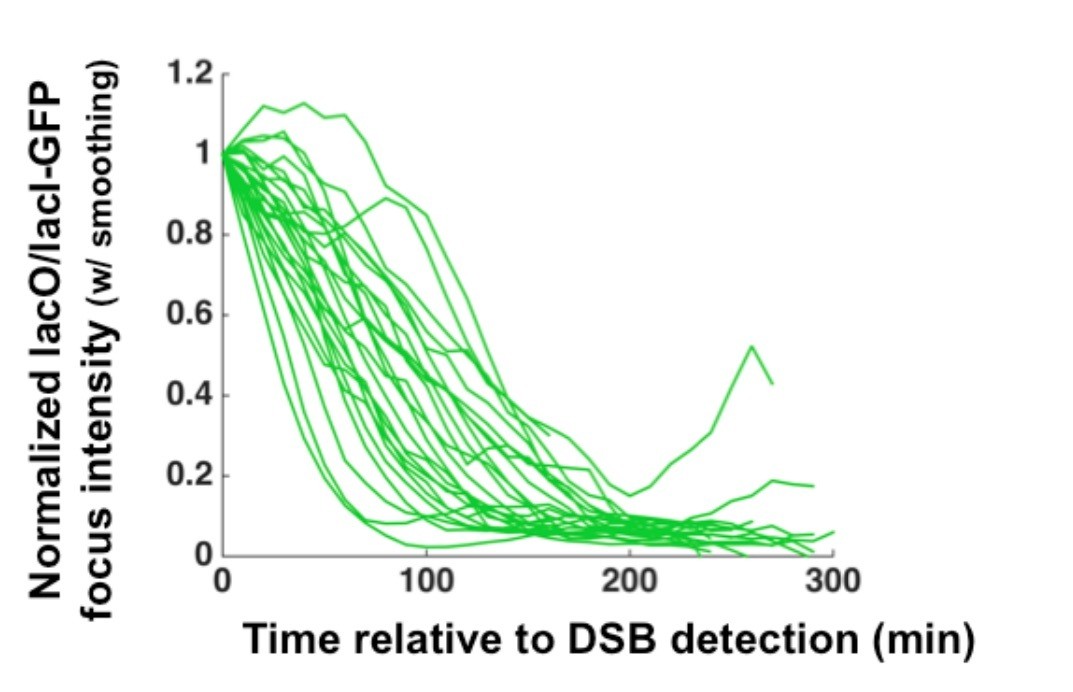
Author response image 2
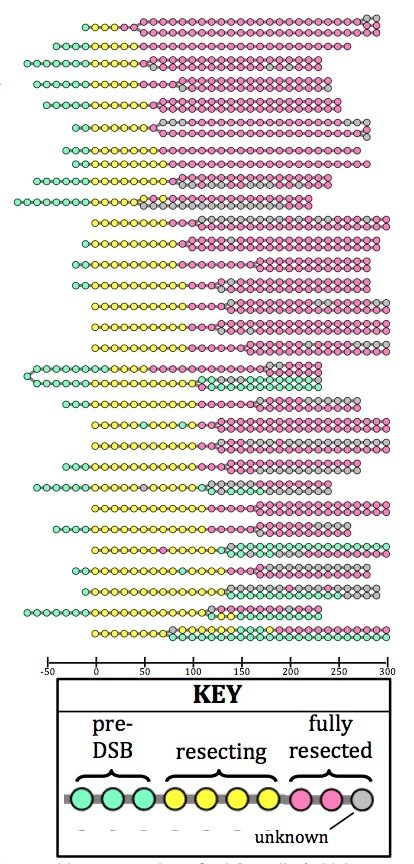
Lineage tracing of crb2Ä cells (which are checkpoint-deficient) reveals that the vast majority of sisters arising by division (visualized as splitting of one circle to two) both inherit a fully resected LacO array (pink).
https://doi.org/10.7554/eLife.33402.018Additional files
-
Supplementary file 1
Strains used in this study.
These strains were for all LacO resection assay experiments in Figures 1–3 unless otherwise noted. PDis1-GFP-LacI-NLS is derived from Shimada et al. (2003). LacO integrations were performed as described in Leland and King, 2014. Strains containing the RMCE Purg1lox expression system were derived from Watson et al. (2011).
- https://doi.org/10.7554/eLife.33402.012
-
Supplementary file 2
Number of biological replicates, cell cycles, and DSB events analyzed for each genotype.
- https://doi.org/10.7554/eLife.33402.013
-
Supplementary file 3
Primers sets used in qPCR measurements of resection.
- https://doi.org/10.7554/eLife.33402.014
-
Transparent reporting form
- https://doi.org/10.7554/eLife.33402.015
Download links
A two-part list of links to download the article, or parts of the article, in various formats.
Downloads (link to download the article as PDF)
Open citations (links to open the citations from this article in various online reference manager services)
Cite this article (links to download the citations from this article in formats compatible with various reference manager tools)
Rev7 and 53BP1/Crb2 prevent RecQ helicase-dependent hyper-resection of DNA double-strand breaks
eLife 7:e33402.
https://doi.org/10.7554/eLife.33402


