Rev7 and 53BP1/Crb2 prevent RecQ helicase-dependent hyper-resection of DNA double-strand breaks
Abstract
Poly(ADP ribose) polymerase inhibitors (PARPi) target cancer cells deficient in homology-directed repair of DNA double-strand breaks (DSBs). In preclinical models, PARPi resistance is tied to altered nucleolytic processing (resection) at the 5’ ends of a DSB. For example, loss of either 53BP1 or Rev7/MAD2L2/FANCV derepresses resection to drive PARPi resistance, although the mechanisms are poorly understood. Long-range resection can be catalyzed by two machineries: the exonuclease Exo1, or the combination of a RecQ helicase and Dna2. Here, we develop a single-cell microscopy assay that allows the distinct phases and machineries of resection to be interrogated simultaneously in living S. pombe cells. Using this assay, we find that the 53BP1 orthologue and Rev7 specifically repress long-range resection through the RecQ helicase-dependent pathway, thereby preventing hyper-resection. These results suggest that ‘rewiring’ of BRCA1-deficient cells to employ an Exo1-independent hyper-resection pathway is a driver of PARPi resistance.
https://doi.org/10.7554/eLife.33402.001eLife digest
Healthy cells can typically repair damage to their DNA with high accuracy, keeping their genetic code intact. In contrast, cancer cells often lose this ability. Inaccurate repair leads to more frequent DNA mutations, which can make a tumor more aggressive. However, DNA repair-deficient tumors can be targeted with cancer therapies, such as PARP inhibitors, which kill cells that do not have working DNA repair mechanisms. PARP inhibitors show great promise clinically, but unfortunately some tumor cells can become resistant to these treatments over time. Recent work has shown that resistance to PARP inhibitors is often caused by further alternations to DNA repair machineries.
Being able to visualize DNA repair in living cells is crucial to understanding this process and to find ways to improve cancer treatments. Previous studies have used repetitive DNA sequences called Lac operators (LacO) to visualize the dynamic behavior of DNA in live cells. Leland et al. have now adapted this system to watch individual DNA repair events in living yeast cells under the microscope. Their experiments reveal that when cells lose a single protein called Rev7, an early phase of DNA repair becomes hyperactive. Leland et al. traced the cause of this hyperactivity to an enzyme in the RecQ helicase family.
A RecQ helicase becoming hyperactive in cells lacking Rev7 could explain how some cancer cells become resistant to PARP inhibitor treatments. This information could help fine-tune future approaches to treating cancer. For example, using an inhibitor of RecQ helicase alongside PARP inhibitors may help block this type of resistance from developing in the first place. As well as potentially paving the way for better cancer treatments, this method of visualization could improve scientists’ understanding of the basic processes of DNA repair.
https://doi.org/10.7554/eLife.33402.002Introduction
DNA repair is an essential process conserved throughout evolution and commonly disrupted in tumor cells (Jeggo et al., 2016). Many cancer treatments, including poly(ADP ribose) polymerase (PARP) inhibitors (PARPi), target DNA repair pathways to kill rapidly dividing, repair-deficient cells (Farmer et al., 2005; Fojo and Bates, 2013; Lord et al., 2015; Mateo et al., 2015). 5’ end resection, which generates tracts of single-strand DNA (ssDNA) at DNA double-strand break (DSB) ends dictates repair pathway choice: blocking resection promotes canonical non-homologous end joining (typically in G1), while initiating resection commits a DSB to repair by homologous recombination (HR), usually in S/G2 (Chapman et al., 2012; Hustedt and Durocher, 2016; Symington, 2016). The resection machinery is tightly controlled at both the step of resection initiation (involving Ctp1/Sae2/CtIP and the MRN/X complex) and during long-range resection, which is mediated by two parallel pathways catalyzed by either the exonuclease Exo1 or the combination of a RecQ helicase and Dna2 (Chen et al., 2012; Croteau et al., 2014; Nimonkar et al., 2011; Tkáč et al., 2016; Zimmermann et al., 2013). Additional accessory factors play key roles as modulators of resection; for example, loss of Rev7/MAD2L2/FANCV, a small, multifunctional HORMA domain protein (Bluteau et al., 2016; Rosenberg and Corbett, 2015) derepresses resection inhibition (Boersma et al., 2015; Xu et al., 2015), thereby allowing HR-deficient, Brca1–/–p53–/– cells to become resistant to PARPi. In human cells, Rev7 appears to act in concert with another inhibitor of resection, 53BP1(Chapman et al., 2013; Ochs et al., 2016; Zimmermann et al., 2013), loss of which is also sufficient to drive PARPi resistance (Boersma et al., 2015; Bouwman et al., 2010; Jaspers et al., 2013; Xu et al., 2015). Importantly, the mechanisms by which Rev7 and 53BP1 inhibit DSB end resection remain poorly understood. To gain insights into how resection is controlled, we have developed a single-cell microscopy-based assay capable of quantitatively measuring DSB end resection rates in the facile genetic model, S. pombe. Leveraging this assay, we find that Rev7 and the 53BP1 orthologue, Crb2, specifically inhibit the RecQ-helicase-dependent long-range resection pathway. Moreover, through derepression of RecQ helicases, rev7∆ or crb2∆ cells can achieve very fast resection rates (>20 kb/hr) – approximately twice as fast as Exo1-dependent long-range resection. As BRCA1 activity has been tied to Exo1-dependent long-range resection (Tomimatsu et al., 2012), our findings suggest that PARPi resistance can be driven by compensation through derepression of the RecQ-helicase-dependent resection pathway.
Results
A microscopy-based assay to measure the rate of long-range resection in single cells
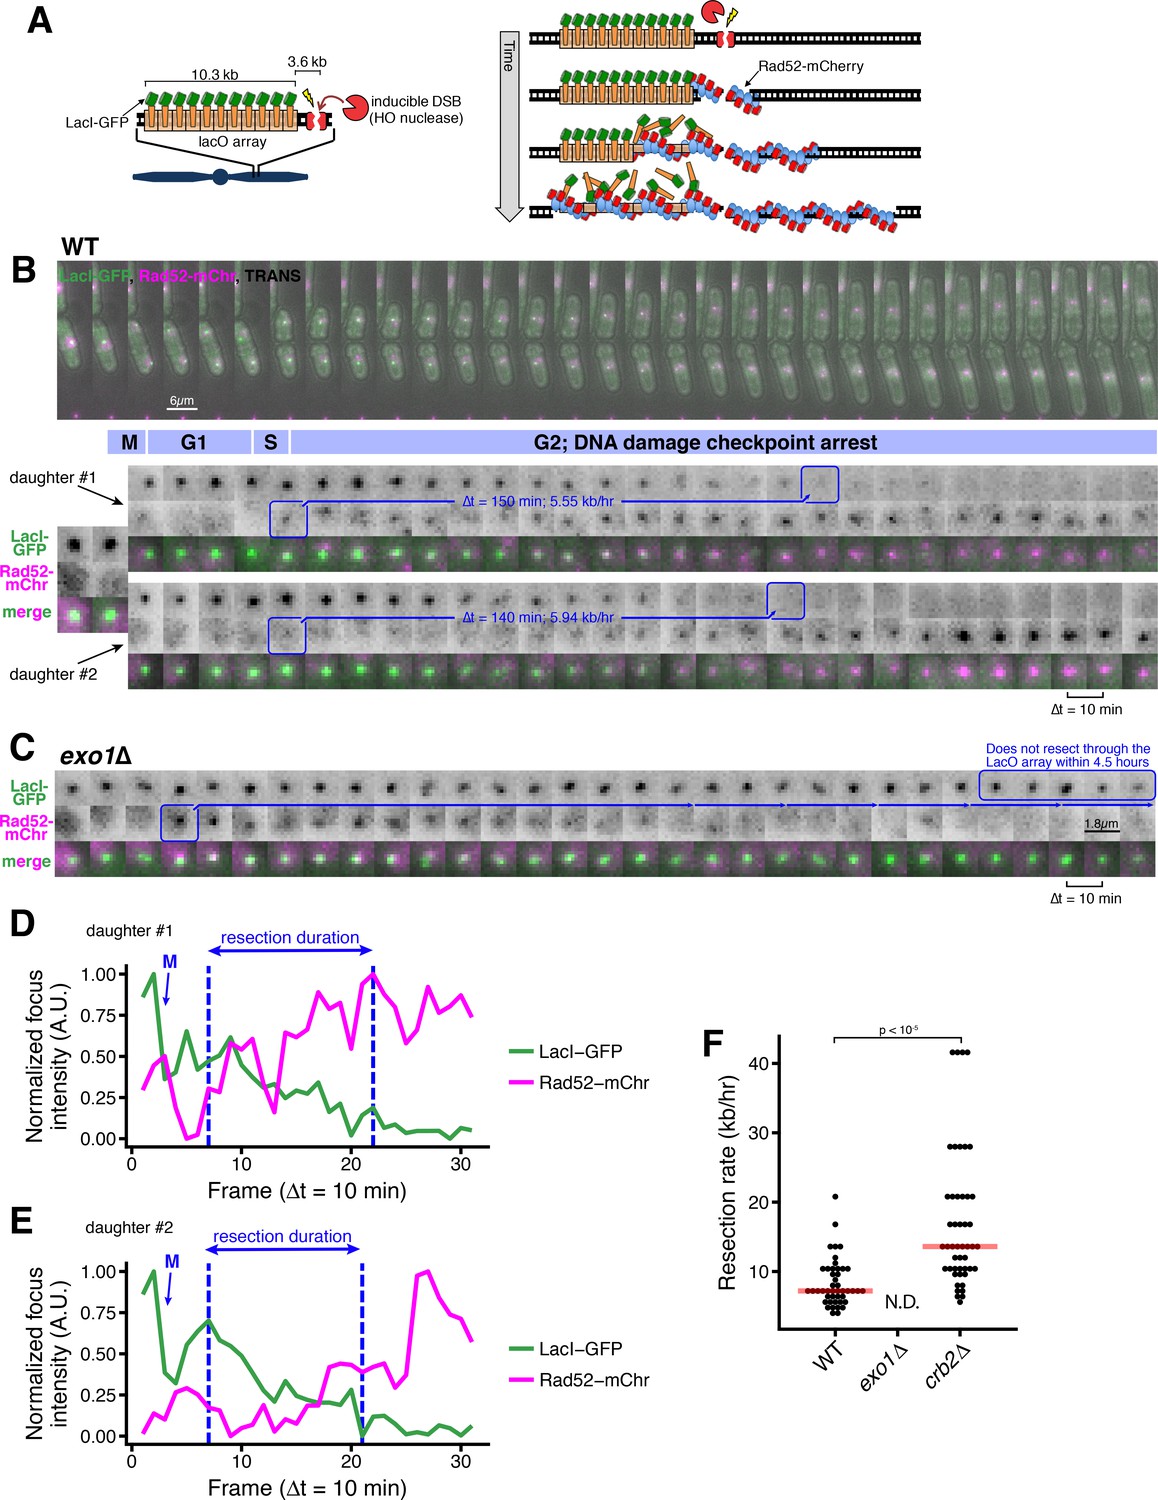
In order to quantitatively measure initial steps in DSB processing in single, living cells, we developed a microscopy-based DSB end resection assay (Figure 1A). In this system, an ectopic 10.3 kb, 256-copy LacO array and adjacent HO endonuclease cut site (HOcs) are engineered at a euchromatic (but intergenic) region near Mmf1 (Figure 1—figure supplement 1). A single, site-specific DSB is generated by regulating the expression of the HO endonuclease under the control of the Ura-inducible Purg1lox RMCE system (Watson et al., 2008; 2011). The timing of on-target DSB events is visualized by the appearance of a Rad52(Rad22)-mCherry focus that co-localizes with Mmf1:LacO/LacI-GFP (Figure 1B). By tracking cell lineages, we see that HO endonuclease induction produces on-target Rad52-mCherry foci in S/G2 (G1 is very short in S. pombe) when the repair machinery is primed for HR (Symington and Gautier, 2011) (Figure 1B). Importantly, we do not observe loading of Rad52-mCherry at the LacO/LacI-GFP array in the absence of HO endonuclease expression (on-target Rad52 foci in <0.2% of uninduced cells, n = 657), suggesting that the LacO array is not sufficient to create a ‘fragile site’ in S. pombe (Jacome and Fernandez-Capetillo, 2011; Saad et al., 2014).

A microscopy-based assay to measure long-range resection in single cells.
(A) Design of the LacO resection assay in S. pombe. HO endonuclease cut cite (HOcs) and LacO integration at the Mmf1 locus on Chr II allows live-cell measurements of resection rates. Rad52-mCherry loads on DSB ends after resection initiation, and LacI-GFP is displaced as resection creates long tracts of ssDNA through the LacO array. (B) DSB resection events in two WT daughter cells. The majority of the S. pombe cell cycle is spent in G2, and all DSBs are observed in S/G2 based on the timing of mitosis and cell fission. Images shown are maximum intensity Z-projections acquired at 10-min time intervals. Blue annotations denote the starting point of resection (first frame with a detectable Rad52 focus, shortly after resection begins) and the end point (first frame with total loss of the LacO/LacI-GFP focus) of individual resection events. These start/end frames mark the total duration of resection through the 13.87 kb distance between the HOcs and the distal end of the repetitive LacO array and are used to compute resection rate (kb/hr) for individual cells. (C) Representative resection-deficient exo1∆ cell that that loads on-target Rad52-mCherry but does not lose the LacO/LacI-GFP focus. Because resection of the LacO array is too slow to be completed during the window of data acquisition, we are not able to quantify the rate of resection in exo1∆ cells. (D and E) Quantification of LacO/LacI-GFP focus and Rad52-mCherry focus intensities over time for the cells shown in (B). The arrow and ‘M’ show the time of mitotic division, which leads to a decrease in GFP intensity. Quantification used full Z-stack images (not maximum intensity projections shown in B) at subpixel resolution with background normalization. See Materials and methods for more details. (F) Single-cell measurements of resection rate using the LacO resection assay. Horizontal red bars mark the median resection rate for each genotype. exo1∆ rates cannot be determined (N.D.) because resection through the LacO array does not complete within 5 hr of data acquisition. p-values shown are from pairwise two-tailed t-tests, using a Bonferroni correction for multiple comparisons. Number of biological replicates and counts of analyzed cells can be found in Supplementary file 2.
As resection proceeds, the LacO repeats become single-stranded, disrupting LacI-GFP binding and causing the intensity of the GFP focus to progressively decrease (Bell and Lewis, 2001) (Figure 1B, Figure 1—figure supplement 2). To verify that loss of GFP focus intensity reflects DSB end resection, we analyzed cells lacking Exo1, which catalyzes the majority of long-range resection in WT S. pombe, with the Rqh1/Sgs1/BLM and Dna2 resection pathway playing a secondary role (Langerak et al., 2011). As expected, cells lacking Exo1 show a persistent LacO/LacI-GFP focus over many hours even after Rad52-mCherry loads (Figure 1C). Importantly, loss of Exo1 does not influence the induction of the site-specific DSB as measured by quantitative loss of a PCR product across the cut site (Figure 1—figure supplement 3A).
This assay only visualizes DSB foci after resection initiation by Ctp1/Sae2/CtIP and MRN/MRX (~100 nt of resection), as Rad52 loads at DSBs by exchanging with RPA on nascent ,resected ssDNA ends (Jensen and Russell, 2016; Lisby et al., 2004; Ma et al., 2015; Mimitou and Symington, 2008). Using quantitative imaging with calibration strains, we estimate that visualization of the Rad52-mCherry focus requires loading of ~30 copies (see Materials and methods), representing a Rad52 filament equivalent to at least 90 nt (but likely several hundred nts, see below) of resected ssDNA on each sister in G2 (Gibb et al., 2014; Grimme et al., 2010; Kagawa et al., 2002; Singleton et al., 2002; Swartz et al., 2014; Wu and Pollard, 2005). To test the frequency with which resection initiation leads to visible Rad52 foci in this assay, we compared the timing of Rad52-mCherry foci formation within the cell population to an independent measure of resection using a quantitative PCR (qPCR) assay in which resection protects from digestion at an ApoI cut site 168 nt downstream of the HO cut site (Langerak et al., 2011) (Figure 1—figure supplement 3B). Using this qPCR-based assay, we observe similar DSB induction frequency and kinetics for ApoI protection and Rad52 focus formation, with an apparent 30–60 min delay between ApoI protection (qPCR) and Rad52-mCherry loading, which likely represents the time required for RPA loading and exchange to Rad52 (Lisby et al., 2004) (Figure 1—figure supplement 3C). As the visibility of the LacO array is an important endpoint for this assay, we estimate that the LacI-GFP focus is visible down to a LacO array length of <500 bps under these conditions, based on our ability to robustly detect the focus from a 1 kb LacO array integrated into S. pombe (Figure 1—figure supplement 3D–G).
By measuring the time interval between Rad52-mCherry focus formation and LacO/LacI-GFP focus disappearance, we can determine the time required to resect through the full LacO array in individual cells (Figure 1B, Figure 1—figure supplement 2A-D, blue boxes). For example, for the two daughter cells in Figure 1B arising from cell division, the time interval from Rad52-mCherry loading until loss of the LacO/LacI-GFP focus is 150 min for the upper cell (‘1’), and 140 min for the lower cell (‘2’). The progressive loss of LacI-GFP intensity and gain in Rad52-mCherry intensity during the duration of resection is further illustrated by quantitative image analysis (Figure 1E–F and Figure 1—figure supplement 3A'–B'). As we know the genomic separation of the LacO array and the HO cut site (13.9 kb, Figure 1—figure supplement 1), we can calculate the resection rate from the resection duration. For example, the calculated resection rates for the two cells in Figure 1B are very similar at 5.55 and 5.94 kb/hr. Across all WT cells, we detect a median, long-range resection rate of 7.6 kb/hr (Figure 1F). This rate is somewhat faster than the resection rates measured by previous population-based assays using qPCR in S. pombe (4 kb/hr) or Southern blot in S. cerevisiae (4.4 kb/hr) (Langerak et al., 2011; Zhu et al., 2008). As this assay isolates the process of long-range resection after Rad52 loading, one possibility is that resection rates that measure both resection initiation and long-range resection give rise to slower rates. Importantly, using the qPCR approach to compare resection upstream of the DSB (which contains the LacO array) and downstream of the DSB (which does not) demonstrates that any influence of the LacO array on resection rate is minor (Figure 1—figure supplement 3H).

Loss of Rev7 causes an increase in long-rage resection comparable to the loss of Crb2.
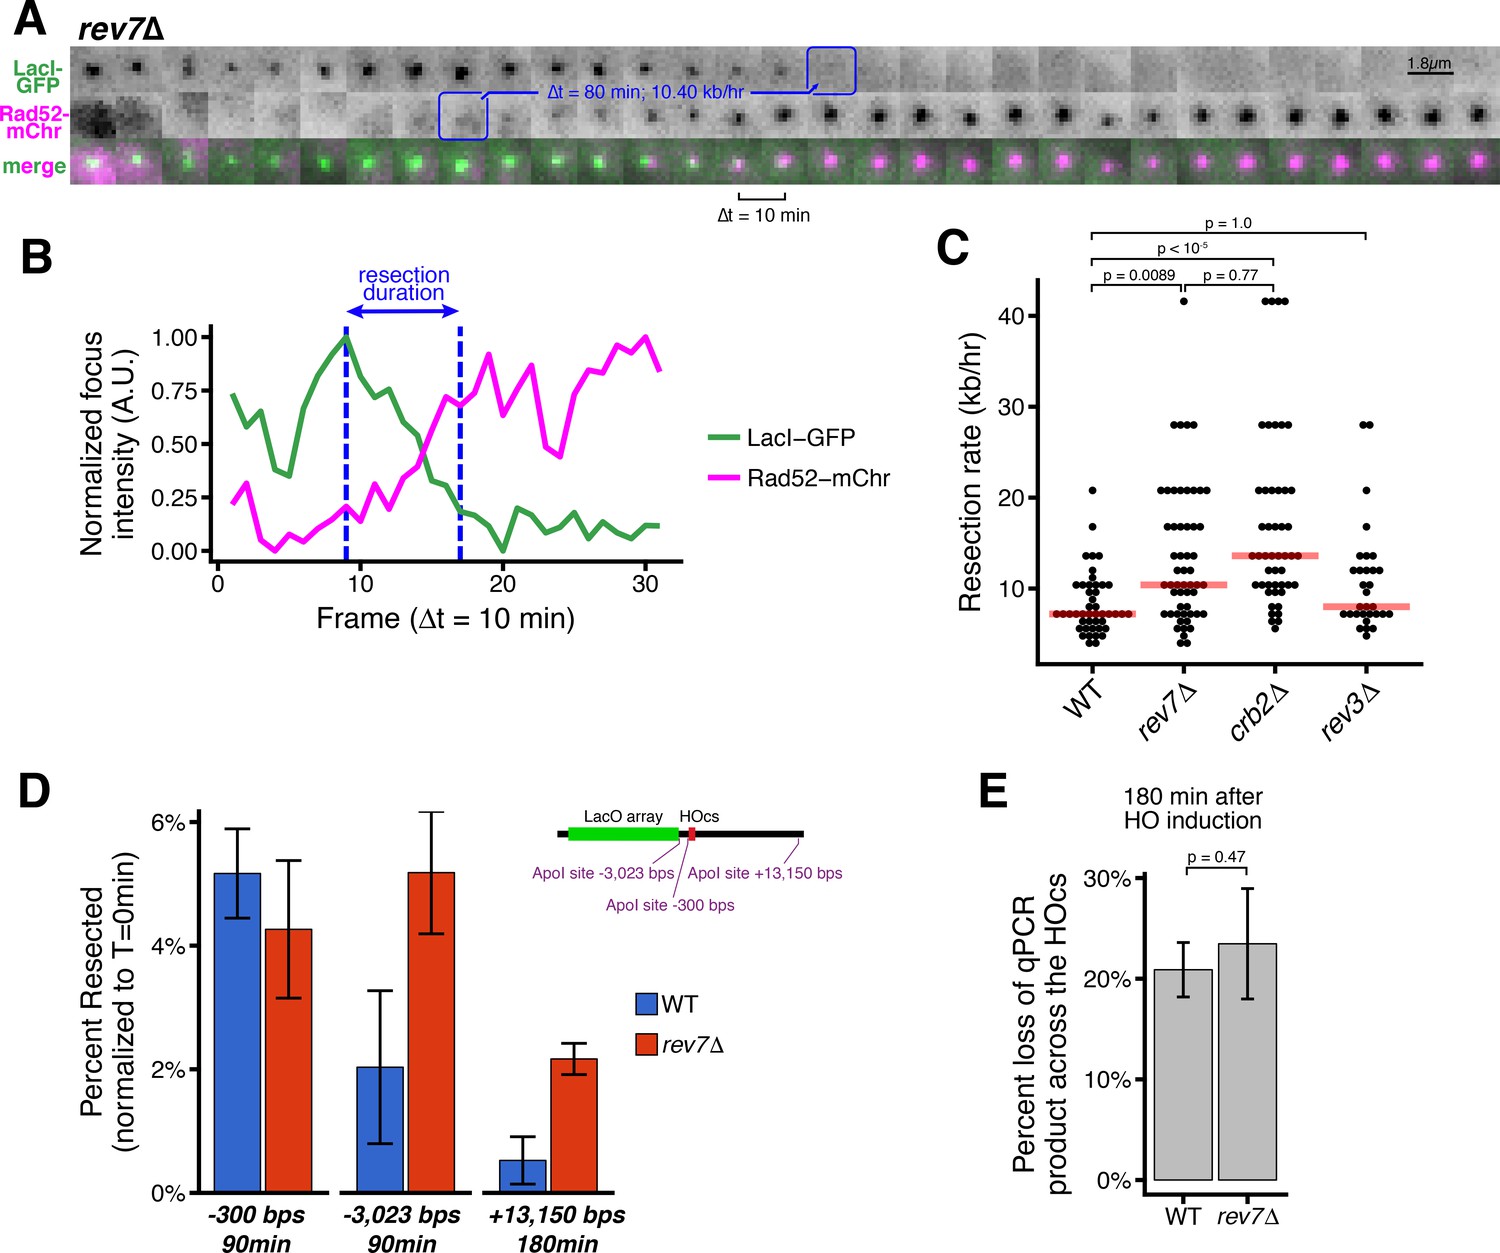
(A) Representative timeseries of resection through the LacO array in a single rev7∆ cell. Blue annotations mark the beginning and end of the resection event, as in Figure 1B. (B) Subpixel quantification of focus intensity for the rev7∆ cell resection event shown in (A). Quantification is as described in Figure 1D,E and in the Materials and methods. (C) Single-cell measurements of resection rate using the LacO resection assay. Horizontal red bars mark the median resection rate for each genotype. p-values shown are from pairwise two-tailed t-tests, using a Bonferroni correction for multiple comparisons. Number of biological replicates and counts of analyzed cells can be found in Supplementary file 2. (D) The long-range rate of resection in rev7∆ and WT cells, measured with an ApoI protection qPCR assay on a population level. ApoI cut site distances from the HOcs are indicated and shown in the diagram at right. Error bars show 95% CIs for at least three technical qPCR replicates across two or more biological replicates. (E) Similar to D, qPCR primers spanning the HOcs itself are used to monitor the efficiency of the HO cutting to form DSBs at 180 min after HO induction by uracil addition.
As resection in the absence of Exo1 is very inefficient (Figure 1C), the rate cannot be determined using this assay. However, we can infer an upper bound of the long-range resection rate of ~2.8 kb/hr for exo1∆ cells. We also note a strong inhibition of resection (comparable to ctp1∆ cells) as close as 300 nts from the DSB in cells lacking Exo1 as detected by qPCR (Figure 1—figure supplement 3I); this correlates with a defect in Rad52-mCherry loading in the imaging-based resection assay (Figure 1—figure supplement 3J). This observation confirms that the extent of resection required to form visible Rad52 foci in this assay discussed above (~30 molecules; <300 nt) partially requires Exo1-dependent resection in addition to MRN/MRX- and Ctp1/Sae2/CtIP-dependent resection initiation (Symington, 2016), consistent with a study in budding yeast suggesting a specific requirement for Exo1 in the early phase of resection post-initiation (Saad et al., 2014).
53BP1 (in human cells) and its orthologue Rad9 (in budding yeast) repress resection initiation (Chapman et al., 2012; Ferrari et al., 2015; Symington, 2016); in budding yeast, loss of Rad9 also increases resection efficiency (Bonetti et al., 2015). Applying the live cell resection assay to fission yeast lacking the orthologous Crb2, we observe a strong increases the median rate of resection to (13.9 kb/hr), with some individual cells demonstrating very fast (~40 kb/hr) resection rates (Figure 1F). Thus, we can readily assess factors that positively and negatively influence long-range resection rate using this new LacO-based assay.
Rev7 inhibits long-range resection
Next, we examined how loss of Rev7 influences long-range resection at DSBs during S/G2. The duration of LacO array resection is shorter in rev7∆ cells than in WT cells (80 min or less, Figure 2A–B and Figure 2—figure supplement 1). In the population, the median long-range resection rate for rev7∆ cells is similar to cells lacking Crb2 (10.4 kb/hr, Figure 2C). As Rev7 also functions with Rev3 as part of the polymerase ζ complex in translesion synthesis, we also confirmed that Rev3 does not affect resection (Figure 2C), consistent with previous data showing that repressing resection during HR is a distinct function of Rev7 (Boersma et al., 2015; Rosenberg and Corbett, 2015; Xu et al., 2015). Using the orthogonal qPCR approach (Figure 1—figure supplement 3B), we confirm that in rev7∆ cells, more chromosomes with DSBs have undergone 3 kb and 13 kb of resection than WT between 90 and 180 min after HO induction, respectively (Figure 2D). Again, loss of Rev7 has no influence on the rate of DSB induction (Figure 2E).
The RecQ helicase, Rqh1, rather than Exo1, drives hyper-resection in the absence of Crb2 and Rev7
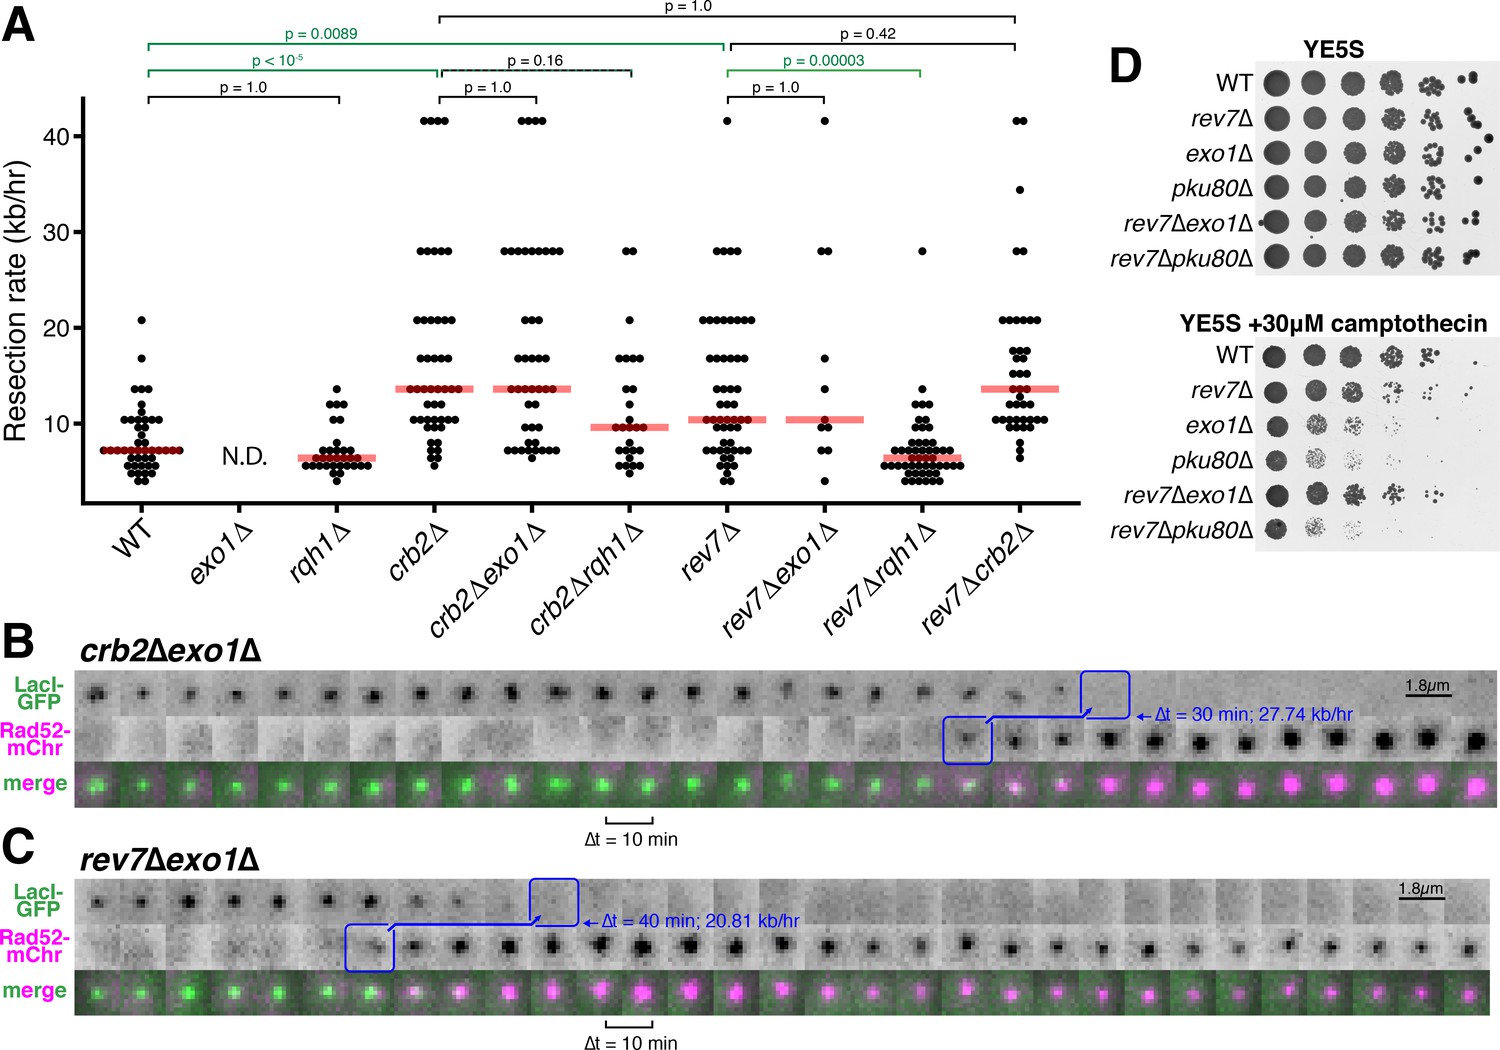
We next asked if Crb2/Rad9/53BP1 and Rev7 inhibit long-range resection through the Exo1 pathway, the RecQ helicase (Rqh1)-Dna2 pathway, or both (Symington and Gautier, 2011). Interestingly, we find that the rapid long-range resection rate observed in crb2∆ or rev7∆ cells is entirely Exo1-independent (Figure 3A–C, Figure 3—figure supplement 1). In stark contrast, the rapid rate of resection in a rev7∆ single mutant is entirely dependent on the presence of Rqh1 (Figure 3A). Consistent with these observations, we find that loss of Rev7 is able to rescue the severe growth defect of exo1∆ cells on rich media plates containing camptothecin, consistent with a derepression of Rqh1-dependent resection in the absence of a functional Exo1 pathway (Figure 3D). When considering only precisely determined resection events, the average long-range resection rate in crb2∆ cells is not statically less than that of crb2∆rqh1∆ cells when correcting for multiple comparisons (p=0.16) (Figure 3A). However, in many crb2∆rqh1∆ cells, resection durations extend beyond the timeframe of data acquisition, suggesting that rapid crb2∆ resection also requires Rqh1 (Figure 3—figure supplement 2).

Rev7 and Crb2 act through the RecQ helicase, Rqh1, and not Exo1, to inhibit long-range resection.
(A) Epistasis analyses of long-range resection rates from single-cell measurements. exo1∆ rates cannot be determined (N.D.) because resection through the LacO array does not complete within 5 hr of data acquisition. Red bars show median resection rates and p-values are from pairwise two-tailed t-tests, using a Bonferroni correction for multiple comparisons (significant comparisons shown in green). (B,C) Very rapid resection through the 10.3 kb LacO array is common in crb2∆exo1∆ (B) and rev7∆exo1∆ (C) cells, in contrast to exo1∆ single mutants that do not completely resect the LacO array within 5 hr (see Figure 1C). (D) Growth assay on rich media with and without camptothecin. Loss of Rev7 can rescue the severe growth defect of exo1∆ cells.
Taken together, these results strongly suggest that loss of either Rev7 or Crb2 drives a shift in resection pathway mechanism from Exo1 to the RecQ helicase-dependent pathway. Unlike Exo1-driven resection that dominates in WT cells, crb2∆ or rev7∆ cells in which the RecQ helicase is derepressed are capable of resection rates in excess of 20 kb/hr, indicating that the RecQ helicases are more capable of driving hyper-resection of DSBs than the Exo1-dependent pathway. The strong inhibition of RecQ helicase-dependent resection by Crb2 and Rev7 also explains why Rqh1 is not a major player in WT S. pombe resection, since Rqh1 can be derepressed to such a large extent (by loss of Crb2 or Rev7) that Exo1 becomes dispensable for long-range resection in crb2∆exo1∆ and rev7∆exo1∆ cells (Figure 3A-C, Figure 3—figure supplement 1).
Discussion
Here, we demonstrate a microscopy-based assay capable of quantitatively measuring DSB end resection in living cells, specifically the long-range phase of resection catalyzed by Exo1 or Rqh1/Dna2. By allowing for the visualization of resection in single cells, this assay reveals individual long-range resection rates, which will provide access to information about the variability in resection efficiency within cell populations. Moreover, as this assay allows the tracking of the location of DSB lesions within the nucleus, it will be able to uniquely interrogate the role of intranuclear architecture on resection rates and pathways in the future.
By leveraging the advantages of this LacO-based assay, we show that Crb2/Rad9/53BP1 and Rev7 both act as specific inhibitors of RecQ helicase-mediated long-range resection of DSBs (Figures 2 and 3), supporting a model in which loss of these resection inhibitors drives a change in resection pathway rather than boosting Exo1-dependent resection. This is consistent with a previous study that identified specific mutations in the budding yeast RecQ helicase, Sgs1, that can disrupt inhibition by the Crb2 orthologue, Rad9, leading to a gain in Sgs1-dependent resection (Bonetti et al., 2015), as well as a recent study highlighting the ability of Rad9 to antagonize resection at stalled replication forks by repressing a Dna2-dependent pathway (Villa et al., 2018). Integrating these findings together with this study, we suggest that Crb2/Rad9 and Rev7 enforce Exo1-dependent long-range resection in yeasts, which prevents the hyper-resection that we find is characteristic of the RecQ helicase/Dna2 pathway (Figure 3 and Bonetti et al., 2015). In support of this model, we find that loss of Rev7 is able to restore cell viability of exo1Δ cells on media containing camptothecin, suggesting that derepression of Rqh1 can substitute for loss of Exo1, consistent with the gain in resection rate in cells lacking both Rev7 and Exo1 (Figure 3).
The ability of Rev7 to antagonize RecQ helicase/Dna2-dependent long-range resection in fission yeast is very likely to be conserved in mammalian cells. Indeed, indirect evidence suggests that Rev7 knock-down promotes a gain in resection, as loss of Rev7 rescues CtIP-dependent RPA and Rad51 loading at irradiation-induced DSBs in cells lacking BRCA1 (Xu et al., 2015). Importantly, the resection pathway responsible for the gain in repair factor loading was not investigated in this study, but our work suggests that BLM (acting with DNA2) is a likely candidate. Loss of Rev7 does lead to longer 3’ single-stranded G-rich overhangs at telomeres in cells with inactivated TRF2 (a component of the shelterin complex); in this case, only a partial rescue was obtained by co-depletion of CtIP or Exo1 (Boersma et al., 2015). Again, we hypothesize that this finding likely reflects contributions of BLM and DNA2, although it remains possible that the impact of Rev7 on long-range resection during G2 figures more prominently in fission yeast.
Critically, our findings suggest a new mechanism by which loss of either 53BP1 or Rev7 allows BRCA1-/- p53-/- cells to become resistant to PARP inhibitors (Jaspers et al., 2013; Xu et al., 2015). It has been proposed previously that the compromised CtIP- and Exo1-dependent resection in BRCA1-deficient cells can be restored by loss of 53BP1 or Rev7 (Boersma et al., 2015; Xu et al., 2015), thereby overcoming the increased DSB load caused by PARP inhibitors (Polato et al., 2014; Tomimatsu et al., 2012). Our study reveals that not just the efficiency, but also the molecular mechanism of resection is altered upon loss of Crb2/53BP1 or Rev7. We expect these insights to have several consequences. First, RecQ helicases, when paired with DNA2, are capable of exceptionally fast resection in vitro (Niu et al., 2010), which when derepressed by loss of 53BP1 or Rev7 could cause extended tracts of ssDNA several kb long, promoting further genome instability (Hicks et al., 2010; Ochs et al., 2016); indeed, our data point to such a hyper-resection phenotype upon loss of either Crb2 or Rev7 (Figure 2C). Second, our results suggest that inhibitors of RecQ helicases could potentially re-sensitize BRCA1-null cells to PARP inhibitors, as this would make them both Exo1- and RecQ helicase-deficient (Aggarwal et al., 2013; Yazinski et al., 2017).
Materials and methods
Cell culture, strain construction and verification
Request a detailed protocolThe strains used in this study are listed in Supplementary file 1. S. pombe were grown, maintained, and crossed using standard procedures and media (Moreno et al., 1991). Gene replacements were made by exchanging open reading frames with various MX6-based drug resistance genes (Bähler et al., 1998; Hentges et al., 2005). The 10.3 kb LacO array was inserted between Mmf1 and Apl1 on the right arm of chromosome II (Chr II: 3,442,981) using a modified two-step integration procedure that first creates a site-specific DSB to increase targeting efficiency of linearized plasmid pSR10_ura4_10.3kb (Leland and King, 2014; Rohner et al., 2008). A modified MX6-based hygromycin-resistance cassette containing the HO cut site was then inserted between Apl1 and Mug178 on chromosome II (Chr II: 3,446,249), 3.2 kb distal to the LacO insertion. The total distance between the HO cut site and the beginning of the 10.3 kb LacO array is 3.57 kb. As the LacO array can contract during the process of transformation, integrants were screened by HincII digest followed by southern blot (Figure 1—figure supplement 1) using standard procedures, a biotin-conjugated LacO probe, and a streptavidin-HRP chemilluminescent detection system (Thermo #N100 and #34096).
DSB induction using Purg1lox-HO
Request a detailed protocolWe used the uracil-responsive Purg1lox expression system, with slight modifications, to induce HO endonuclease expression and create site-specific DSBs at the HO cut site (Watson et al., 2011; Watt et al., 2008). We performed a fresh integration of the HO gene at the endogenous urg1 locus for each experiment in order to reduce long-term instability at the HO cut site or the development of HO resistance, presumably due to insertion/deletion events caused by basal expression levels of HO. The pAW8ENdeI-HO plasmid (a gift from Tony Carr) was transformed into S. pombe, which were then plated onto EMM-leu+thi-ura plates (-leucine: plasmid selection; +thiamine: Pnmt1-Cre repression; -uracil: Purg1lox-HO repression). After 4–5 days of growth at 30°C, 40–100 individual colonies were combined to obtain a reproducible plasmid copy number across the population. Cre-mediate HO gene exchange at the endogenous Urg1 locus (urg1::RMCEbleMX6) was induced by overnight culture in EMM-thi-ura+ade+NPG media (-thiamine: expression of Cre from pAW8ENdeI-HO; -uracil: Purg1lox-HO repression; +0.25 mg/mL adenine: reduce autofluorescence; +0.1 mM n-Propyl Gallate (NPG): reduce photobleaching in microscopy experiments, prepared fresh). The following day, site-specific DSBs were induced in log-phase cultures by the addition of 0.50 mg/mL uracil. This induction strategy resulted in ~15% of cells making a DSB within ~2 hr (Figure 1—figure supplement 3C).
qPCR resection assay
Request a detailed protocolInitiation of resection was assessed using a previously described qPCR assay where ssDNA produced by resection causes protection from ApoI digestion (Langerak et al., 2011). ApoI cut site positions (relative to the HO cut cite (Chr II: 3446192)) and PCR primer sets spanning each ApoI recognition site can be found in Supplementary file 3. Mock HincII digestions (do not affect qPCR products) and additional control primers at Ncb2 were used to normalize for ApoI digestion efficiency (see Supplementary File 3).
Microscopy
Request a detailed protocolAll images were acquired on a DeltaVision widefield microscope (Applied Precision/GE) using a 1.2 NA 100x objective (Olympus), solid-state illumination, and an Evolve 512 EMCCD camera (Photometrics). Slides were prepared ~20 min after adding 0.50 mg/ml uracil to log-phase cultures to induce HO endonuclease expression and DSB formation. Cells were mounted on 1.2% agar pads (EMM +0.50 mg/mL uracil, +2.5 mg/ml adenine, +0.1 mM freshly prepared NPG) and sealed with VALAP (1:1:1 vaseline:lanolin:paraffin). Image acquisition began between 40 and 80 min after uracil addition. Imaging parameters for all resection assay data acquisition were as follows. Transmitted light: 35% transmittance, 0.015 s exposure; mCherry: 32% power, 0.08 s exposure; GFP: 10% power, 0.05 s exposure. At each time point (every 10 min for 5–7 hr), 25 Z-sections were acquired at 0.26 μm spacing. Identical imaging parameters were used to image a strain expressing endogenously tagged Sad1-mCherry (Sad1 forms a single focus at the spindle pole body that contains between 450 and 1030 molecules) and relative mCherry foci intensities were used to determine that ~30 molecules of Rad52-mCherry are required to detect a visible focus with these imaging parameters (Wu and Pollard, 2005).
Image analysis
Request a detailed protocolFor the LacO resection assay, every cell cycle was tracked and quantified individually, including timing of nuclear division, cellular division, Rad52-mCherry focus formation, and LacO/LacI-GFP focus disappearance. Only on-target Rad52 foci (that co-localized with LacO/LacI-GFP for at least 2 frames) were considered, since many DSB events occur throughout the genome spontaneously, especially during S-phase. The number of cells and events used to generate the plots in all Figures is included as Supplementary file 2. The time between the first frame with an on-target Rad52-mCherry focus and the first frame with complete disappearance of the LacO/LacI-GFP focus is the duration of resection through 3.57 kb (between the HO cut site and the start of the LacO repeats) plus the full 10.3 kb LacO array. All fields from all genotypes were input into custom ImageJ macros that randomized the order of the fields/genotypes, blinded the images by removal of the file names, set the contrast to be identical for every image, and numbered each cell lineage. Each blinded field was then manually assessed for photobleaching of the LacO/LacI-GFP foci in cells without induced DSBs (>80% of all cells) to ensure that disappearance of any LacO/LacI-GFP foci in cells with on-target DSBs was due to resection through the LacO array rather than photobleaching of the GFP signal. Next, using the pre-determined contrast settings for mCherry and GFP channels (to maintain consistency across all images analyzed) individual cells which had on-target DSB events were manually identified, and scored for the first frame of Rad52-mCherry focus appearance and then the first frame in which the LacO/LacI-GFP focus had completely disappeared.
For focus intensity plots (e.g. Figure 1D,E), quantification was performed in ImageJ on the full 5D image stacks (not maximum intensity projections, which are shown in the image panels throughout for ease of viewing, for example Figure 1B). Subpixel measurements were made in a cylinder approximating the point spread function surrounding the manually scored subpixel center of the focus. A cylindrical shell surrounding the focus was used for background subtraction in both the GFP and mCherry channels.
Raw data were processed, visualized, and analyzed using R, in particular packages dplyr, ggplot2, and broom. Raw data, raw analysis for all individual cells included in plots, complete code, and other supporting materials are publically available on GitHub https://github.com/lelandbr/Leland_King_2018_eLife_Rev7_EndResection (King and Leland, 2018; copy archived at https://github.com/elifesciences-publications/Leland_King_2018_eLife_Rev7_EndResection).
Growth assays
Request a detailed protocolCells were grown overnight in YE5S media. Concentrations for each culture were monitored by both OD600 and a Coulter Principle cell counter (Orflow Moxi Z). Cultures were diluted as needed to ensure identical numbers of cells were spotted for each genotype, starting with ~4×10⁶ cell/mL and going down by sixfold dilutions. Plates were prepared using standard procedures (Moreno et al., 1991), with the addition of 30 μM camptothecin (Sigma; ≥95% HPLC purified) after autoclaving.
Data availability
Raw analysis for all individual cells included in plots, complete code, and other supporting materials are publicly available on GitHub github.com/lelandbr/Leland_King_2018_eLife_Rev7_EndResection. The raw movies for representative cells presented in the figures have been uploaded to Dryad [doi:10.5061/dryad.1db5500]. The full raw datasets (all cells, all fields, all movies) are available on request from the corresponding author (megan.king@yale.edu) as they are TBs in size.
-
Rev7 and 53BP1/Crb2 prevent RecQ helicase-dependent hyper-resection of DNA double-strand breaksAvailable at Dryad Digital Repository under a CC0 Public Domain Dedication.
References
-
The Lac repressor: a second generation of structural and functional studiesCurrent Opinion in Structural Biology 11:19–25.https://doi.org/10.1016/S0959-440X(00)00180-9
-
Biallelic inactivation of REV7 is associated with Fanconi anemiaJournal of Clinical Investigation 126:3580–3584.https://doi.org/10.1172/JCI88010
-
53BP1 loss rescues BRCA1 deficiency and is associated with triple-negative and BRCA-mutated breast cancersNature Structural & Molecular Biology 17:688–695.https://doi.org/10.1038/nsmb.1831
-
Human RecQ helicases in DNA repair, recombination, and replicationAnnual Review of Biochemistry 83:519–552.https://doi.org/10.1146/annurev-biochem-060713-035428
-
Protein dynamics during presynaptic-complex assembly on individual single-stranded DNA moleculesNature Structural & Molecular Biology 21:893–900.https://doi.org/10.1038/nsmb.2886
-
Human Rad52 binds and wraps single-stranded DNA and mediates annealing via two hRad52-ssDNA complexesNucleic Acids Research 38:2917–2930.https://doi.org/10.1093/nar/gkp1249
-
The control of DNA repair by the cell cycleNature Cell Biology 19:1–9.https://doi.org/10.1038/ncb3452
-
DNA repair, genome stability and cancer: a historical perspectiveNature Reviews Cancer 16:35–42.https://doi.org/10.1038/nrc.2015.4
-
Using LacO arrays to monitor DNA double-strand break dynamics in live Schizosaccharomyces pombe cellsMethods in Molecular Biology 1176:127–141.https://doi.org/10.1007/978-1-4939-0992-6_11
-
Synthetic lethality and cancer therapy: lessons learned from the development of PARP inhibitorsAnnual Review of Medicine 66:455–470.https://doi.org/10.1146/annurev-med-050913-022545
-
Two separable functions of Ctp1 in the early steps of meiotic DNA double-strand break repairNucleic Acids Research 43:7349–7359.https://doi.org/10.1093/nar/gkv644
-
DNA-repair defects and olaparib in metastatic prostate cancerNew England Journal of Medicine 373:1697–1708.https://doi.org/10.1056/NEJMoa1506859
-
Molecular genetic analysis of fission yeast Schizosaccharomyces pombeMethods in Enzymology 194:795–823.https://doi.org/10.1016/0076-6879(91)94059-L
-
53BP1 fosters fidelity of homology-directed DNA repairNature Structural & Molecular Biology 23:714–721.https://doi.org/10.1038/nsmb.3251
-
CtIP-mediated resection is essential for viability and can operate independently of BRCA1The Journal of Experimental Medicine 211:1027–1036.https://doi.org/10.1084/jem.20131939
-
The multifaceted roles of the HORMA domain in cellular signalingThe Journal of Cell Biology 211:745–755.https://doi.org/10.1083/jcb.201509076
-
A role for nuclear envelope-bridging complexes in homology-directed repairMolecular Biology of the Cell 25:2461–2471.https://doi.org/10.1091/mbc.E13-10-0569
-
Double-strand break end resection and repair pathway choiceAnnual Review of Genetics 45:247–271.https://doi.org/10.1146/annurev-genet-110410-132435
-
Mechanism and regulation of DNA end resection in eukaryotesCritical Reviews in Biochemistry and Molecular Biology 51:195–212.https://doi.org/10.3109/10409238.2016.1172552
-
HELB is a feedback inhibitor of DNA end resectionMolecular Cell 61:405–418.https://doi.org/10.1016/j.molcel.2015.12.013
Decision letter
-
Stephen C KowalczykowskiReviewing Editor; University of California, Davis, United States
In the interests of transparency, eLife includes the editorial decision letter and accompanying author responses. A lightly edited version of the letter sent to the authors after peer review is shown, indicating the most substantive concerns; minor comments are not usually included.
[Editors’ note: a previous version of this study was rejected after peer review, but the authors submitted for reconsideration. The first decision letter after peer review is shown below.]
Thank you for submitting your work entitled "Rev7 and 53BP1/Crb2 prevent RecQ helicase-dependent hyper-resection of DNA double-strand breaks" for consideration by eLife. Your article has been reviewed by three peer reviewers, one of whom is a member of our Board of Reviewing Editors and the evaluation has been overseen by a Senior Editor. The reviewers have opted to remain anonymous.
Our decision has been reached after consultation between the reviewers. Based on these discussions and the individual reviews below, we regret to inform you that your work will not be considered further for publication in eLife.
The overall findings with regard to Crb2 and Rev7 inhibiting the Rqh1 pathway are interesting, but there were many concerns with how the data are collected and analyzed. The manuscript presents novel data based on an assay that is not fully substantiated. Many controls are still needed to support the validity of the underlying assay.
There were unanimous reservations and many discussions about the assay which, in turn, undermined the confidence in, and significance of, the conclusions. Although most of the conclusion were consistent with existing facts, there were some specific inconsistencies noted by the reviewers. Overall, the results seem incomplete or preliminary.
Essential revisions:
Reviewer #1:
This is an interesting paper with potentially important conclusions. The results depend entirely on the assay, which seems to be reliable, but some questions remain:
1) There are no graphs showing the quality of the kinetic data. The authors need to show graphs of intensity vs time, for each assay, with fitting statistics.
2) It's a bit surprising that the array of 256 copies of lac repressor protein doesn't affect the measured rate. The authors need to show overlaid graphs of intensity vs time for the arrays; the PCR data for the arrays with lac repressor; and PCR data for the DNA arrays without lac repressors.
3) In the experiments with tagged RAD52, I don't understand why the foci persist. I would have expected RAD51 to replace the RAD52. Although the intensity does decrease (maybe just from photobleaching), it seems to be slower than the observations from the Rothstein lab on Rad52 in S. cerevisiae.
As stated above, the results are interesting and informative. However, the results rely entirely on the validity of the assay. In the current version, the authors don't present enough analysis and comparisons of the kinetic data to convincingly establish the assay. Presumably, they have the data; they need to provide it.
Reviewer #2:
DNA end resection is essential for homologous recombination, but excessive end resection can be detrimental to genome integrity. Long-range resection is catalyzed by either Exo1 or by a RecQ family helicase in collaboration with Dna2. The relative contribution of these two mechanisms and how they are regulated is not well understood. Here, the authors use a cytological approach to study end resection in single cells. An HO cut site was inserted 3.4-kb from a 10.3-kb lacO array located on Ch 2 of S. pombe. DSB formation/early resection was detected by the appearance of Rad52-mCherry foci that co-localize with the lacO array marked with LacI-GFP. Resection of the entire lacO array results in loss of the GFP signal while the mCherry signal remains. Consistent with a previous study using population based qPCR to measure resection (Langerak et al., 2011), the authors report that most resection is due to Exo1 activity and not Rqh1. Two years ago, several groups reported that Rev7 acts with 53BP1 to inhibit resection in mammalian cells. Here, the authors show that Rev7 and Crb2/53BP1 have a conserved role in preventing long-range resection in S. pombe. Furthermore, they show that Rev7 and Crb2 specifically block resection by Rqh1.
Overall, the authors demonstrate that live cell imaging can be used to study end resection in single cells, and their studies show considerable cell-to-cell variation in the initiation of resection, a feature missed by population-based DNA analysis. However, I'm not convinced that the microscopy-based single-cell assay is the best way to monitor resection. The generated data imply that resection speed can be measured accurately but that relies on some assumptions. In subsection “Image analysis” the authors write "The time between the first frame with an on-target Rad52-mCherry focus and the first frame with complete disappearance of the LacO/LacI-GFP focus is the duration of resection through 3.57 kb (between the HO cut site and the start of the LacO repeats) plus the full 10.3 kb LacO array". Is resection through the complete LacO array necessary for disappearance of the GFP focus? I could imagine that the GFP focus disappears before the complete LacO array is degraded. What is the minimum number of detectable LacO repeats? The authors could integrate LacO arrays of different lengths and check what the detection limit is. Or they should at least confirm the timing of the GFP focus disappearance with the qPCR assay (According to Figure 1—figure supplement 1 they could use HincII for this).
Also, to my eye the Rad52 focus appearance and LacI-GFP focus disappearance are not easily identified (based on the microscopy images shown). The authors should mark the frames they define as "Rad52 focus appearance" and "LacI-GFP focus disappearance". In the Materials and methods section, they don't say how they define these events. Do they do it manually or using some image analysis software? What is the threshold? More details are necessary here to judge the accuracy of the method. Also, the restriction of the assay to 5 hours by photobleaching seems to be a considerable drawback, which limits the number of "usable" cell trajectories (as shown in Figure 2—figure supplement 2B). Perhaps by changing the imaging period and number of z-stacks they could extend the time window for monitoring resection. Other approaches, such as using more photostable fluorescent proteins (e.g. LacI-mKate2, Rad52-monomeric NeonGreen), LEDs as light sources, or switching to an enzyme that cuts more efficiently than HO (I-PpoI has been successfully used in S. pombe and the efficiency of cutting is better than HO) would involve considerable more effort and time.
The authors stress that they use a single cell assay. But it is not clear what the advantage of single cell data is in their work. In the end they are comparing population medians, which could also be generated with bulk experiments. The low DSB formation efficiency might be a motivation to use a single cell assay to restrict the analysis to the few cells with a DSB. However, bulk experiments generally take the cutting efficiency into account, e.g. the qPCR-based assay described by Zierhut and Diffley, (2008) considers the HO cut fraction.
Rad52 foci are used as a read out for DSB formation and initiation of resection. Can these two steps be separated, for example, by measuring DSB formation by qPCR using primers flanking the HO cut site on the same samples used for the ApoI protection assay, or possibly using Mre11-mCherry instead of Rad52? It appears from Figure 1B (upper panel) that resection through most of the lacO array is required for a strong Rad52 signal.
In theory, the HO-induced DSB is unrepairable, but because the HO cutting efficiency is quite low, and S. pombe cells are in G2 most of the time, if one sister chromatid was cut and engaged in repair with the uncut sister it could result in an underestimation of resection. Were cells with a transient Rad52 focus detected? The exo1 example in Figure 1 appears to have a Rad52 focus that appears early and then goes away. Does elimination of Rad51 change the number of cells resecting or rate of resection? At late times, when the mCherry signal is very bright, are both sister chromatids cut and resected?
Langerak et al., used a qPCR assay to measure end resection and reported no defect in resection initiation (35 nt from HO cut site) in the exo1 mutant or exo1 rqh1 double mutant. Is the failure to detect Rad52 foci in most exo1 cells because resection tracts are <90 nt or because the amount of ssDNA required to support a Rad52 focus is much longer than 90 nt? Given that the Rad52 single is quite weak until the lacO array disappears, I think the authors might be under-estimating the amount of ssDNA to visualize a Rad52 focus. Does the exo1 mutant show normal DSB formation (measured with primers flanking the HOcs) and resection to the ApoI site located 168 nt from HOcs? Similarly, is DSB formation normal in the rev7 mutant and can early resection be detected by the qPCR assay?
Why does rqh1 suppress the early resection defect of rev7? An odd result that is not discussed in the text.
While the overall findings on the role of Rev7 and Crb2 repressing the Rqh1 resection pathway are certainly of interest to the field, the data analysis needs to be improved.
Reviewer #3:
DNA end resection is a process that initiates recombination-based DNA double strand break repair. As resection also generally inhibits non-homologous end-joining, regulation of DNA end resection is an important process. The human 53BP1 protein, though its various effectors, has been found to be an inhibitor of DNA end resection, although mechanistic insights are lacking. These processes appear to be at least partially conserved in low eukaryotes.
The authors are using a S. pombe as a model system, where they developed an assay allowing the monitoring of resection in live cells (Figure 1). The assay is based on the disappearance of GFP-LacI and appearance of Rad52-mCherry signal next to HO-endonuclease induced DSB. This is an interesting method that will be useful for high throughput microscopy-based screenings. However, the method has certain limitations in contrast to established southern blotting, PFGE or RTPCR-based methods:
a) The assay measures Rad52 accumulation, which is a step after resection. Rad52 is a mediator that loads Rhp51 on RPA-coated resected DNA. Using RT-PCR based assay, the authors established that there is a correlation between both processes (resection and RAD52 loading). However, this was only done in wt background, and it is possible RAD52 loading might differ in the mutants analyzed, and Rad52 might be loaded with different kinetics dependent on the resection pathway. The authors calculate resection rates making the assumption that there is no difference.
b) The assay measures resection of DNA bound by GFP-LacI, a non-physiologic binder. Therefore, the resection proteins must displace LacI for resection to occur. Under physiologic conditions, DNA near DSBs will likely be chromatinized and subsequently remodeled allowing resection. This is especially a concern when analyzing the role of chromatin binders such as 53BP1/Crb2. Also, the individual resection pathways may be affect by LacI binder to a different degree, which complicates interpretation.
The most interesting finding is that Rev7 and 53BP1/Crb2 appear to repress long-range resection dependent on Rqh1 (Figure 2): In the absence of Rev7 and Crb2, long-range resection is accelerated, which is independent of Exo1 and depends on Rqh1.
1) This observation should be verified using a previously established assay, given the concerns listed above. Related to this point, it remains a formal possibility that the action of Rqh1 is not specific to resection, but to strip LacI, allowing resection through another process. Performing resection with the same mutants in an established setup (with no LacI) will address this concern as well.
The authors then go on to demonstrate differential effects of Rev7 and Crb2 on early resection steps, based on timing of Rad52 foci appearance upon break induction (Figure 3). I am concerned about these results: using Rad52 (a protein with a function downstream of resection) does not appear to be correct as a marker of "early" resection.
2) The results should be analyzed in an established assay where the readout is clearly early resection. Also, to make claims on early resection, the analysis should include mutants deficient in short-range resection (e.g. mre11) and mutants in long-range resection, where both pathways have been inactivated (e.g. exo1 rqh1).
3) In Figure 2, the authors demonstrate that rev7 mutants have accelerated long-range resection, which is dramatically decreased when rqh1 is additionally mutated (rev7 rqh1), supporting the hypothesis that resection in rev7 mutants is Rqh1 dependent. In contrast however, the in Figure 3, the "early" resection is increased when rqh1 is mutated in rev7 background, a completely opposite effect. This is very confusing. The authors comment that "early" resection is a combination of Mre11 and Exo1/Rqh1 dependent processes. This dichotomy reinforces my concerns about the robustness of the experimental setup.
In summary, the manuscript presents an interesting assay and interesting pieces of data, but it seems rather preliminary at this point.
[Editors’ note: what now follows is the decision letter after the authors submitted for further consideration.]
Thank you for submitting your article "Rev7 and 53BP1/Crb2 prevent RecQ helicase-dependent hyper-resection of DNA double-strand breaks" for consideration by eLife. Your article has been reviewed by two peer reviewers, and the evaluation has been overseen by a Reviewing Editor and Kevin Struhl as the Senior Editor.
The reviewers have discussed the reviews with one another and the Reviewing Editor has drafted this decision to help you prepare a revised submission.
The biological findings of this manuscript are interesting, particularly the role of Rev7 in suppressing resection by the Rqh1 pathway, but there are significant concerns over the reliability of the assays used. The authors place equal importance on the fluorescence-based resection presented; however, the reliability of the assay is questionable and the weak point of this work. The conceptual idea of the assay is good, but there are reservations about its implementation and use to quantify resection speed. The authors have, for the most part, established the utility of their assay for the analysis of long-range resection, although they still need to provide a graphical example of their quantification. They discovered interesting roles of Rev7 and Crb2 in Rqh1-dependent resection. As both a methods contribution and a contribution to the recombination field, these findings could justify publication of a revised manuscript.
However, the manuscript then goes on to dissect the roles of these proteins in proximal recombination. Here the work is both incomplete and internally inconsistent. It would appear that the data in Figure 4A and Figure 4C are inconsistent with one another: 4A show a reduction in "Cell cycles with Rad52 foci" for rev7delta, whereas 4C shows no change, within error, for rev7delta at 300 bps (The figure legend, as well as the associated text in the main body of the manuscript, is not justified: "The extent of resection 300 bps and 3 kb from the HO cut site as assessed by the restriction enzyme/qPCR method supports less efficient resection initiation in rev7Δ cells compared to WT at 300 bp…").
Also, the conclusion that of Rev7 promotes early resection is based entirely on how quickly a Rad52 focus forms after break induction, and how many cells have visible Rad52 foci. It was suggested that the authors use a more direct measurement of break induction by qPCR using primers flanking the HO cut site. This has not been done and is a significant concern. If one compares the qPCR data for resection 168-bp from the HO cut site shown in Figure 1D and Figure 1—figure supplement 3B there are vast differences – 3% resection at 120 min in one figure compared with 15% resection at 120 min in the other. If there is this much variability between populations of cells then it could explain why the rev7 mutant looks different to wild type, and why rqh1 appears to suppress the early resection defect of rev7. How many independent inductions were performed for image analysis? The authors need a reliable method to assess DSB formation independent of Rad52 focus formation before drawing conclusions about a role for Rev7 in promoting early resection.
Furthermore, In Figure 1D, the authors use a qPCR assay to detect formation of ssDNA 168 and 14,253 bp from the HO cut site. From this assay, very few (2%) cells exhibit resection to the end of the lacO array 360 min after HO induction. This would appear to contradict the microscopy assay, which shows resection through the array takes ~150 minutes. Also, data should really be from biological replicas, not technical replicates of qPCR.
Consequently, whether or not Rev7 has a role in proximal resection is not clear from the authors' data.
There was agreement that manuscript needs to be revised:
1) It is essential that the confusing data on short range resection are clarified or removed from the manuscript. If the proximal resection data are retained, then the comments raised above need to be addressed. In addition, in the review of the prior version of this manuscript, reviewer #3 commented on this part in the original submission: "Also, to make claims on early resection, the analysis should include mutants deficient in short-range resection (e.g. mre11) and mutants in long-range resection, where both pathways have been inactivated (e.g. exo1 rqh1)." The authors did not address this previous request for clarification of this unexpected finding in this revised manuscript, using the analyses described for proximal resection (i.e., Figure 4).
It is unclear whether the authors can make these revision within the timeframe given. If not, then these data on proximal resection would need to be removed, and the conclusions of the manuscript refocused. One major finding is the effect of Crb2 on long-range resection: while this is new in S. pombe, it is well-described in S. cerevisiae (Rad9). The second major finding is the effect of Rev7 on long-range resection: this was only shown in humans, but not in the microbial eukaryotes. Although significant, the impact of the current manuscript is diminished without the proximal resection data; consequently, the author would need to make the contributions of their sound work much clearer in an expanded Discussion section of their work in relation to the existing literature (in any event, the existing Discussion section is inadequate.).
2) The authors use appearance of a Rad52-mCherry focus to identify onset of resection and disappearance of a lacO/LacI-GFP focus to identify resection past a site some 14 kb away from the DSB site. The problem is that both signals are rather fuzzy in many of the image series shown. This is especially true for the Rad52-mCherry focus (see e.g. the lower image series in Figure 1B, the first three image series in Figure 1—figure supplement 2, Figure 2A). The decision if a signal is judged as a focus or not is crucial, as it is the basis to calculate resection speed. This decision is made manually. Although the authors try to "equalize" the error by randomizing the image series prior to analysis, it seems to be a quite ambiguous approach of questionable reliability. What is their criterion to judge if a focus is present or not? Do they compare with background control strains? Why don't the authors use software to quantify the fluorescence signals and generate intensity trajectories? There are several non-commercial image analysis software packages available dedicated to exactly this purpose. Based on thresholds defined by appropriate control strains, appearance and disappearance of the signals could then be identified in a more controlled and rational way. A minimal requirement is that the author provides an x-y graph of foci fluorescent intensity vs time for each their examples of time-lapse video data in the manuscript.
If the authors submit another revised version, then the decision to accept or reject will be final, and no subsequent revisions will be considered.
https://doi.org/10.7554/eLife.33402.021Author response
[Editors’ note: the author responses to the first round of peer review follow.]
Essential revisions:
Reviewer #1:
This is an interesting paper with potentially important conclusions. The results depend entirely on the assay, which seems to be reliable, but some questions remain:
We are pleased that the reviewer found our study interesting and have endeavored to support our conclusions with additional experimental data as well as some clarifications.
1) There are no graphs showing the quality of the kinetic data. The authors need to show graphs of intensity vs time, for each assay, with fitting statistics.
We agree that if the resection rates were derived by measuring the kinetic loss of GFPLacI intensity this would be a critical point. Indeed, this is an aspect of this approach that can be exploited. However, for the data reported in this manuscript, we found that the most robust approach to determining the median long-range resection rate is an endpoint measurement (see Materials and methods section for details; we now indicate the explicit time points in each time lapse example with blue boxes, alongside the resection duration and determined rate). Thus, we derive a rate from the resection of the entire LacO array rather than from the rate of GFP-LacI loss. This being said, as we show in Author response image 1, the difference in slopes for the rate of loss of GFP-LacI for individual cells in consistent with variability in the population that we describe quantitating based on the end point approach.

2) It's a bit surprising that the array of 256 copies of lac repressor protein doesn't affect the measured rate. The authors need to show overlaid graphs of intensity vs time for the arrays; the PCR data for the arrays with lac repressor; and PCR data for the DNA arrays without lac repressors.
To further verify the (perhaps surprising) result that the LacO array does not strongly influence the measured resection rates, we carried out qPCR analysis of resection within a population of WT cells on both sides of the induced DSB. Although we cannot use qPCR to assess resection within the LacO array because of its repetitive nature, we did assess the extent of resection on the far side of the LacO array (~14 kb from the DSB site) and compared this to resection ~14 kb on the other (non-LacO containing) side of the DSB. We find that the rates on both sides of the induced DSB appear to be highly similar (Figure 1D). Thus, although it may be surprising, we have not found any indication that the LacO array alters the process of resection. Further, our extensive analysis by qPCR in the revised manuscript is entirely consistent with the interpretations made from the LacO-based system we have developed.
3) In the experiments with tagged RAD52, I don't understand why the foci persist. I would have expected RAD51 to replace the RAD52. Although the intensity does decrease (maybe just from photobleaching), it seems to be slower than the observations from the Rothstein lab on Rad52 in S. cerevisiae.
To further verify the (perhaps surprising) result that the LacO array does not strongly influence the measured resection rates, we carried out qPCR analysis of resection within a population of WT cells on both sides of the induced DSB. Although we cannot use qPCR to assess resection within the LacO array because of its repetitive nature, we did assess the extent of resection on the far side of the LacO array (~14 kb from the DSB site) and compared this to resection ~14 kb on the other (non-LacO containing) side of the DSB. We find that the rates on both sides of the induced DSB appear to be highly similar (Figure 1D). Thus, although it may be surprising, we have not found any indication that the LacO array alters the process of resection. Further, our extensive analysis by qPCR in the revised manuscript is entirely consistent with the interpretations made from the LacO-based system we have developed.
As stated above, the results are interesting and informative. However, the results rely entirely on the validity of the assay. In the current version, the authors don't present enough analysis and comparisons of the kinetic data to convincingly establish the assay. Presumably, they have the data; they need to provide it.
Indeed, as suggested by the reviewer, we are pleased to be able to provide additional support for the interpretation for the vast majority of our assertions in the initial submission. In particular, we have carried out extensive qPCR analyses that support the fundamental soundness of the assay design and implementation (Figure 1D, Figure 1—figure supplement 3, Figure 2C, Figure 4C). However, as we argued in our initial submission, this single cell assay can reveal attributes of individual events that are poorly captured in the population-based qPCR data, particularly for cells lacking Rev7, in which slow initial steps of resection initiation and faster long-range resection are conflated in a population-based approach (see Figure 4C and the associates text). Indeed, we believe this is one of the reasons that this assay can be a powerful resource to complement existing population-based assays. We are confident that the inclusion of these additional data will provide the necessary validation to highlight the utility of this experimental approach and the resulting insights into DSB end resection.
Reviewer #2:
DNA end resection is essential for homologous recombination, but excessive end resection can be detrimental to genome integrity. Long-range resection is catalyzed by either Exo1 or by a RecQ family helicase in collaboration with Dna2. The relative contribution of these two mechanisms and how they are regulated is not well understood. Here, the authors use a cytological approach to study end resection in single cells. An HO cut site was inserted 3.4-kb from a 10.3-kb lacO array located on Ch 2 of S. pombe. DSB formation/early resection was detected by the appearance of Rad52-mCherry foci that co-localize with the lacO array marked with LacI-GFP. Resection of the entire lacO array results in loss of the GFP signal while the mCherry signal remains. Consistent with a previous study using population based qPCR to measure resection (Langerak et al., 2011), the authors report that most resection is due to Exo1 activity and not Rqh1. Two years ago, several groups reported that Rev7 acts with 53BP1 to inhibit resection in mammalian cells. Here, the authors show that Rev7 and Crb2/53BP1 have a conserved role in preventing long-range resection in S. pombe. Furthermore, they show that Rev7 and Crb2 specifically block resection by Rqh1.
Overall, the authors demonstrate that live cell imaging can be used to study end resection in single cells, and their studies show considerable cell-to-cell variation in the initiation of resection, a feature missed by population-based DNA analysis. However, I'm not convinced that the microscopy-based single-cell assay is the best way to monitor resection. The generated data imply that resection speed can be measured accurately but that relies on some assumptions.
First, we appreciate the reviewer’s determination that this single-cell LacO resection assay can be used to measure resection, including determination of cell-to-cell variability. We would like to emphasize that we expect that this assay is complementary to existing approaches (and is in no way intended to replace such methods). Moreover, we show that this assay has unique strengths (for example, information that would be missed by population studies) and future applications (e.g. the ability to look at compartmentalization and dynamics of DSBs simultaneously with measuring resection rate). Admittedly, as with any technique, there are aspects that may be better addressed with orthogonal methods. We appreciate the concerns that the reviewer has about the various parameters necessary for the assay to work robustly, and we have worked to challenge the “assumptions” with additional data, specifically with extensive qPCRbased analysis (Figures 1D, Figure 1—figure supplement 1B,C, Figure 2C, Figure 4C).
In subsection “Image analysis” the authors write "The time between the first frame with an on-target Rad52-mCherry focus and the first frame with complete disappearance of the LacO/LacI-GFP focus is the duration of resection through 3.57 kb (between the HO cut site and the start of the LacO repeats) plus the full 10.3 kb LacO array". Is resection through the complete LacO array necessary for disappearance of the GFP focus? I could imagine that the GFP focus disappears before the complete LacO array is degraded. What is the minimum number of detectable LacO repeats? The authors could integrate LacO arrays of different lengths and check what the detection limit is. Or they should at least confirm the timing of the GFP focus disappearance with the qPCR assay (According to Figure 1 Supp. 1 they could use HincII for this).
Indeed, we had carried out such analysis to determine our sensitivity to both Rad52 loading (t=0, determined experimentally, now indicated in each Figure) and “full” resection of the LacO array. This was carried out as suggested by the Reviewer through analysis of LacO arrays of decreasing lengths (Figure 1—figure supplement 3E). Based on these analyses, we expect our determination of the time at which resection initiates to be slightly AFTER the true time of resection initiation (by ~300 bps) and we expect our determination of the time at which resection through the LacO array is complete to be slightly BEFORE the true time of complete LacO resection (by <500 bps). This is based on the following observations: (1) New qPCR analysis of cells lacking Exo1 that demonstrates that the extent of resection required to visualize Rad52-mCherry at the induced DSB is ~300-500 bp (Figure 1—figure supplement 3C and Figure 1E). (2) Our ability to robustly detect a 1kb LacO array signal above background under our imaging conditions (Figure 1—figure supplement 3C) – from this further analysis, we conservatively estimate that the LacO/GFP-lacI array can be visualized until <500 bps of the array is retained. In the context of 13.9 kb of total resection distance (from HOcs to the end of the LacO array), we argue that <800 bps will only slightly influence the determined rate (<5% difference). However, as reviewer 2 correctly notes, the fact that we are detecting the initiation of resection slightly later than the true initiation time, and we are detecting the completion of resection slightly earlier than the true completion time, means that we are slightly underestimating the total duration of resection and thus slightly overestimating the rate of resection. This actually could partially explain the reason our measured rate for WT cells (median = 7.6 kb/hr) is slightly higher than previous published qPCR-based approaches, although we would predict an over-estimate maximally of 0.4 kb/hr. Indeed, the extent to which this could influence our interpretation of the data (0.4 kb/hr) is minor compared to the variability within the population, or any of the median rates that we find to be statistically significant between genotypes. Given this, rather than making assumptions, we felt that it was more transparent to use the complete distance from HOcs to the end of the LacO array in our calculations, as this is the only distance that it is possible to know with complete certainty. Lastly, as suggested by the reviewer, we have also now acquired significant qPCR-based data that supports the conclusions from this live cell assay (see below).
Also, to my eye the Rad52 focus appearance and LacI-GFP focus disappearance are not easily identified (based on the microscopy images shown). The authors should mark the frames they define as "Rad52 focus appearance" and "LacI-GFP focus disappearance".
As requested, we now indicate both Rad52-mCherry loading and GFP-lacI focus disappearance for all kymographs, as well as the resection duration and rate. Further, we now present many more examples of the population of cells, each indicating the frame that we score for “Rad52 focus appearance” in Figure 1—figure supplement 2.
In the Materials and methods section, they don't say how they define these events. Do they do it manually or using some image analysis software? What is the threshold? More details are necessary here to judge the accuracy of the method.
We now include additional details on our image analysis pipeline, which uses a combination of manual and automated routines. We would emphasize that, although aspects are carried out manually, the hundreds of individual 5D image fields from all genotypes were all pooled together, randomly sorted, and then presented to the person scoring DSB events with all identifying file name information removed. This method of blinding across ~900 image fields distributes any human error evenly across the 11 genotypes analyzed.
Also, the restriction of the assay to 5 hours by photobleaching seems to be a considerable drawback, which limits the number of "usable" cell trajectories (as shown in Figure 2—figure supplement 2B). Perhaps by changing the imaging period and number of z-stacks they could extend the time window for monitoring resection. Other approaches, such as using more photostable fluorescent proteins (e.g. LacI-mKate2, Rad52-monomeric NeonGreen), LEDs as light sources, or switching to an enzyme that cuts more efficiently than HO (I-PpoI has been successfully used in S. pombe and the efficiency of cutting is better than HO) would involve considerable more effort and time.
We invested substantial effort and time into exploring numerous induction systems, site-specific cut sites/endonuclease pairs and imaging conditions that could produce results superior to those described in this manuscript, as suggested by the reviewer. Based on this exhaustive exploration, the system described here presented the most robust and reproducible performance. Although it is likely that further improvements can still be made to this system, we would argue that our ability to characterize a wide array of genetic backgrounds to reveal new insights into regulation of DSB end resection in fission yeast highlights that the assay is of sufficient throughput. Unfortunately, it is not possible to reduce the number of z-slices without losing the ability to accurately detect sub-diffraction foci in Z or avoid loss of foci above/below the z-stack.
The authors stress that they use a single cell assay. But it is not clear what the advantage of single cell data is in their work. In the end they are comparing population medians, which could also be generated with bulk experiments.
To the contrary, we would strongly argue that the data presented here illustrate precisely why such a single cell assay provides a valuable complement to population assays. Perhaps it was not clear that the long-range resection rates are only determined from individual cells that have successfully initiated resection. For the rev7Δ cells, this is absolutely critical. As we show, fewer cells successfully initiate resection the absence of Rev7 (Figure 4A-C). However, once initiation occurs, long-range resection occurs much more rapidly than in WT cells (Figure 2). We would predict that these two opposite effects would be very challenging to convincingly (and certainly quantitatively) assess using a population-based resection assay (and could instead be interpreted as only one of the two behaviors, depending on which dominates in the specific assay). Indeed, our qPCR analysis, presented in Figure 4C, makes this point, with distinct effects 300 bp and 3 kb from the HO cut site. However, given only this information: a quite subtle early resection delay in the population (300 bp from the HO cut site) and a gain of resection 3 kb from the HO cut site in the population, it would be challenging to fully interpret this data based on qPCR alone. Thus, we think this example (unlikely to be the only case) illustrates how it will be revealing to compare results using these two approaches in future studies.
Further insights can be concluded for other genetic backgrounds, for example we can discern that loss of Crb2 does not affect resection initiation in otherwise WT backgrounds, while it increases long-range resection rates (Figure 1C and Figure 4A,B). More generally, as no DSB induction system is entirely efficient, even in budding yeast, this approach allows us to decouple early events in DSB processing from long-range resection without weighing heavily on estimates of DSB induction. Lastly, we would argue that going forward it is clear that having a cell biological assay will open up the door for analysis not possible with qPCR approaches such as DSB mobility and subnuclear compartmentalization.
The low DSB formation efficiency might be a motivation to use a single cell assay to restrict the analysis to the few cells with a DSB. However, bulk experiments generally take the cutting efficiency into account, e.g. the qPCR-based assay described by Zierhut and Diffley, (2008) considers the HO cut fraction.
While this is true, because this is population approach it does not allow individual cells to be monitored for the rate of long-range resection independently from delays in resection initiation. In the assay described here, even if there is a strong reduction in resection initiation (say 25% of WT), we can still monitor the rate of long-range resection in that 25% of cells; again, this cannot be assessed by qPCR. Indeed, cells lacking Rev7 are a good example of how these two phases can be analyzed distinctly.
Rad52 foci are used as a read out for DSB formation and initiation of resection. Can these two steps be separated, for example, by measuring DSB formation by qPCR using primers flanking the HO cut site on the same samples used for the ApoI protection assay, or possibly using Mre11-mCherry instead of Rad52? It appears from Figure 1B (upper panel) that resection through most of the lacO array is required for a strong Rad52 signal.
In the revised manuscript, we include our further characterization for the extent of resection required to load sufficient Rad52-mCherry to be robustly visualized in the assay. This was achieved, as suggested by the Reviewer, through comparison of live cell imaging and ApoI protection/qPCR, which can be found in Figure 1—figure supplement 3. Based on this, we now estimate that ~300 bps of resection are required.
In theory, the HO-induced DSB is unrepairable, but because the HO cutting efficiency is quite low, and S. pombe cells are in G2 most of the time, if one sister chromatid was cut and engaged in repair with the uncut sister it could result in an underestimation of resection. Were cells with a transient Rad52 focus detected? The exo1 example in Figure 1 appears to have a Rad52 focus that appears early and then goes away. Does elimination of Rad51 change the number of cells resecting or rate of resection? At late times, when the mCherry signal is very bright, are both sister chromatids cut and resected?
We agree that this is an important point and feel that there are several observations that can speak to this concern. We have not observed examples of WT cells (or even mutant cells) in which Rad52 associates with the LacO array and is then lost, followed by repair; in this case we would expect the cells to avoid checkpoint arrest, and proceed into mitosis. In the example the Reviewer points out, cells lacking Exo1 (Figure 1E), any cell that recruits Rad52 fails to resect, but remains checkpoint arrested, suggesting failed repair rather than repair of a single DSB using the sister as a template. This interpretation is further supported by the observation that loss of Crb2 in this background fully recovers Rad52 loading (Figure 4A,B). To further address the frequency at which both sisters are cut, we analyzed Rad52 foci upon cell division in crb2Δ cells, which proceed into mitosis due to the checkpoint defect associated with this allele. We found that in the vast majority of cases (21/27), both daughter cells inherited a fully resected site-specific DSB (see Author response image 2). In the remaining six cells, it is challenging to interpret because they proceeded into mitosis prior to full resection. From this, we also conclude that the inefficiency of DSB induction relates either to insufficient HO expression prior to Sphase or permissive nucleosome positioning, as all of our data are reported as the frequency of DSB induction per cell cycle observed.

Lineage tracing of crb2Ä cells (which are checkpoint-deficient) reveals that the vast majority of sisters arising by division (visualized as splitting of one circle to two) both inherit a fully resected LacO array (pink).
https://doi.org/10.7554/eLife.33402.018Langerak et al., used a qPCR assay to measure end resection and reported no defect in resection initiation (35 nt from HO cut site) in the exo1 mutant or exo1 rqh1 double mutant. Is the failure to detect Rad52 foci in most exo1 cells because resection tracts are <90 nt or because the amount of ssDNA required to support a Rad52 focus is much longer than 90 nt? Given that the Rad52 single is quite weak until the lacO array disappears, I think the authors might be under-estimating the amount of ssDNA to visualize a Rad52 focus. Does the exo1 mutant show normal DSB formation (measured with primers flanking the HOcs) and resection to the ApoI site located 168 nt from HOcs? Similarly, is DSB formation normal in the rev7 mutant and can early resection be detected by the qPCR assay?
As stated in the manuscript, we experimentally estimate that at least 30 copies of Rad52 must be loaded onto the resected DNA to be visualized. Unfortunately, the number of Rad52 copies that are expected to remain associated with the remodeled nucleoprotein filament has not been clearly established experimentally. We initially set lower bounds as 90 nts. To provide further insight, we carried out qPCR experiments on cells lacking Exo1 and Ctp1 using the approach described in Langerak et al., as suggested by the Reviewer, but with many more primer sets. All genetic backgrounds (including cells lacking Exo1 or Ctp1) have similar levels of resection 168 bps from the HO cut site (not shown). Most useful is the finding that we do see a substantial resection defect in cells lacking Exo1 using primers 300 bps from the HO cut site, almost to the extent seen in cells lacking Ctp1 (Figure 1—figure supplement 3C). Moreover, we see no resection 3 kb from the DSB at 90’ post-induction. Taken together we estimate that cells lacking Exo1 have a block between ~150 bps and ~300 bps of resection based on these population data. Importantly, we do visualize transient Rad52 loading in cells lacking Exo1 (Figure 1E), consistent with an upper bounds of ~300 nts of resected DNA being sufficient to load enough Rad52-mCherry copies to be visualized. However, we have given a broader range for the extent of resection necessary to observe robust Rad52-mCherry recruitment as between 150-300 bps in the revised manuscript. The effect of loss of Rev7 by qPCR is now included in Figure 4C. Again, consistent with our initial interpretation, there is a slight defect in resection 300 bps from the HO cut site, but a gain in resection 3 kb away. This orthogonal approach therefore supports our hypothesis that Rev7 promotes early steps in resection but has a gain in long-range resection rate (once this early phase is overcome).
Why does rqh1 suppress the early resection defect of rev7? An odd result that is not discussed in the text.
We do not yet have a molecular understanding of how loss of Rqh1 is able to suppress the early loss of Rad52-mCherry loading in cells lacking Rev7. We do acknowledge this in the revised text, but further insight will require additional experimentation, which is ongoing.
While the overall findings on the role of Rev7 and Crb2 repressing the Rqh1 resection pathway are certainly of interest to the field, the data analysis needs to be improved.
We appreciate that the reviewer found the findings revealed by this work to be of interest and have endeavored to address the remaining concerns regarding image analysis and validation using orthogonal assays in this revision.
Reviewer #3:
DNA end resection is a process that initiates recombination-based DNA double strand break repair. As resection also generally inhibits non-homologous end-joining, regulation of DNA end resection is an important process. The human 53BP1 protein, though its various effectors, has been found to be an inhibitor of DNA end resection, although mechanistic insights are lacking. These processes appear to be at least partially conserved in low eukaryotes.
The authors are using a S. pombe as a model system, where they developed an assay allowing the monitoring of resection in live cells (Figure 1). The assay is based on the disappearance of GFP-LacI and appearance of Rad52-mCherry signal next to HO-endonuclease induced DSB. This is an interesting method that will be useful for high throughput microscopy-based screenings. However, the method has certain limitations in contrast to established southern blotting, PFGE or RTPCR-based methods:
We appreciate the reviewer’s assessment of the value of a microscopy-based resection assay. While we agree that the assay has some weaknesses compared to previously developed population-based assays, we would argue that qPCR and Southern blot approaches also have limitations in contrast to the microscopy-based method developed here (see also response to reviewer 2). In the larger scope, we expect that both assays will provide complementary insights into the control of DSB end resection.
a) The assay measures Rad52 accumulation, which is a step after resection. Rad52 is a mediator that loads Rhp51 on RPA-coated resected DNA. Using RT-PCR based assay, the authors established that there is a correlation between both processes (resection and RAD52 loading). However, this was only done in wt background, and it is possible RAD52 loading might differ in the mutants analyzed, and Rad52 might be loaded with different kinetics dependent on the resection pathway. The authors calculate resection rates making the assumption that there is no difference.
In the revised manuscript, we include substantial additional support for our conclusion by analyzing additional genetic backgrounds (exo1Δ, rev7Δ, ctp1Δ) using the qPCR based method (Figure 1D, Figure 2C, Figure 1—figure supplement 3C, Figure 4C). Our findings support the notion that the extent of Rad52-mCherry loading is coincident with resection of at least 150-300 bps of DNA flanking the DSB (Figure 1—figure supplement 3C and also see response to reviewer 2).
b) The assay measures resection of DNA bound by GFP-LacI, a non-physiologic binder. Therefore, the resection proteins must displace LacI for resection to occur. Under physiologic conditions, DNA near DSBs will likely be chromatinized and subsequently remodeled allowing resection. This is especially a concern when analyzing the role of chromatin binders such as 53BP1/Crb2. Also, the individual resection pathways may be affect by LacI binder to a different degree, which complicates interpretation.
We agree that in principle the LacI binding could alter how resection proceeds through the array. In addition to the experimental evidence presented in the initial manuscript supporting the validity of resection through the array, we now also include qPCR analysis on the other (non-LacO containing) side of the HO nuclease cut site; this analysis supports the conclusion that the LacO array does not strongly influence resection (Figure 1D). This concern has also been explored by more broadly including analysis of resection using the orthogonal, qPCR based assay (Figure 1D, Figure 2C, Figure 1supplemental figure 3C, Figure 4C).
The most interesting finding is that Rev7 and 53BP1/Crb2 appear to repress long-range resection dependent on Rqh1 (Figure 2): In the absence of Rev7 and Crb2, long-range resection is accelerated, which is independent of Exo1 and depends on Rqh1.
1) This observation should be verified using a previously established assay, given the concerns listed above. Related to this point, it remains a formal possibility that the action of Rqh1 is not specific to resection, but to strip LacI, allowing resection through another process. Performing resection with the same mutants in an established setup (with no LacI) will address this concern as well.
In the revised manuscript, in addition to the validation by the qPCR assay that the LacO array does not alter resection (Figure 1D), we provide further evidence that cells lacking Rev7 show more rapid long-range resection using the qPCR approach (Figure 2C, Figure 4C). These data strongly support that resection, rather than some other activity (such as loss of LacI) is responsible for the progressive loss of GFP-LacI signal.
The authors then go on to demonstrate differential effects of Rev7 and Crb2 on early resection steps, based on timing of Rad52 foci appearance upon break induction (Figure 3). I am concerned about these results: using Rad52 (a protein with a function downstream of resection) does not appear to be correct as a marker of "early" resection.
2) The results should be analyzed in an established assay where the readout is clearly early resection. Also, to make claims on early resection, the analysis should include mutants deficient in short-range resection (e.g. mre11) and mutants in long-range resection, where both pathways have been inactivated (e.g. exo1 rqh1).
The revised manuscript includes substantial new data to address how to place Rad52 loading in the context of resection progression. We now leverage cells lacking Exo1 to obtain a more precise estimate of the extent of resection required to load Rad52. By comparing qPCR analysis (Figure 1—figure supplement 3C) and our image analysis (Figure 1E, Figure 4A,B), we now estimate that ~200-300 bp of resection is necessary to visualize Rad52-mCherry loading at the DSB. Moreover, we compare cells lacking Exo1 with those lacking CtIP/Ctp1 (a “true” resection initiation factor); these two genetic backgrounds have very similar resection defects 300 bp from the HO cut site. We would therefore argue that while Exo1 is not required for “resection initiation”, it is required for the early phase of long-range resection (defined here as the earliest phase in which Exo1 is required).
3) In Figure 2, the authors demonstrate that rev7 mutants have accelerated long-range resection, which is dramatically decreased when rqh1 is additionally mutated (rev7 rqh1), supporting the hypothesis that resection in rev7 mutants is Rqh1 dependent. In contrast however, the in Figure 3, the "early" resection is increased when rqh1 is mutated in rev7 background, a completely opposite effect. This is very confusing. The authors comment that "early" resection is a combination of Mre11 and Exo1/Rqh1 dependent processes. This dichotomy reinforces my concerns about the robustness of the experimental setup.
As stated in our response to reviewer 2, it is true that at present we do not fully know how to interpret this result, which will require further experimentation (likely using a number of additional approaches) to dissect. However, with regards to the general robustness of the assay, we believe that the revised manuscript provides substantial new support for the experimental setup and the validity of the interpretations made from the data.
In summary, the manuscript presents an interesting assay and interesting pieces of data, but it seems rather preliminary at this point.
We have endeavored to convince the reviewer that, with the addition of supportive data from orthogonal assays and further validation, the manuscript is now sufficiently developed to support publication.
[Editors' note: the author responses to the re-review follow.]
The biological findings of this manuscript are interesting, particularly the role of Rev7 in suppressing resection by the Rqh1 pathway, but there are significant concerns over the reliability of the assays used. The authors place equal importance on the fluorescence-based resection presented; however, the reliability of the assay is questionable and the weak point of this work. The conceptual idea of the assay is good, but there are reservations about its implementation and use to quantify resection speed. The authors have, for the most part, established the utility of their assay for the analysis of long-range resection, although they still need to provide a graphical example of their quantification.
We are gratified that the biological findings of the manuscript were found to be of interest and that there was enthusiasm for the utility of our assay. The remaining point, the need for graphical examples of the quantification, has been addressed in the revised manuscript – please see Figure 1D,E, Figure 1—figure supplement 2, Figure 2B, and Figure 2—figure supplement 1.
They discovered interesting roles of Rev7 and Crb2 in Rqh1-dependent resection. As both a methods contribution and a contribution to the recombination field, these findings could justify publication of a revised manuscript.
We appreciate that the insights into the mechanisms by which Rev7 and Crb2 influence long-range resection (in an Rqh1-dependent and Exo-independent manner) were found to be of interest, therefore warranting further consideration of our manuscript.
However, the manuscript then goes on to dissect the roles of these proteins in proximal recombination. Here the work is both incomplete and internally inconsistent. It would appear that the data in Figure 4A and Figure 4C are inconsistent with one another: 4A show a reduction in "Cell cycles with Rad52 foci" for rev7delta, whereas 4C shows no change, within error, for rev7delta at 300 bps [The figure legend, as well as the associated text in the main body of the manuscript, is not justified: "The extent of resection 300 bps and 3 kb from the HO cut site as assessed by the restriction enzyme/qPCR method supports less efficient resection initiation in rev7Δ cells compared to WT at 300 bp…"].
We acknowledge the concerns of the reviewers with respect to the measurement and interpretation of data corresponding to proximal resection. As we have not obtained additional data to clarify these points, we have removed this section of the manuscript (previously Figure 4 and supplements). This revision is therefore focused solely on the long-range resection assay and the novel finding that Rev7 acts as an inhibitor of RecQ helicase-mediated resection.
Also, the conclusion that of Rev7 promotes early resection is based entirely on how quickly a Rad52 focus forms after break induction, and how many cells have visible Rad52 foci. It was suggested that the authors use a more direct measurement of break induction by qPCR using primers flanking the HO cut site. This has not been done and is a significant concern.
Although we have removed the data and text related to proximal resection, the revised manuscript includes qPCR analysis of the efficiency at which the site-specific DSB is induced in the population. The addition of this data supports the assertion that resection of the site-specific DSB takes place in the vast majority of fission yeast in S/G2 with a DSB, as the fraction of cells that (1) show loss of the qPCR product across the HO cut site (Figure 1—figure supplement 3a, at 180’ after addition of uracil), (2) undergo resection 168 bps from the HO cut site (Figure 1—figure supplement 3C, at 180’ after the addition of uracil), and (3) ultimately load Rad52-mCherry (Figure 1—figure supplement 3C, at 180’ after addition of uracil) are similar (~15-20%).
If one compares the qPCR data for resection 168-bp from the HO cut site shown in Figure 1D and Figure 1—figure supplement 3B there are vast differences – 3% resection at 120 min in one figure compared with 15% resection at 120 min in the other. If there is this much variability between populations of cells then it could explain why the rev7 mutant looks different to wild type, and why rqh1 appears to suppress the early resection defect of rev7. How many independent inductions were performed for image analysis?
In this revision, we include population data (qPCR) to test the reproducibility of DSB induction; these data (Figure 1—figure supplement 3A and Figure 2E) demonstrate that HO nuclease has ~20% efficiency from multiple biological replicates. As detailed in Supplementary file 2 for all genotypes, the data for the image analysis is from 6 independent inductions (WT) and 5 independent inductions (rev7Δ). More generally, there is substantial evidence that the differences between resection rates that we measure in different genotypes are highly reproducible.
The authors need a reliable method to assess DSB formation independent of Rad52 focus formation before drawing conclusions about a role for Rev7 in promoting early resection.
Again, although we have removed the data/interpretation related to a role for Rev7 in proximal resection, we do now include qPCR analysis across the HO cut site that supports the conclusion that Rev7 does not influence the efficiency of DSB induction (Figure 2E).
Furthermore, In Figure 1D, the authors use a qPCR assay to detect formation of ssDNA 168 and 14,253 bp from the HO cut site. From this assay, very few (2%) cells exhibit resection to the end of the lacO array 360 min after HO induction. This would appear to contradict the microscopy assay, which shows resection through the array takes ~150 minutes.
We understand that this appears contradictory at first glance, but importantly the time courses for the qPCR (population experiment) and the measurement of the time to resect the array (in single cells) cannot be directly compared. The “time 0” for the qPCR experiments is the addition of uracil to the media. Thus, there is a substantial lag (between 60 and 240 min, which can be seen in the red curve in Figure 1supp3C) for cells to express the HO nuclease, reach S phase (the only time in the cell cycle when we observe that HO can act on its target site, Figure 1B), and initiate resection. For the single cell assay we isolate measuring the rate of long-range resection by setting the “time 0” to the point at which Rad52-mCherry has visibly loaded. Thus, on the surface this apparent “contradiction” instead reflects that the qPCR data is influenced by many rates of sequential steps (HO expression, cell cycle/access of HO, resection initiation). Indeed, this comparison highlights yet another the advantage of the assay described in the manuscript, which specifically interrogates long-range resection without these other confounding steps contributing to the measured rate. We have also edited the text to clarify this point.
Also, data should really be from biological replicas, not technical replicates of qPCR.
We agree, and these data include multiple biological replicates (as is now clear from the figure legend for the measurements of HO cut site induction in Figure 2E).
Consequently, whether or not Rev7 has a role in proximal resection is not clear from the authors' data.
Again, we have removed this aspect of the manuscript.
There was agreement that manuscript needs to be revised:
1) It is essential that the confusing data on short range resection are clarified or removed from the manuscript. If the proximal resection data are retained, then the comments raised above need to be addressed. In addition, in the review of the prior version of this manuscript, reviewer #3 commented on this part in the original submission: "Also, to make claims on early resection, the analysis should include mutants deficient in short-range resection (e.g. mre11) and mutants in long-range resection, where both pathways have been inactivated (e.g. exo1 rqh1)." The authors did not address this previous request for clarification of this unexpected finding in this revised manuscript, using the analyses described for proximal resection (i.e., Figure 4).
It is unclear whether the authors can make these revisions within the timeframe given. If not, then these data on proximal resection would need to be removed, and the conclusions of the manuscript refocused. One major finding is the effect of Crb2 on long-range resection: while this is new in S. pombe, it is well-described in S. cerevisiae (Rad9). The second major finding is the effect of Rev7 on long-range resection: this was only shown in humans, but not in the microbial eukaryotes. Although significant, the impact of the current manuscript is diminished without the proximal resection data; consequently, the author would need to make the contributions of their sound work much clearer in an expanded Discussion section of their work in relation to the existing literature (in any event, the existing Discussion section is inadequate.).
We agree with points of the reviewers with respect to the proximal resection data and have removed this from the manuscript. Further, we acknowledge (and now discuss in greater detail in the discussion) that an influence of Rad9 on long-range resection in budding yeast has been described previously. Further, data argue that this effect could involve Sgs1, the Rqh1 orthologue. However, we would argue that the following conclusions coming from this study are unique and impactful:
1) An entirely novel (and indeed the key) aspect of our study is that Rev7 acts to inhibit long-range resection through the RecQ helicase (Rqh1) pathway. Although it is true that Rev7 was suggested to inhibit resection in mammalian cells, these measurements were largely indirect, and the phase of resection influenced by Rev7 was not addressed.
2) We show that the influence of Crb2 on long-range resection is also through repression of Rqh1. This is consistent with budding yeast studies but is clearly shown to occur through a specific effect on long-range resection in our study.
We have articulated these points more clearly in the revised Discussion section.
2) The authors use appearance of a Rad52-mCherry focus to identify onset of resection and disappearance of a lacO/LacI-GFP focus to identify resection past a site some 14 kb away from the DSB site. The problem is that both signals are rather fuzzy in many of the image series shown. This is especially true for the Rad52-mCherry focus (see e.g. the lower image series in Figure 1B, the first three image series in Figure 1—figure supplement 2, Figure 2A). The decision if a signal is judged as a focus or not is crucial, as it is the basis to calculate resection speed. This decision is made manually. Although the authors try to "equalize" the error by randomizing the image series prior to analysis, it seems to be a quite ambiguous approach of questionable reliability. What is their criterion to judge if a focus is present or not? Do they compare with background control strains? Why don't the authors use software to quantify the fluorescence signals and generate intensity trajectories? There are several non-commercial image analysis software packages available dedicated to exactly this purpose. Based on thresholds defined by appropriate control strains, appearance and disappearance of the signals could then be identified in a more controlled and rational way. A minimal requirement is that the author provides an x-y graph of foci fluorescent intensity vs time for each their examples of time-lapse video data in the manuscript.
We evaluated the utility of several image analysis software (including the TrackMate ImageJ plugin, CellProfiler, u-track 2.0, and even custom Matlab code). Indeed, we are experts at developing quantitative image analysis routines (please see our previous, peer-reviewed works – Schreiner et al., 2015 and Zhao et al. 2016), but all were inadequate due to the uniquely stringent criteria that we placed on identifying a Rad52-mCherry focus (described in the Methods), which goes well beyond simply an intensity measurement. Nonetheless, to satisfy the reviewer’s request, we include data to address the issue of “background control strains” now in Figure 1—figure supplement 3D-G. As you can see, there is little to no chance that background fluorescence or “noise” could reproducibly contribute to a focus assignment. Moreover, as stated in the manuscript, the frequency of identifying a Rad52-mCherry focus that meets our criteria (co-localized with the array for two time points) and found that this can essentially never be observed if HO nuclease is not expressed (“Importantly, we do not observe loading of Rad52-mCherry at the LacO/LacI-GFP array in the absence of HO endonuclease expression (on-target Rad52 foci in < 0.2% of uninduced cells, n=657)”). We do recognize that it is imperative to that we can robustly identify these events, and ideally to provide a quantitative framework for how we do so. To that end, as requested, we include fluorescent intensity versus time plots in the revised manuscript. Depicting the data in this manner makes it qualitatively quite clear, for example, that cells lacking Rev7 resect the array much more quickly than WT strains.
https://doi.org/10.7554/eLife.33402.022Article and author information
Author details
Funding
National Science Foundation (DGE-1122492)
- Bryan A Leland
The Gruber Foundation (Gruber Science Fellowship)
- Bryan A Leland
National Institutes of Health (T32-GM007223)
- Bryan A Leland
National Institutes of Health (DP2OD008429-01)
- Megan C King
Searle Scholars Program (Scholar Award)
- Megan C King
Yale Cancer Center (Pilot Grant)
- Megan C King
The funders had no role in study design, data collection and interpretation, or the decision to submit the work for publication.
Acknowledgements
We would thank the Drs. Susan Gasser, Tony Carr, Paul Russell, Li-Lin Du, Masayuki Yamamoto, and Julia Cooper for strains and plasmids; Jessica Johnston for generating and imaging the 1 kb LacO array strain; and Topher Carroll and Tom Pollard for helpful input and feedback. This work was supported by a National Science Foundation Graduate Research Fellowship (DGE-1122492), NIH training grant T32-GM007223, and a Gruber Science Fellowship to BAL; and the Searle Scholars Program, a Pilot Grant from the Yale Cancer Center, and the National Institutes of Health Office of the Director (DP2OD008429-01) to MCK.
Reviewing Editor
- Stephen C Kowalczykowski, University of California, Davis, United States
Version history
- Received: November 8, 2017
- Accepted: April 11, 2018
- Accepted Manuscript published: April 26, 2018 (version 1)
- Version of Record published: May 10, 2018 (version 2)
Copyright
© 2018, Leland et al.
This article is distributed under the terms of the Creative Commons Attribution License, which permits unrestricted use and redistribution provided that the original author and source are credited.
Metrics
-
- 1,759
- Page views
-
- 337
- Downloads
-
- 14
- Citations
Article citation count generated by polling the highest count across the following sources: Crossref, PubMed Central, Scopus.
Download links
Downloads (link to download the article as PDF)
Open citations (links to open the citations from this article in various online reference manager services)
Cite this article (links to download the citations from this article in formats compatible with various reference manager tools)
Further reading
-
- Cell Biology
- Developmental Biology
Cylicins are testis-specific proteins, which are exclusively expressed during spermiogenesis. In mice and humans, two Cylicins, the gonosomal X-linked Cylicin 1 (Cylc1/CYLC1) and the autosomal Cylicin 2 (Cylc2/CYLC2) genes, have been identified. Cylicins are cytoskeletal proteins with an overall positive charge due to lysine-rich repeats. While Cylicins have been localized in the acrosomal region of round spermatids, they resemble a major component of the calyx within the perinuclear theca at the posterior part of mature sperm nuclei. However, the role of Cylicins during spermiogenesis has not yet been investigated. Here, we applied CRISPR/Cas9-mediated gene editing in zygotes to establish Cylc1- and Cylc2-deficient mouse lines as a model to study the function of these proteins. Cylc1 deficiency resulted in male subfertility, whereas Cylc2-/-, Cylc1-/yCylc2+/-, and Cylc1-/yCylc2-/- males were infertile. Phenotypical characterization revealed that loss of Cylicins prevents proper calyx assembly during spermiogenesis. This results in decreased epididymal sperm counts, impaired shedding of excess cytoplasm, and severe structural malformations, ultimately resulting in impaired sperm motility. Furthermore, exome sequencing identified an infertile man with a hemizygous variant in CYLC1 and a heterozygous variant in CYLC2, displaying morphological abnormalities of the sperm including the absence of the acrosome. Thus, our study highlights the relevance and importance of Cylicins for spermiogenic remodeling and male fertility in human and mouse, and provides the basis for further studies on unraveling the complex molecular interactions between perinuclear theca proteins required during spermiogenesis.
-
- Cell Biology
- Structural Biology and Molecular Biophysics
Previously we showed that 2D template matching (2DTM) can be used to localize macromolecular complexes in images recorded by cryogenic electron microscopy (cryo-EM) with high precision, even in the presence of noise and cellular background (Lucas et al., 2021; Lucas et al., 2022). Here, we show that once localized, these particles may be averaged together to generate high-resolution 3D reconstructions. However, regions included in the template may suffer from template bias, leading to inflated resolution estimates and making the interpretation of high-resolution features unreliable. We evaluate conditions that minimize template bias while retaining the benefits of high-precision localization, and we show that molecular features not present in the template can be reconstructed at high resolution from targets found by 2DTM, extending prior work at low-resolution. Moreover, we present a quantitative metric for template bias to aid the interpretation of 3D reconstructions calculated with particles localized using high-resolution templates and fine angular sampling.