Decoding the centromeric nucleosome through CENP-N
- Keda Zhou

- Charlotte Smith
- Stefano Maffini
- Arsen Petrovic
- Garry P Morgan
- Andrea Musacchio
- Karolin Luger
- Max-Planck Institute of Molecular Physiology, Germany
- University of Colorado at Boulder, United States
- University Duisburg-Essen, Germany
- Howard Hughes Medical Institute, United States
Figures
Figure 1 with 1 supplement
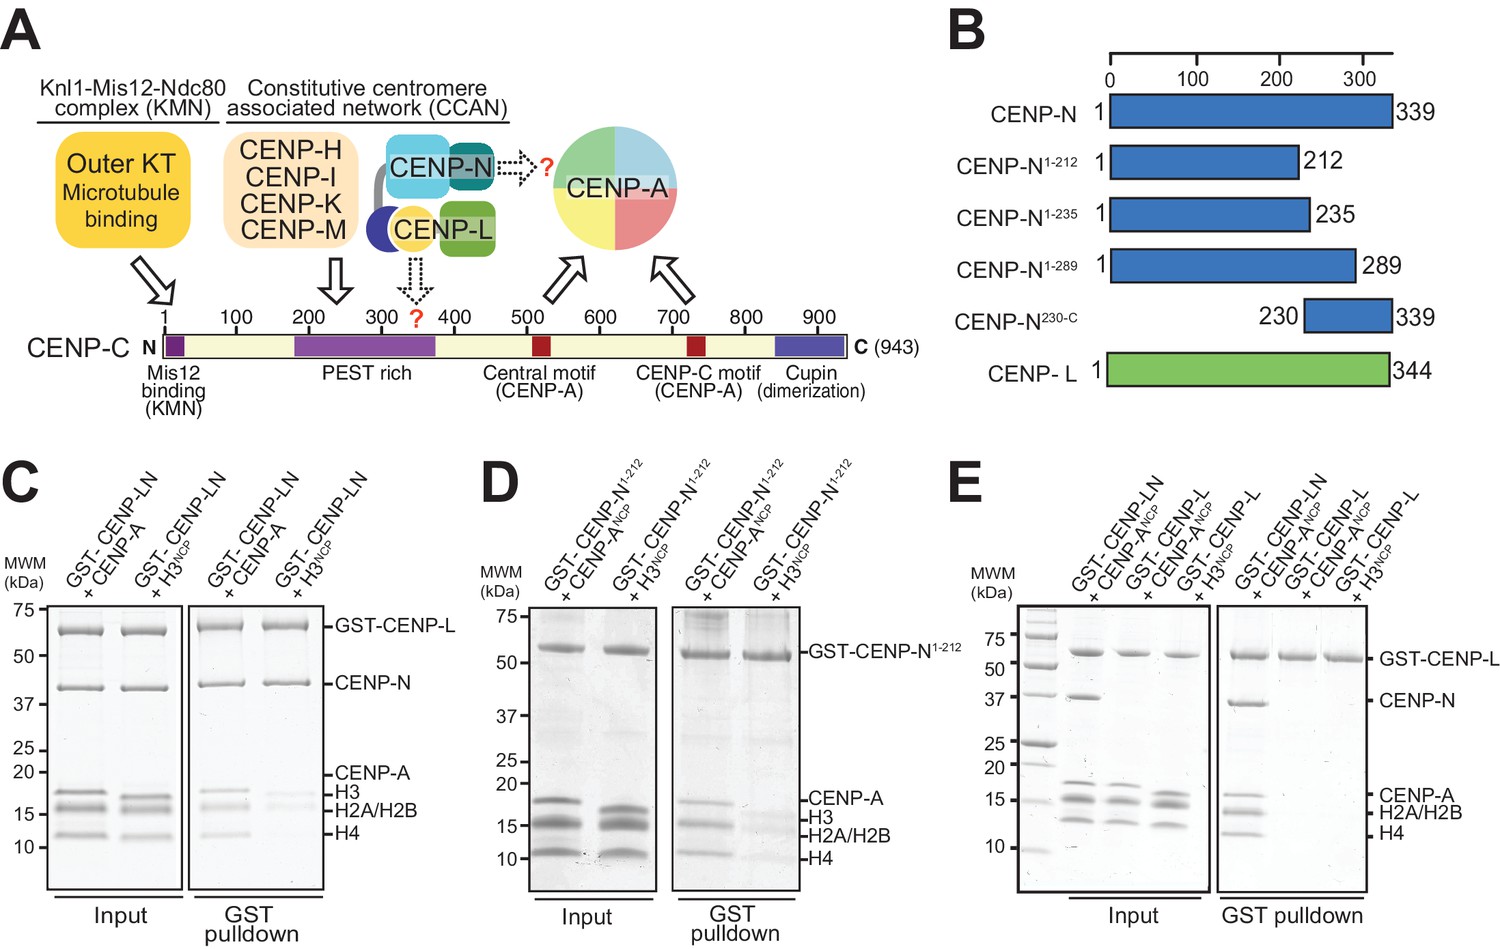
The interaction of CENP-N with nucleosomes.
(A) Schematic of crucial CCAN and KMN subunits discussed in the text. The Knl1-Mis12-Ndc80 (KMN) complex is the main microtubule receptor at the kinetochore. Other interactions are discussed in the main text. The question mark indicates that the precise determinants for the recruitment of CENP-LN to CENP-C and for the interaction of CENP-N with the CENP-A nucleosome have not been identified. (B) Schematic depicting constructs described in the manuscript. (C–E) Solid phase binding assays where the indicated GST fusion proteins were immobilized on glutathione-sepharose beads (at a final concentration of 1 µM) and incubated with 3 µM of the indicated nucleosome core particles. After incubation (see Materials and methods), beads were centrifuged, washed, and bound proteins visualized by SDS-PAGE and Coomassie staining.
Figure 1—figure supplement 1

Further interactions of CENP-NL.
Solid phase binding assay demonstrating that CENP-LN230-C does not interact with the CENP-A nucleosome. The indicated GST fusion proteins were immobilized on glutathione-sepharose beads (at a final concentration of 1 µM) and incubated with 3 µM of the indicated nucleosome core particles. After incubation (see Materials and methods), beads were pelleted, washed, and bound proteins visualized by SDS-PAGE and Coomassie staining.
Figure 2 with 3 supplements
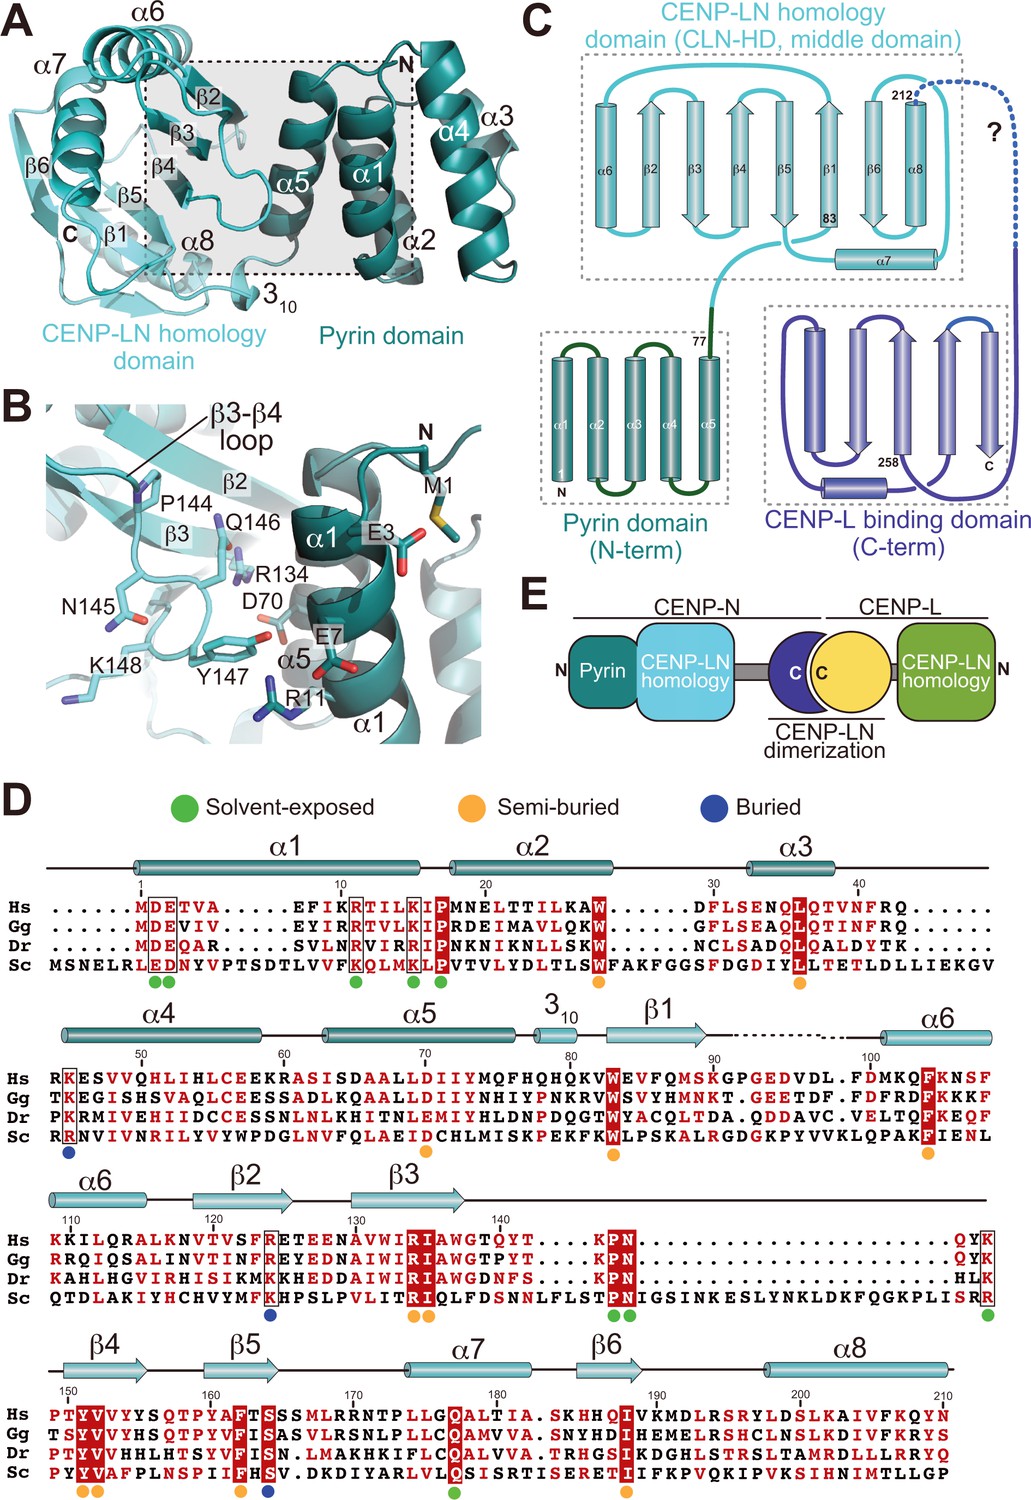
Crystal structure of the CENP-A-binding region of CENP-N.
(A) Cartoon model of CENP-N1-235 with secondary structure and domain organization. (B) Close-up of the boxed region in A. (C) Topology diagram of CENP-N. The topology of the Pyrin and CLN-HD domains was directly derived from the crystal structure of CENP-N1-235 reported here. The topology of the CENP-L-binding domain was derived from the crystal structure of the Chl4 fragment in the complex of the Chl4CENP-N:Iml3CENP-L yeast homolog (Hinshaw and Harrison, 2013). (D) Multiple sequence alignment of CENP-N from the indicated species with secondary structure. Green, blue, and orange dots indicate solvent-exposed, semi-buried, and buried side chains, respectively. Positions with conserved residues are displayed red; positions with conserved side chain charge are boxed. (E) Schematic summarizing domain organization of CENP-L, CENP-N, and their dimerization.
Figure 2—figure supplement 1

Structural relatedness of CENP-N N-terminal domain with PYRINs.
(A) Cartoon model of the ‘death fold’ Pyrin domain of AIM2 (Lu et al., 2014). (B) Structural superposition of the AIM2 Pyrin domain (red) with the CENP-N Pyrin domain.
Figure 2—figure supplement 2

Topology of Iml3 and CENP-L.
(A) Overall domain organization of Iml3CENP-L with cartoon model illustrating the CLN-HD in green and the CENP-L insert in yellow. The latter includes the Chl4CENP-N-binding domain, which is conserved in humans, as shown in panel E (Hinshaw and Harrison, 2013). (B) Topology diagram of CENP-L, based on the structure of the Iml3CENP-L yeast homolog (Hinshaw and Harrison, 2013) and its comparison with the crystal structure of CENP-N after identification of structural homology by program DALI.
Figure 2—figure supplement 3

Overall organization of the CENP-LN complex.
(A) Structure-based sequence alignment generated with program Chimera of the C-terminal region of CENP-N (model) and the C-terminal region of Chl4CENP-N (structure) with β-strands shown in green and α-helices in yellow (secondary structure predictions in case of the model), and of the C-termini of CENP-L (model) and Iml3 (PDB structure 4KR1) with the same colour scheme. (B) Schematics of the overall organization of the CENP-LN complex, and complementarity of the CENP-N1-212 and 4JE3 structures. (C) Structural superposition of the CLN-HD of Iml3CENP-L (green) on the corresponding middle domain of CENP-N1-235. (D) Structure-based sequence alignment generated with program Chimera of CENP-N, CENP-L, and their yeast homologs Iml3CENP-L and Chl4CENP-N, with β-strands shown in green and α-helices in yellow, including the two structures (CENP-N and Iml3) and sequences and predicted secondary structures for the two models (Chl4 and CENP-L).
Figure 3 with 6 supplements
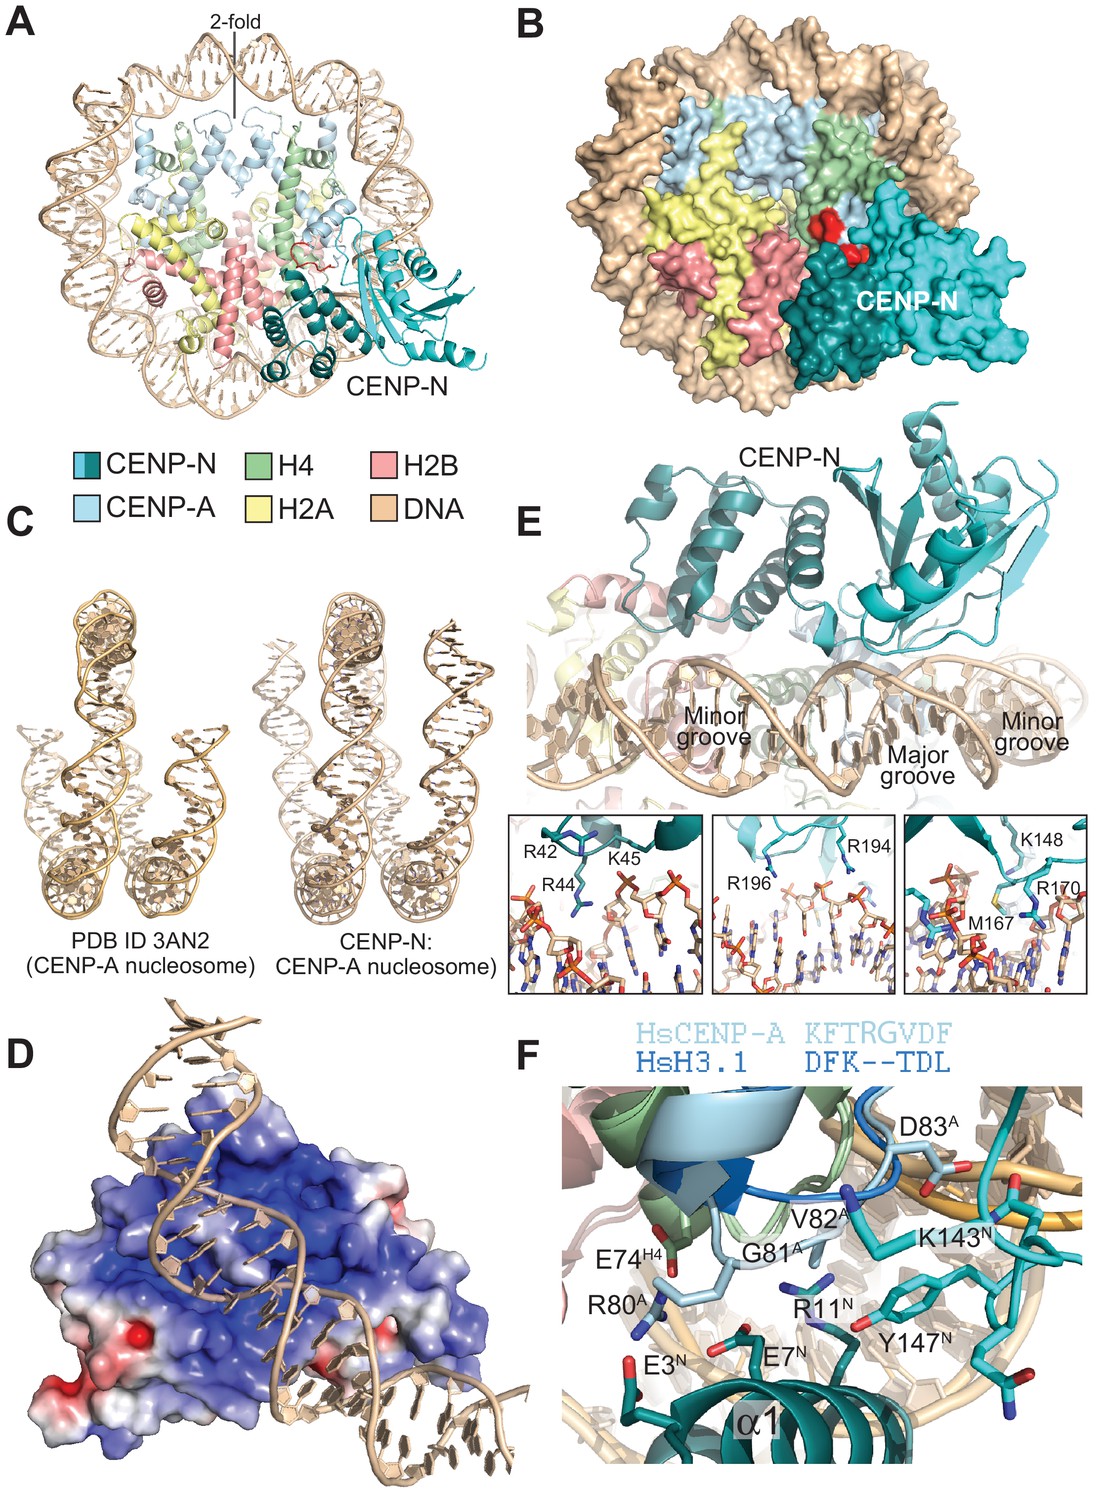
The CENP-N:CENP-ANCP complex.
(A) Cartoon model of the CENP-ANCP with bound CENP-N1-235, determined by cryo-EM. (B) Surface representation of the complex. In A and B, the L1 loop of CENP-A is displayed in red. (C) Comparison of the DNA ends in the crystal structure of the CENP-A nucleosome (Tachiwana et al., 2011) and in the structure of the CENP-A:CENP-N complex. (D) Electrostatic potential at the CENP-N DNA binding interface with contour levels ± 4 kBT/e (kB, Boltzmann constant; T, absolute temperature; e, the magnitude of electron charge, calculated with the APBS Pymol plugin). (E) Interaction of CENP-N with backbone, minor groove, and major groove of DNA with close-up views of selected interactions. (F) Interactions at the CENP-A L1 loop and comparison with superimposed H3.
Figure 3—figure supplement 1
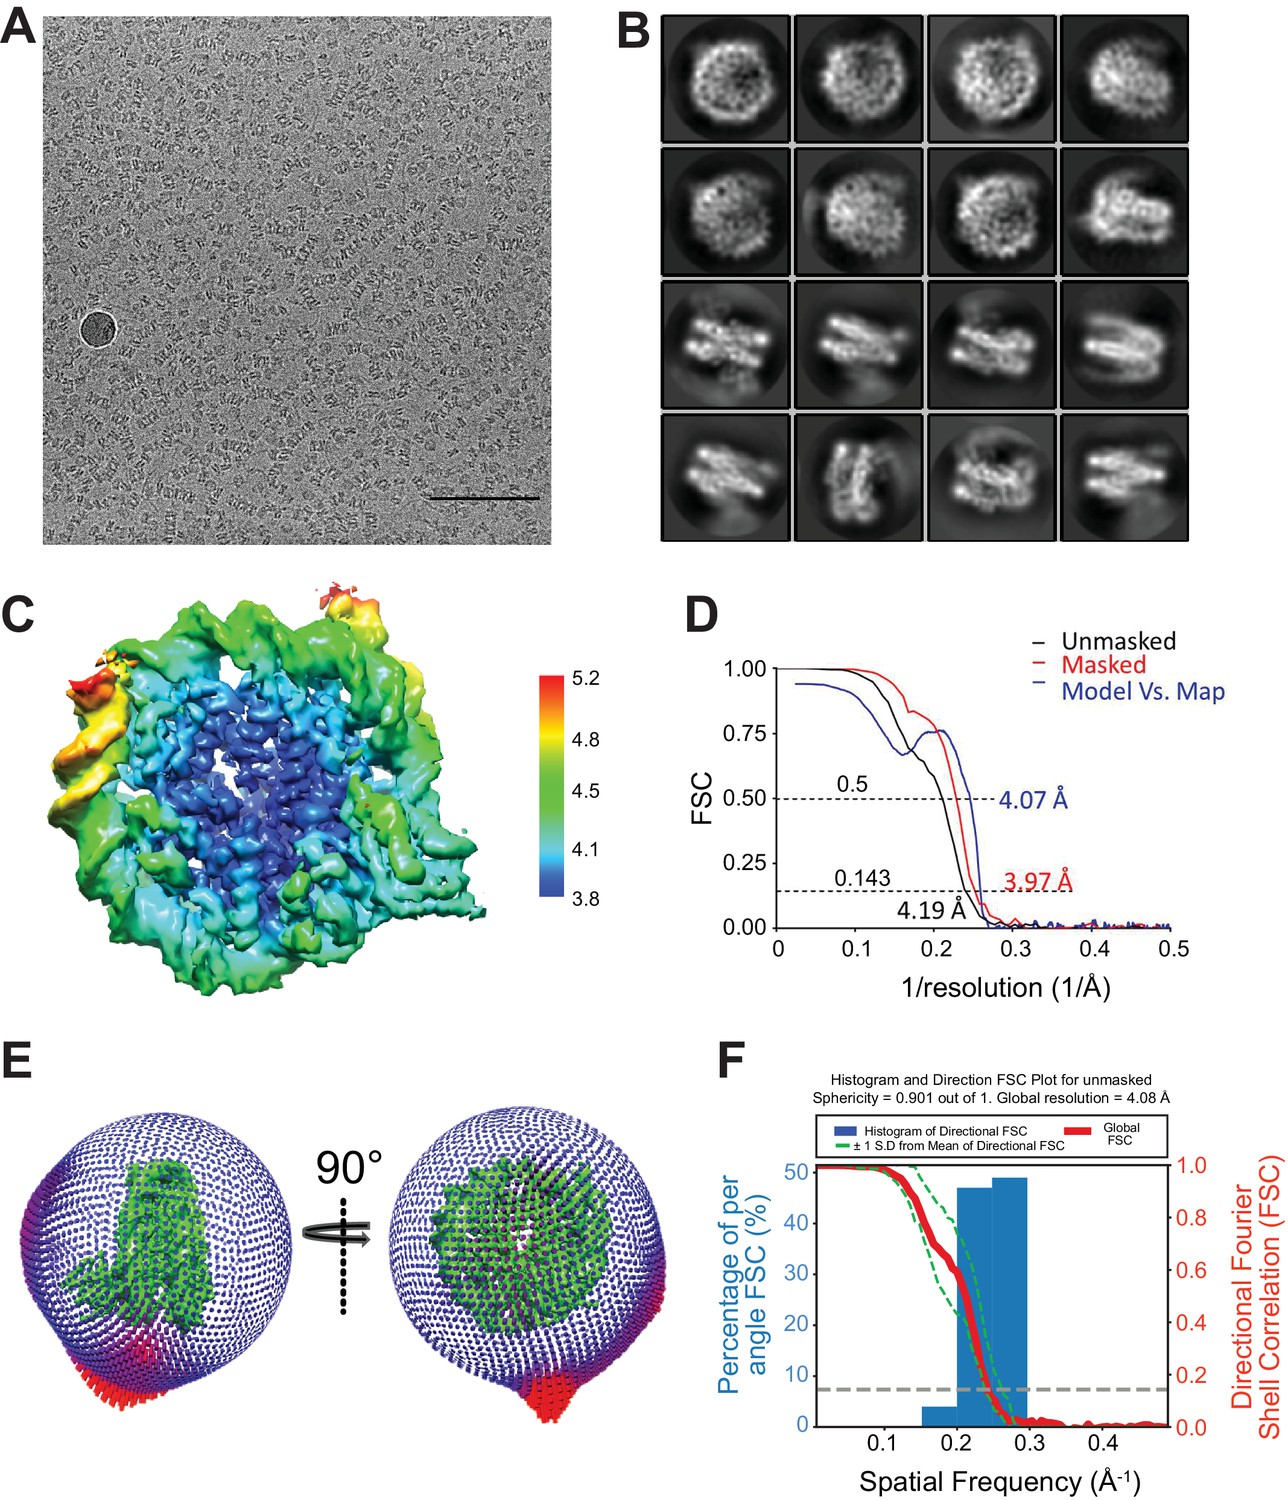
Additional EM data and analysis.
(A) Collected micrograph after CTF correction at −2.5 μm defocus (nominal). Scale bar = 100 nm. (B) Representative 2D class averages from RELION (Scheres, 2012) 2D classification. (C) Fourier Shell Correction (FSC) curve for the maps. (D) Estimated local resolution for the CENP-N1-289:CENP-ANCP by RELION. The unit for color scale is Å. (E) Euler angular distribution of the 3D reconstruction. (F) Histogram and directional FSC plot for unmasked map. Sphericity = 0.901 out of 1, global resolution = 4.08 Å.
Figure 3—figure supplement 2

EM maps.
(A) Representative areas of the map of the CENP-N1-289:CENP-ANCP complex contoured at 3σ shows very clear density for the DNA ends and for the N-terminal helix of CENP-A, starting from residue G46. The grey arrow points to a zoomed-in region close to the DNA end. (B) The zoomed-in region. (C) Overall fit of the CENP-N1-235 crystallographic model in the EM density. (D) The H4 N-terminal region is clearly ordered starting at residue R23, possibly due to packing against the β3-β3 loop of CENP-N. (E) Illustrative example of model fit in the map around H2A. (F) Illustrative example of model fit in the map around H2B.
Figure 3—figure supplement 3
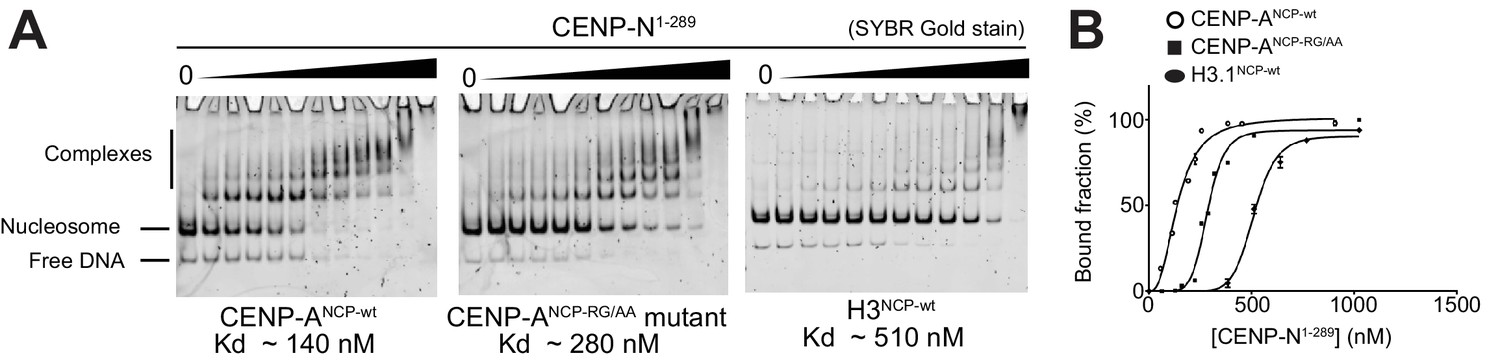
EMSA assays.
(A) EMSAs (electrophoretic mobility shift assays) with the indicated NCPs and CENP-N1-289. (B) Quantification of data in A. Data were fitted in Graphpad using the specific binding model with Hill coefficient fitting.
Figure 3—figure supplement 4
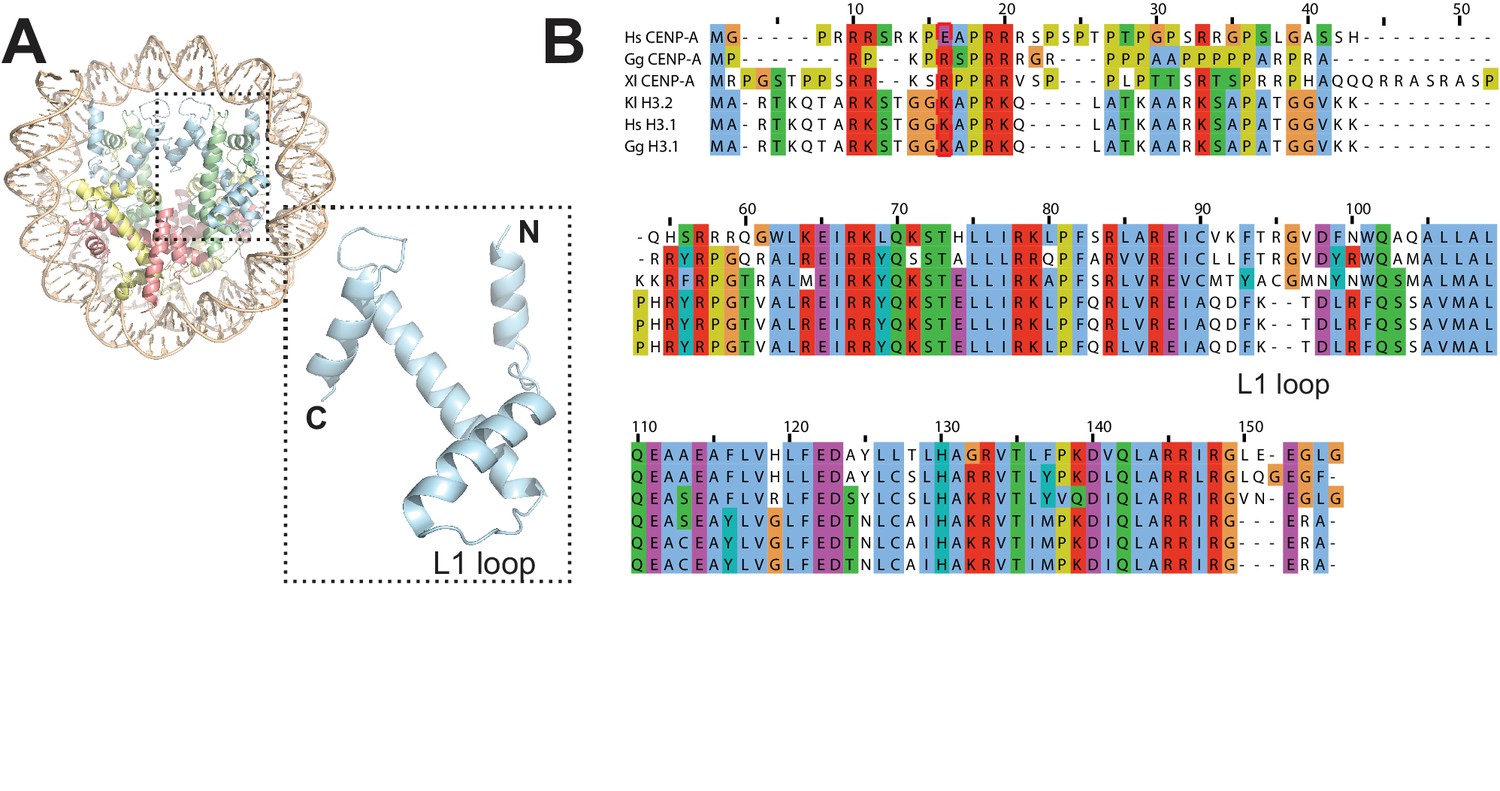
Essential features of CENP-A.
(A) Cartoon model of the CENP-A nucleosome (this work). CENP-A is shown in light blue and in a zoomed-in view. (B) Alignment of CENP-A and H3 sequences from three species showing divergence in the L1 loop region.
Figure 3—figure supplement 5

Comparison of CENP-A and H3 and interface with CENP-N.
Close-up view of the CENP-A:CENP-N interface with EM density map. The superposition with H3 (dark blue) illustrates that H3 would be unable to form productive contacts with CENP-N. V82 of CENP-A packs against the side chain of Y147 of CENP-N. The A and N superscripts indicate that the shown residues belong to CENP-A or CENP-N, respectively. aDD HERE WHAT THE SUPERSCRIPT LETTERS ARE.
Figure 3—figure supplement 6

Comparison of nucleosome binding modes.
(A–B) Two views in different orientation of the structure of the CENP-N1-289:CENP-ANCP complex, with CENP-A in light blue and CENP-N in teal and cyan. (C–D) Two views in different orientations of the SWI2/SNF2:H3NCP complex (Liu et al., 2017) illustrating similarities in the interactions with the nucleosome. The contacts of SWI/SNF with the proteinaceous part of the H3NCP particle are more limited than for CENP-N. (E–F) Two views in different orientations of the BAH:H3NCP complex (Armache et al., 2011). The contacts of the BAH domain with DNA are very limited, while there are extensive interactions with the H2A-H2B acidic patch and with the H4 N-terminal tail and with H3.
Figure 4 with 2 supplements
Validation of the CENP-N:CENP-ANCP complex.
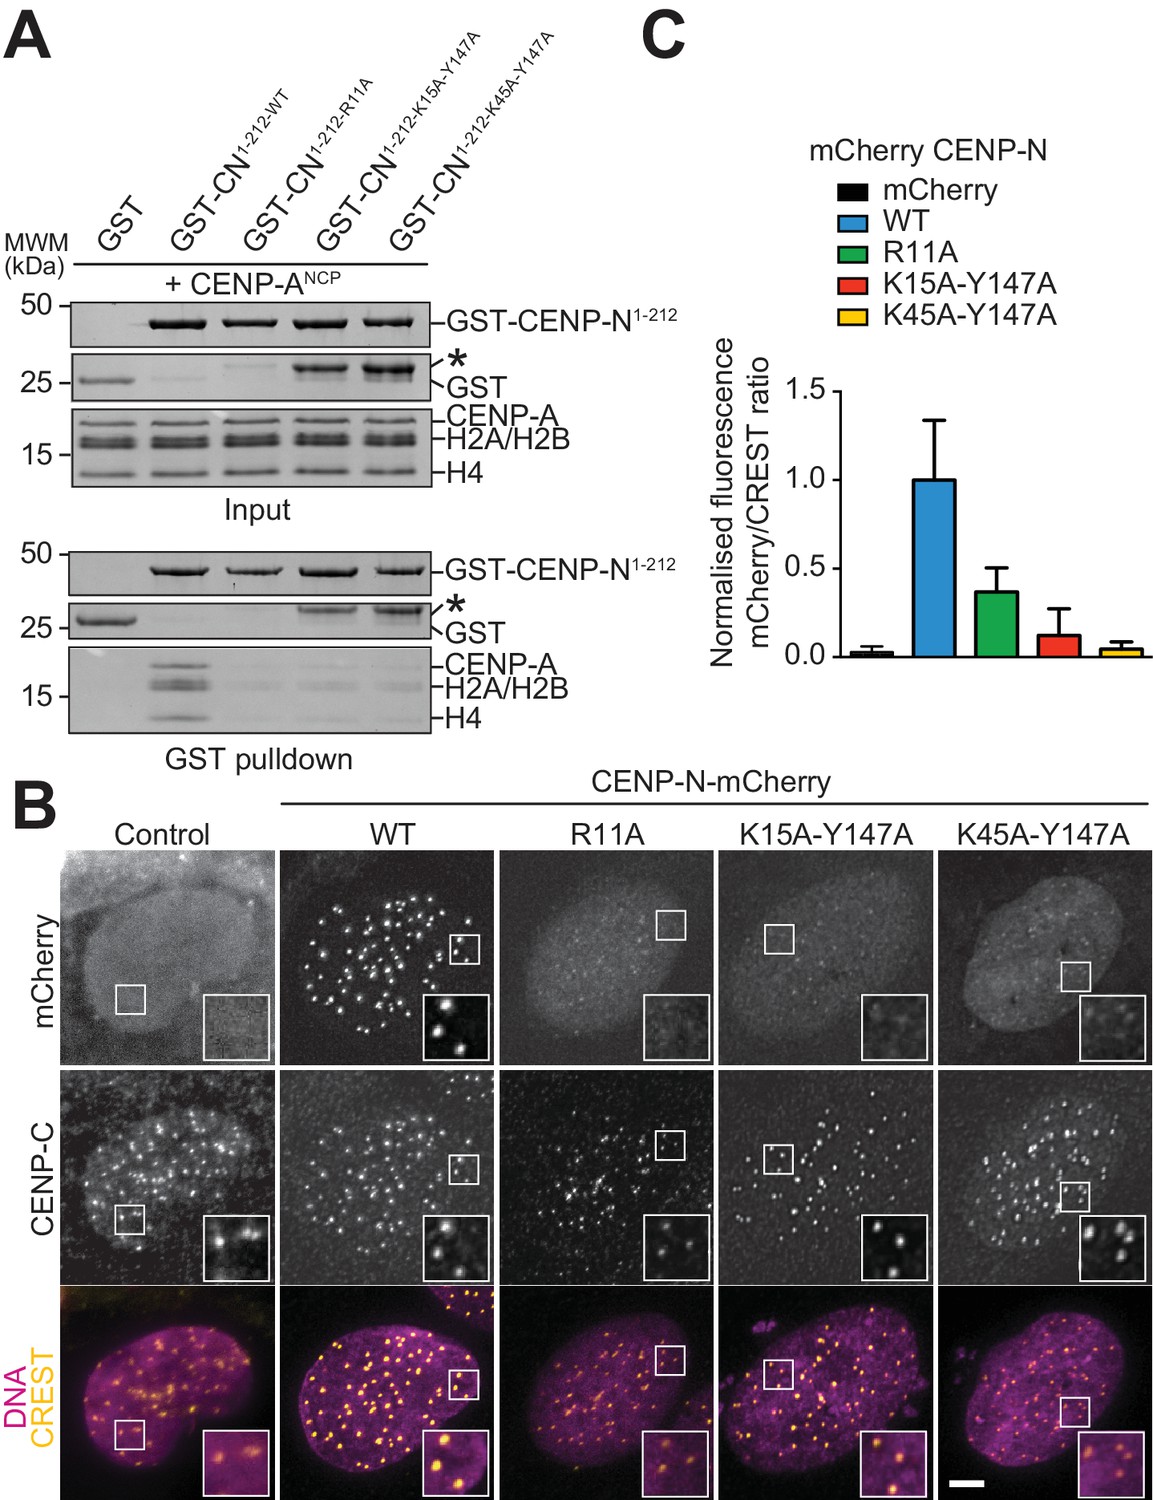
(A) In vitro binding assay probing the interaction of GST-CENP-N1-212 immobilized on solid phase with CENP-ANCP. (B) Fluorescence microscopy analysis comparing localization at human kinetochores (U2OS osteosarcoma cells) of a wild-type CENP-N-mCherry fluorescent reporter and of its mutant variants. (C) Quantification of localization of the mCherry constructs in B normalized to CREST. The same concentrations of transiently transfected plasmids were compared. Error bars represent SD.
Figure 4—figure supplement 1

Characterization of CENP-N mutants in solid phase and cell assays.
(A) In vitro binding assay probing the interaction of wild type and mutant GST-CENP-N1-212 immobilized on solid phase with CENP-ANCP. (B) Fluorescence microscopy analysis comparing kinetochore localization of a wild-type CENP-N-mCherry fluorescent reporter and of the indicated mutant variants in U2OS cells. The same concentrations of transiently transfected plasmids were compared.
Figure 4—figure supplement 2

Characterization of CENP-N mutants in competition gel shift assays.
(A–B) Gel shift assays with differentially labelled CENP-ANCPs (red) and H3NCPs (green) at 125 nM in presence of the indicated CENP-N wild type and mutant species (1 µM). The two individual channels are shown below. The nature of all slow-migrating species formed upon binding of CENP-N and its mutants to nucleosomes is unknown, but we suspect they represent higher order oligomerization. Note that mutants affecting the CENP-A L1 loop-binding interface of CENP-N affect CENP-ANCPs binding more than H3NCPs binding, likely because the latter is solely based on the intact DNA-binding interface of CENP-N (see text for additional details).
Figure 5 with 2 supplements

Identification of a CENP-N binding site on CENP-C.
(A) Size exclusion chromatography (SEC) runs of CENP-C225-364, CENP-LN complex, and their combination at the indicated loaded concentrations, identified a binding site for CENP-LN in CENP-C225-364. Elution fractions were separated by SDS-PAGE and visualized by Coomassie staining. (B) CENP-LN230-C binds CENP-C2-545, indicating that the CENP-N N-terminal region is not required for CENP-C binding. (C) Sequence of a segment of the PEST-rich domain CENP-C that contains a binding site for the CENP-HIKM complex (Klare et al., 2015) (residues indicated in salmon). The CENP-N-binding motif is shown in grey. (D) CENP-LN does not bind CENP-C2-545-5A. (E) CENP-C2-545-5A retains the ability to bind to CENP-ANCP. (F) CENP-C2-545-5A retains the ability to bind to the CENP-HIKM complex. (G) Isothermal titration calorimetry (ITC) experiment quantifying the physical interaction of the CENP-L:CENP-N230-C complex with CENP-C225-364. (H) In agreement with the SEC data, CENP-C225-364-5A fails to interact with the CENP-L:CENP-N230-C complex in an ITC experiment.
Figure 5—figure supplement 1
Additional size-exclusion chromatography experiments.
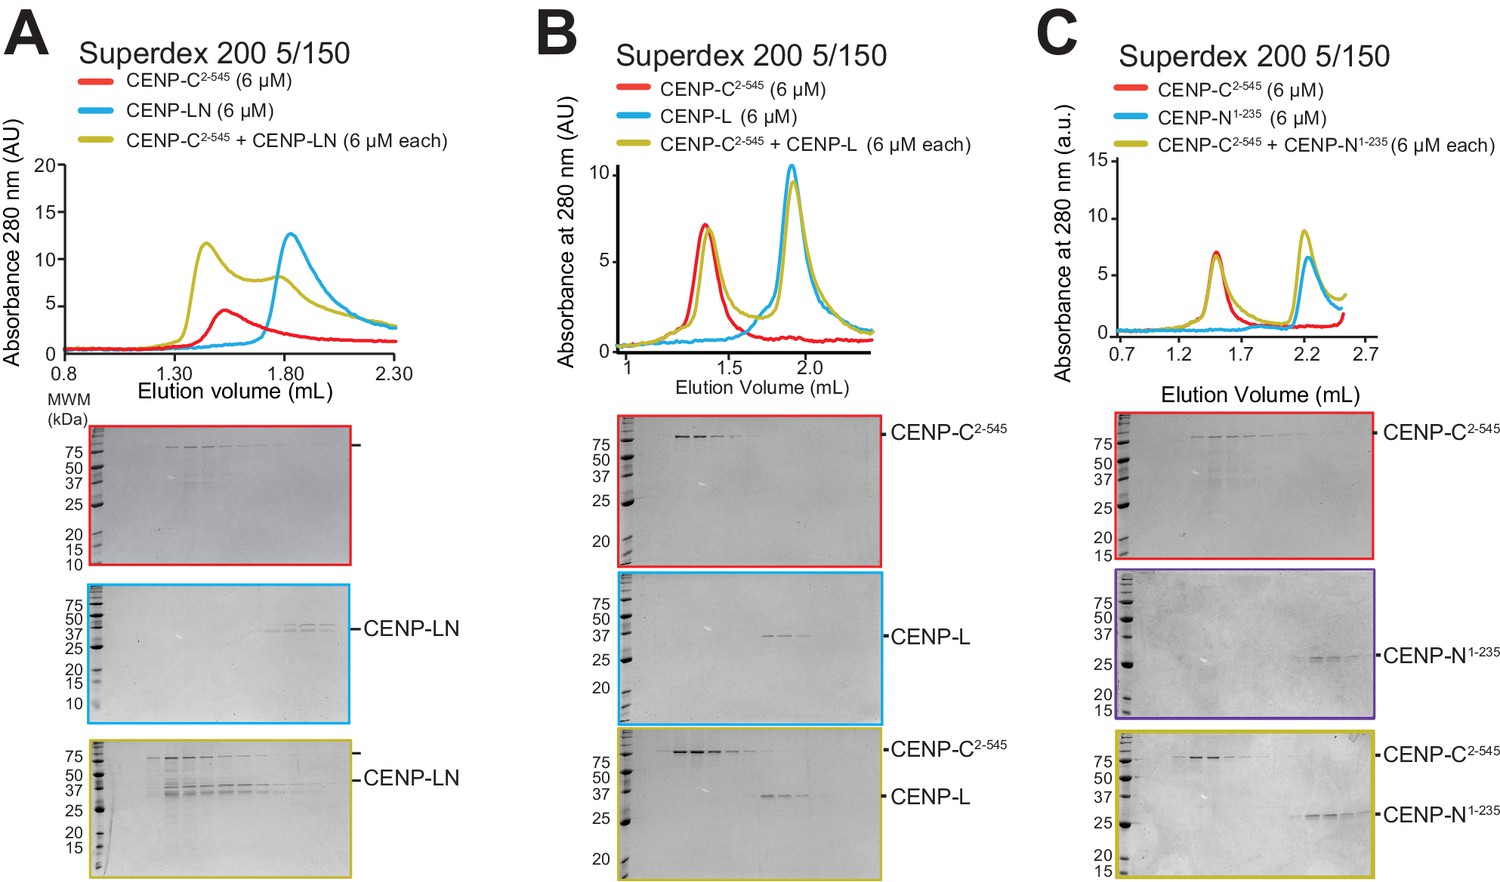
(A) SEC experiment demonstrating an interaction of CENP-C2-545 with CENP-LN complex, as shown previously (Weir et al., 2016). (B) SEC experiment demonstrating that CENP-L does not bind CENP-C2-545. (C) SEC experiment demonstrating that CENP-N1-235 does not bind CENP-C2-545.
Figure 5—figure supplement 2

Solid-phase-binding assays with CENP-C and CENP-C mutant.
Solid-phase-binding assay with immobilized GST-CENP-LN complex and soluble CENP-C2-545 or CENP-C2-545-5A mutant.
Figure 6
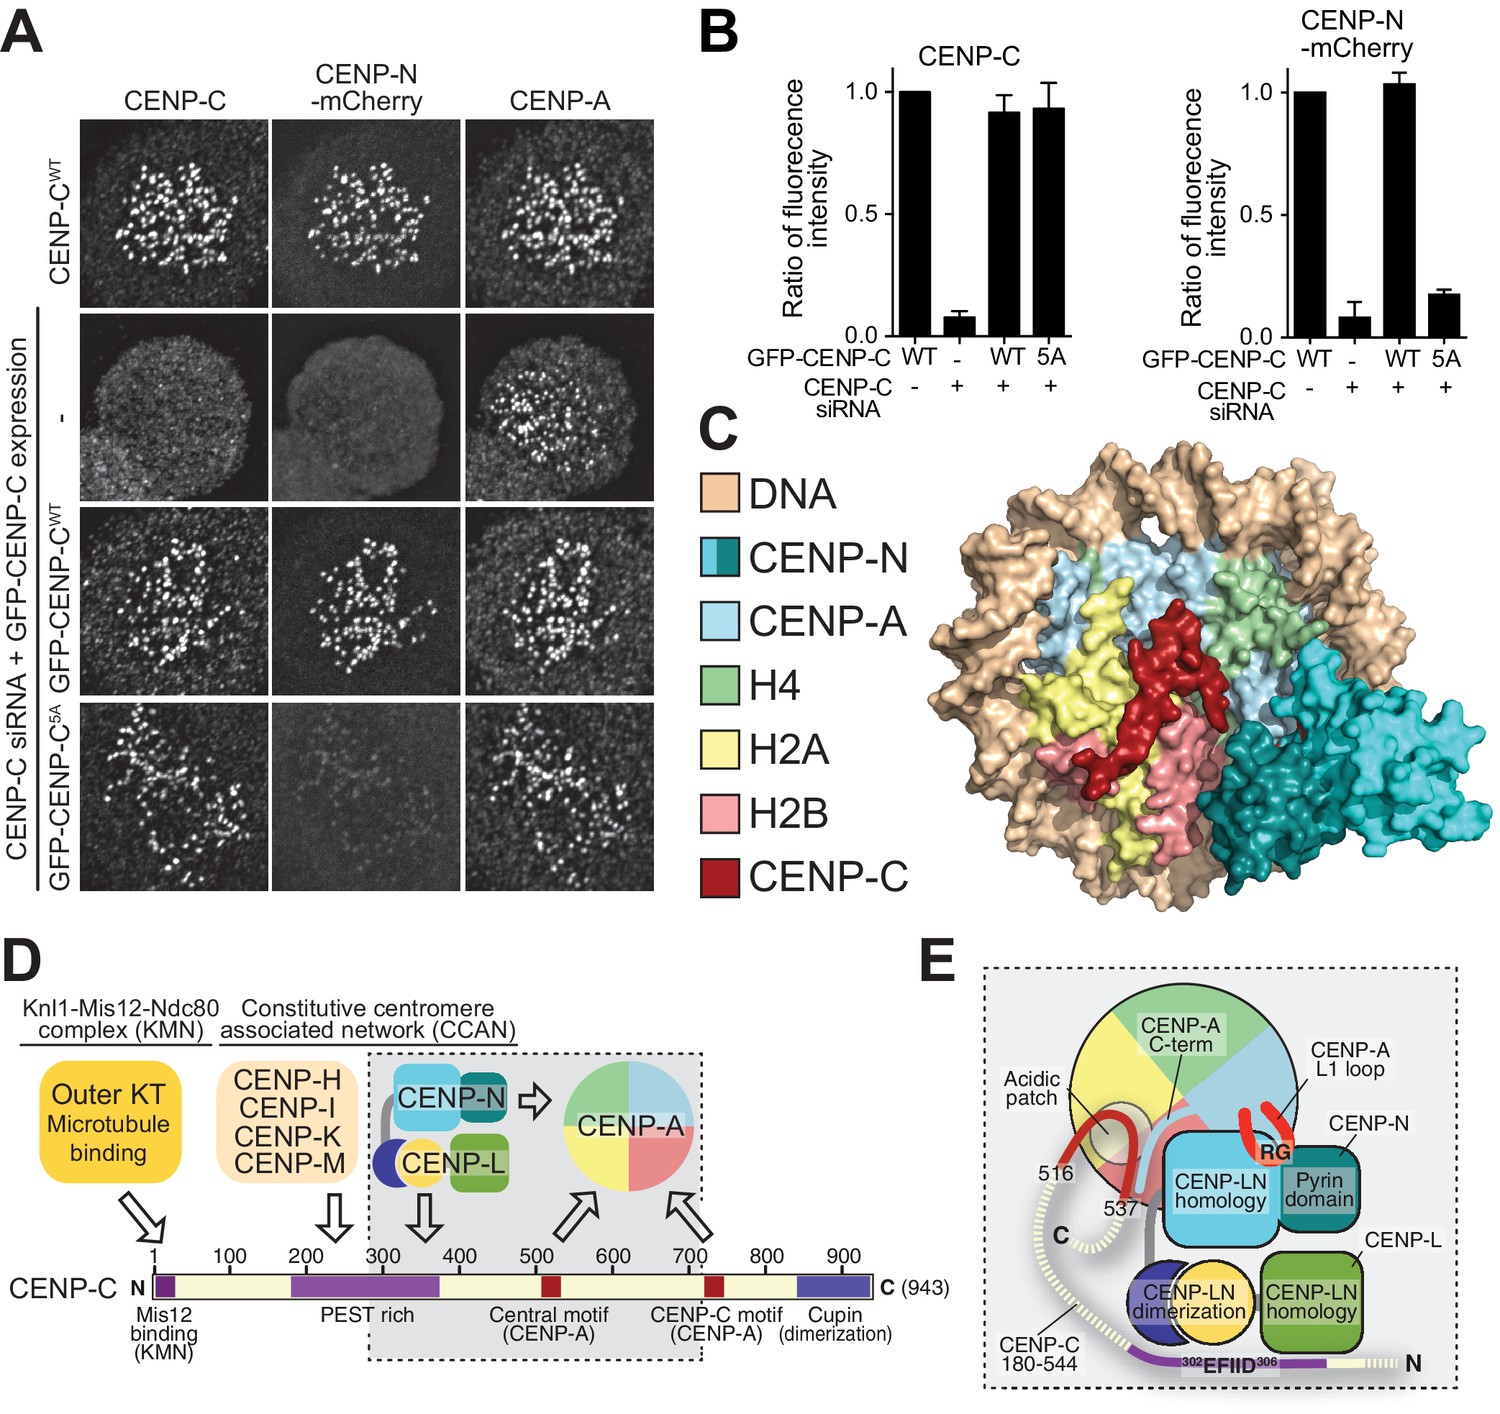
Effective CENP-N localization requires CENP-C.
(A) Fluorescence microscopy analysis comparing kinetochore localization of a wild-type CENP-N-mCherry fluorescent reporter in human HeLa FlpIn TRex cells depleted of CENP-C and, were indicated, further expressing wild-type GFP-CENP-C or the 5A mutant. (B) Quantification of CENP-C (left) and mCherry-CENP-N (right) levels at kinetochores in mitotic cells following the rescue of CENP-C depletion by either GFP-CENP-CWT or the GFP-CENP-C5A mutant. Graphs show kinetochore fluorescence intensity of the indicated protein (antibodies against CENP-C or mCherry) normalized to CENP-C or mCherry-CENP-N kinetochore levels in the absence of RNAi treatment, respectively. Each graph is representative of two independent experiments. (C) Surface representation of a composite model built by combining the coordinates of the CENP-C motif (residues 712 to 733 from PDB ID 4 × 23, describing its interaction with nucleosome) with those of the CENP-N:CENP-ANCP complex. (D) Schematic of crucial kinetochore interactions, already shown in Figure 1A, but with question marks removed at interactions investigated in the present work. (E) The grey box, an enlargement of the box in D, summarizes the details of the interactions reported in this work, as well as previous information on the interaction of CENP-C with the CENP-ANCP.
Tables
Table 1
X-ray data collection and refinement statistics
https://doi.org/10.7554/eLife.33442.008| Data collection and processing | ||||
|---|---|---|---|---|
| Native | SeMet 1 | SeMet 2 | SeMet 1 + 2 | |
| Space group | P41 | P41 | P41 | P41 |
| Wavelength | 0.97793 | 0.9793 | 0.9793 | 0.9793 |
| No. xtals | 1 | 1 | 1 | 2 |
| Source | SLS | PETRA | PETRA | PETRA |
| Detector | Pilatus 6M | Pilatus6M | Pilatus 6M | Pilatus 6M |
| Mol/AU | 2 | 2 | 2 | 2 |
| a,b,c (Å) | 87.3 87.3 81.1 | 88.99 88.99 76.96 | 89.14 89.14 77.22 | 88.99 88.99 76.96 |
| α, β, γ (°) | 90 90 90 | 90 90 90 | 90 90 90 | 90 90 90 |
| Resolution (Å) | 87.3–2.74 (2.81–2.74)* | 48.7–3.3 (3.9–3.3) | 48.8–3.2 (3.3–3.2) | 48.7–3.3 (3.4–3.3) |
| Rmeas | 8.2 (155.1) | 17.2 (153.4) | 18.8 (173.4) | 18.7 (167.8) |
| I/σI | 17.3 (1.4) | 7.5 (1.1) | 7.2 (1.0) | 10.4 (1.4) |
| Completeness (%) | 99.8 (98.5) | 100.0 (100.0) | 99.9 (98.8) | 100.0 (100.0) |
| Redundancy | 9.4 (8.7) | 7.1 (7.2) | 7.0 (6.3) | 14.1 (14.1) |
| Refinement | Phasing | |||
| Resolution (Å) | 87.3–2.7 | FOM 0.39 | ||
| No. reflections | 17103 | BAYES-CC 38.1 | ||
| Rwork/Rfree(%) | 21.6/26.1 | 12 Selenium-sites | ||
| No. atoms: | ||||
| Protein/ Ligands | 3432/6 | |||
| Water | 10 | |||
| aver. B (Å2) | 90.4 | |||
| R.m.s. deviations | ||||
| Bond lengths (Å) | 0.0076 | Ramachandran plot: 98.0% favourable, 0% outliers | ||
| Bond angles (°) | 1.27 | |||
-
* Values in parentheses are for highest resolution shell
Table 2
EM data collection, processing, and refinement statistics
https://doi.org/10.7554/eLife.33442.016| Data collection and processing | |
|---|---|
| Voltage (kv) | 300 |
| Magnification | 290,000x |
| Defocus (μm, nominal) | −1.0 to −2.5 |
| Pixel size (Å) | 1.02 |
| electron dose rate (counts/pixel/s) | 10 |
| Total electron dose (e- /Å2) | 80 |
| Exposure time (s) | 8 |
| Number of images (collected/processed) | 3900/3024 |
| Number of frames per image | 40 |
| Initial particle number | 1,843,269 |
| Particle number for 3D classification | 1,267,674 |
| Final particle for refinement | 937,118 |
| Resolution (masked/unmasked) (Å) | 4.0/4.2 |
| Map sharpened b-factor (Å2) | −233 |
| Model refinement | |
| r.m.s. deviation (bonds) | 0.005 |
| r.m.s. deviation (angles) | 0.97 |
| All-atom clashscore | 2.30 |
| Ramachandran plot | |
| Outliers (%) | 0.00 |
| Allowed (%) | 4.59 |
| Favored (%) | 95.81 |
| CaBLAM analysis: | |
| Outliers (%) | 1.92 |
| Disfavored (%) | 6.65 |
| Ca outliers (%) | 0.11 |
| Rotamer outliers (%) | 0.00 |
Additional files
-
Transparent reporting form
- https://doi.org/10.7554/eLife.33442.024
Download links
A two-part list of links to download the article, or parts of the article, in various formats.
Downloads (link to download the article as PDF)
Open citations (links to open the citations from this article in various online reference manager services)
Cite this article (links to download the citations from this article in formats compatible with various reference manager tools)
Decoding the centromeric nucleosome through CENP-N
eLife 6:e33442.
https://doi.org/10.7554/eLife.33442


