HNF1A is a novel oncogene that regulates human pancreatic cancer stem cell properties
- University of Michigan Health System, United States
- New York University Langone Health, United States
- New York University Langone Health, United states
Figures
Figure 1 with 2 supplements
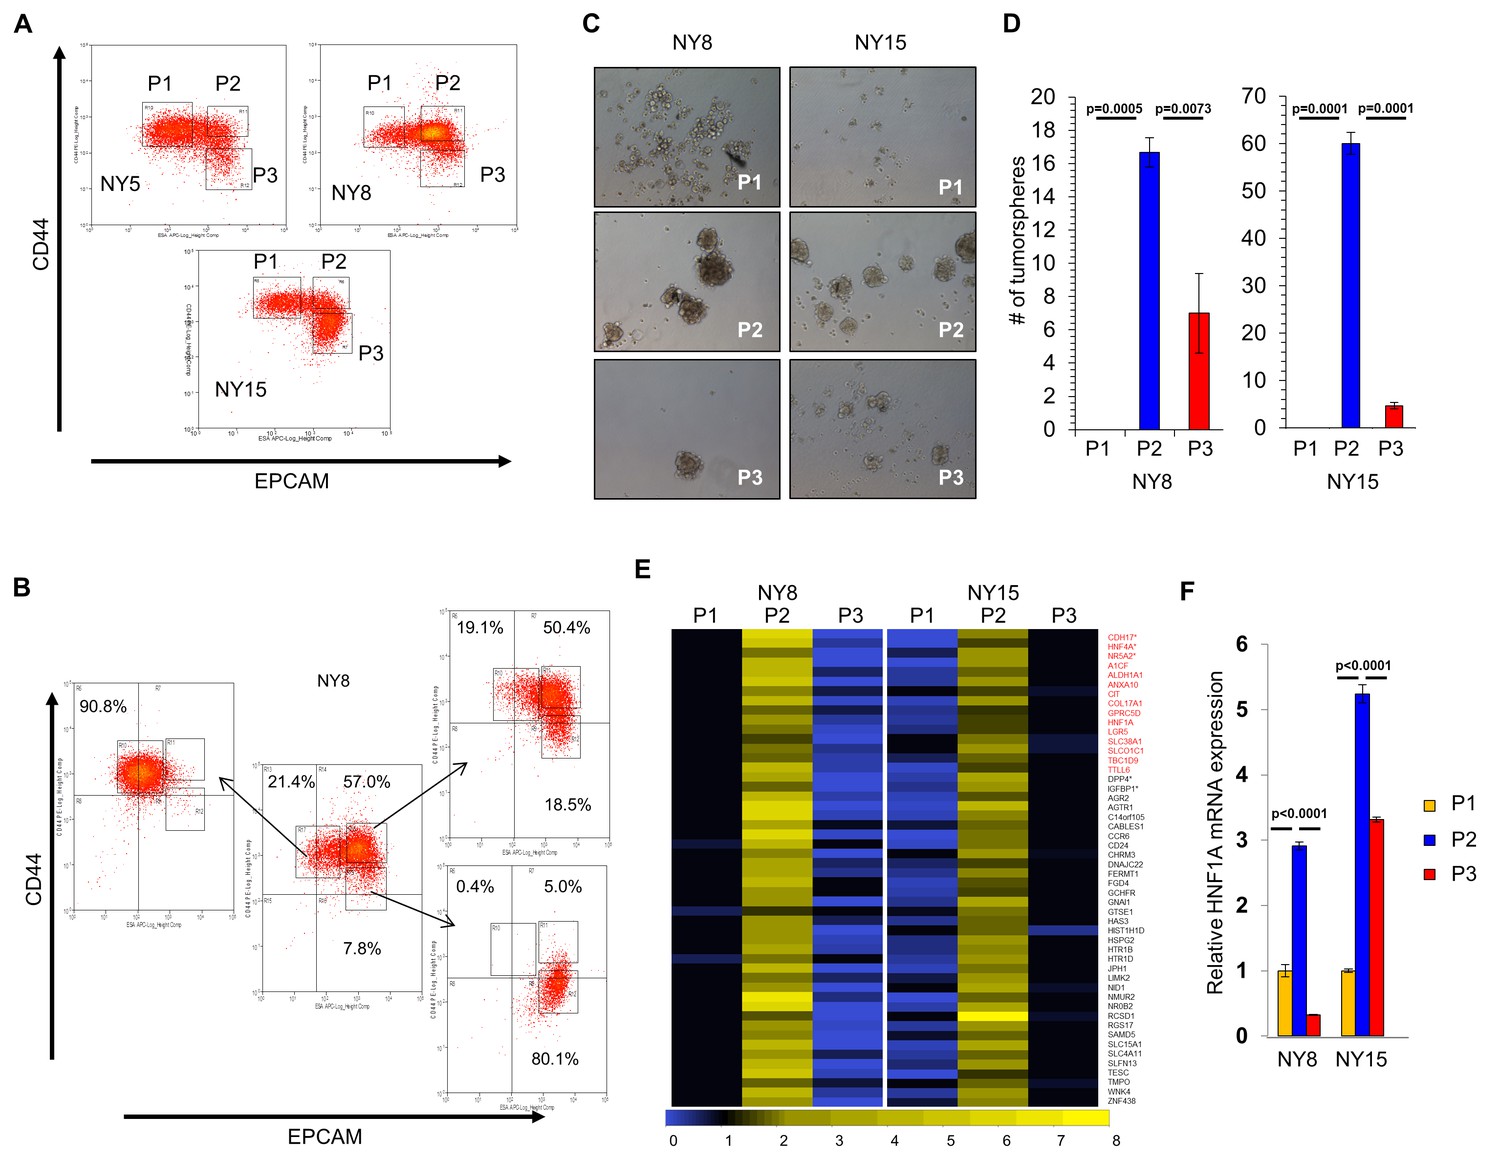
HNF1A-signature dominates pancreatic CSCs.
(A) Flow cytometry analysis of CD44 and EPCAM surface expression of three primary PDA samples. (B) CD44High/EPCAMLow (P1), CD44High/EPCAMHigh (P2) and CD44Low/EPCAMHigh (P3) NY8 cells were isolated by FACS and grown in culture for 17 days, followed by flow cytometry for analysis for CD44 and EPCAM expression. (C, D) Isolated subpopulations were grown in tumorsphere media on non-adherent plates (500 cells/well) for 6 days. Representative images of resultant tumorspheres (100X magnification) are shown in (C), while quantitation of spheres (n = 3) is shown in (D). Statistical difference was determined by one-way ANOVA with Tukey’s multiple comparisons test. (E) Heat map representing relative fold differences in qRT-PCR expression of 50 cancer stem-cell-enriched genes in NY8 and NY15 cells. Per-gene values are relative to P1 or P3, whichever is higher. Gene names in red text indicate predicted HNF1A targets and asterisks (*) indicate known HNF1A targets. P1: CD44High/EPCAMLow, P2: CD44High/EPCAMHigh, P3: CD44Low/EPCAMHigh. For all genes, expression levels were normalized to an ACTB mRNA control, n = 3. Only genes with a significant (p<0.05) increase in P2 over both P1 and P3 subpopulations are shown, with statistical difference determined by one-way ANOVA with Tukey’s multiple comparisons test. (F) qRT-PCR analysis of HNF1A mRNA expression, normalized to an ACTB mRNA control, from different primary PDA subpopulations (n = 3). Statistical difference was determined by one-way ANOVA with Tukey’s multiple comparisons test. Related data can be found in Figure 1—figure supplements 1 and 2.
-
Figure 1—source data 1
Quantitation of tumorspheres, P2 subpopulation-enriched transcripts, and HNF1A mRNA.
- https://doi.org/10.7554/eLife.33947.006
-
Figure 1—source data 2
Quantitation of GFP expression in adherent cells and tumorspheres.
- https://doi.org/10.7554/eLife.33947.007
Figure 1—figure supplement 1

Cancer stem cell properties of PDA cell subpopulations.
(A) Co-localization of CD24High surface expression with EPCAM and CD44 expression is highlighted in red. (B) Western blot analysis of HNF1A and target genes CDH17 and DPP4, as well as CD44 and EPCAM as subpopulation controls in sorted PDA cells. Quantitation of proteins is indicated below the respective blots.
Figure 1—figure supplement 2

HNF1A is elevated in tumorspheres.
(A) NY8 and NY15 cells were grown either in non-adherent conditions (labeled S) or under adherent conditions (labeled A) for 7 days. Lysates were collected and western blotted for HNF1A, CDH17, and Actin. Quantitation of proteins is indicated below the respective blots. (B) Schematic representation of HNF1A-responsive reporter construct showing eight tandem copies of the HNF1A-binding site upstream of a minimal promoter (pTA) driving GFP expression. (C) HNF1A-reporter-labeled NY5, NY8, and NY15 cells were grown under adherent (A) or tumorsphere (S) conditions for 7 days, lysed and immunoblotted for HNF1A, CDH17, GFP, and Actin. Quantitation of proteins is indicated below the respective blots. (D) Reporter cells were transfected for 7 days with control (Ctl) or HNF1A-targeting siRNA, lysed and immunoblotted for HNF1A, CDH17, GFP, and Actin. Quantitation of proteins is indicated below the respective blots. (E, F) NY15 reporter cells grown under adherent or tumorsphere conditions were collected by trypsinization and analyzed by flow cytometry for GFP fluorescence and EPCAM, CD44, and CD24 surface staining. Representative flow cytometry plots and quantitation of GFP expression are shown in the upper and lower panel of (E), respectively. Statistical difference was determined by unpaired t test with Welch's correction (n = 3). (F) Flow cytometry plots showing co-localization of GFP with EPCAM, CD44, CD24 are shown. The percentage of CD44High/EPCAMHigh/GFP+ or CD44High/CD24High/GFP+ cells is indicated as a mean ± SEM (n = 3). Statistical difference between adherent and sphere cells was determined by unpaired t test with Welch's correction, and respective p values are indicated.
Figure 2 with 1 supplement

Knockdown of HNF1A in primary PDA cells inhibits growth in vitro.
(A) Western blot analysis of HNF1A expression in a panel of primary PDA lines compared to immortalized pancreatic ductal cell line HPNE and HPDE. Quantitation of HNF1A protein is indicated below the respective blots. (B) Western blot of NY5, NY8, and NY15 cells transfected with non-targeting (Ctl) or HNF1A-targeting siRNA for 3 days, showing effective depletion of HNF1A protein by RNAi. Quantitation of HNF1A protein is indicated below the respective blots. (C) 1.5 × 10⁵ PDA cells were transfected with control (Ctl) or HNF1A-targeting siRNA (Day 1). Cells were collected and manually counted 3 and 6 days after transfection (n = 3). Statistical difference was determined by one-way ANOVA with Dunnett’s multiple comparisons test. Red and green p values indicate Ctl vs. HNF1A#1 or #2, respectively. (D) Annexin V staining was performed on NY5, NY8, and NY15 cells transfected with control (Ctl) or HNF1A-targeting siRNA (H1, H2) for 3 days. The amount of apoptotic (annexin V+) cells are quantitated (n = 4). Statistical difference was determined by one-way ANOVA with Dunnett’s multiple comparisons test, with p values relative to the control siRNA group indicated. (E) Western blot analysis of cleaved caspases in NY8 and NY15 cells following HNF1A-knockdown (3 days). Actin serves as a loading control. Quantitation of proteins is indicated below the respective blots. Related data can be found in Figure 2—figure supplement 1.
-
Figure 2—source data 1
Quantitation of PDA cell growth and apoptosis following HNF1A knockdown.
- https://doi.org/10.7554/eLife.33947.010
-
Figure 2—source data 2
Quantitative PCR analysis of HNF1A mRNA in PDA cells and histology score of HNF1A staining in normal and neoplastic ducts..
- https://doi.org/10.7554/eLife.33947.011
Figure 2—figure supplement 1
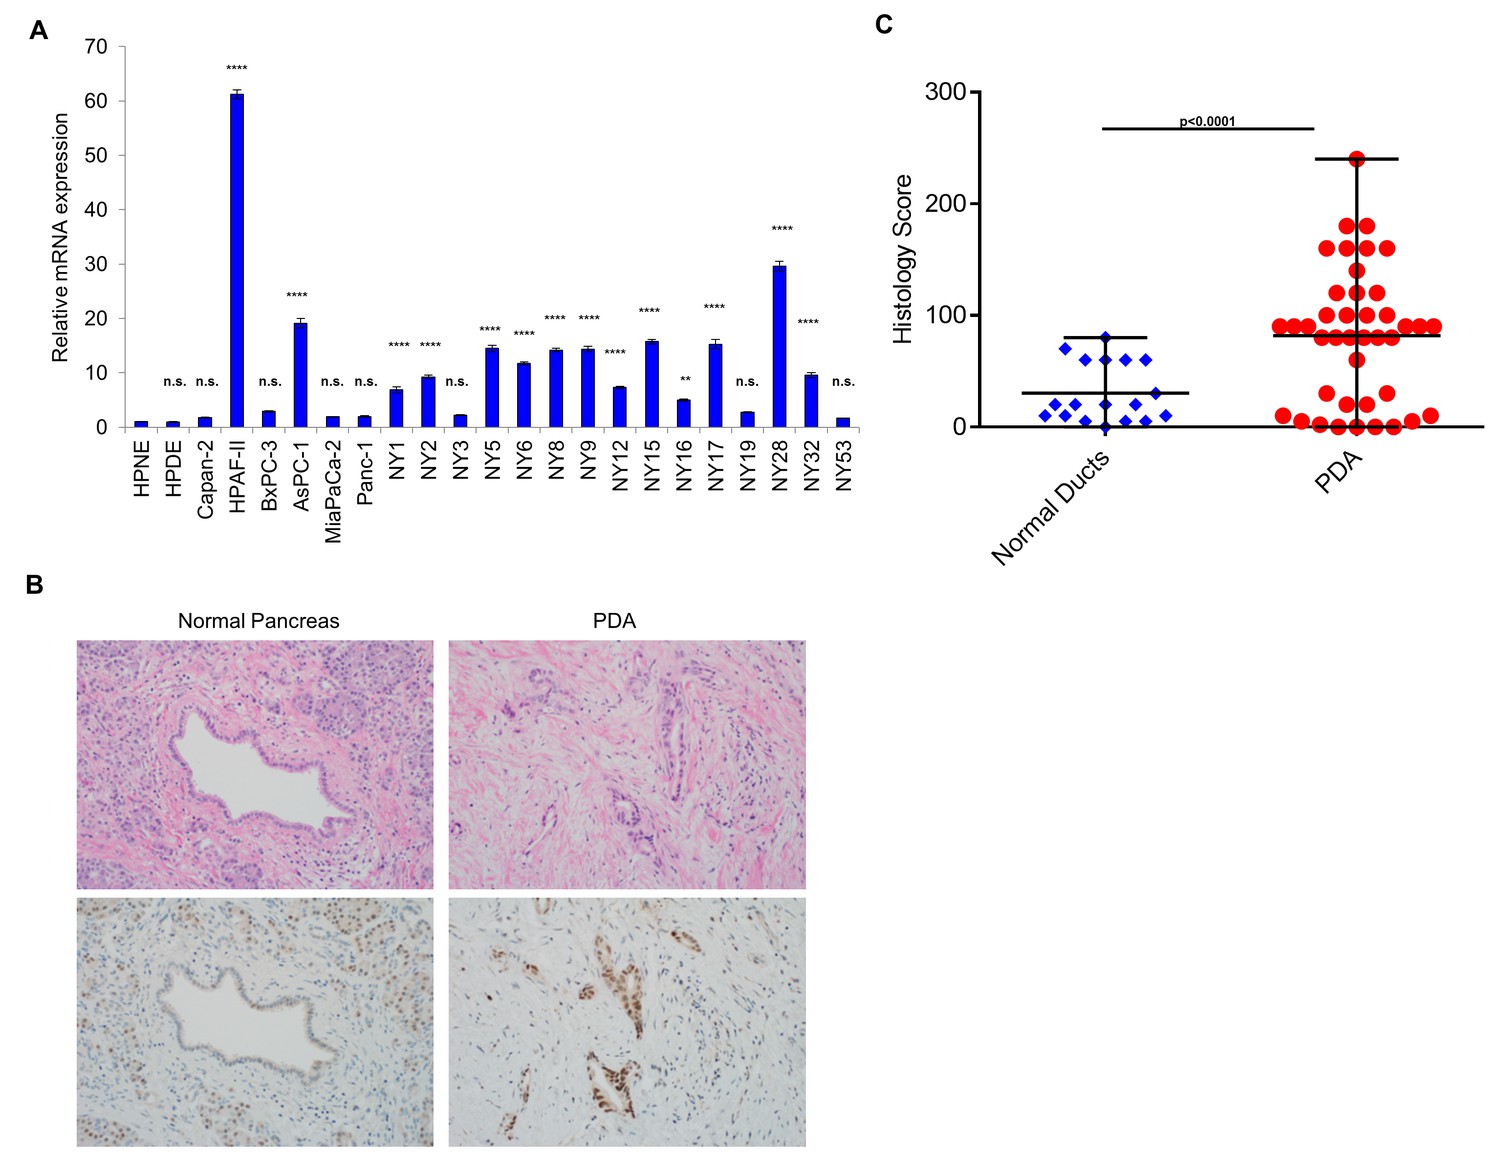
HNF1A expression in PDA cells and patient samples.
(A) qRT-PCR analysis of HNF1A mRNA expression in a panel of conventional and primary PDA lines. HNF1A mRNA expression was normalized to an ACTB internal control and relative to HPNE. Relative HNF1A mRNA expression is indicated as a mean ± SEM, (n = 3). Statistical difference was determined by one-way ANOVA with Dunnett’s multiple comparisons test using HPNE as the control group. n.s. = non significant, *p<0.05, **p<0.01, ***p<0.001, ****p<0.0001. (B, C) A pancreatic cancer tissue microarray (TMA) consisting of 41 PDA samples and 18 normal pancreas controls was immunostained for HNF1A. Representative hematoxylin and eosin staining and HNF1A staining of normal pancreas and PDA are shown in (B). Histology scores (HNF1A staining intensity x % HNF1A positive cells) for normal pancreatic ducts (n = 18) versus PDA (n = 41) is shown in (C). Statistical difference was determined by unpaired t test with Welch's correction.
Figure 3 with 1 supplement
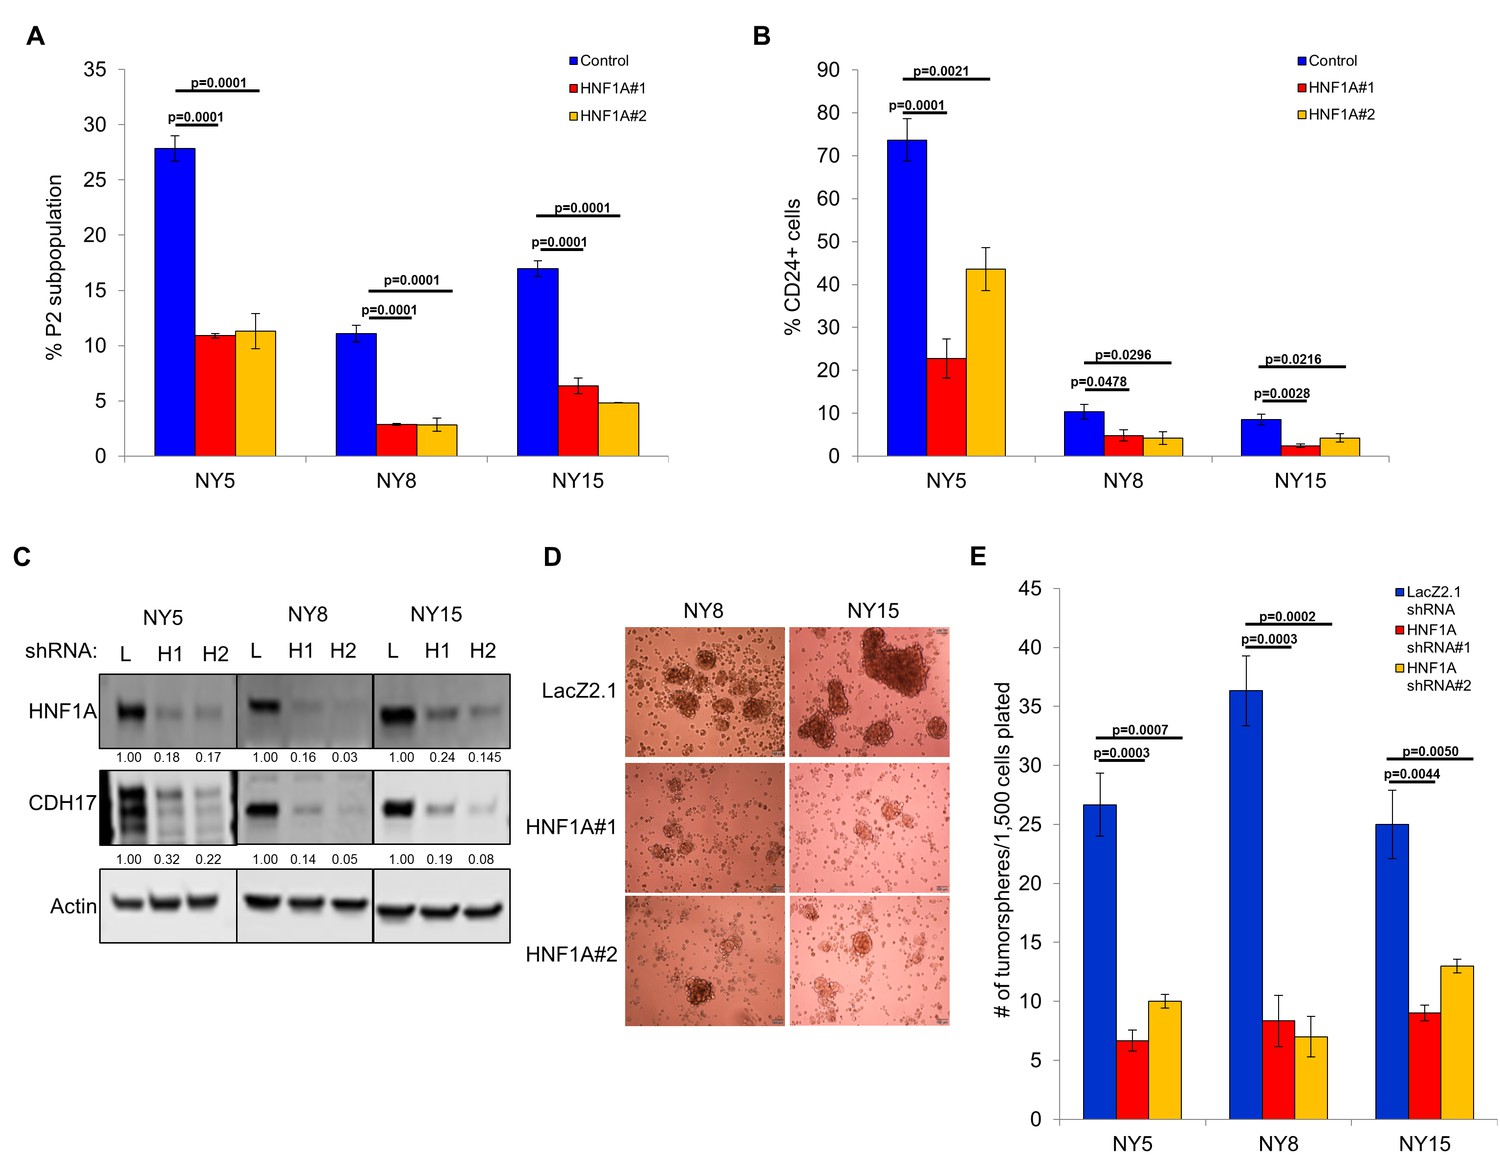
Knockdown of HNF1A depletes CSC numbers.
(A) Multiple PDA cells were transfected with HNF1A-targeting siRNA or non-targeting control siRNA for 6 days. Surface expression of CD44 and EPCAM was measured by flow cytometry, and the percentage of CD44High/EPCAMHigh (P2) cells are represented (mean ± SEM, n = 3). Statistical difference was determined by one-way ANOVA with Dunnett’s multiple comparisons test. (B) Quantitation of CD24 +cells in multiple primary PDA cells following HNF1A knockdown for 6 days, n = 4. Statistical difference was determined by one-way ANOVA with Dunnett’s multiple comparisons test. (C) NY5, NY8, and NY15 cells expressing LacZ2.1 (L) or two distinct HNF1A-targeting shRNAs (H1 and H2) were lysed and western blotted for HNF1A, CDH17, and Actin, showing effective knockdown of HNF1A and downstream signaling (CDH17). Quantitation of proteins is indicated below the respective blots. (D, E) NY5, NY8, and NY15 cells expressing LacZ2.1 or HNF1A-targeting shRNAs were grown in tumorsphere media on non-adherent plates (1500 cells/well). The number of tumorspheres formed after 6 days were counted (n = 3). Representative images of spheres (100X magnification) are shown in (F) and in Figure 3—figure supplement 1, with quantitation in (E). Statistical difference was determined by one-way ANOVA with Dunnett’s multiple comparisons test. Related data can be found in Figure 3—figure supplement 1.
-
Figure 3—source data 1
Quantitation of the P2 subpopulation, CD24 expression, and tumorsphere formation following HNF1A knockdown.
- https://doi.org/10.7554/eLife.33947.014
Figure 3—figure supplement 1
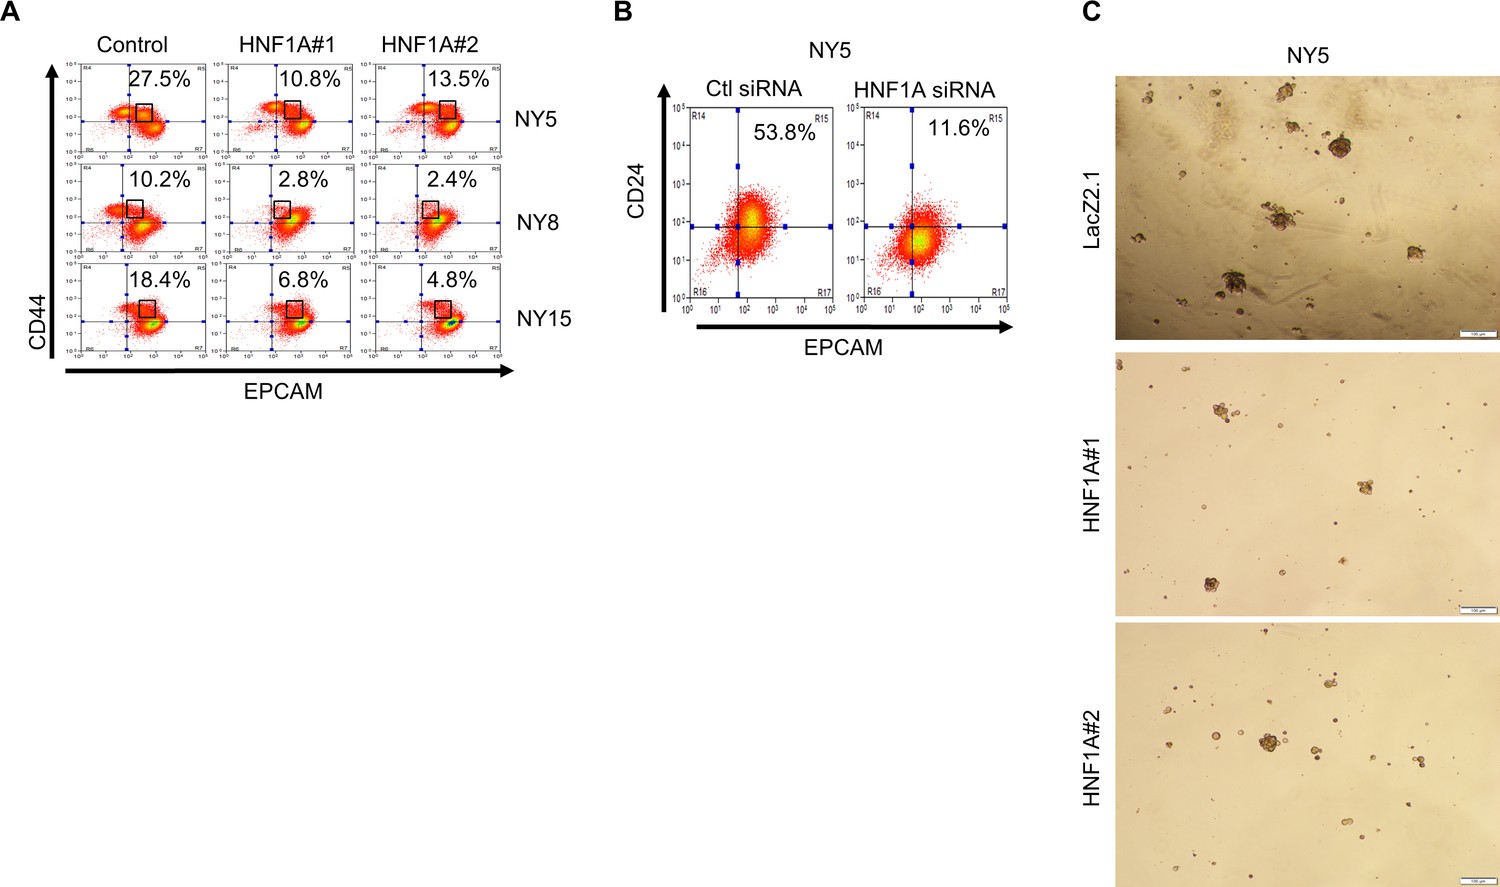
Knockdown of HNF1A depletes CSC numbers and properties in vitro.
(A) Surface expression of CD44 and EPCAM in multiple primary PDA cells following HNF1A knockdown. Percentages of P2 cells are indicated. (B, C) Surface expression of CD44 and EPCAM was measured by flow cytometry, and the percentage of (B) CD44High/EPCAMLow (P1) cells and (C) CD44Low/EPCAMHigh (P3) cells are represented (mean ± SEM, n = 3). Statistical difference was determined by one-way ANOVA with Dunnett’s multiple comparisons test. (D) Representative CD24 and EPCAM surface staining in cells following HNF1A knockdown (6 days). (E) NY5 cells expressing LacZ2.1 or HNF1A-targeting shRNAs were grown in tumorsphere media on non-adherent plates (1500 cells/well). Representative images of spheres (100X magnification) are shown.
Figure 4 with 1 supplement
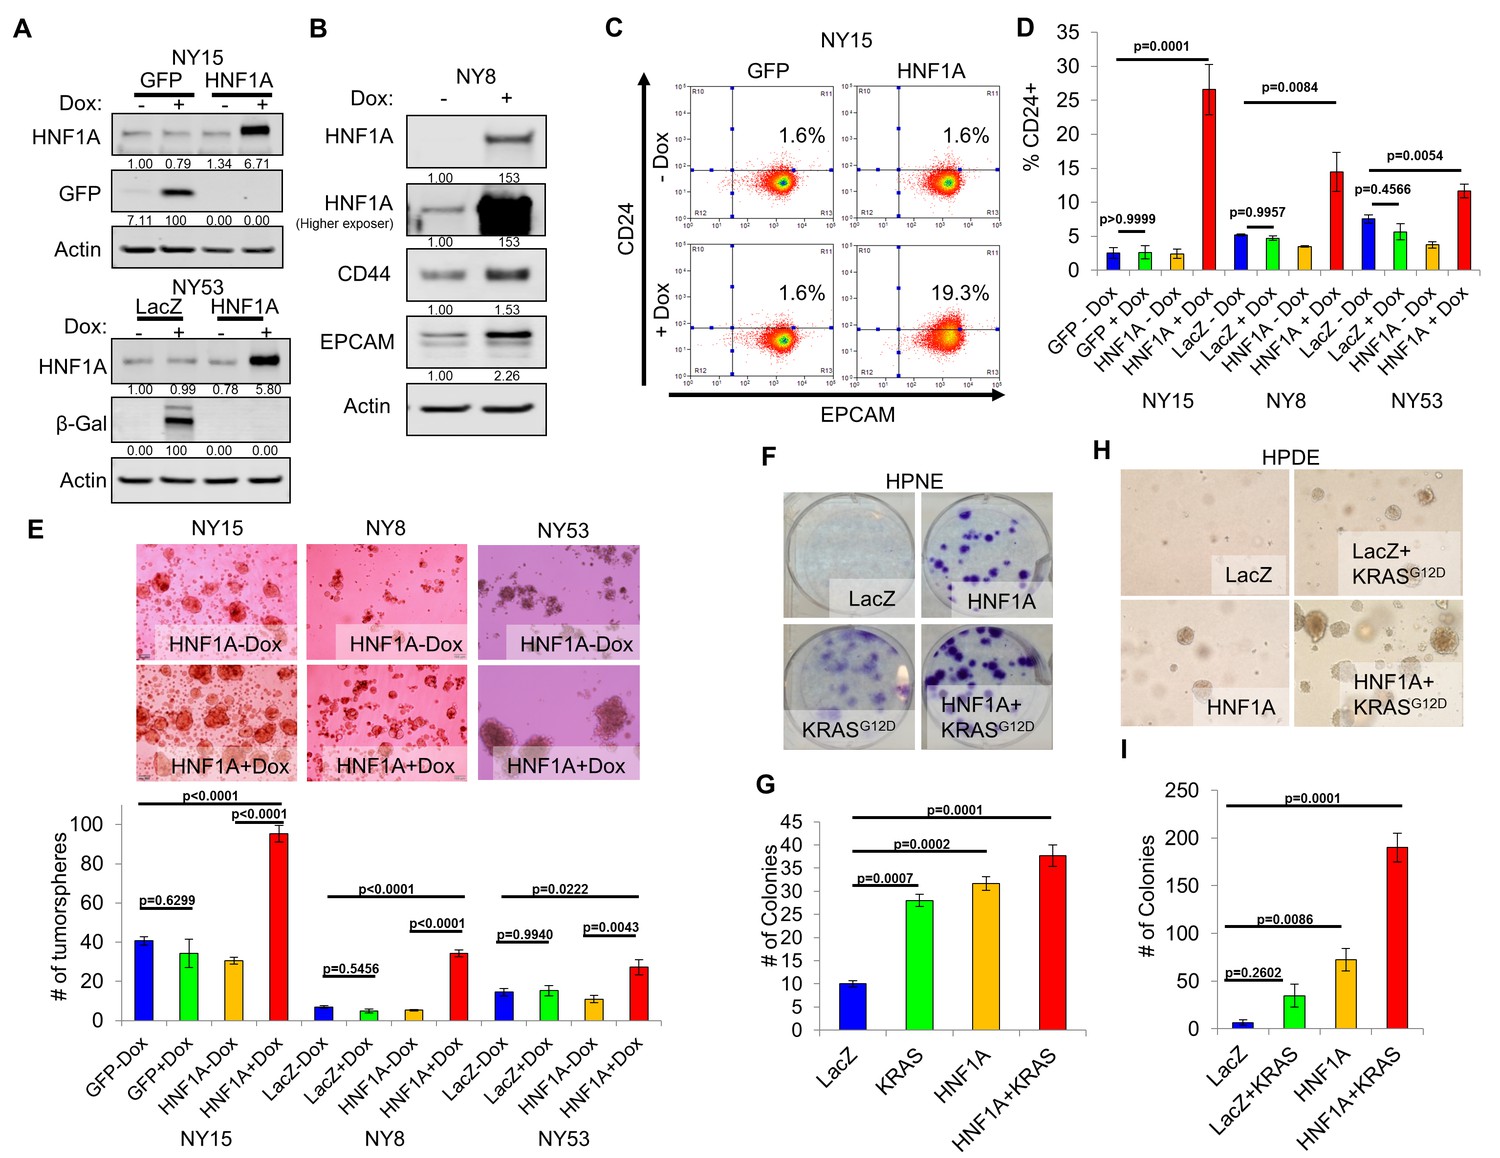
Overexpression of HNF1A promotes CSC properties in PDA cells and normal pancreatic cell lines.
(A) NY15 and NY53 cells Western blotted for HNF1A and control gene induction following 48 hr ± doxycycline (Dox). Quantitation of proteins is indicated below the respective blots. (B) NY8 cells were treated 48 hr ± Dox to induce ectopic HNF1A. Lysates were western blotted for HNF1A, Actin, and PCSC markers EPCAM and CD44. Quantitation of proteins is indicated below the respective blots. (C) Representative surface expression of CD24 and EPCAM on NY15 cells expressing GFP or HNF1A. (D) Quantitation of CD24 +NY15 GFP and HNF1A cells and NY8 and NY53 LacZ and HNF1A cells by flow cytometry (n = 3). Statistical difference was determined by one-way ANOVA with Tukey’s multiple comparisons test. (E) NY15 GFP and HNF1A, NY8 and NY53 LacZ and HNF1A cells were grown under sphere-forming conditions ± Dox. The number of tumorspheres formed after 7 days were quantitated (n = 4). Statistical difference was determined by one-way ANOVA with Tukey’s multiple comparisons test. Representative images (100X magnification) of spheres are shown in the upper panels. (F, G) HPNE LacZ and HNF1A cells were plated at 200 cells/6 cm dish and treated ±Dox for 2 weeks, fixed, and stained with crystal violet (F). (G) Resultant colonies were quantitated (n = 3). Statistical difference was determined by one-way ANOVA with Dunnett’s multiple comparisons test. (H, I) HPDE cells expressing inducible LacZ, LacZ with KRASG12D, HNF1A, or HNF1A with KRASG12D were embedded in soft agar + Dox and monitored for signs of anchorage-independent growth for 21 days. (H) Representative images of resultant colonies (100X magnification) and (I) quantitation of colonies after 21 days (n = 3). Statistical difference was determined by one-way ANOVA with Dunnett’s multiple comparisons test. Related data can be found in Figure 4—figure supplement 1.
-
Figure 4—source data 1
Quantitation of CD24 expression and tumorsphere formation in PDA cells with HNF1A overexpression, and quantitation of colony formation in HPNE and HPDE cells expressing HNF1A and oncogenic KRAS.
- https://doi.org/10.7554/eLife.33947.017
-
Figure 4—source data 2
Quantitation of CD44+/CD24+ HPDE and HPNE cells overexpressing HNF1A.
- https://doi.org/10.7554/eLife.33947.018
Figure 4—figure supplement 1
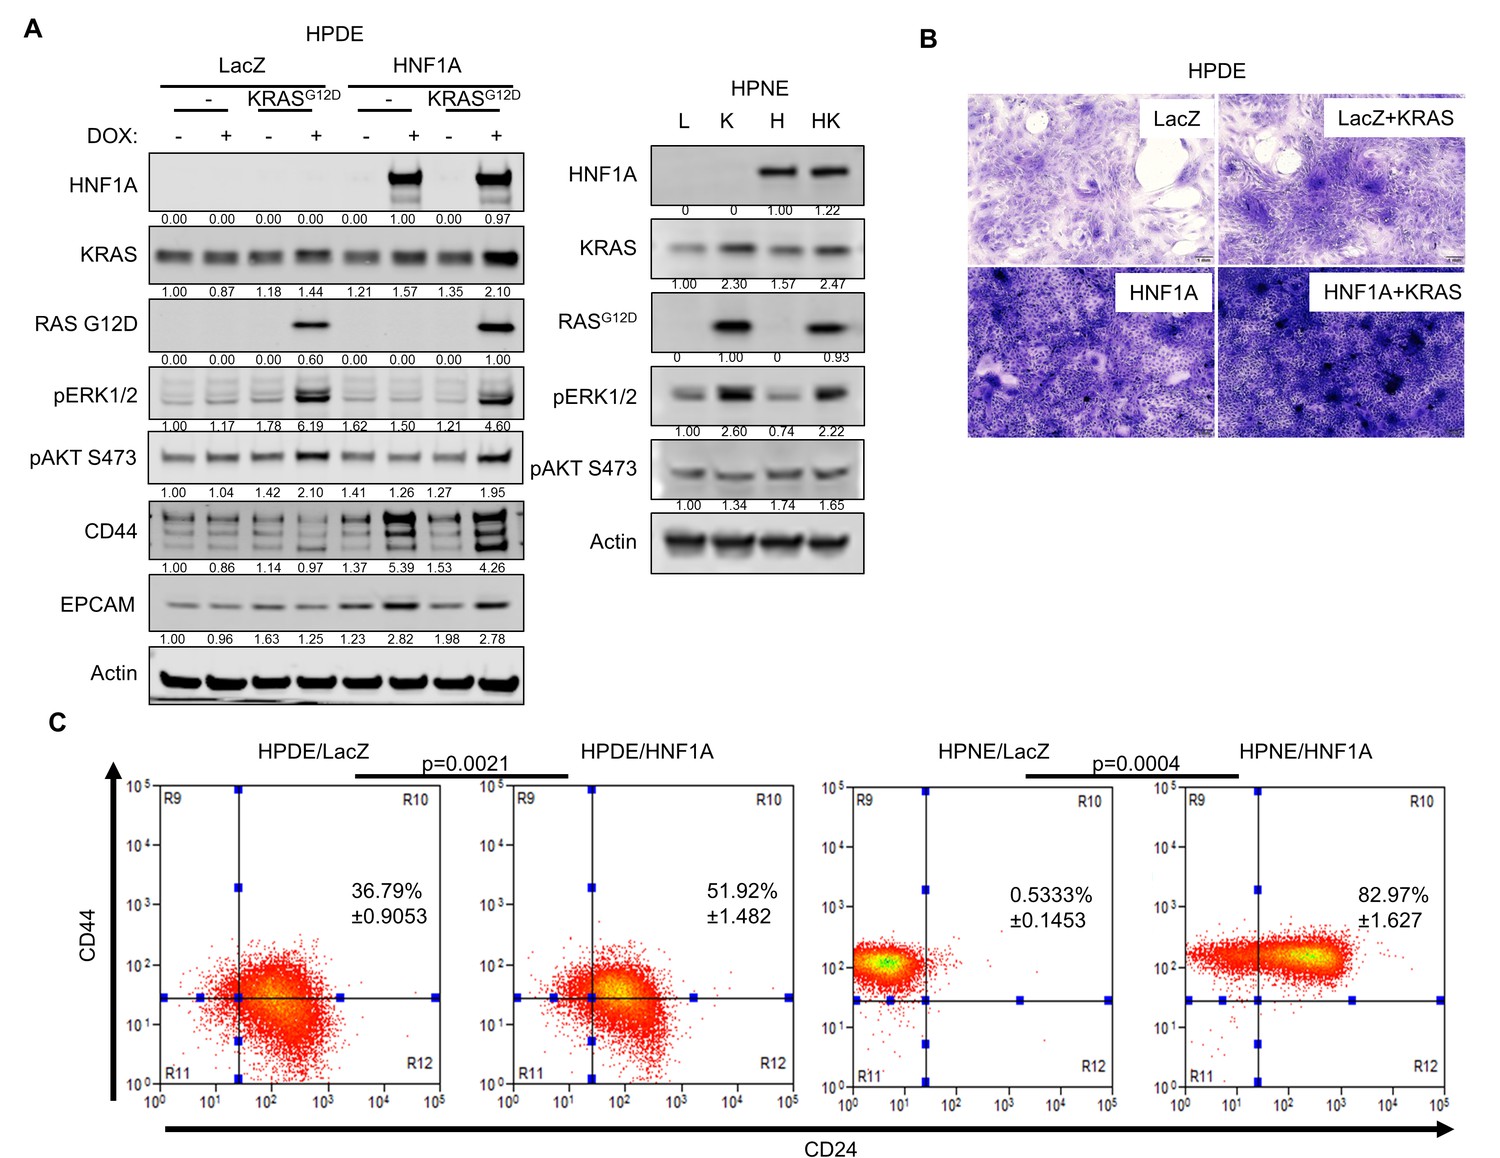
Overexpression of HNF1A and mutant KRAS in HPDE and HPNE cell.
(A) HPDE and HPNE cells expressing LacZ (L), KRASG12D (K), HNF1A (H), or HNF1A with KRASG12D (HK) were analyzed by western blot to confirm transgene expression and activation of downstream signaling events. Quantitation of proteins is indicated below the respective blots. For doxycycline-inducible HPDE cells, cells were treated ± doxycycline (Dox) (100 ng/ml) for 7 days prior to analysis. (B) HPDE cells expressing inducible LacZ, HNF1A, LacZ with KRASG12D, or HNF1A with KRASG12D were grown to super-confluency (2 weeks) in the presence of 10% FBS + Dox to test for changes in contact-inhibition. Cells were fixed and stained with crystal violet. Representative images (100X magnification) are shown. (C) Flow cytometry analysis of CD44 and CD24 surface expression on HPDE cells expressing LacZ or HNF1A for 7 days or HPNE cells expressing LacZ or HNF1A. The percentage of CD44+/CD24+ cells is indicated as a mean ± SEM (n = 3). Statistical difference between adherent and sphere cells was determined by unpaired t test with Welch's correction, and respective p values are indicated.
Figure 5 with 1 supplement
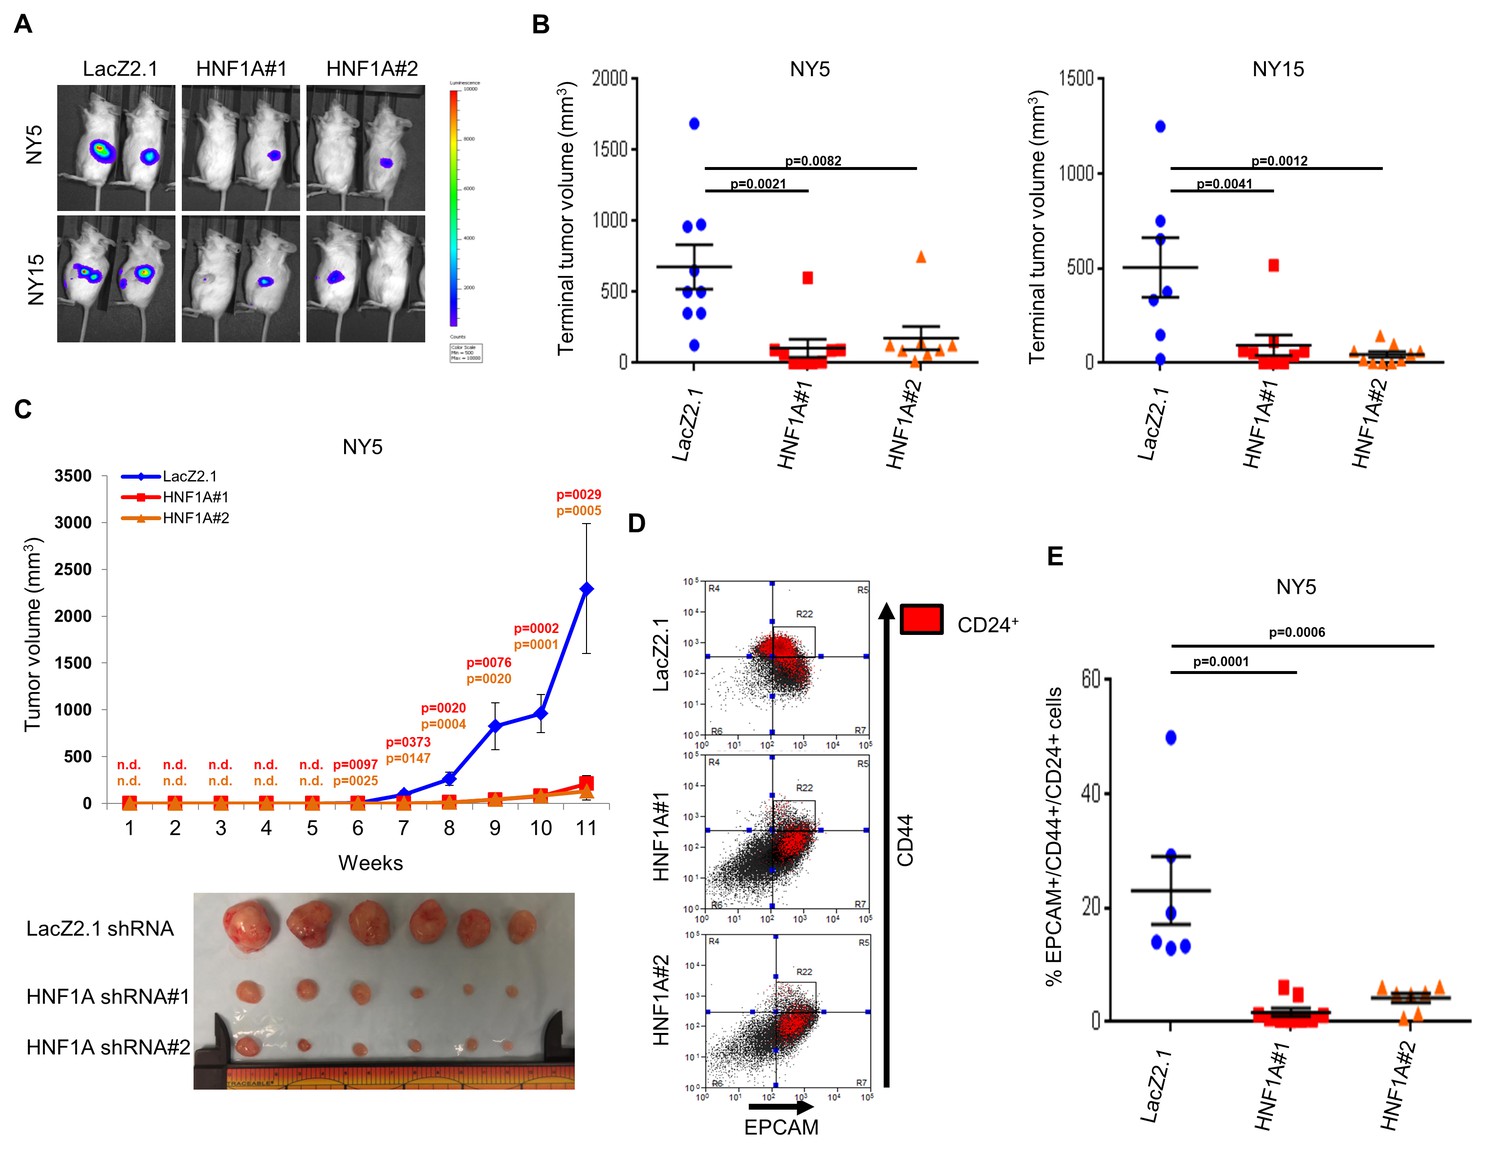
Knockdown of HNF1A impairs tumor growth and depletes CSCs in vivo.
(A, B) 10,000 firefly luciferase-labeled NY5 and NY15 cells expressing control or HNF1A shRNAs were implanted orthotopically into the pancreata of NOD/SCID mice and monitored by IVIS imaging for 6 weeks (10 mice per group). Representative luminescence image of tumors prior to sacrifice is shown (A). Final tumor volumes determined during necropsy are quantitated in (B). Statistical difference was determined by one-way ANOVA with Dunnett’s multiple comparisons test. (C) 103 control or HNF1A-depleted NY5 cells were implanted subcutaneously in NOD/SCID mice (10 mice per shRNA/bilateral injections) for 11 weeks. Tumors were measured by caliper to determine tumor growth (C, upper panel). Statistical difference was determined by one-way ANOVA with Dunnett’s multiple comparisons test. Red and orange p values indicate LacZ2.1 vs. HNF1A#1 or #2, respectively. ‘n.d.’ indicates that tumors were not detected. Representative tumors excised at sacrifice are shown (C, lower panel). (D, E) NY5 tumors from (A) were dissociated and stained for EPCAM, CD44, and CD24. Representative flow cytometry plots for recovered tumor cells are shown in (D), where the R22 gate denotes EPCAMHigh/CD44High cells, and CD24 +cells are donated in red. Quantitation of EPCAM+/CD44+/CD24 +cells is shown in (E), n = 6 tumors each for shRNA. Statistical difference was determined by one-way ANOVA with Dunnett’s multiple comparisons test. Related data can be found in Figure 5—figure supplement 1.
-
Figure 5—source data 1
Quantitation of orthotopic and subcutaneous xenograft tumor volumes, and quantitation of PCSCs following HNF1A knockdown.
- https://doi.org/10.7554/eLife.33947.021
-
Figure 5—source data 2
Quantitation of subcutaneous xenograft tumor volumes following HNF1A knockdown.
- https://doi.org/10.7554/eLife.33947.022
Figure 5—figure supplement 1
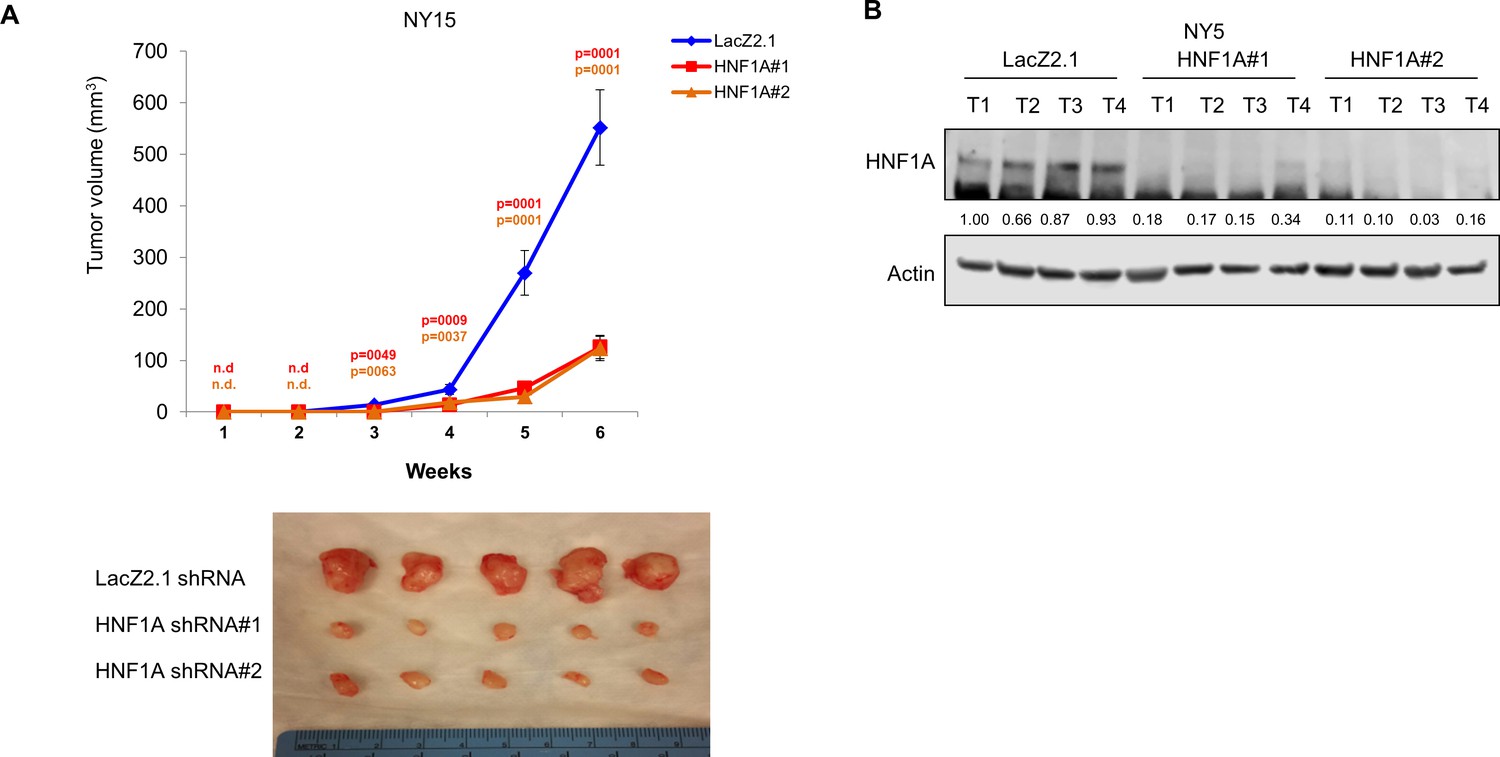
Effects of HNF1A depletion on PDA xenograft biology.
(A) 103 control or HNF1A-depleted NY15 cells were implanted subcutaneously in NOD/SCID mice (10 mice per shRNA/bilateral injections) for 6 weeks. Tumors were measured by caliper to determine tumor growth. Statistical difference was determined by one-way ANOVA with Dunnett’s multiple comparisons test. Red and green p values indicate LacZ2.1 vs. HNF1A#1 or #2, respectively. ‘n.d.’ indicates that tumors were not detected. Representative tumors are shown (lower panel). (B) Western blot analysis of HNF1A and Actin from NY5 tumors expressing LacZ2.1 or HNF1A shRNAs (four tumors per group) demonstrating persistent knockdown in vivo. Quantitation of HNF1A is indicated below the blot.
Figure 6 with 2 supplements
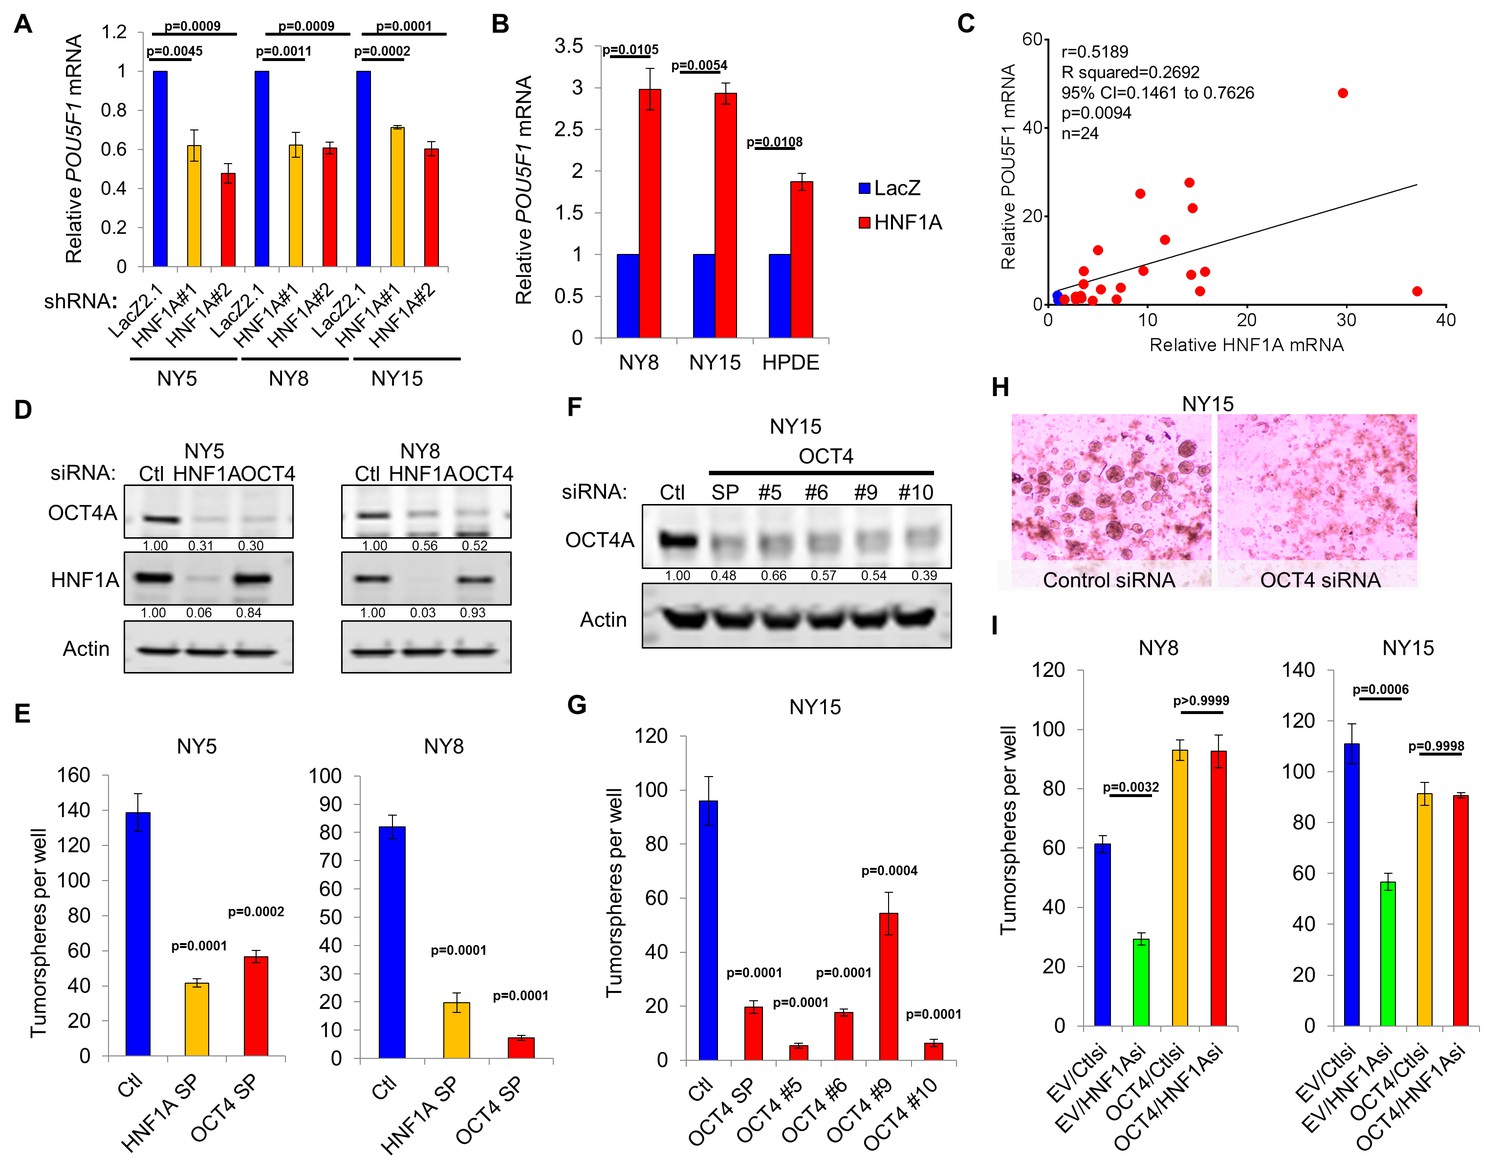
HNF1A regulates stemness through POU5F1/OCT4 regulation.
(A) qRT-PCR analysis of POU5F1/OCT4 mRNA in NY5, NY8 and NY15 cells expressing control (LacZ2.1) or HNF1A shRNAs. ACTB was used as an internal control, n = 3. Statistical difference was determined by one-way ANOVA with Dunnett’s multiple comparisons test. (B) LacZ or HNF1A was induced in NY8, NY15 or HPDE cells with doxycycline for 6 days. Levels of POU5F1/OCT4 mRNA were measured by qRT-PCR with ACTB as an internal control, n = 3. Statistical difference was determined by unpaired t test with Welch’s correction. (C) Pearson correlation coefficient of POU5F1/OCT4 and HNF1A mRNA levels from NY PDA cells (n = 22, red) relative to HPNE and HPDE (blue) cells. (D) Western blot of OCT4A and HNF1A protein in NY5 and NY8 cells transfected with POU5F1/OCT4 (labeled OCT4) or HNF1A SMARTpool siRNA for 3 days. Quantitation of proteins is indicated below the respective blots. (E) NY5 and NY8 cells were transfected with HNF1A or POU5F1/OCT4 SMARTpool siRNA for 3 days and then grown in tumorsphere media on non-adherent plates (1500 cells/well). Spheres were quantitated 7 days later, n = 3. Statistical difference was determined by one-way ANOVA with Dunnett’s multiple comparisons test. (F–H) NY15 cells were transfected with POU5F1/OCT4 SMARTpool (SP) siRNA or individual sequences for 3 days and either harvested to assess OCT4A knockdown by Western blot (F) or grown in tumorsphere media on non-adherent plates (1500 cells/well) (G). Spheres were quantitated 7 days later, n = 3. Statistical difference was determined by one-way ANOVA with Dunnett’s multiple comparisons test. Representative spheres are shown in (H). (I) NY8 and NY15 cells transduced with OCT4A (labeled OCT4) or empty vector control (EV) were transiently transfected with control (Ctl) or HNF1A-targeting siRNA for 72 hr, and then grown in tumorsphere media on non-adherent plates (1500 cells/well). Spheres were quantitated 7 days later, n = 3. Statistical difference was determined by one-way ANOVA with Tukey’s multiple comparisons test. Related data can be found in Figure 6—figure supplements 1 and 2.
-
Figure 6—source data 1
Quantitation of OCT4/POU5F1 mRNA following HNF1A knockdown and overexpression; relative HNF1A and OCT4/POU5F1 mRNA expressions in PDA cells; quantitation of tumorspheres following OCT4/POU5F1 knockdown; and quantitation of tumorsphere formation following OCT4A rescue.
- https://doi.org/10.7554/eLife.33947.026
-
Figure 6—source data 2
Quantitation of ChIP, CLuc activity, annexin V staining, PI staining, and tumorsphere formation.
- https://doi.org/10.7554/eLife.33947.027
Figure 6—figure supplement 1
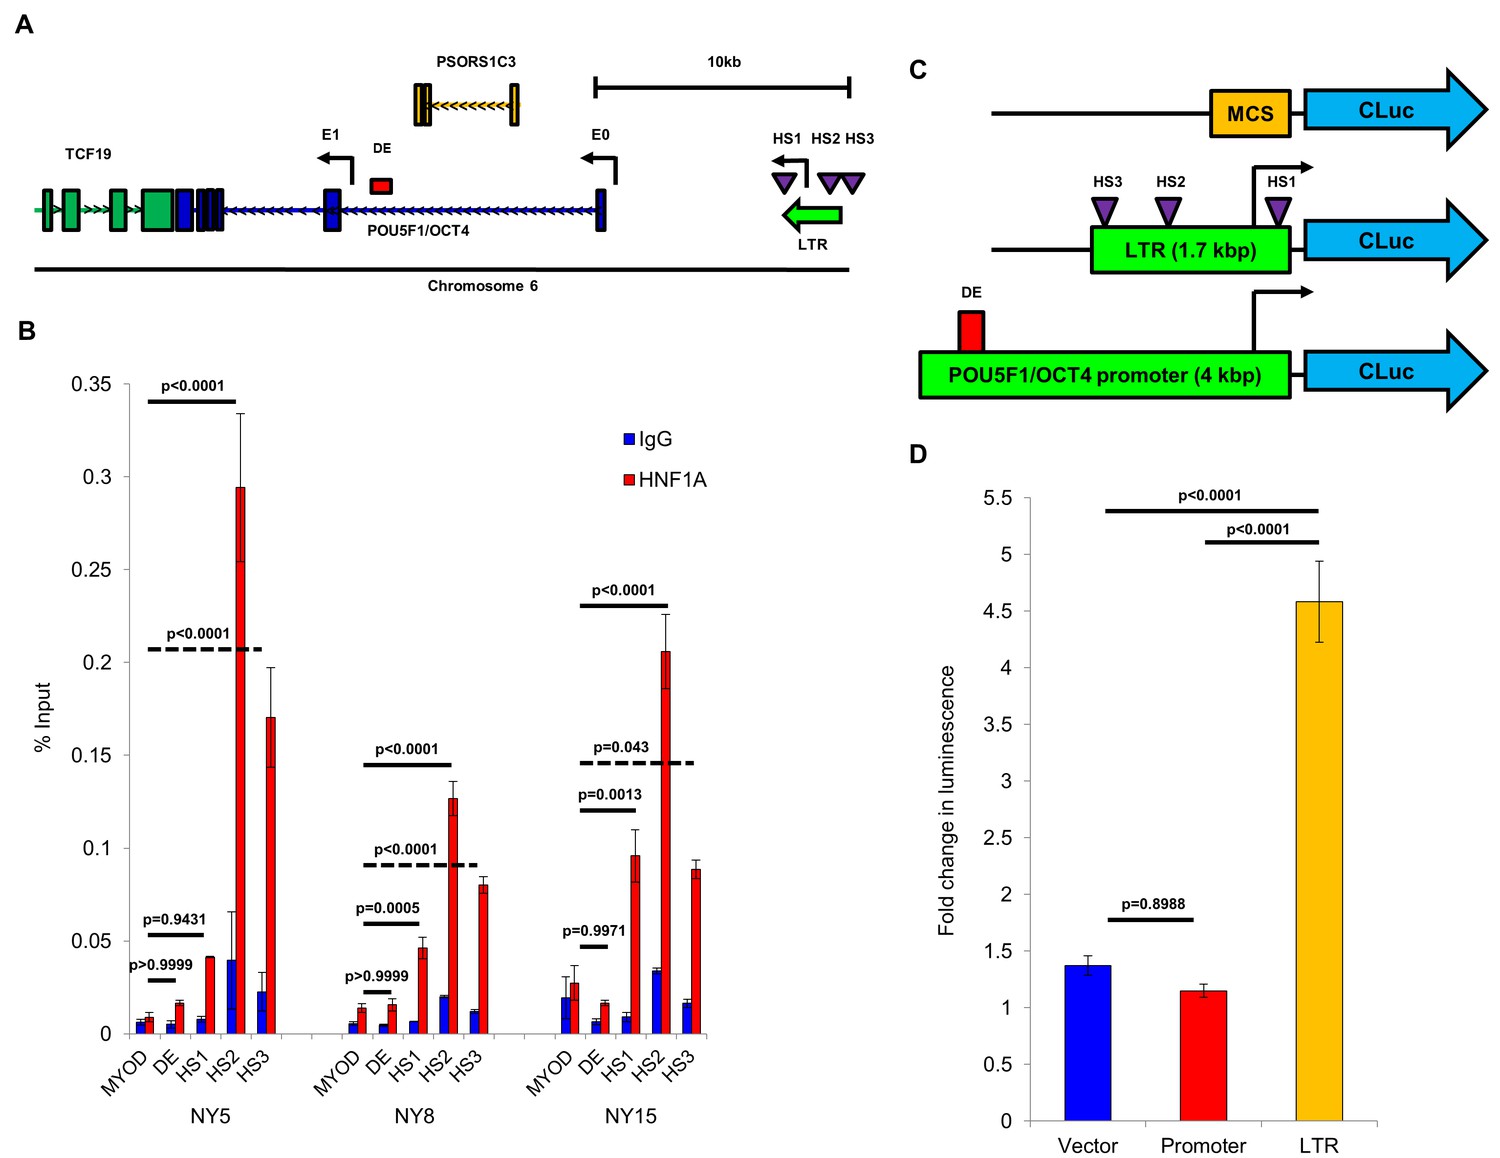
HNF1A binds directly to and activates transcription from the POU5F1/OCT4 upstream LTR region.
(A) Schematic representation of the POU5F1/OCT4 locus, including the canonical exon 1 (E1), distal enhancer region (DE), and the cryptic exon E0 and upstream LTR regions reported in Malakootian et al. (2017). Putative HNF1A half-sites (HS) are indicated by purple triangles. (B) Chromatin immunoprecipitation (ChIP) was performed in NY5, NY8, and NY15 cells using and HNF1A-specific antibody or normal IgG control. Enrichment of the MYOD promoter (negative control), the POU5F1/OCT4 distal enhancer (DE), or the three HNF1A half-sites (HS1-3) was measured by quantitative PCR and normalized to a 2% input control. Statistical difference was determined by one-way ANOVA with Tukey’s multiple comparisons test, and comparisons to enrichment of MYOD by HNF1A are shown. (C) Schematic representation of Cypridina luciferase (CLuc) reporter constructs, including the cloning vector, a reporter containing the LTR from Malakootian et al. (2017) expanded to include the third HNF1A half-site, and a containing the fulllenght canonical POU5F1/OCT4 promoter region. Relative positions of HNF1A half-sites (HS) and the distal enhancer (DE) are indicated. (D) 293FT cells were transfected with 0.5 µg of either the CLuc cloning vector, LTR reporter, or canonical promoter reporter in combination with 0.5 µg of either LacZ or HNF1A expression plasmid and 0.05 µg of a HSV-TK promoter-driven Gaussia-Dura luciferase (GDLuc) expression plasmid for normalization. After 48 hr, conditioned media was collected and secreted CLuc and GDLuc activity was measured. Fold change in CLuc luminescence from HNF1A-transfected cells relative to LacZ-transfected cells is shown (mean ± SEM, n = 3). Statistical difference was determined by one-way ANOVA with Tukey’s multiple comparisons test.
Figure 6—figure supplement 2
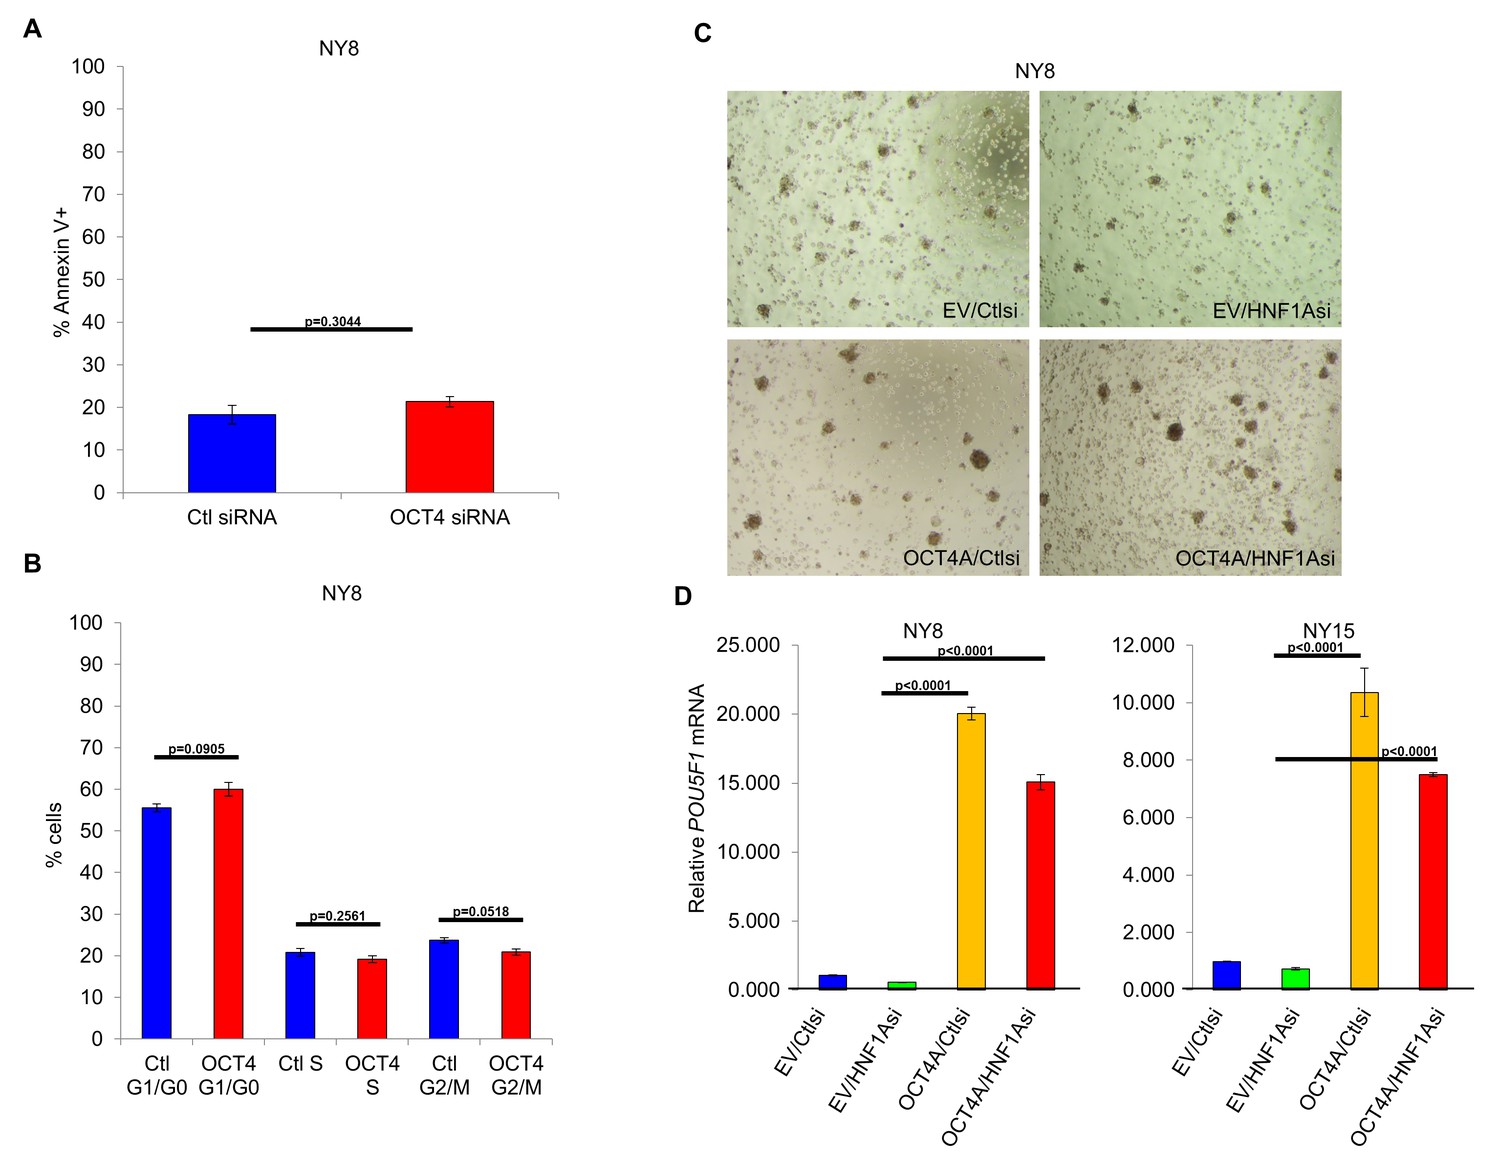
Rescue of POU5F1/OCT4 expression in PDA cells.
(A, B) NY8 cells were transiently transfected with control (Ctl) or POU5F1/OCT4-targeting (labeled OCT4) siRNA for 72 hr, followed by (A) annexin V/DAPI-staining or (B) propidium iodide (PI) staining to quantitate apoptotic and cycling cells, respectively. Data is represented as the mean for each group ± SEM, (n = 3). Statistical difference between adherent and sphere cells was determined by unpaired t test with Welch's correction, and respective p values are indicated. (C) NY8 cells transduced with OCT4A or empty vector control (EV) were transiently transfected with control (Ctl) or HNF1A-targeting siRNA for 72 hr, and then grown in tumorsphere media on non-adherent plates (1500 cells/well). Representative images of tumorspheres are shown. (D) Quantitative RT-PCR for POU5F1/OCT4 transcript was measured in NY8 and NY15 empty vector (EV) or OCT4A-transduced cells transfected with control or HNF1A siRNA for 72 hr. ACTB transcript was used as an internal control, n = 3. Statistical difference was determined by one-way ANOVA with Tukey’s multiple comparisons test.
Figure 7 with 1 supplement
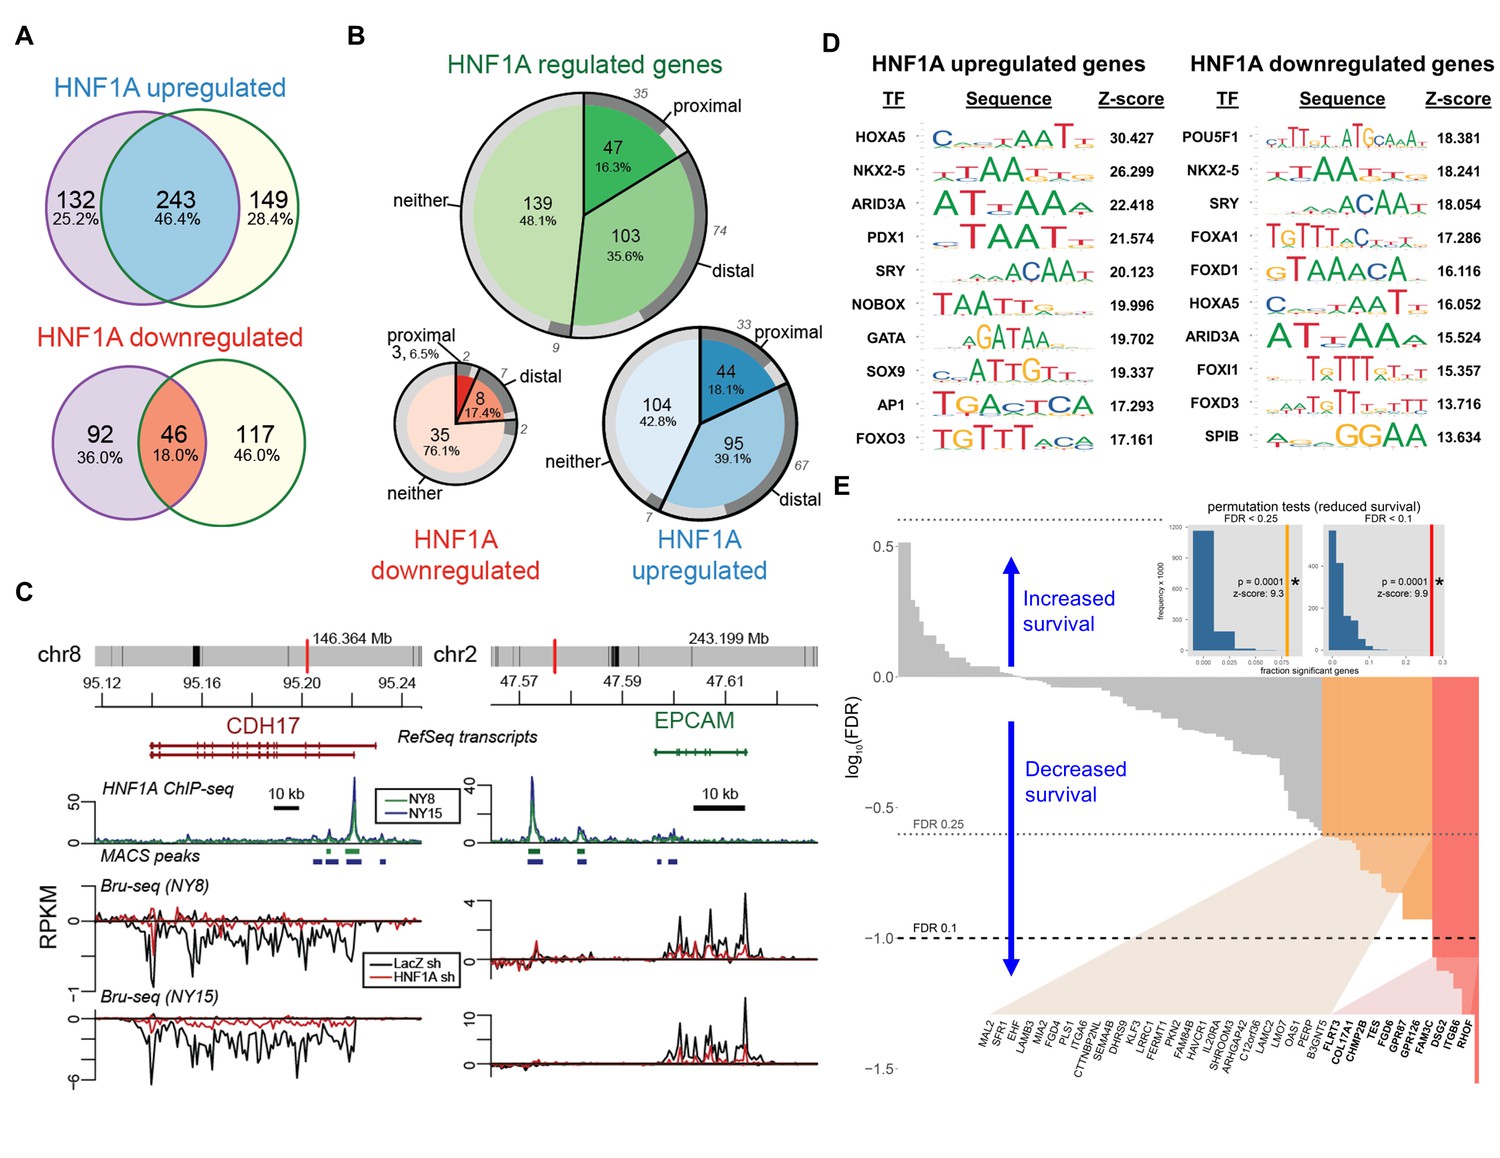
HNF1A regulates a transcriptional program associated with poor survival in PDA.
(A) Venn diagrams illustrating overlapping genes with altered transcription (Bru-seq) following HNF1A knockdown in NY8 and NY15 cells. ‘HNF1A upregulated’ genes denote genes that were downregulated by HNF1A shRNAs, while ‘HNF1A downregulated’ genes were upregulated by HNF1A shRNAs. Cells expressed shRNAs constitutively for >14 days prior to Bru-seq analysis. (B) Proportion of HNF1A shRNA-downregulated genes identified in both NY8 and NY15 with HNF1A ChIP-seq peaks. Proximal peaks are ±5 kbp of the transcription start site (TSS) of a given gene and distal peaks are ±100 kbp of a TSS. Peaks are recognized only if they are closer to the TSS of a given gene than to other expressed genes. Peaks overlapping putative enhancer regions (ENCODE) are indicated in dark grey. (C) HNF1A ChIP-seq and HNF1A shRNA Bru-seq traces for the genes CDH17 and EPCAM in NY8 and NY15 cells. Traces represent normalized read coverage (in RPKM) across the indicated genomic ranges. MACS-identified ChIP peaks are represented by bars under the corresponding trace. (D) Transcription factor (TF) motif over-representation analysis of HNF1A upregulated and downregulated genes (±5 kbp of TSS). The top 10 over-represented TF motifs, ranked by z-score, are listed. (E) HNF1A upregulated and bound genes were ranked according to model significance and the direction of survival association using TCGA PDA patient data. Magnitude indicates significance (log10-transformed FDR-adjusted Wald p values for Cox PH models) and sign represents survival direction (determined by hazard ratio). Red bars indicate FDR < 0.1, orange bars indicate FDR < 0.25, and gray bars are not significant. The FDR thresholds are also indicated by dotted horizontal lines. Insets: each histogram represents the null distribution of a permutation test (N = 10,000) for fraction of genes significantly associated with reduced survival (the tests use FDR thresholds of 0.1 or 0.25, as indicated). Vertical lines represent values for the set of HNF1A target genes; red: FDR < 0.1 test; orange: FDR < 0.25 test. * - indicates significant p value estimates for the permutation tests. Related data found in Figure 7—figure supplement 1.
Figure 7—figure supplement 1
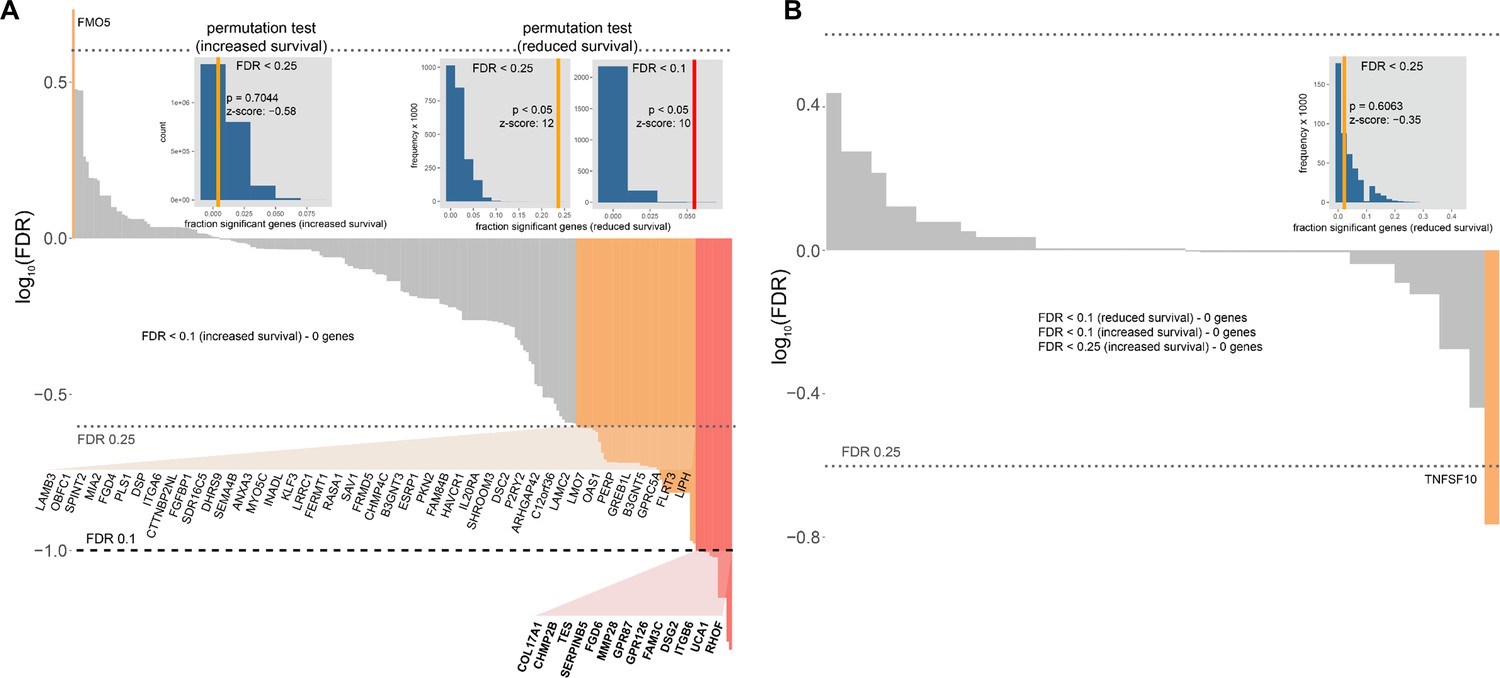
Association of HNF1A-responsive genes and survival in PDA.
(A, B) HNF1A-responsive genes were ranked according FDR-adjusted Wald p value and the direction of survival association using TCGA PDA patient data for (A) upregulated genes (including bound and unbound) and (B) downregulated genes. Each bar represents the Cox proportional hazards model for one gene; its magnitude indicates significance (log10-transformed adjusted p values), and its sign represents the hazard ratio (a negative value means that HR >1 and hence reduced survival). Red bars indicate FDR < 0.1, orange bars indicate FDR < 0.25, and gray bars are not significant. The FDR thresholds are also indicated by dotted horizontal lines. Permutation test insets: the histograms represent the null distribution for fraction of genes significantly associated with either increased or reduced survival and at FDR < 0.1 or FDR < 0.25 (as indicated). Vertical lines represent the value for the set of HNF1A upregulated or downregulated genes, respectively; red for the FDR < 0.1 test, orange for the FDR < 0.25 test). * - indicates significant p values for the permutation tests. N = 10,000 for all permutations and the estimated error of p at α = 0.05 is ±0.0034.
Author response image 1
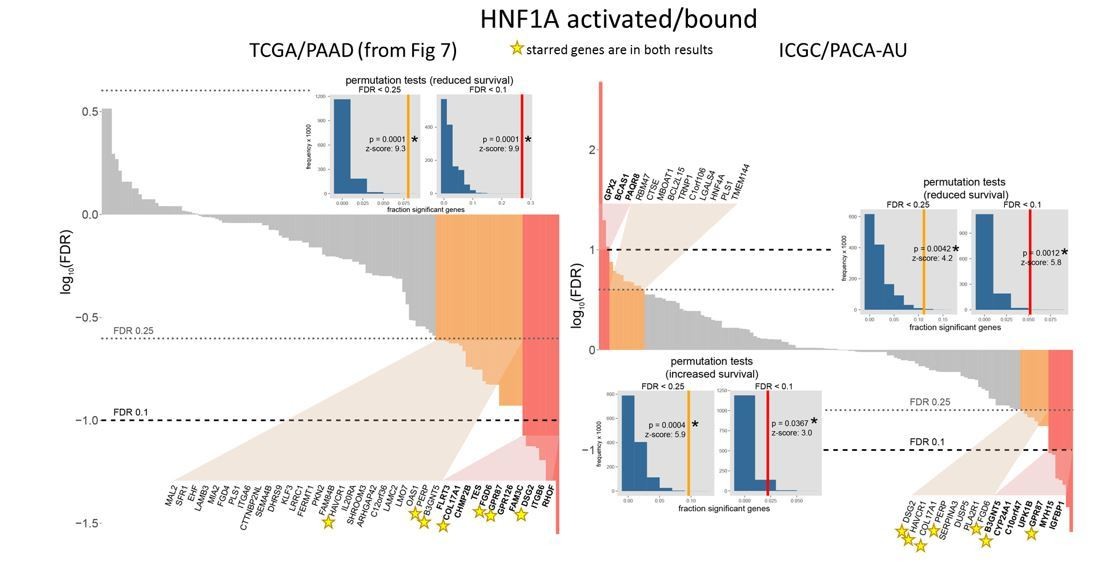
Comparison of TCGA and ICGC survival analyses.
https://doi.org/10.7554/eLife.33947.034
Author response image 2
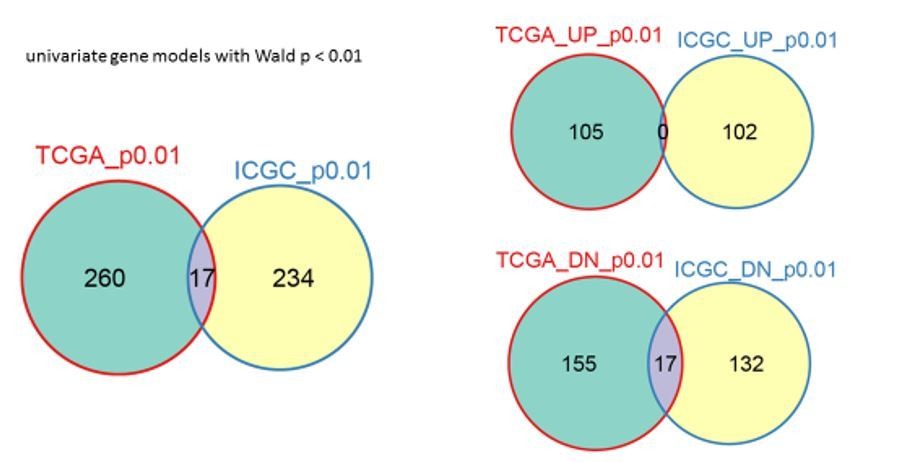
Comparison of TCGA and ICGC background gene concordance.
Overlap of all genes is on the left, “UP” refers to increased survival genes, “DN” to reduced survival genes.
Author response image 3
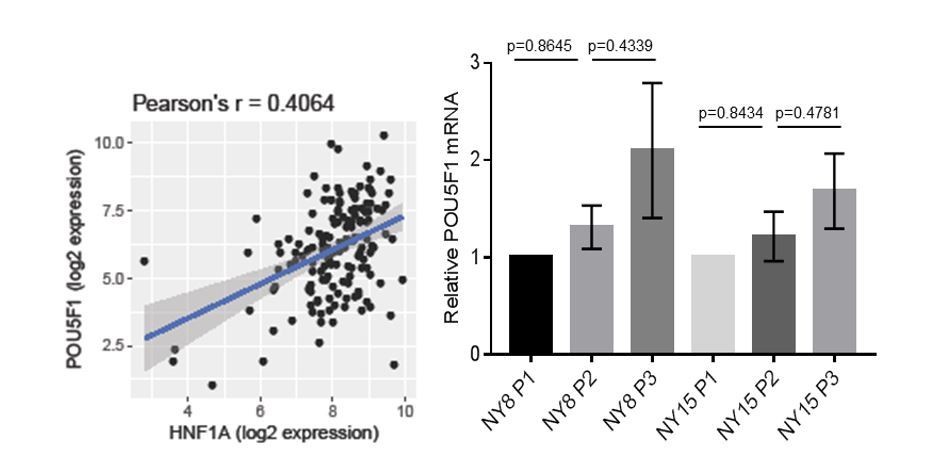
Correlation of HNF1A and POU5F1 expression.
https://doi.org/10.7554/eLife.33947.036Tables
Key resources table
| Reagent type (species) or resource | Designation | Source or reference | Identifiers | Additional information |
|---|---|---|---|---|
| Gene (Human) | HNF1A | This paper | Cloned from NY5 cDNA | |
| Gene (Escherichia coli) | LacZ | Invitrogen | Originally from Catalog number: K499000 | Subcloned into pLentipuro3/TO/V5-DEST |
| Gene (Aequorea victoria) | PatGFP | This paper | Variant of EGFP containing the following mutations: S31R, Y40N, S73A, F100S, N106T, Y146F, N150K, M154T, V164A, I168T, I172V, A207V | |
| Gene (Human) | KRAS G12D | This paper | Cloned from NY5 cDNA | |
| Gene (Human) | POU5F1 (OCT4A) | Transomic Technologies | Catalog number: BC117435 | Subcloned into pLenti6.3 /UbC/V5-DEST |
| Gene (Escherichia coli) | LacZ2.1 shRNA | This paper | Sequence: CACCAAATCGCTGATTT GTGTAGTCGTTCAAGAGACGACT ACACAAATCAGCGA | |
| Gene (Human) | HNF1A shRNA#1 | This paper | Sequence: CACCGCTAGTGGAGGA GTGCAATTTCAAGAGAATTGCACTC CTCCACTAGC | |
| Gene (Human) | HNF1A shRNA#2 | This paper | Sequence: CACCGTCCCTTAGTGA CAGTGTCTATTCAAGAGATAGA CACTGTCACTAAGGGAC | |
| Gene (Escherichia coli) | IVS-TetR-P2A-Bsd | This paper | IVS-TetR and Bsd were subcloned from pLenti6/TR (Invitrogen) with a P2A peptide linker added by PCR and Gibson Assembly | |
| Gene (Aequorea victoria) | PatGFP-Luc2 | This paper | PatGFP and Luc2 (Promega) were amplified by PCR and fused by Gibson Assembly | |
| Strain, strain background (Mouse) | NOD.CB17-Prkdcscid/J | The Jackson Laboratory | Catalog number: 001303; RRID: IMSR_JAX:001303 | |
| Cell line (Human) | HPDE | Craig Logsdon, MD Anderson | ||
| Cell line (Human) | HPNE | ATCC | Catalog number: ATCC CRL-4023; RRID:CVCL_C466 | |
| Cell line (Human) | Capan-2 | ATCC | Catalog number: ATCC HTB-80; RRID:CVCL_0026 | |
| Cell line (Human) | HPAF-II | ATCC | Catalog number: ATCC CRL-1997; RRID:CVCL_0313 | |
| Cell line (Human) | BxPC-3 | ATCC | Catalog number: ATCC CRL-1687; RRID:CVCL_0186 | |
| Cell line (Human) | AsPC-1 | ATCC | Catalog number: ATCC CRL-1682; RRID:CVCL_0152 | |
| Cell line (Human) | MiaPaCa-2 | ATCC | Catalog number: ATCC CRL-1420; RRID:CVCL_0428 | |
| Cell line (Human) | Panc-1 | ATCC | Catalog number: ATCC CRL-1469; RRID:CVCL_0480 | |
| Cell line (Human) | NY1 | This paper | Low passage pancreatic adenocarcinoma patient primary cell line established from xenograft | |
| Cell line (Human) | NY2 | This paper | Low passage pancreatic adenocarcinoma patient primary cell line established from xenograft | |
| Cell line (Human) | NY3 | This paper | Low passage pancreatic adenocarcinoma patient primary cell line established from xenograft | |
| Cell line (Human) | NY5 | This paper | Low passage pancreatic adenocarcinoma patient primary cell line established from xenograft | |
| Cell line (Human) | NY6 | This paper | Low passage pancreatic adenocarcinoma patient primary cell line established from xenograft | |
| Cell line (Human) | NY8 | This paper | Low passage pancreatic adenocarcinoma patient primary cell line established from xenograft | |
| Cell line (Human) | NY9 | This paper | Low passage pancreatic adenocarcinoma patient primary cell line established from xenograft | |
| Cell line (Human) | NY12 | This paper | Low passage pancreatic adenocarcinoma patient primary cell line established from xenograft | |
| Cell line (Human) | NY15 | This paper | Low passage pancreatic adenocarcinoma patient primary cell line established from xenograft | |
| Cell line (Human) | NY16 | This paper | Low passage pancreatic adenocarcinoma patient primary cell line established from xenograft | |
| Cell line (Human) | NY17 | This paper | Low passage pancreatic adenocarcinoma patient primary cell line established from xenograft | |
| Cell line (Human) | NY19 | This paper | Low passage pancreatic adenocarcinoma patient primary cell line established from xenograft | |
| Cell line (Human) | NY28 | This paper | Low passage pancreatic adenocarcinoma patient primary cell line established from xenograft | |
| Cell line (Human) | NY32 | This paper | Low passage pancreatic adenocarcinoma patient primary cell line established from xenograft | |
| Cell line (Human) | NY53 | This paper | Low passage pancreatic adenocarcinoma patient primary cell line established from xenograft | |
| Cell line (Human) | 293FT | Invitrogen | Catalog number: R70007 | |
| Transfected construct (Gaussia) | pTK-GDLuc | This paper | The Gaussia coding region of pTK-Gluc (New England Biolabs) was replaced with the Gaussia Dura coding region (Millipore) | |
| Transfected construct (Cypridina) | pCLuc-Basic2 | New England Biolabs | Catalog number: N0317S | |
| Transfected construct (Cypridina) | pCLuc-Basic2/OCT4 LTR promoter | This paper | 1.7 kbp OCT4 LTR promoter region from NY5 was subcloned into pCLuc-Basic2 | |
| Transfected construct (Cypridina) | pCLuc-Basic2/OCT4 canonical promoter | This paper/Addgene | Originally from Catalog number: 38776 | OCT4 promoter from phOct4-EGFP (Addgene) was subcloned into pCLuc-Basic2 |
| Antibody | CD326 (EpCAM)-FITC | Miltenyi Biotec | Catalog number: 130-113-263; RRID:AB_2726064 | Application: flow cytometry |
| Antibody | BD Pharmingen APC Mouse Anti-Human CD44 | BD Biosciences | Catalog number: 559942; RRID:AB_398683 | Application: flow cytometry |
| Antibody | BD Pharmingen PE Mouse Anti-Human CD24 | BD Biosciences | Catalog number: 555428; RRID:AB_395822 | Application: flow cytometry |
| Antibody | H-2Kd/H-2Dd clone 34-1-2S | SouthernBiotech | Catalog number: 1911–08; RRID:AB_1085008 | Application: flow cytometry |
| Antibody | Anti-HNF1 antibody [GT4110] | Abcam | Catalog number: ab184194; RRID:AB_2538735 | Application: IHC, Western blot |
| Antibody | HNF-1 alpha Antibody (C-19) | Santa Cruz Biotechnology | Catalog number: sc-6547; RRID:AB_648295 | ChIP |
| Antibody | Normal Rabbit IgG | Cell Signaling Technology | Catalog number: 2729S; RRID:AB_1031062 | ChIP |
| Antibody | HNF1α (D7Z2Q) | Cell Signaling Technology | Catalog number: 89670S; RRID:AB_2728751 | Application: Western blot |
| Antibody | β-Actin (clone AC-74) | Sigma Aldrich | Catalog number: A2228-200UL; RRID:AB_476697 | Application: Western blot |
| Antibody | CDH17 antibody | Proteintech | Catalog number: 50-608-369; RRID:AB_2728752 | Application: Western blot |
| Antibody | DPP4/CD26 (D6D8K) | Cell Signaling Technology | Catalog number: 67138S; RRID:AB_2728750 | Application: Western blot |
| Antibody | CD44 (156–3 C11) | Cell Signaling Technology | Catalog number: 3570S; RRID:AB_10693293 | Application: Western blot |
| Antibody | EpCAM (D1B3) | Cell Signaling Technology | Catalog number: 2626S; RRID:AB_2728749 | Application: Western blot |
| Antibody | Cleaved Caspase-3 (Asp175) (5A1E) | Cell Signaling Technology | Catalog number: 9664S; RRID:AB_2070042 | Application: Western blot |
| Antibody | Cleaved Caspase-6 (Asp162) | Cell Signaling Technology | Catalog number: 9761S; RRID:AB_2290879 | Application: Western blot |
| Antibody | Cleaved Caspase-7 (Asp198) (D6H1) | Cell Signaling Technology | Catalog number: 8438S; R RID:AB_11178377 | Application: Western blot |
| Antibody | Cleaved Caspase-9 (Asp330) (D2D4) | Cell Signaling Technology | Catalog number: 7237S; RRID:AB_10895832 | Application: Western blot |
| Antibody | Cleaved Caspase-9 (Asp315) Antibody | Cell Signaling Technology | Catalog number: 9505S; RRID:AB_2290727 | Application: Western blot |
| Antibody | GFP (D5.1) XP | Cell Signaling Technology | Catalog number: 2956S; RRID:AB_1196615 | Application: Western blot |
| Antibody | Ras (G12D Mutant Specific) (D8H7) | Cell Signaling Technology | Catalog number: 14429S; RRID:AB_2728748 | Application: Western blot |
| Antibody | Phospho-p44/42 MAPK (Erk1/2) (Thr202/Tyr204) (D13.14.4E) XP | Cell Signaling Technology | Catalog number: 4370S; RRID:AB_2315112 | Application: Western blot |
| Antibody | Phospho-Akt (Ser473) (D9E) XP | Cell Signaling Technology | Catalog number: 4060S; RRID:AB_2315049 | Application: Western blot |
| Antibody | Oct-4A (C52G3) | Cell Signaling Technology | Catalog number: 2890S; RRID:AB_2167725 | Application: Western blot |
| Antibody | Anti-KRAS + HRAS + NRAS antibody | Abcam | Catalog number: ab55391; RRID:AB_941040 | Application: Western blot |
| Antibody | Anti-β-Galactosidase | Promega | Catalog number: Z3781; RRID:AB_430877 | Application: Western blot |
| Antibody | IRDye 800CW Goat anti-Mouse IgG | Licor | Catalog number: 926–32210; RRID:AB_621842 | Application: Western blot |
| Antibody | IRDye 800CW Goat anti-Rabbit | Licor | Catalog number: 926–32211; RRID:AB_621843 | Application: Western blot |
| Antibody | IRDye 680LT goat anti-mouse | Licor | Catalog number: 926–68020; RRID:AB_10706161 | Application: Western blot |
| Antibody | IRDye 680LT Goat anti-Rabbit IgG | Licor | Catalog number: 926–68021; RRID:AB_10706309 | Application: Western blot |
| Recombinant DNA reagent | pLentipuro3/TO/ V5-DEST | Andrew E. Aplin, Thomas Jefferson University | ||
| Recombinant DNA reagent | pLentineo3/TO/ V5-DEST | Andrew E. Aplin, Thomas Jefferson University | ||
| Recombinant DNA reagent | pLentihygro3/TO/ V5-DEST | Andrew E. Aplin, Thomas Jefferson University | ||
| Recombinant DNA reagent | pLenti0.3/EF/ V5-DEST | This paper | Human EF1-alpha promoter was substituted for the CMV promoter of pLenti6.3/UbC/V5-DEST and the SV40 promoter/Bsd cassette was removed | |
| Recombinant DNA reagent | pLenti6.3/UbC/ V5-DEST | Andrew E. Aplin, Thomas Jefferson University | ||
| Recombinant DNA reagent | pLenti6.3/UbC empty vector | This paper | EcoRV digest/re-ligation to remove Gateway element | |
| Recombinant DNA reagent | pLentipuro3/ Block-iT-DEST | Andrew E. Aplin, Thomas Jefferson University | ||
| Recombinant DNA reagent | pLenti0.3/EF/GW/IVS -Kozak-TetR-P2A-Bsd | This paper | LR recombination of IVS-TetR-P2A-Bsd cassette into pLenti0.3/EF/V5-DEST | |
| Recombinant DNA reagent | pLenti0.3/EF/GW/ PatGFP-Luc2 | This paper | LR recombination of PatGFP-Luc2 cassette into pLenti0.3/EF/V5-DEST | |
| Recombinant DNA reagent | pLP1 | Andrew E. Aplin, Thomas Jefferson University | Lentivirus packaging plasmid originally from Invitrogen | |
| Recombinant DNA reagent | pLP2 | Andrew E. Aplin, Thomas Jefferson University | Lentivirus packaging plasmid originally from Invitrogen | |
| Recombinant DNA reagent | pLP/VSVG | Andrew E. Aplin, Thomas Jefferson University | Lentivirus packaging plasmid originally from Invitrogen | |
| Sequence-based reagent | Non-targeting control siRNA | Dharmacon | Catalog number: D-001810-01-20 | |
| Sequence-based reagent | HNF1A siRNA #1 | Dharmacon | Catalog number: D-008215-01-0002 | Sequence: GGAGGAACCGTTTCAAGTG |
| Sequence-based reagent | HNF1A siRNA #2 | Dharmacon | Catalog number: D-008215-02-0002 | Sequence: GCAAAGAGGCACTGATCCA |
| Sequence-based reagent | POU5F1/OCT4 siRNA #5 | Dharmacon | Catalog number: D-019591-05-0002 | Sequence: CATCAAAGCTCTGCAGAAA |
| Sequence-based reagent | POU5F1/OCT4 siRNA #6 | Dharmacon | Catalog number: D-019591-06-0002 | Sequence: GATATACACAGGCCGATGT |
| Sequence-based reagent | POU5F1/OCT4 siRNA #9 | Dharmacon | Catalog number: D-019591-09-0002 | Sequence: GCGATCAAGCAGCGACTAT |
| Sequence-based reagent | POU5F1/OCT4 siRNA #10 | Dharmacon | Catalog number: D-019591-10-0002 | Sequence: TCCCATGCATTCAAACTGA |
| Peptide, recombinant protein | Recombinant human EGF | Invitrogen | Catalog number: PHG0311L | |
| Peptide, recombinant protein | FGF-basic Recombinant Human | Invitrogen | Catalog number: PHG0264 | |
| Peptide, recombinant protein | Leukemia Inhibitory Factor human | Sigma Aldrich | Catalog number: L5283 | |
| Peptide, recombinant protein | Bone Morphogenetic Protein four human | Peprotech | Catalog number: 120–05 | |
| Commercial assay or kit | SimpleChIP Enzymatic Chromatin IP Kit (Magnetic Beads) | Cell Signaling Technology | Catalog number: 9003 | |
| Commercial assay or kit | BioLux Gaussia Luciferase Assay Kit | New England Biolabs | Catalog number: E3300S | |
| Commercial assay or kit | BioLux Cypridina Luciferase Assay Kit | New England Biolabs | Catalog number: E3309S | |
| Commercial assay or kit | RNeasy Plus Mini Kit coupled with RNase-free DNase set | Qiagen | Catalog number: 74136 and 79254 | |
| Commercial assay or kit | High Capacity RNA-to-cDNA Master Mix | Applied Biosystem | Catalog number: 4387406 | |
| Commercial assay or kit | Power SYBR Green PCR Master Mix | Applied Biosystem | Catalog number: 4367659 | |
| Chemical compound, drug | APC-Cy7 Streptavidin | BD Biosciences | Catalog number: 554063 | |
| Chemical compound, drug | DAPI (4',6-Diamidino-2-Phenylindole, Dilactate) | Invitrogen | Catalog number: 3571 | |
| Chemical compound, drug | APC Annexin V | BD Biosciences | Catalog number: 550474 | |
| Chemical compound, drug | Annexin V Binding Buffer, 10x concentrate | BD Biosciences | Catalog number: 556454 | |
| Chemical compound, drug | RNase A | Invitrogen | Catalog number: 12091021 | |
| Chemical compound, drug | Lipofectamine 2000 Reagent | Invitrogen | Catalog number: 11668019 | |
| Chemical compound, drug | Lipofectamine RNAiMAX Reagent | Invitrogen | Catalog number: 13778150 | |
| Chemical compound, drug | Propidium iodide | Invitrogen | Catalog number: P1304MP | |
| Chemical compound, drug | Gentamicin | Invitrogen | Catalog number: 15710072 | |
| Chemical compound, drug | Antibiotic-Antimycotic (100X) | Invitrogen | Catalog number: 15240062 | |
| Chemical compound, drug | N-2 Supplement (100X) | Invitrogen | Catalog number: 17502–048 | |
| Chemical compound, drug | B-27 Serum-Free Supplement (50X) | Invitrogen | Catalog number: 17504–044 | |
| Chemical compound, drug | Doxycycline | Sigma Aldrich | D9891-100G | |
| Software, algorithm | GraphPad Prism 6 | GraphPad Software; http://www.graphpad.com | RRID:SCR_002798 | |
| Software, algorithm | oPOSSUM 3.0 | http://opossum.cisreg.ca/oPOSSUM3/; PMID: 22973536 | RRID:SCR_010884 | |
| Software, algorithm | Bowtie v1.1.1 | PMID: 19261174 | RRID:SCR_005476 | |
| Software, algorithm | Bowtie v0.12.8 | PMID: 19261174 | RRID:SCR_005476 | |
| Software, algorithm | MACS v1.4.2 | PMID: 18798982 | RRID:SCR_013291 | |
| Software, algorithm | TopHat v1.4.1 | PMID: 19289445 | RRID:SCR_013035 | |
| Software, algorithm | DESeq v1.24.0 | PMID: 20979621 | RRID:SCR_000154 | |
| Software, algorithm | bedtools v.2.26.0 | PMID: 20110278 | RRID:SCR_006646 | |
| Software, algorithm | survival v2.40–1 | DOI: 10.1007/978-1-4757-3294-8 |
Additional files
-
Supplementary file 1
Cancer stem cell frequencies in PDA subpopulations.
Limiting dilution assay was performed with sorted NY15 cells injected subcutaneously in NOD/SCID mice. The resultant numbers of tumors/injection is tabulated with estimated cancer stem cell frequencies calculated by extreme limiting dilution analysis (ELDA).
- https://doi.org/10.7554/eLife.33947.030
-
Supplementary file 2
Data for generating PDA subpopulation heatmap and HNF1A target gene data (Excel spreadsheet).
Contents of each worksheet are as follows: worksheet 1) notes for summary tables; worksheet 2) Primers for qPCR validation of CSC50 genes; worksheet 3) table includes values represented in the Figure 1E where values are fold changes relative to HL or LH, as indicated; worksheet 4) NY8 and NY15 Bru-seq data related to Figure 7A; worksheet 5) NY8 and NY15 ChIP-seq data related to Figure 7B with information regarding enhancer binding; worksheet 6) summary of selected genes in expression vs survival in TCGA PAAD tumors - related to Figure 7E, S9A, and S9B, worksheet 7) HNF1A-upregulated and -bound genes: association between gene expression and survival in TCGA PAAD tumors - related to Figure 7E; worksheet 8) HNF1A-upregulated genes: association between gene expression and survival in TCGA PAAD tumors - related to Figure 7—figure supplement 1A; worksheet 9) HNF1A-downregulated genes: association between gene expression and survival in TCGA PAAD tumors - related to Figure 7—figure supplement 1B; worksheet 10) TCGA donors used in survival analysis - related to Figure 7E, Figure 7—figure supplement 1A and B; worksheet 11) Overrepresented TF-binding motifs in cancer stem cell gene set (CSC50), oPOSSUM3 results - related to Figure 1; worksheet 12) predicted HNF1A targets - related to Figure 1; worksheet 13) overrepresented TF-binding motifs in HNF1A upregulated genes, oPOSSUM3 results - related to Figure 7D; worksheet 14) overrepresented TF-binding motifs in HNF1A downregulated genes, oPOSSUM3 results - related to Figure 7D; worksheet 15) predicted POU5F1 targets - related to Figure 7D; worksheet 16) HNF1A ChIP-seq peak enhancer overlap, NY15 replicate 1 (rep1) - related to Figure 7B; worksheet 17) A ChIP-seq peak enhancer overlap, NY15 replicate 2 (rep2) - related to Figure 7B; worksheet 18) HNF1A ChIP-seq peak enhancer overlap, NY8 replicate 1 (rep1) - related to Figure 7B; worksheet 19) HNF1A ChIP-seq peak enhancer overlap, NY8 replicate 2 (rep2) - related to Figure 7B.
- https://doi.org/10.7554/eLife.33947.031
-
Transparent reporting form
- https://doi.org/10.7554/eLife.33947.032
Download links
A two-part list of links to download the article, or parts of the article, in various formats.
Downloads (link to download the article as PDF)
Open citations (links to open the citations from this article in various online reference manager services)
Cite this article (links to download the citations from this article in formats compatible with various reference manager tools)
HNF1A is a novel oncogene that regulates human pancreatic cancer stem cell properties
eLife 7:e33947.
https://doi.org/10.7554/eLife.33947


