Transcriptional profiling reveals extraordinary diversity among skeletal muscle tissues
- Washington University School of Medicine, United States
- University of Florida College of Medicine, United States
- The Scripps Research Institute, United States
- University of Pennsylvania, United States
- University of Kentucky School of Medicine, United States
Figures
Figure 1 with 7 supplements

Transcriptome profiling reveals extensive gene expression differences among muscle tissues.
(A) The percent of all transcripts detected as being expressed in different classes of tissues is shown as a bar graph. >80% of all transcripts are detectably expressed in at least one skeletal muscle tissue. (B) The number of transcripts expressed (FPKM >1) in every cardiac, smooth, or skeletal muscle tissue is shown as a Venn diagram. A core of ~21,000 transcripts is expressed in every contractile tissue. Please note that panel A describes transcripts expressed in at least one tissue; panel B describes transcripts expressed in every tissue. (C) The percent of transcripts showing differential expression between tissues is shown at different false-discovery rate (q-value) thresholds. One-way ANOVAs of all tissues, all striated, all skeletal, all cardiac, and all smooth muscles were used to calculate q-values. Striated muscle refers to skeletal plus cardiac muscles. (D) The overall similarity of transcriptional profiles in different tissues is displayed as a dendrogram. Notably, the three major classes of muscle (smooth, cardiac, and skeletal) cluster together as expected. (E) The number of differentially expressed transcripts (q < 0.01, fold change >2) in pairwise comparisons is shown as a heat map. Red boxes indicate clustering by similarity of (1) cardiac muscle, (2) smooth muscle, and (3) two different clusters of skeletal muscle.
Figure 1—figure supplement 1
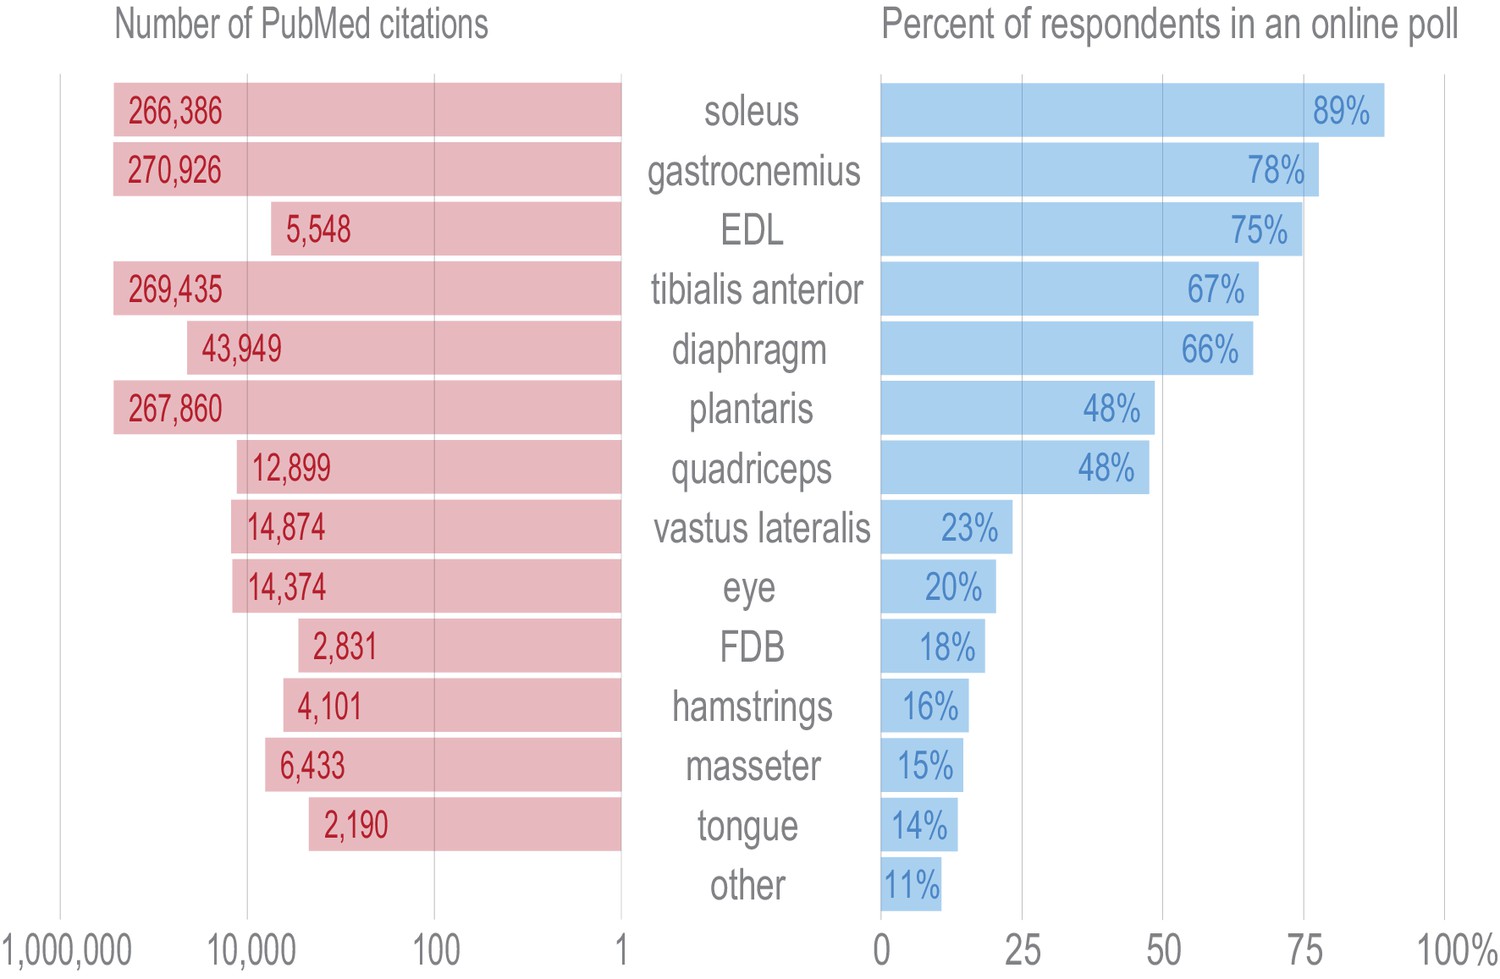
Tissues were selected for transcriptional profiling to maximize the utility of these data to the skeletal muscle field.
In order to ascertain which tissues are of the greatest general interest to the skeletal muscle researchers, we distributed an online poll asking respondents to vote whether any given tissue was of interest to their laboratory (right panel). Over one hundred responses from principal investigators, graduate students, and postdocs in the field were recorded. The choice of ‘other’ was ranked lower than any other tissue, and write-in responses showed no evidence of broad support for any tissues beyond those included here. Quadriceps were selected for profiling as they were favored in the poll over the more specific vastus lateralis by a ~ 2:1 ratio. Masseter and tongue were chosen for transcriptional profiling over hamstrings to increase the developmental and anatomical diversity of the tissues in this data set. In order to guard against selection bias for our online poll, we queried NCBI’s PubMed to identify the number of published papers on each muscle tissue (left panel). The overall distribution of PubMed citations mirrors the human poll.
Figure 1—figure supplement 2
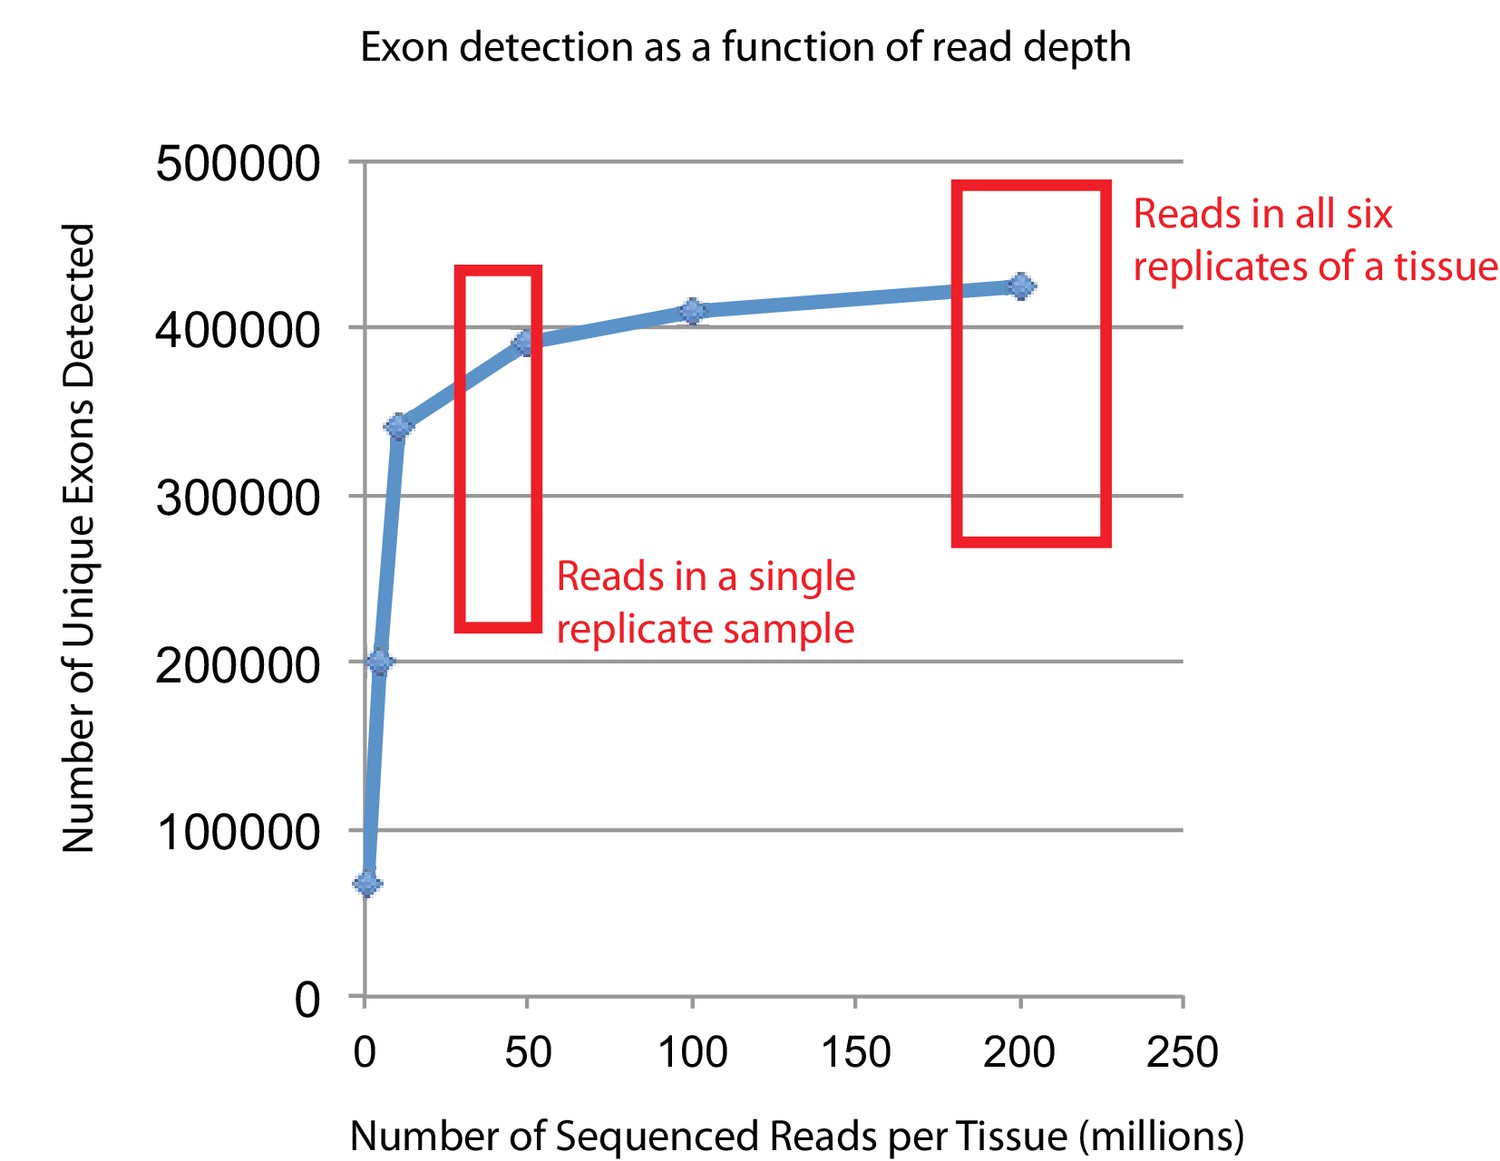
Empirical simulations show that the read depth of this study approaches saturation for detecting expressed exons.
In order to verify that the RNAseq read depth was sufficient to detect most expressed transcripts, one specific tissue (mouse FDB) was randomly down-sampled as previously described (Li et al., 2015) to generate six different sequencing depths (200, 100, 50, 10, 5, and 1 million reads). These reads were aligned to the mouse genome and transcriptome using RUM (Grant et al., 2011), and uniquely aligned reads were used to identify putatively expressed exons. The number of unique exons detected as expressed (FPKM >0) is plotted versus the total number of reads collected. The two red boxes indicate either the approximate number of reads for any given biological replicate or the approximate number of reads per tissue (summing all six replicates). Most single replicates have been sequenced to a depth that approaches diminishing returns for exon detection, while every tissue has been sequenced to a depth that guarantees that the vast majority of truly expressed exon are detected.
Figure 1—figure supplement 3
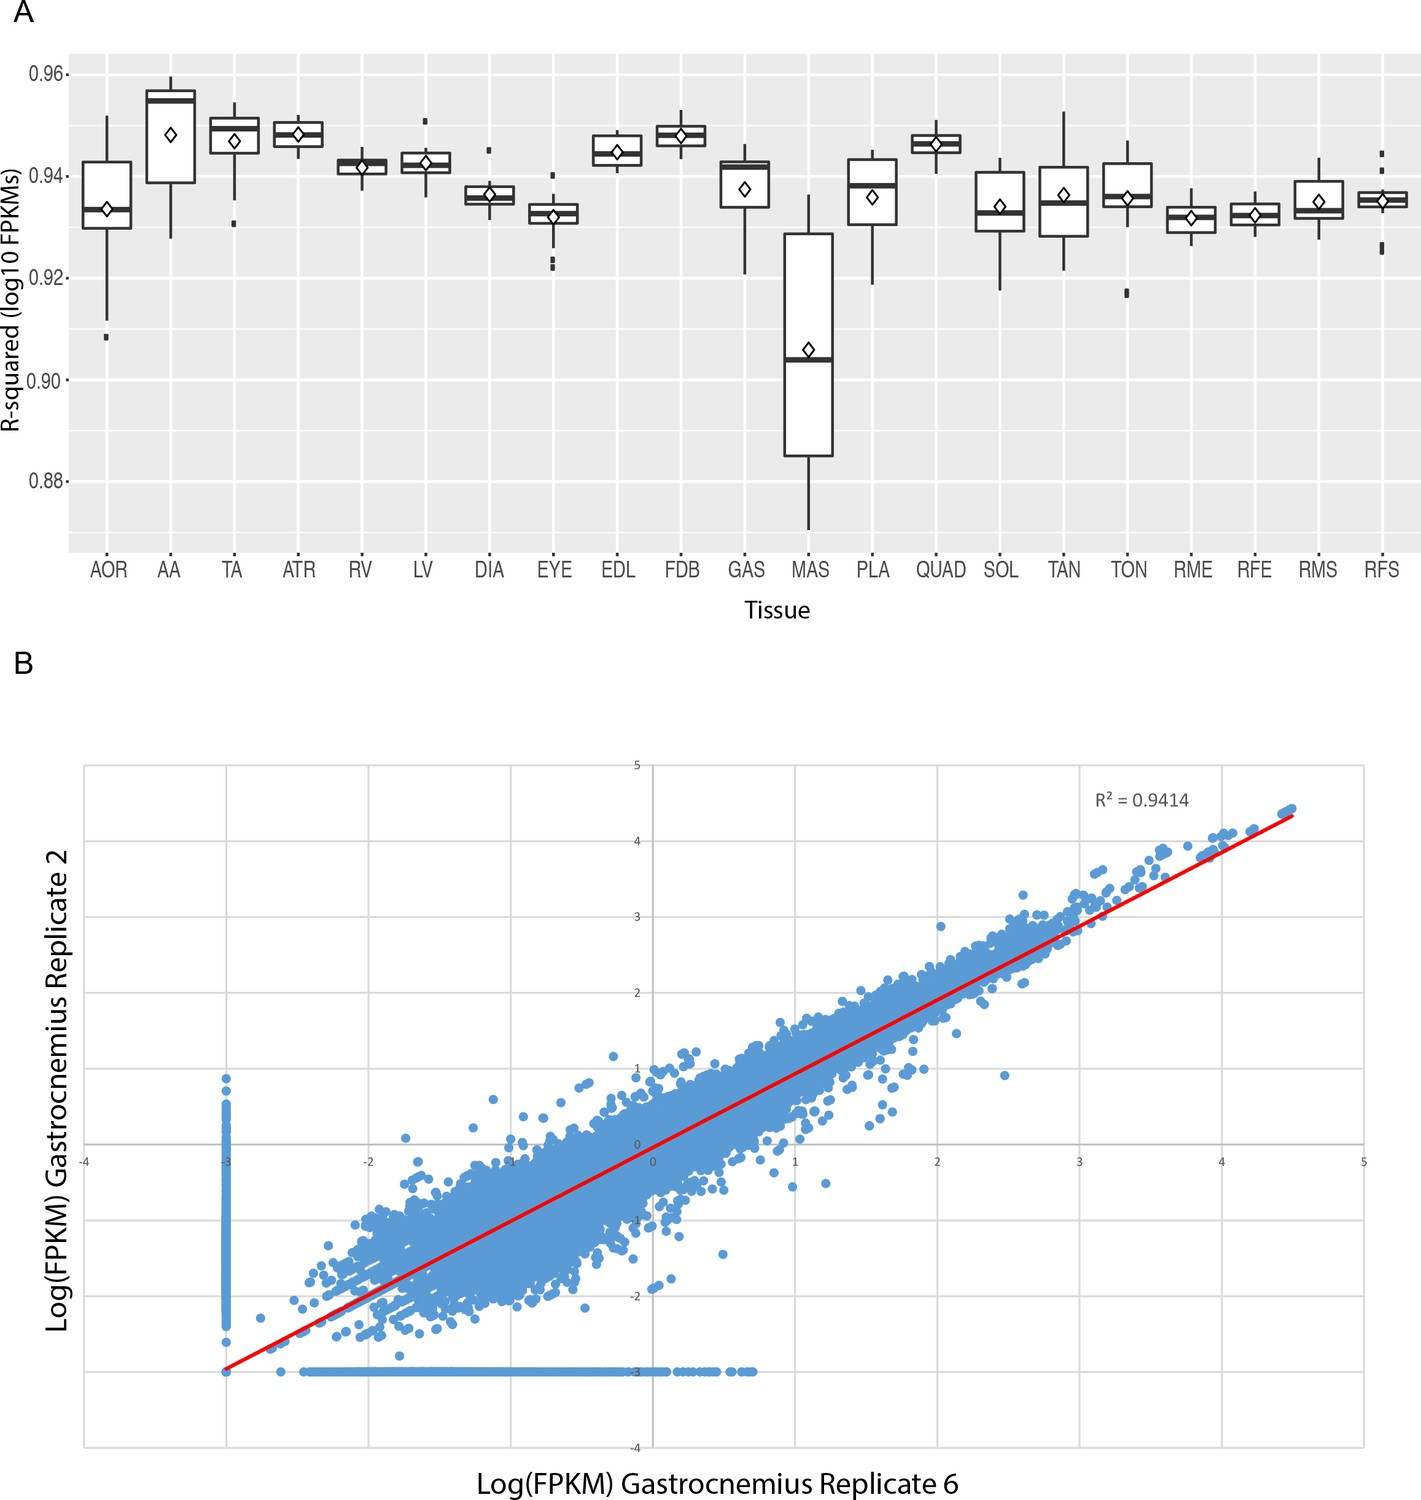
FPKM values show high reproducibility between replicate samples.
(A) Box and whisker plots of R-squared values of pairwise comparisons between replicates of each tissue. Every median R-squared is greater than 0.90. Excluding masseter, every median R-squared is greater than 0.93. AOR = total aorta, AA = abdominal aorta, TA = thoracic aorta, ATR = atria, RV = right ventricle, LV = left ventricle, DIA = diaphragm, EYE = extraocular eye muscle, EDL = extensor digitorum longus, FDB = flexor digitorum brevis, GAS = gastrocnemius, MAS = masseter, PLA = plantaris, QUAD = quadriceps, SOL = soleus, TAN = tibialis anterior, TON = tongue, RME = male rat extensor digitorum longus, RFE = female rat extensor digitorum longus, RMS = male rat soleus, RFS = female rat soleus. (B) Scatter plot of all transcript-level FPKM values for two representative replicates (mouse gastrocnemius replicates 2 and 6). FPKM values are log10 transformed; any FPKM = 0 was plotted as an arbitrarily low expression value (FPKM = 0.001) to avoid log-transforming zero.
Figure 1—figure supplement 4

Internal controls demonstrate the reliability of differential expression analysis.
10 genes differentially expressed between mouse EDL and soleus were selected with log2 fold changes ranging from −1.5 to 1.5. Panel (A) shows the EDL/soleus log2 fold changes as a bar graph from RNAseq data. Panel (B) shows the log2 fold changes for the same genes, normalized to the house-keeping gene Importin 8, measured by qPCR on biological samples collected independently of those used for RNAseq. Internal controls based on known tissue-specific genes also corroborate the reliability of these data. (C) Expression of Acta2, a smooth muscle-specific gene, is plotted as a bar graph. (D) Expression of Pln, a cardiac muscle-specific gene, is plotted as a bar graph. Error bars are ±S.E.M.
Figure 1—figure supplement 5
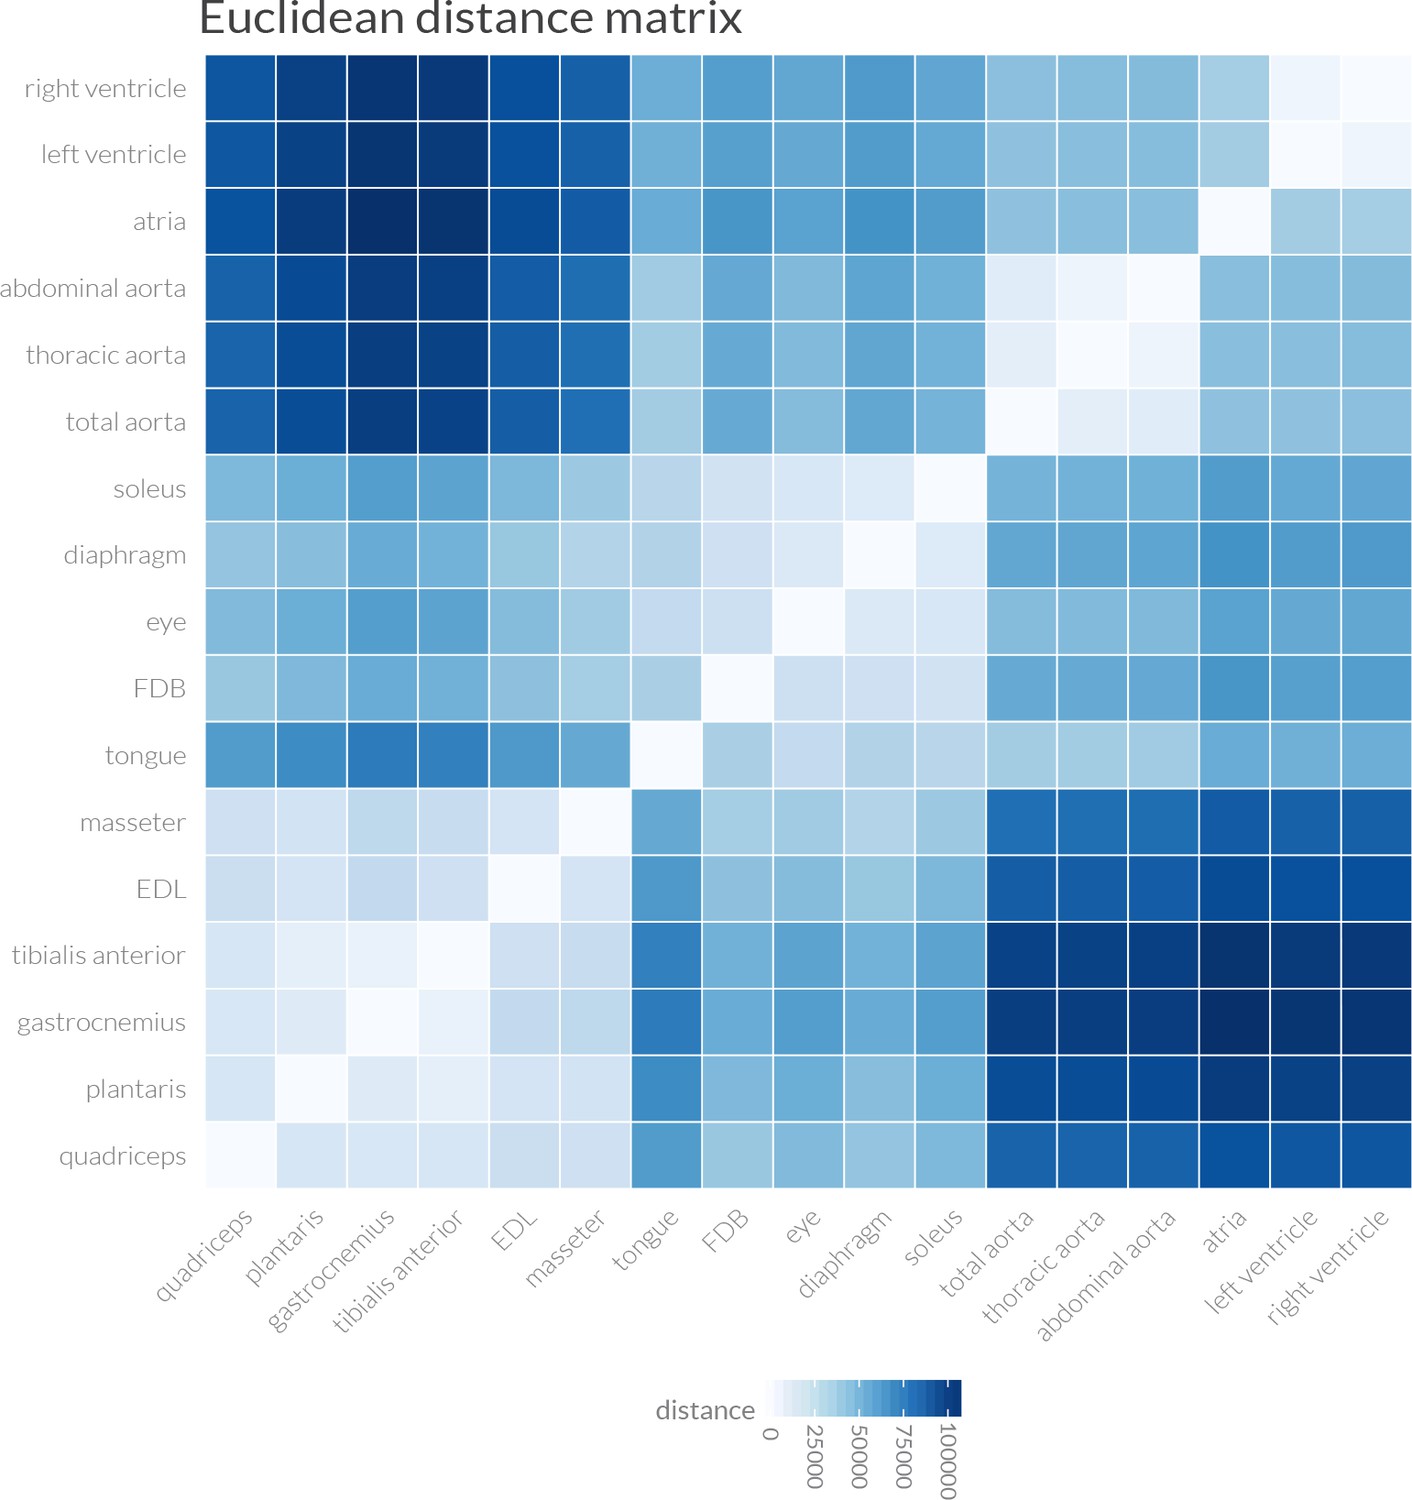
Euclidean distance measurements support the clustering of muscle transcriptomes into four distinct groups.
Pairwise Euclidean distances between the entire transcriptome of every mouse tissue are shown as a heat map. Overall similarity reveals four distinct groupings: (1) cardiac muscle, (2) smooth muscle/aorta, (3) limb (except soleus) and masseter skeletal muscles, and (Hughes et al., 2009) other skeletal muscles, including soleus. These data were used to generate the dendrogram shown in Figure 1D.
Figure 1—figure supplement 6
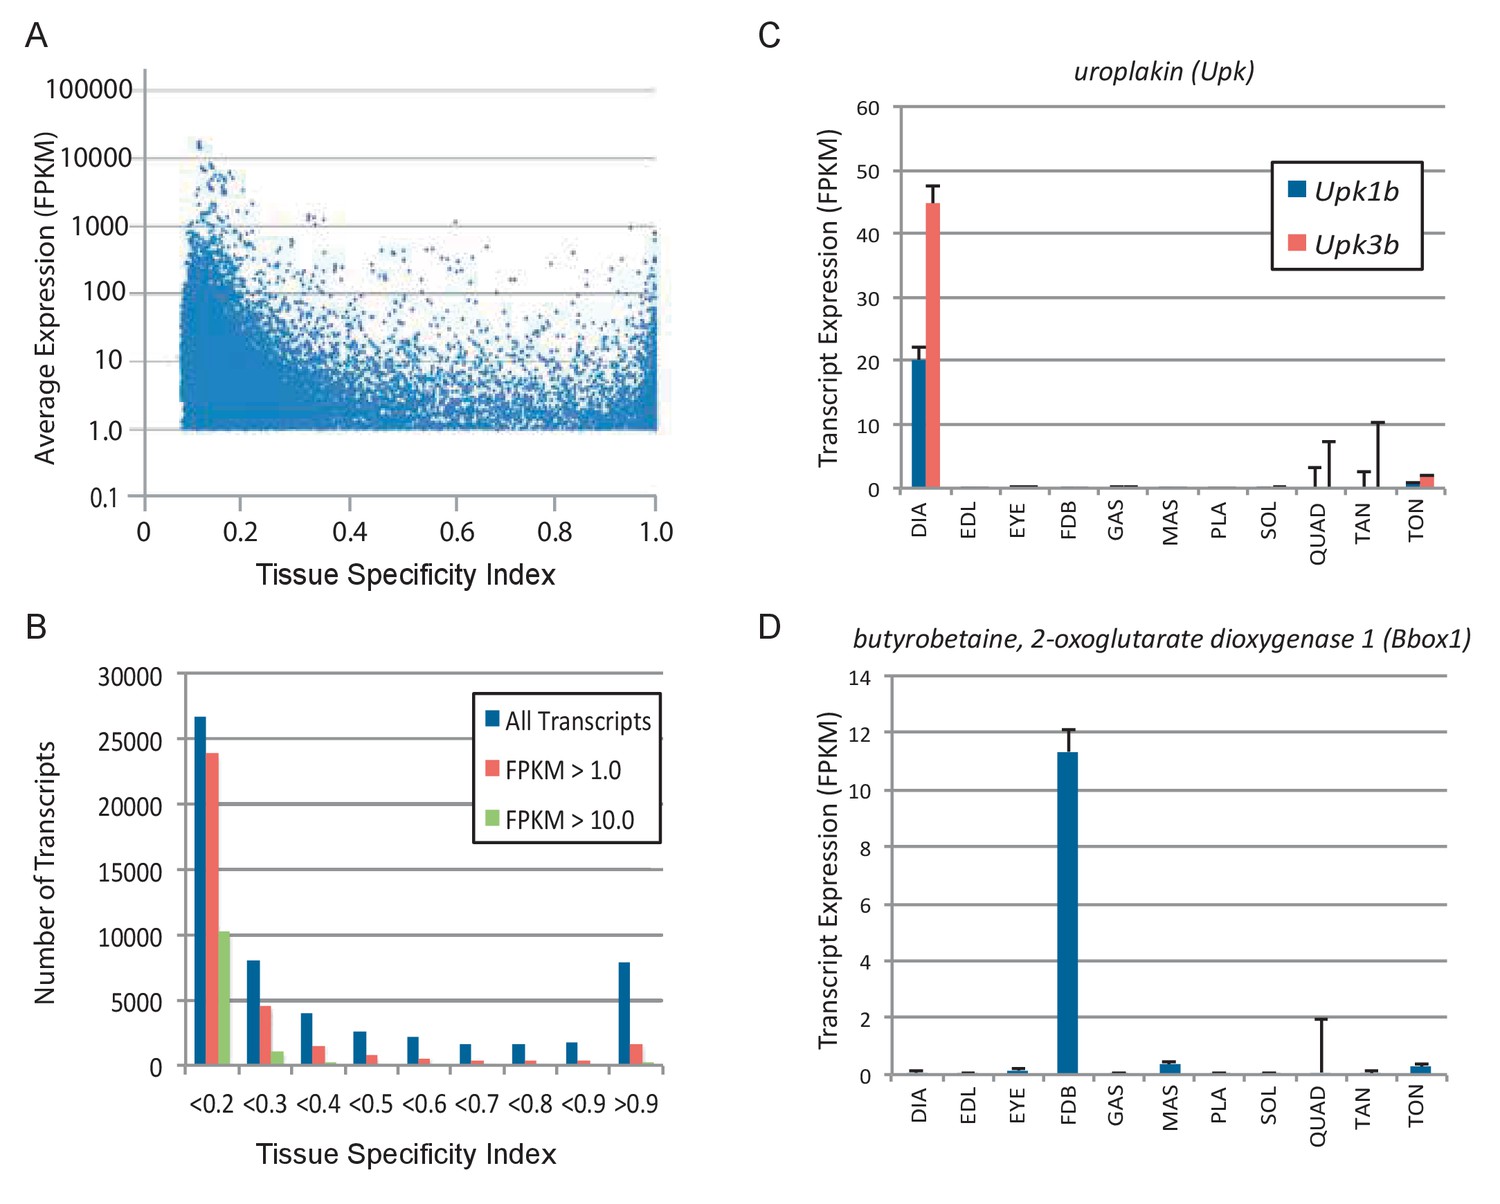
Subsets of genes are expressed specifically in different skeletal muscles.
(A) Tissue specificity (maximum expression in any tissue divided by the sum total expression in all tissues) was calculated for all expressed transcripts in 11 different skeletal muscle tissues. The tissue specificity index ranges from 1.0 (completely specific to a single tissue) to 0.091 (evenly expressed among all 11 skeletal muscle tissues). Average expression is plotted versus tissue specificity for all transcripts expressed above an average FPKM of 1.0. The distribution of transcripts is quantified in (B), where the majority of expressed transcripts are expressed approximately equally across all 11 tissues (specificity index <0.2), and a smaller group of transcripts are expressed with high specificity (specificity index >0.9). Panel (C) shows two examples of genes (Upk1b and Upk3b) that are specifically expressed in the diaphragm. Panel (D) shows an example of a gene (Bbox1) expressed specifically in the FDB (Error bars are ±S.E.M.). Please see the Materials and methods for a list of antibodies tested by immunohistochemistry.
Figure 1—figure supplement 7
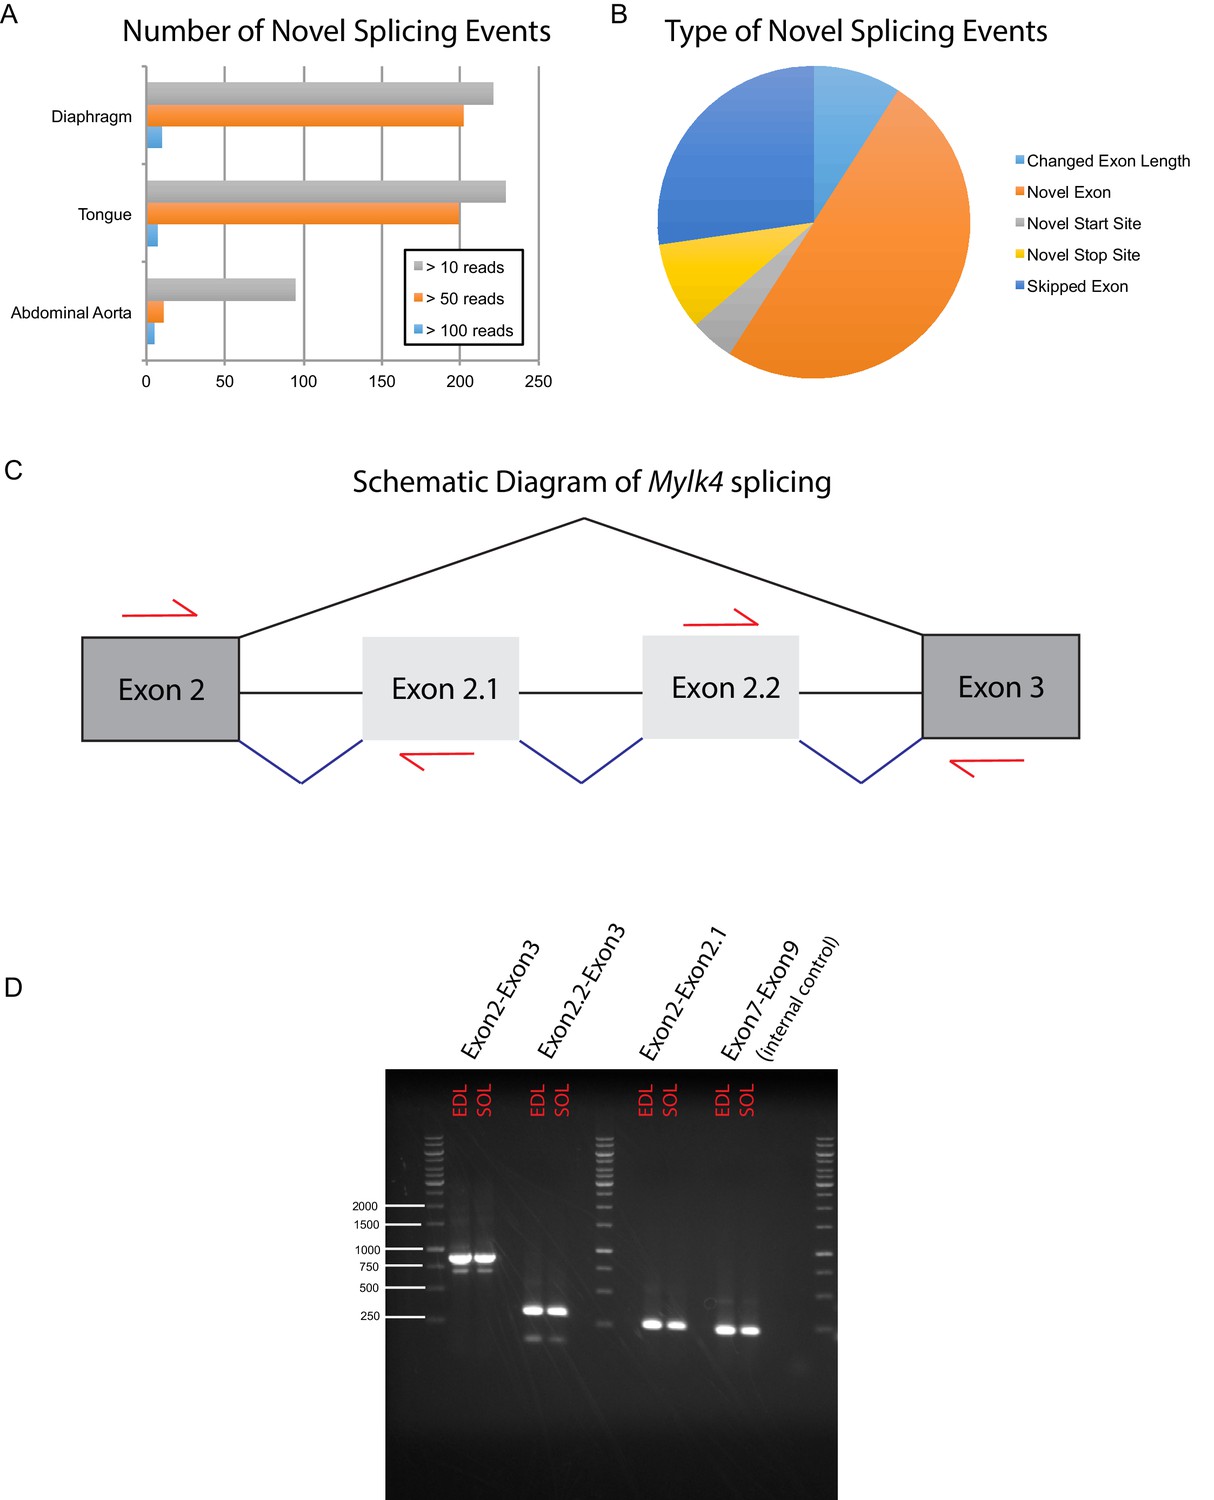
Deep sequencing the muscle transcriptome reveals numerous novel splicing events.
In order to detect previously unannotated splicing events, we manually queried RUM alignments from a subset of our data, including mouse diaphragm, tongue, abdominal aorta, EDL and soleus. (A) The number of unique novel splicing events detected at different read depths in different mouse muscle tissues is plotted as a bar graph. (B) We manually curated the highest confidence hits (supporting reads >100) and identified five major classes of novel splicing events. Relative proportions are represented as a pie chart; the most common novel splicing event were novel exons. Panel (C) shows a cartoon diagram of Myosin light chain kinase 4 (Mylk4) splicing between canonical exons 2 and 3 (dark grey boxes). RNAseq data predict the presence of two heretofore unannotated exons, which we provisionally term exons 2.1 and 2.2 (light grey boxes). Black lines represent canonical splicing; blue lines represent potentially novel splicing events. Red arrows indicate the location of RT-PCR primers designed to verify whether these predicted events occur in muscle tissue. (D) RT-PCR gel confirming that the novel splicing events occur in vivo. Input RNA was taken from male mouse EDL and soleus muscle collected independently of the samples used for RNAseq. Experimental lanes 1 and 2 using primers spanning canonical exons 2 and 3, show a predominant PCR product of ~880 bp in both EDL and soleus, consistent with splicing of both exons 2.1 and 2.2 into the full length transcript. This band was TOPO cloned and conventional Sanger sequencing confirmed the presence of both novel exons. A minor product of ~600 bp is also present, which most likely represents the exclusion of one of the two novel exons. Experimental lanes 3 and 4 show a PCR product of ~330 bp from both EDL and soleus using primers that span exons 2.2 to 3, confirming that this splicing event happens in vivo. Experimental lanes 5 and 6 show a PCR product of ~260 bp from both EDL and soleus using primers that span exons 2 to 2.1, confirming that this splicing event happens in vivo. Experimental lanes 7 and 8 show a PCR product spanning canonical exons 7 to 9 of Mylk4. These lanes were an internal control for Mylk4 expression in our samples. Interrogation of the GENCODE database reveals that many of the novel splicing events described above, including those in Mylk4, are supported by sequenced cDNAs that have not yet been integrated into gene models.
Figure 2 with 1 supplement
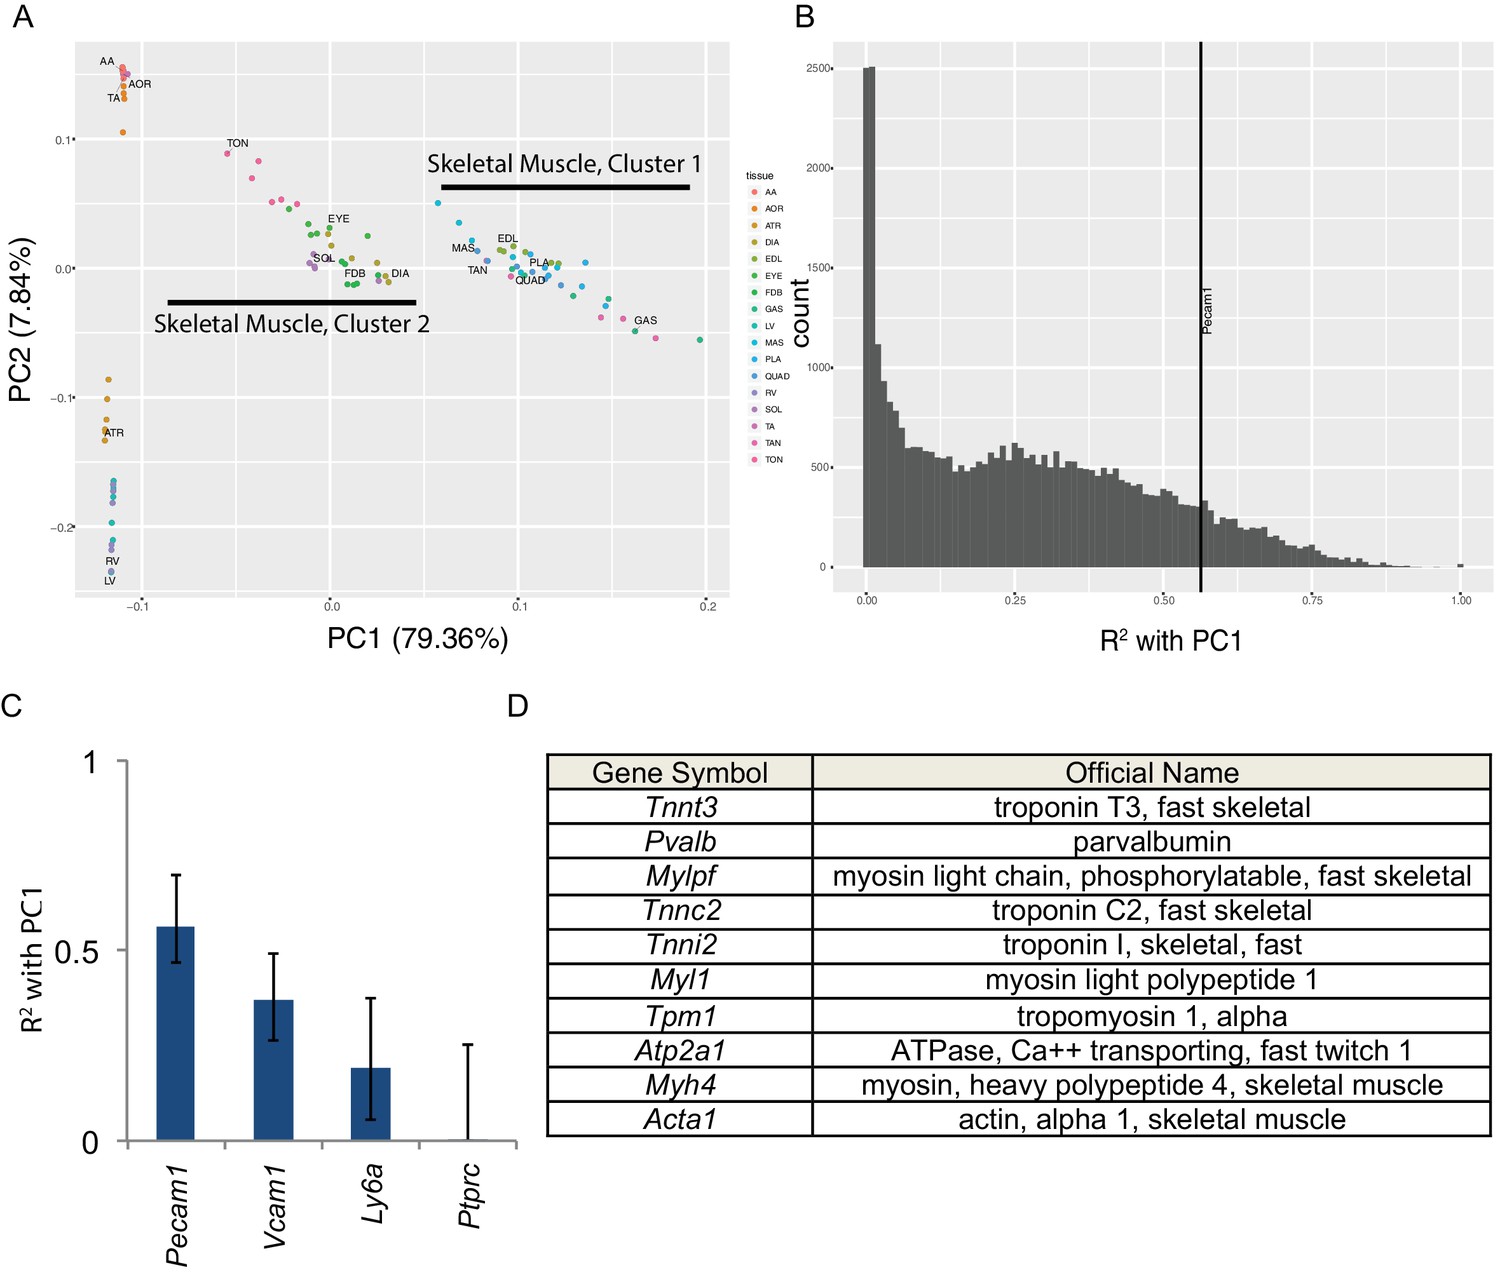
Principal component analysis reveals the majority of variance in these data is due to gene expression in skeletal muscle cells.
(A) Principal components 1 and 2 are plotted on the x- and y-axes respectively for all six replicates of each muscle tissue. PC1 accounts for 79.36% of the variance and separates skeletal muscle cluster 1 from cluster 2 (compare with Figure 1D). PC2 accounts for 7.84% of the variance in these data and largely separates cardiac from smooth muscle tissues. (B) Histogram of the R2 values of each transcript’s correlation with PC1. The most correlated non-muscle cell ‘marker’ gene, Pecam1, is denoted as a vertical line. (C) R2 values with 99% confidence intervals are shown for four ‘marker’ genes conventionally used to identify non-skeletal muscle cells in whole muscle preparations. (D) The top ten genes whose expression is most highly correlated with PC1 are shown as a Table. All ten are characteristic skeletal muscle genes.
-
Figure 2—source data 1
Gene Ontology analysis reveals that sarcomere structural components are among the most commonly enriched differential pathways among skeletal muscles.
Genes differentially expressed among skeletal muscles were identified for every pairwise comparison (q < 0.01; FC > 2; max = 3,000). These gene lists were analyzed for Gene Ontology enrichment (Huang et al., 2009a). This figure displays a group of related tables summarizing these results. For every skeletal muscle tissue, the most common enriched gene ontologies for up- and down-regulated genes are shown, along with the number and identity of tissues in which the constituent genes are differentially expressed. Key structural components of the sarcomere were among the most commonly observed differential gene ontology terms, including ‘Z disc’, ‘actin binding’, ‘M band’, and ‘myosin complex’. Additionally, ontology terms related to extracellular proteins such as collagen, integrin, and fibronectin were enriched in these data. TON = tongue, FDB = flexor digitorum brevis, SOL = soleus, EYE = extraocular eye muscles, DIA = diaphragm, EDL = extensor digitorum longus, PLA = plantaris, TAN = tibialis anterior, GAS = gastrocnemius, MAS = masseter, QUAD = quadriceps.
- https://doi.org/10.7554/eLife.34613.014
Figure 2—figure supplement 1
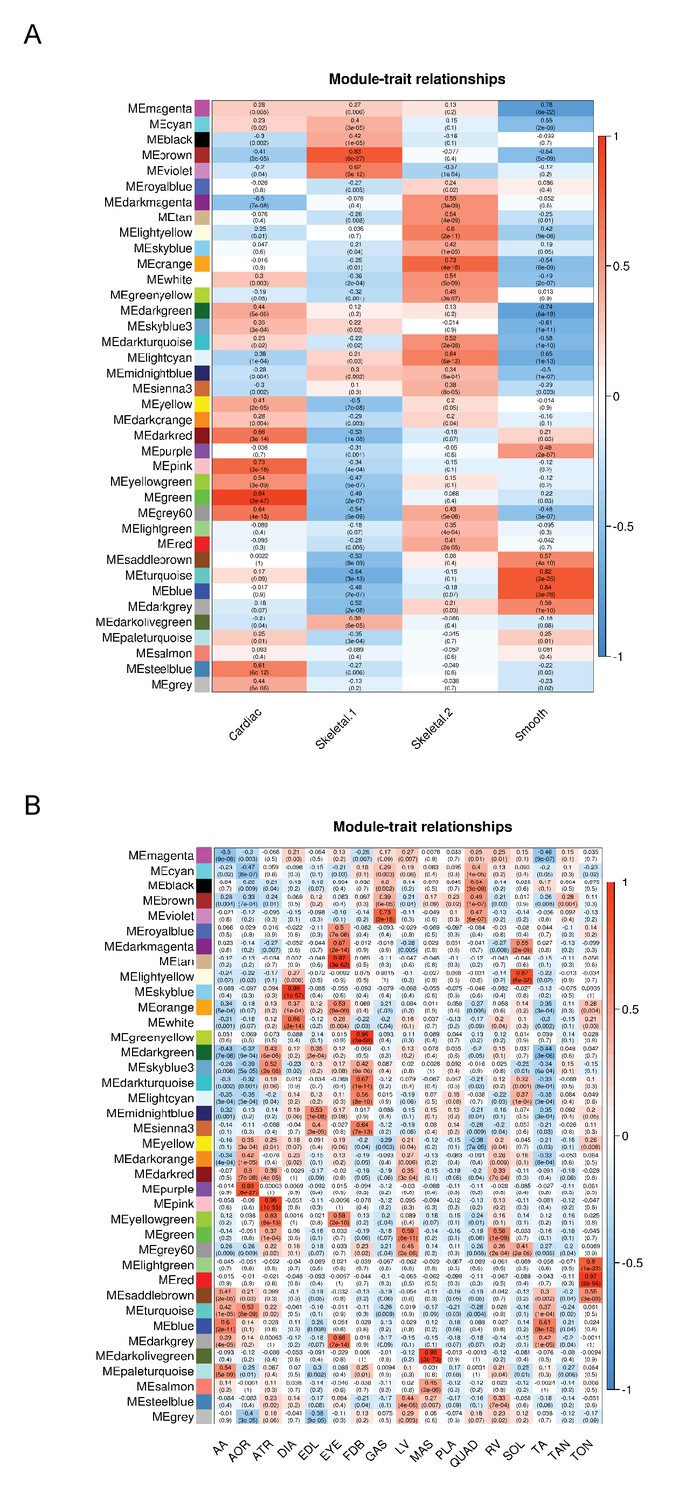
WGCNA analysis reveals co-expressed modules of genes in different muscle tissues.
WGCNA analysis (Langfelder and Horvath, 2008; Zhang and Horvath, 2005) was performed to identify clusters of co-expressed genes among (A) the four major classes of muscle identified in Figure 1, and (B) all 17 tissues. Colored boxes on the left axis represent different co-expressed modules of genes. Each cell is color-coded using a scale from blue to red (the key is on the right axis), which represents the degree of correlation with tissue identity. The upper number in each cell represents the correlation (r-value), and the lower number represents the p-value of its correlation with any given tissue group. AA = abdominal aorta, AOR = total aorta, ATR = atria, DIA = diaphragm, EDL = extensor digitorum longus, EYE = extraocular eye muscles, FDB = flexor digitorum brevis, GAS = gastrocnemius, LV = left ventricle, MAS = masseter, PLA = plantaris, QUAD = quadriceps, RV = right ventricle, SOL = soleus, TA = thorascic aorta, TAN = tibialis anterior,TON = tongue.
Figure 3 with 1 supplement
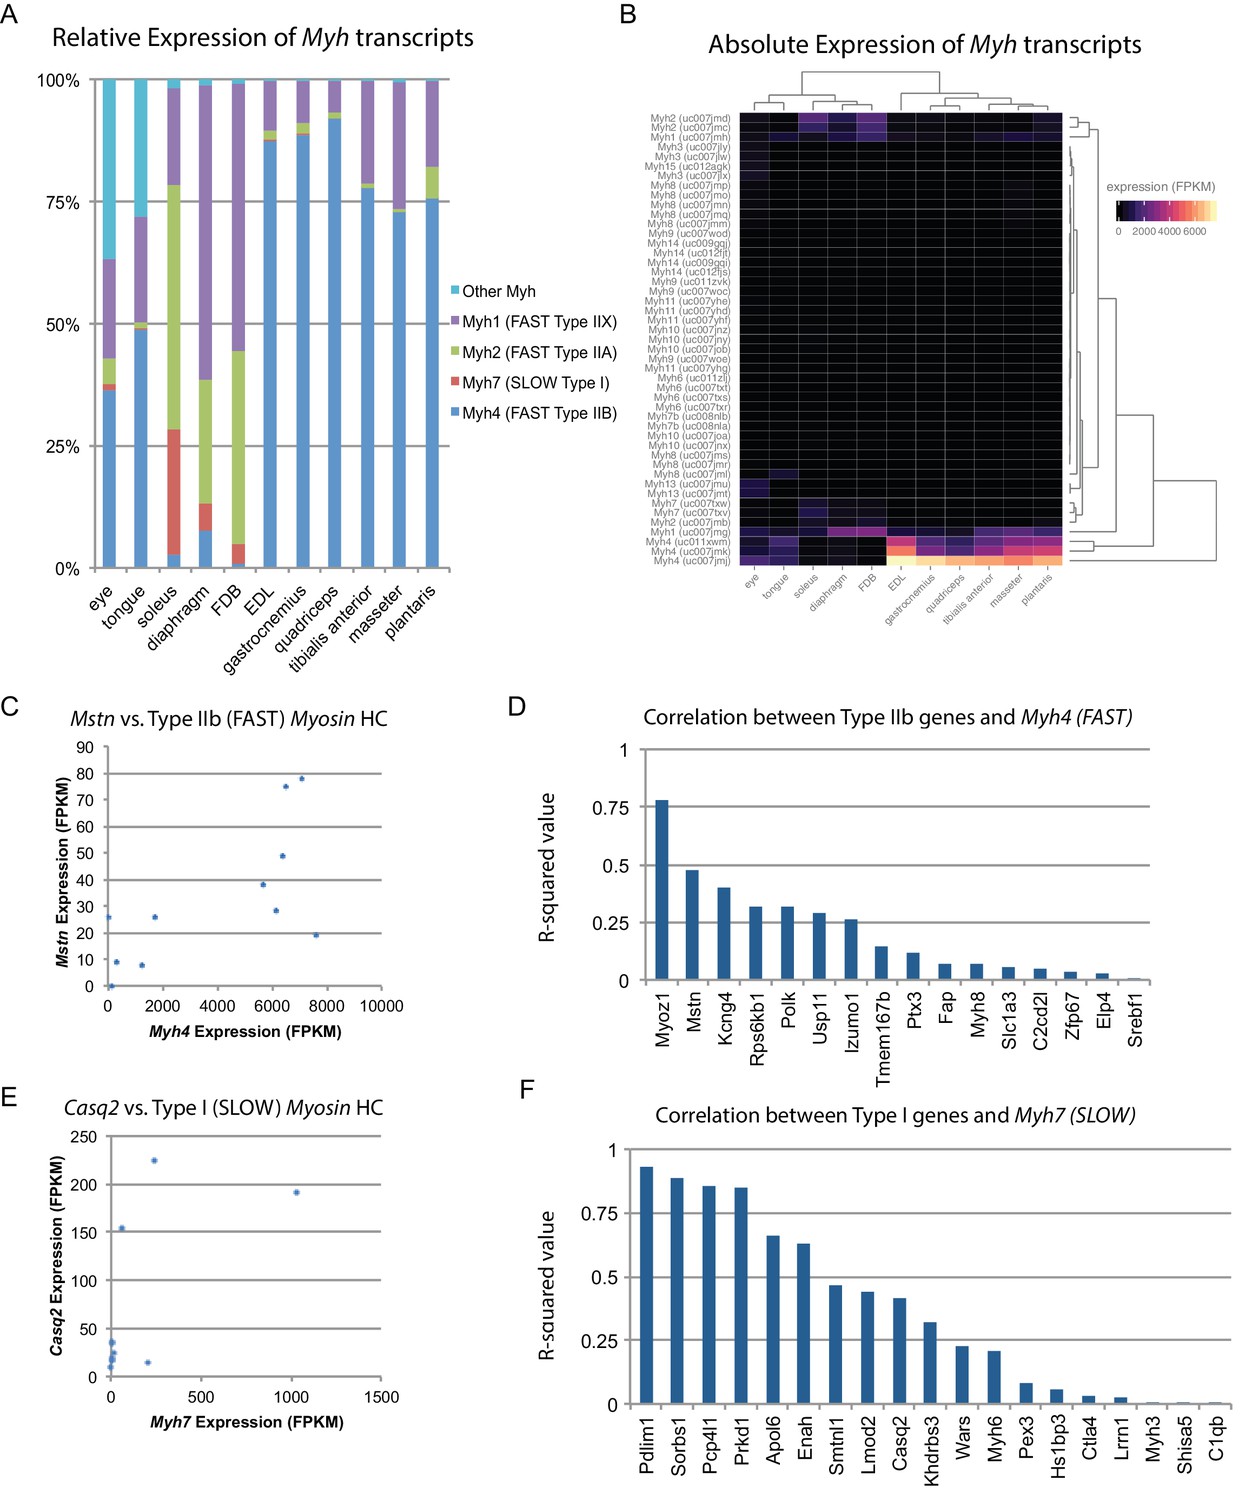
Fiber-type composition can explain some, but not all, transcriptional variability between skeletal muscle tissues.
(A) Relative expression of Myosin heavy chain (Myh) transcripts as distributed among all 11 mouse skeletal muscle tissues is plotted as a bar graph. The y-axis describes the percent of reads aligning to any given Myh transcript relative to all Myh-aligning reads. (B) Absolute expression of Myh transcripts among all 11 mouse skeletal muscle tissues is represented as a heat map. Absolute levels were plotted as a heat map to illustrate the dynamic range of Myh expression in muscle. Tissues are clustered by overall Myh similarity (top dendrogram). Notably, clustering is similar to, but distinct from, clustering done on global transcriptional profiles (Figure 1D). (C) The expression of Myostatin (Mstn), a gene specifically expressed by Type IIb (fast) fibers (Chemello et al., 2011), is plotted versus Myh4 expression. Each dot represents one of 11 skeletal muscle tissues (R2 = 0.473). (D) R-squared values for correlations with Myh4 expression are plotted as a bar graph for 16 genes known to be specific for Type IIb fibers. Median R2 = 0.132; only one gene has an R2 >0.5. (E) The expression of Calsequestrin 2 (Casq2), a gene specifically expressed by Type I (slow) fibers (Chemello et al., 2011), is plotted versus Myh7 epression. Each dot represents one of 11 skeletal muscle tissues (R2 = 0.412). (F) R-squared values for correlations with Myh7 expression are plotted as a bar graph for 19 genes known to be specific for Type I fibers. Median R2 = 0.321; 7 of 19 genes (37%) tested show essentially no correlation with Myh4 expression.
Figure 3—figure supplement 1
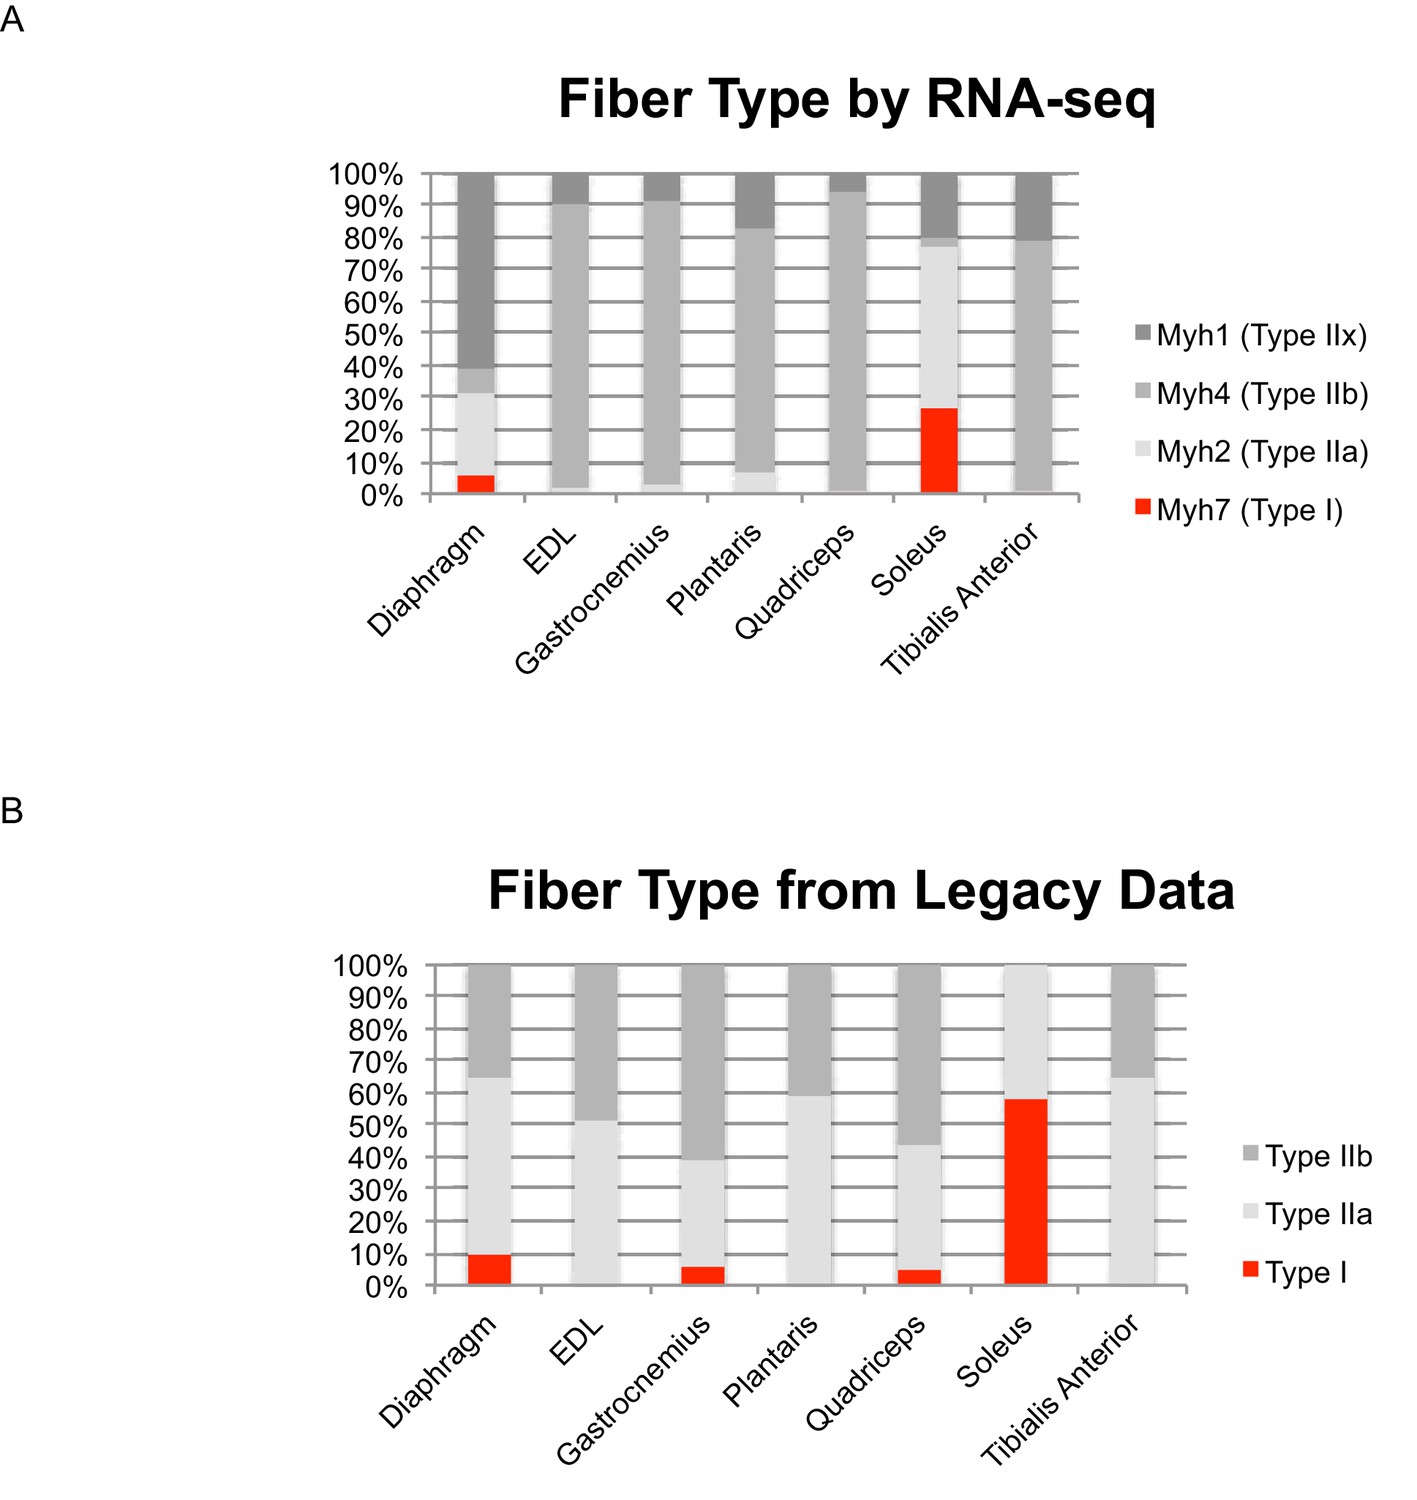
Identifying skeletal muscle fiber type by Myh expression agrees with legacy data.
(A) Relative expression levels of the four principal Myosin heavy chains (Myh1, 2, 4, and 7) are shown as a bar graph in select mouse muscle tissues. Fast twitch myosins are shown in grey; slow twitch myosin is shown in red. (B) We identified legacy studies that characterized Myh expression in mouse diaphragm (Greising et al., 2015) as well as the EDL, gastrocnemius, plantaris, quadriceps, soleus and tibialis anterior (Greising et al., 2015); the relative compositions of fast/slow twitch fibers is represented as a bar graph. As above, fast twitch myosins are shown in grey; slow twitch myosins are shown in red. We note that the previous studies cited herein: (1) measured fast/slow composition in female as opposed to male mice, which is expected to increase the relative proportion of slow twitch fibers, (2) used histology, which is limited to analyzing cross-sectional area of serial sections, rather than the entire muscle body as in the present study, 3) used enzymatic methods to distinguish different fiber types, which limits the extent to which different fast twitch fibers can be resolved, notably neglecting Type IIx fibers. With these caveats in mind, to a first approximation, RNAseq data of Myh expression agrees with legacy data of fiber type composition.
Figure 4
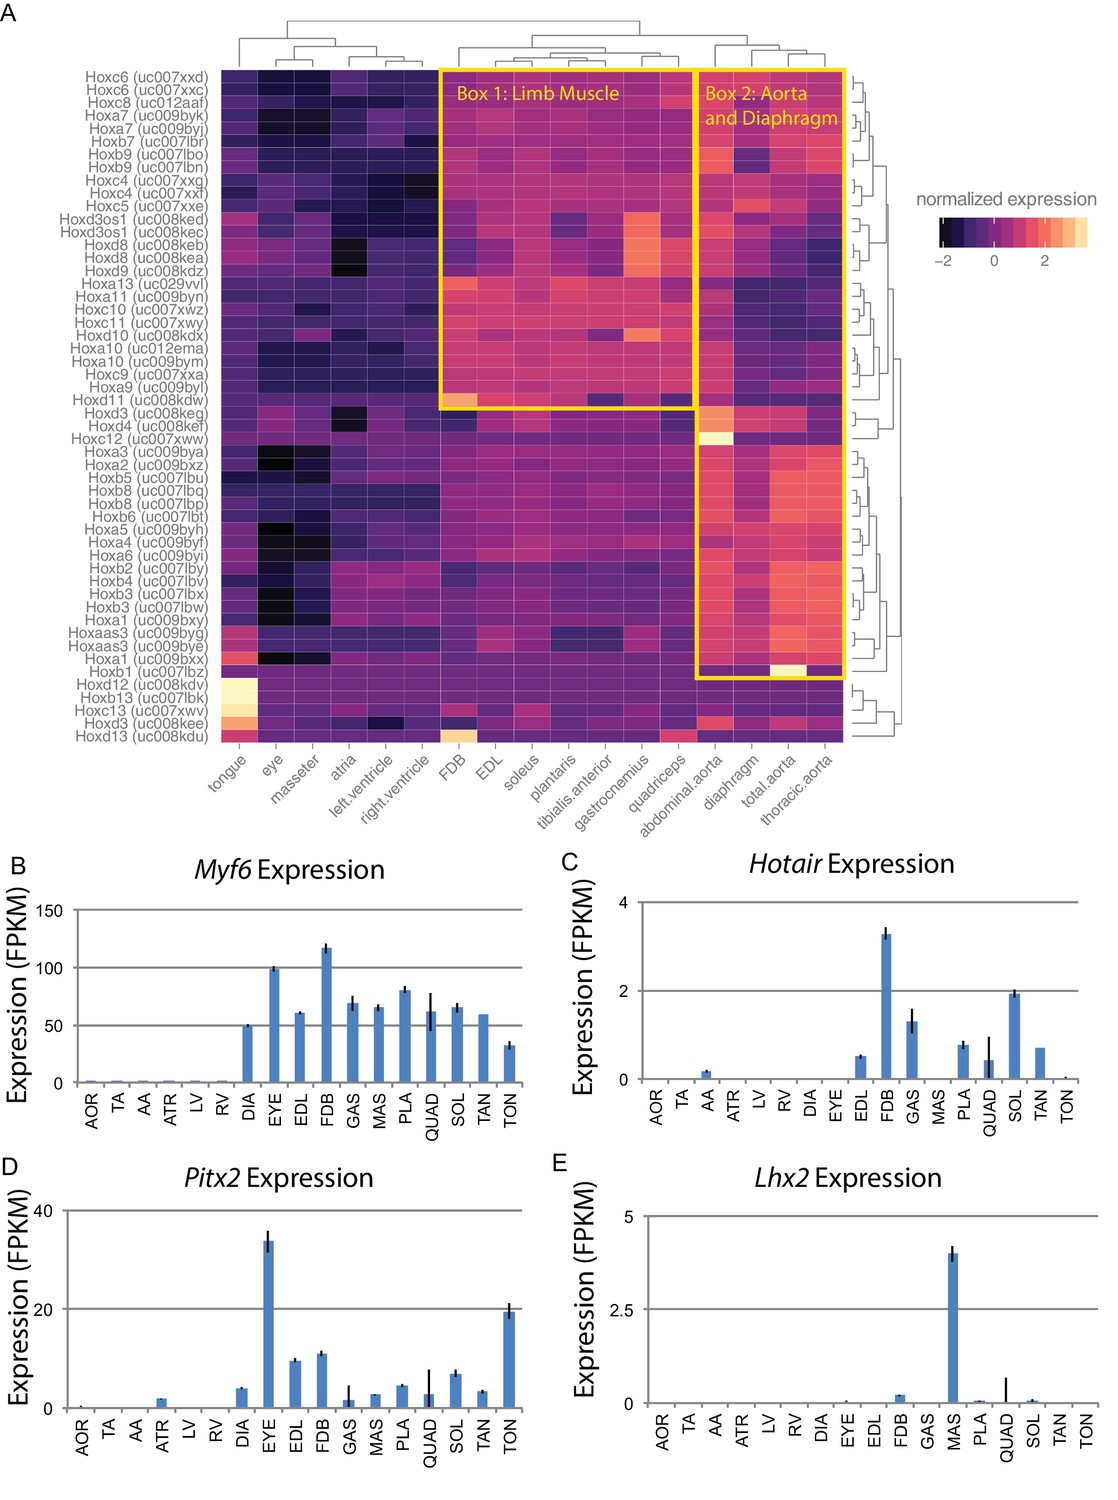
Developmental gene expression persists into adulthood in mouse skeletal muscle.
(A) Normalized expression (Z-score by row) of all Hox gene transcripts is represented as a heat map. Row-normalization was chosen to display these data in a way that reveals the fine detail of all Hox genes, rather than those expressed at the highest levels. Overall similarity by Hox gene expression is represented as a dendrogram (top). One yellow box highlights a cluster of Hox genes expressed in limb skeletal muscle; a second yellow box highlights a cluster of Hox genes expressed in the aorta and diaphragm. (B) Expression of Myf6 is shown as a bar graph. Muscle-specific expression of skeletal muscle differentiation factor persists into adulthood. (C) Expression of Hotair, a non-coding RNA involved in Hox gene regulation, is shown as a bar graph. Hotair expression is highly specific for a subset of skeletal muscle tissues involved in limb movement. (D) Expression of Pitx2, a gene involved in the development of head muscles, is shown as a bar graph. Pitx2 expression is enriched in head and neck tissues such as the extraocular eye muscles and the tongue. (E) Expression of Lhx2, another gene involved in head and neck muscle development, is shown as a bar graph. Lhx2 expression is highly specific for the masseter. AOR = total aorta, ATR = atria, DIA = diaphragm, EDL = extensor digitorum longus, EYE = extraocular eye muscles, FDB = flexor digitorum brevis, GAS = gastrocnemius, LV = left ventricle, MAS = masseter, PLA = plantaris, QUAD = quadriceps, RV = right ventricle, SOL = soleus, TA = thorascic aorta, TAN = tibialis anterior,TON = tongue. Error bars are ±S.E.M.
Figure 5
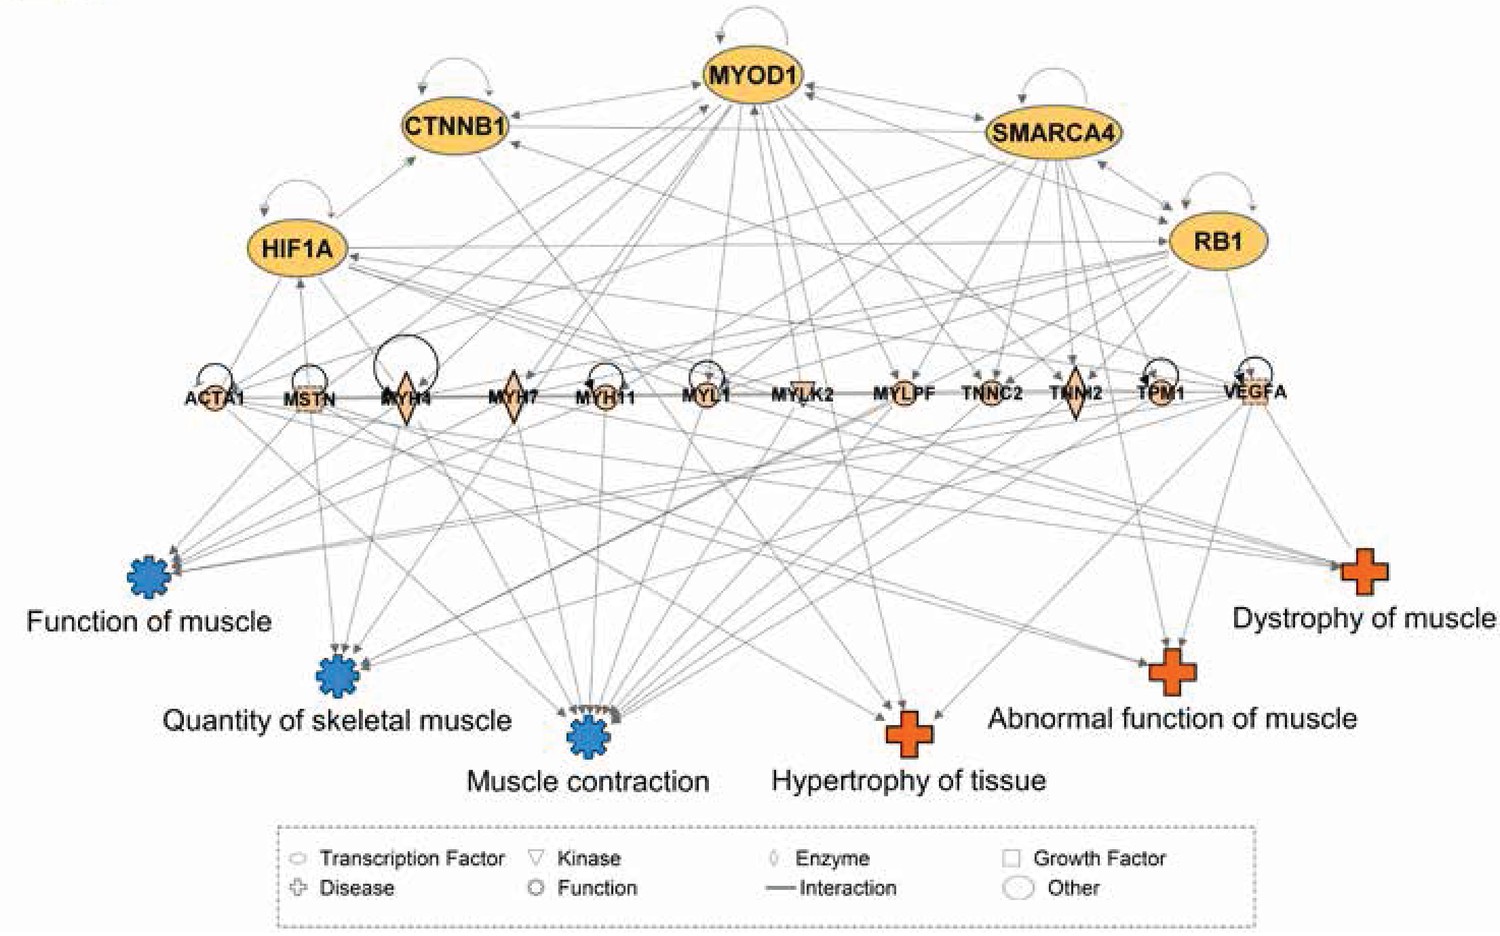
Network interactions of transcription factors predicted to be upstream of differentially expressed skeletal muscle genes.
Ingenuity Pathway Analysis (IPA) was used to predict transcription factors upstream of differentially expressed muscle genes. The beige nodes (middle tier) represent muscle genes whose expression varies between muscle tissues. The orange nodes (top tier) are transcription factor genes predicted to contribute to muscle specific expression patterns. The blue and red nodes (bottom tier) represent biological functions and disease processes, respectively. Edges represent known, directional regulatory interactions. In the interest of clarity, this network has been manually trimmed to only include the most pertinent nodes. For a complete list of all predictions and regulated genes, please see Table 2.
Figure 6 with 1 supplement
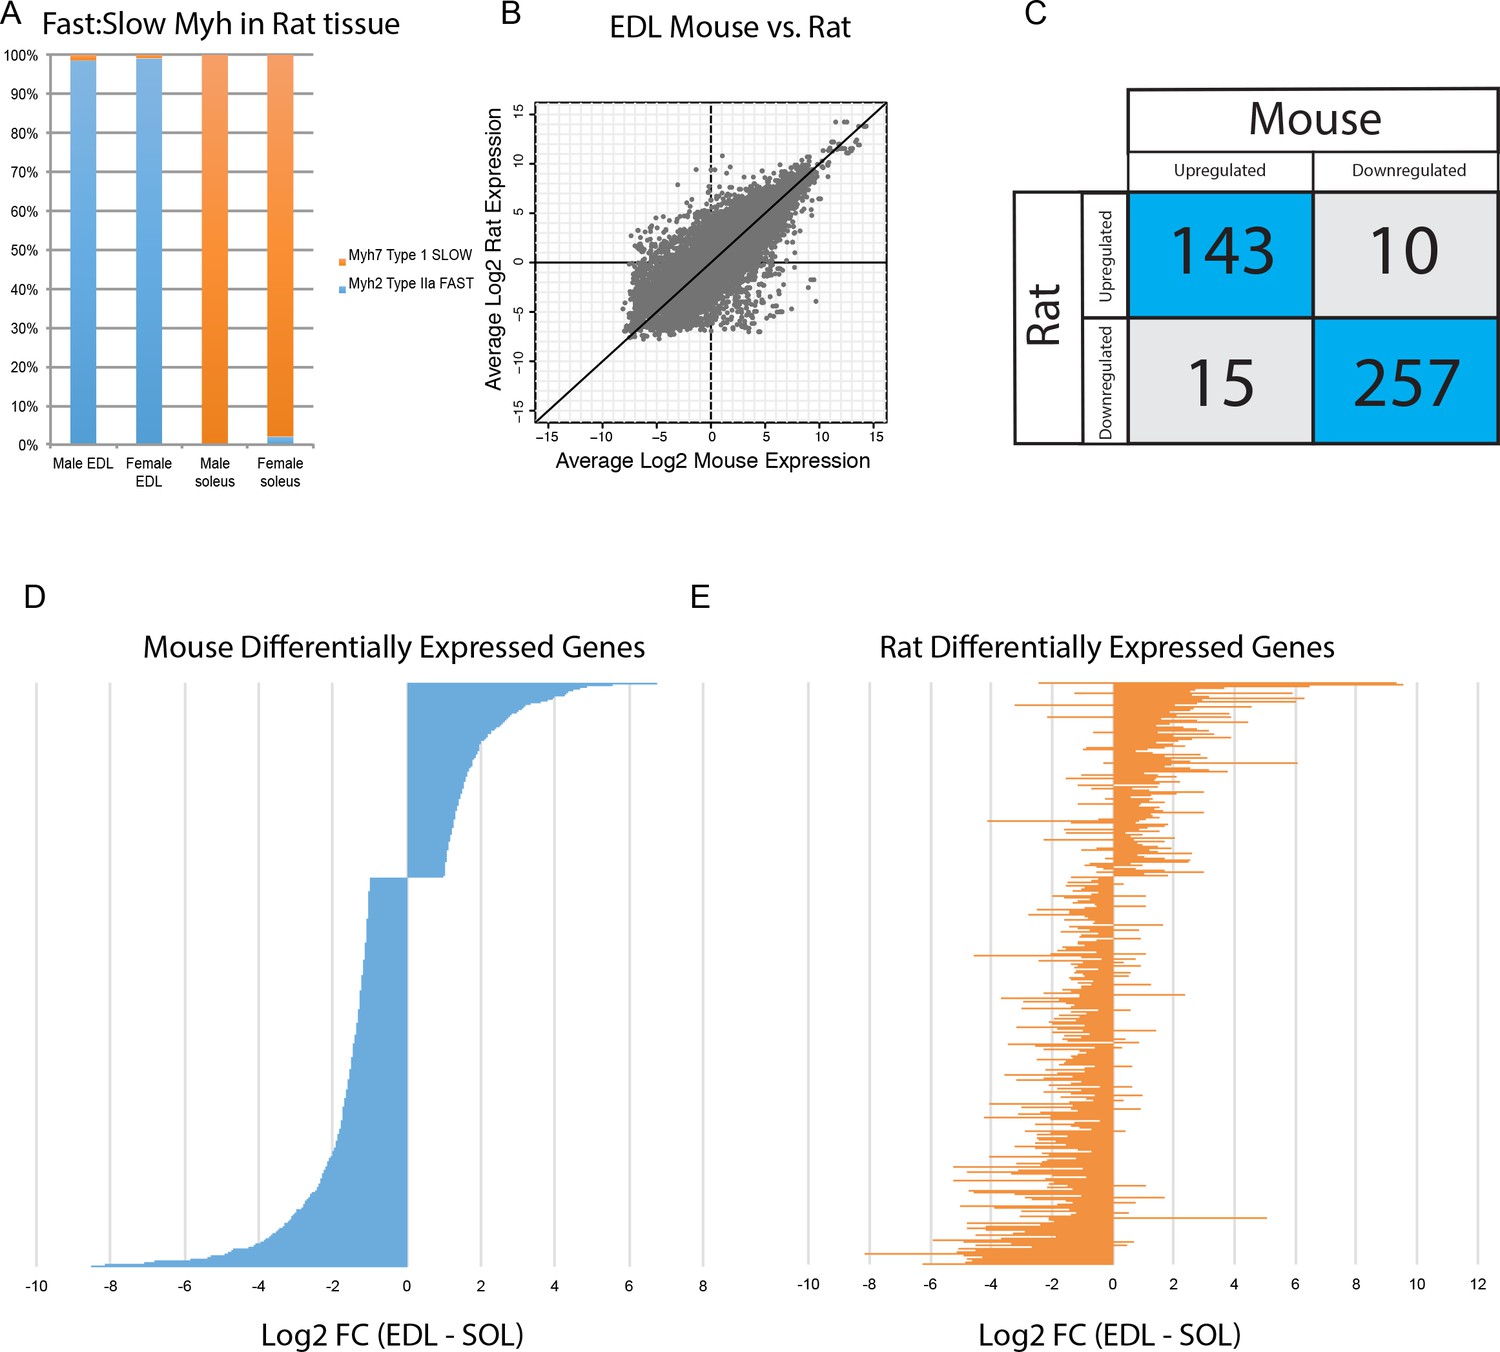
Differential gene expression is conserved between mice and rats.
(A) The relative abundance of fast:slow Myosin heavy chain (Myh) transcripts in rat male and female EDL and soleus is shown as a bar graph. As expected, the fiber type composition of rat muscle is more homogeneous than mouse (compare with Figure 3B) (B) Scatter plot showing the overall similarity between mouse and rat transcriptomes in EDL (R2 = 0.637). Each dot represents a single orthologous gene shared between mice and rats. Correlation between the transcriptomes of mouse and rat soleus is essentially the same as for EDL described above (R2 = 0.662). (C) Of the 425 genes differentially expressed between EDL and soleus in both mice and rats, the majority (94%) were differentially expressed in the same direction (i.e., up-regulated in both mice and rats or down-regulated in both mice and rats). (D) The fold change for all rank-ordered differentially expressed genes in mice between EDL and soleus are plotted as a bar graph (N = 691, q < 0.05, fold change >2). (E) The fold change (EDL/soleus) for the rat orthologues of the genes in (D) are plotted as a bar graph. The order of genes in (D) and (E) is identical. The majority of genes in rat (>90%) show differential expression in the same direction as seen in mice (i.e., up-regulated in both mice and rats or down-regulated in both mice and rats).
Figure 6—figure supplement 1
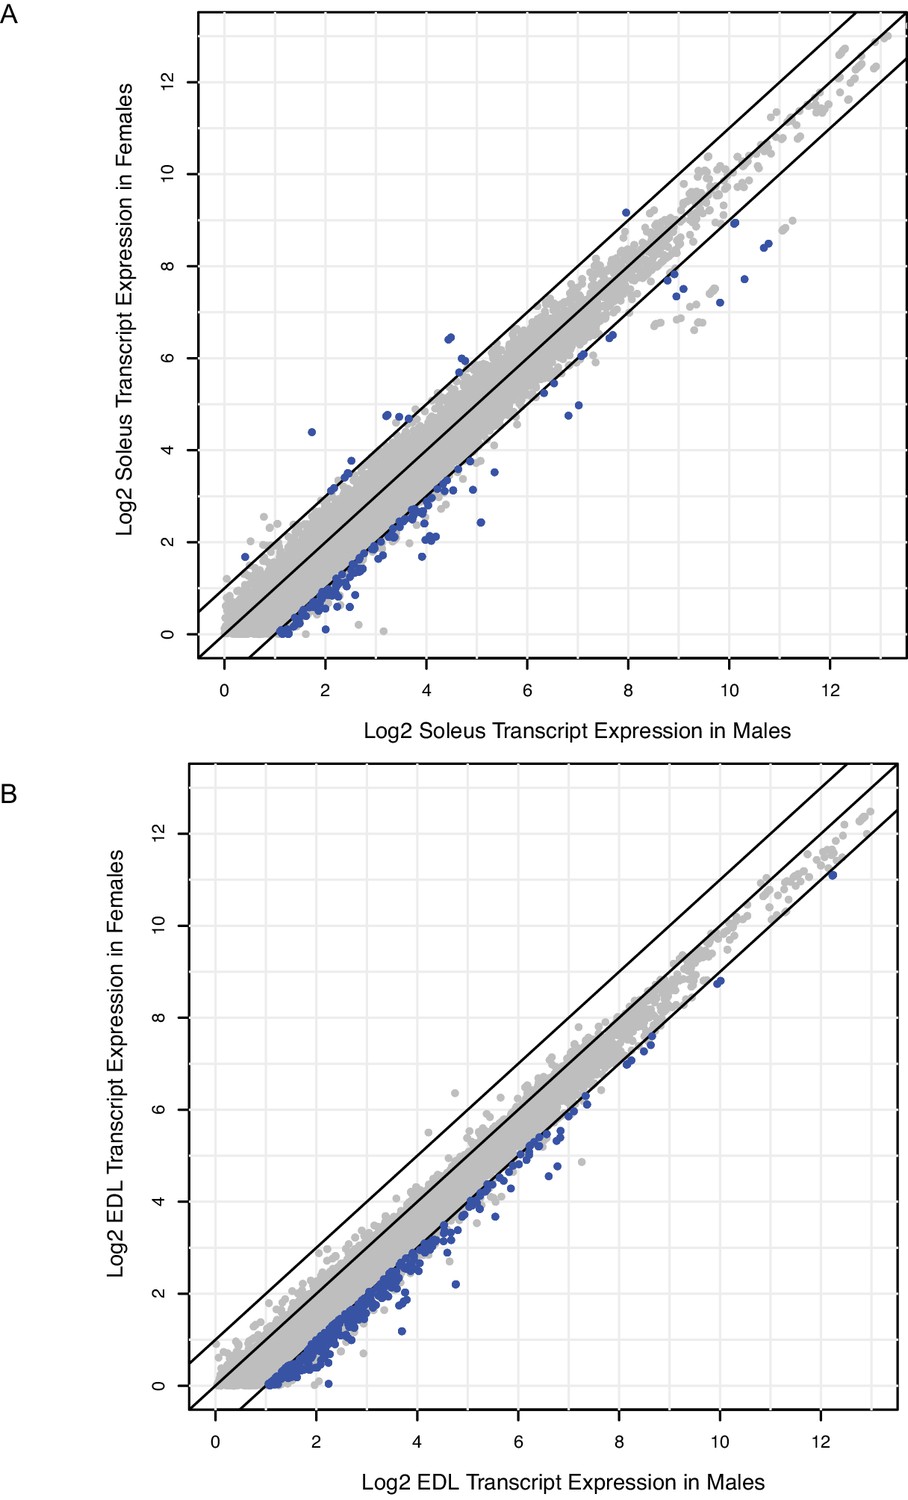
Relatively few genes are differentially expressed between males and females; most of these are up-regulated in males.
(A) Scatter-plot showing the log2 expression (FPKM) of every transcript with average expression >1.0 in rat male soleus versus rat female soleus. Blue dots represent transcripts with q-values <0.05 and fold change >2; grey dots are transcripts that are not statistically significant. Black bars represent fold change cutoffs > 2. (B) Scatter-plot showing the log2 expression (FPKM) of every transcript with average expression >1.0 in rat male EDL versus rat female EDL. Blue dots represent transcripts with q-values <0.05 and fold change >2; grey dots are transcripts that are not statistically significant. Black bars represent fold change cutoffs > 2.
Figure 7 with 2 supplements
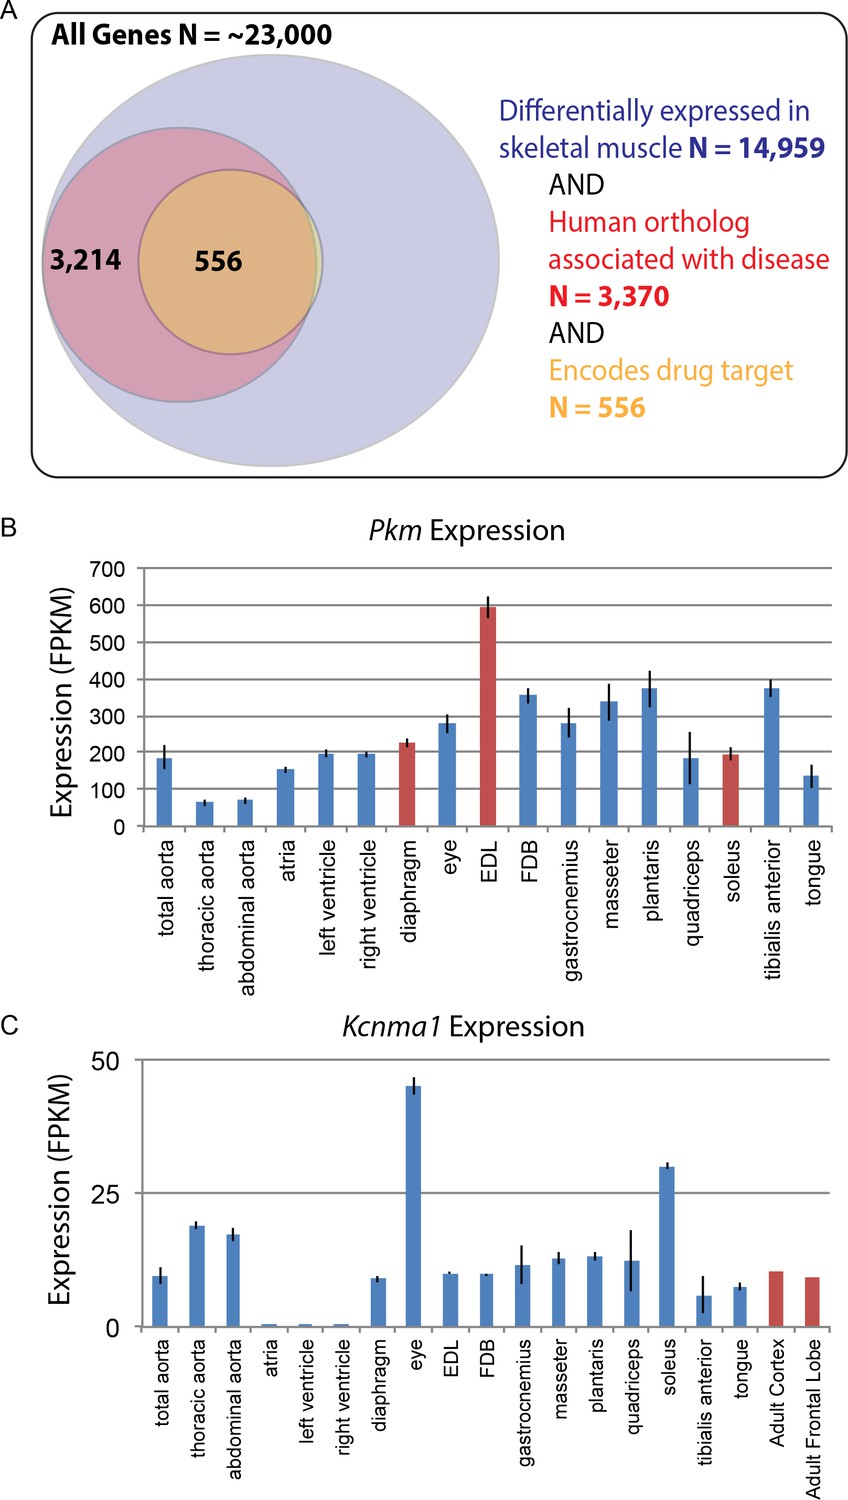
Differential gene expression in skeletal muscle may influence pathology and pharmacology.
(A) Of roughly 23,000 genes in mice, 14,959 (~65%) are differentially expressed among skeletal muscle tissues (blue circle). Of these, 3370 (~15% of all genes) have orthologs known to influence human disease (red circle). Of these, 556 (>2% of all genes) encode the target of a marketed drug (orange circle). A small number of genes (N = 13) encode a drug target and are differentially expressed in skeletal muscle, but are not annotated as being associated with human disease, which explains why a sliver of the Venn diagram does not entirely overlap between red and orange circles. (B) The expression of Pkm, a key gene involved in the pathogenesis of myotonic dystrophy, is shown as a bar graph. Data points highlighted in red (EDL, soleus, and diaphragm) represent tissues that have been empirically tested for sensitivity to degeneration in a mouse model of myotonic dystrophy (Moyer et al., 2011). (C) Expression of Kcnma1 is shown as a bar graph. Kcnma1 encodes a potassium channel that is the molecular target of Chlorzoxazone, a drug prescribed as a muscle relaxant. Data points highlighted in red represent FPKM normalized gene expression in the adult cortex and adult frontal lobe as measured by the ENCODE consortium (ENCODE Project Consortium, 2012). Error bars are ±S.E.M., when available.
Figure 7—figure supplement 1
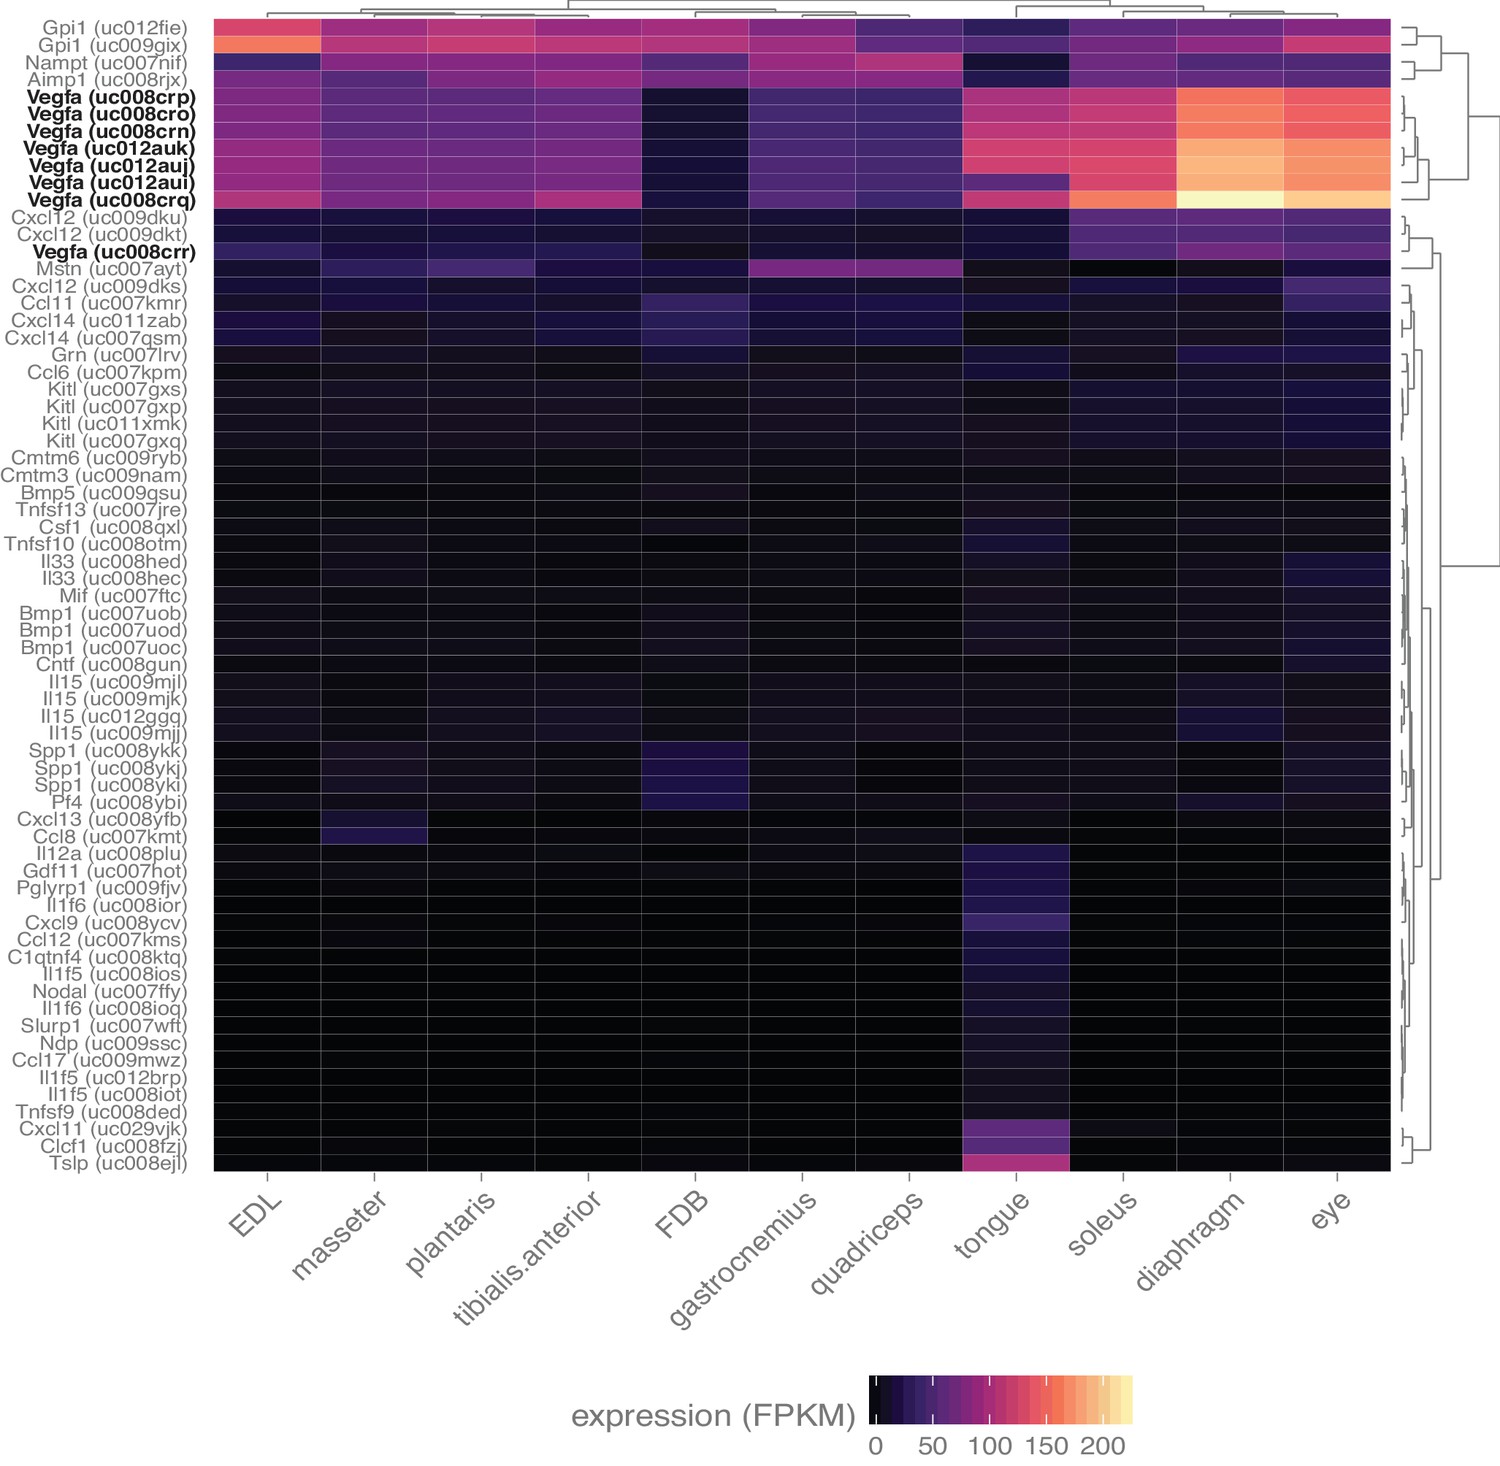
Skeletal muscle expresses numerous myokines.
Heat map representation of the expression of all transcripts annotated with the gene ontology term ‘cytokine activity’ and filtered with a q-value threshold <0.01, minimum expression in at least one tissue >10 FPKM (N = 67 transcripts). A 10-fold higher expression threshold was chosen for this figure to enrich the gene list for highly-expressed transcripts. Dendrograms represent clustering based on similarity by tissue (top) and transcript (right side). All spliceforms of Vegfa (bold, black text) are expressed at notably high levels.
Figure 7—figure supplement 2
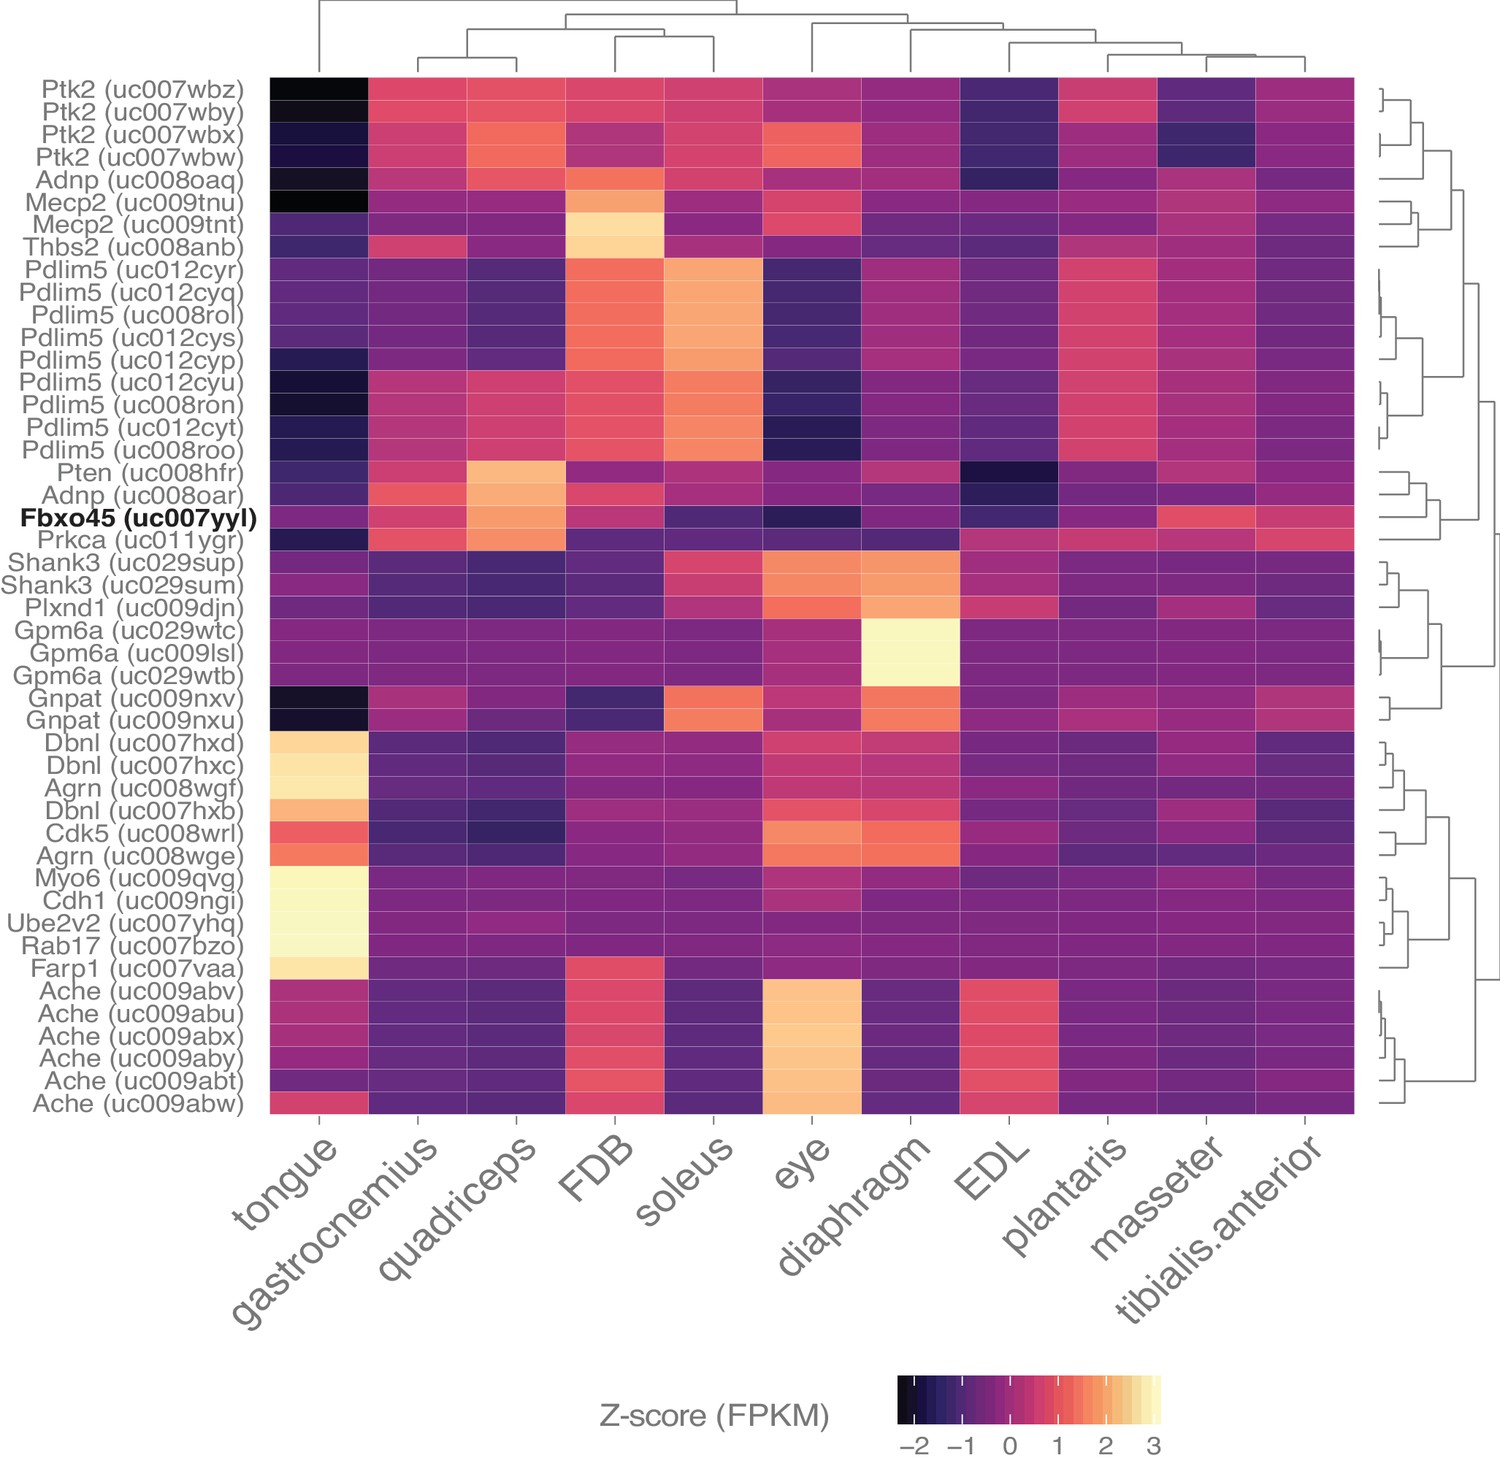
Skeletal muscle expresses many genes involved in synapse assembly.
Heat map representation of the expression of all transcripts annotated with the gene ontology term ‘synapse assembly’ and filtered with a q-value threshold <0.01, minimum expression in at least one tissue >10 FPKM (N = 46 transcripts). A 10-fold higher expression threshold was chosen for this figure to enrich the gene list for highly-expressed transcripts. Dendrograms represent clustering based on similarity by tissue (top) and transcript (right side). Fbxo45 (bold, black text) shows differential expression between skeletal muscles and may be involved in neuromuscular junction formation (Saiga et al., 2009).
Tables
Table 1
The biological samples collected in this study and the total number of aligned RNAseq reads.
https://doi.org/10.7554/eLife.34613.003| Tissue | Type | Species | Sex | Replicates | Aligned reads (Millions) |
|---|---|---|---|---|---|
| Total Aorta | Smooth | Mouse | Male | 6 | 205.2 |
| Abdominal Aorta | Smooth | Mouse | Male | 6 | 219.7 |
| Thoracic Aorta | Smooth | Mouse | Male | 6 | 214.0 |
| Atria | Cardiac | Mouse | Male | 6 | 169.0 |
| Left Ventricle | Cardiac | Mouse | Male | 6 | 193.9 |
| Right Ventricle | Cardiac | Mouse | Male | 6 | 176.2 |
| Diaphragm | Skeletal | Mouse | Male | 6 | 159.1 |
| EDL | Skeletal | Mouse | Male | 6 | 176.8 |
| Extraocular | Skeletal | Mouse | Male | 6 | 171.7 |
| FDB | Skeletal | Mouse | Male | 6 | 202.5 |
| Masseter | Skeletal | Mouse | Male | 6 | 216.2 |
| Plantaris | Skeletal | Mouse | Male | 6 | 185.1 |
| Soleus | Skeletal | Mouse | Male | 6 | 172.2 |
| Tongue | Skeletal | Mouse | Male | 6 | 210.4 |
| Gastrocnemius | Skeletal | Mouse | Male | 6 | 276.1 |
| Quadriceps | Skeletal | Mouse | Male | 6 | 275.6 |
| Tibialis Anterior | Skeletal | Mouse | Male | 6 | 276.6 |
| EDL | Skeletal | Rat | Male | 6 | 226.4 |
| EDL | Skeletal | Rat | Female | 6 | 206.8 |
| Soleus | Skeletal | Rat | Male | 6 | 261.2 |
| Soleus | Skeletal | Rat | Female | 6 | 243.0 |
| Average | 6 | 211.3 | |||
| Total | 126 | 4,437.7 |
Table 2
Transcription factors predicted to be upstream of differentially regulated genes.
https://doi.org/10.7554/eLife.34613.019| Activated TF | Top 25 TFs | Interacts with functionally significant muscle genes: |
|---|---|---|
| SP1 | 11 | AR, Dmd, Foxo3, Hdac2, Hdac3, Hdac4, Hif1a, Kdm5a, Mef2c, Myh7, MylK, NFkB1, Rb1, Rxra, Tp53, Vegf, Vegfa |
| HIF1A | 10 | AR, Acta1, Acta2, Arnt2, Cnntb1, Epas1, Foxo3, Hdac2, Hdac3, Hdac4, Hdac5, Hdac7, Mef2c, Mstn, Myc, Myh1, Myh2, Myh3, Myh4, Myh6, Myl1, MylK2,NFkB (complex), Ppargc1a, Rb1, Rxra, Sp1, Tp53, Ttn, Ucp3, Vegf, Vegfa |
| SMARCA4 | 9 | Acta1, Acta2, Actb, Actl6a, Actn4, AR, Ctnnb1, Dysf, Gli1, Hdac2, Hdac4, Mef2c, Myc, Myh3, Myh7, Myh11, Myl1, Myl4, Myl5, MylK, Mylpf, MyoD1, MyoG, NFkB (complex), Pparg, Rb1, Rxra, Six1, Sp1, Tp53, Tpm1 |
| TCF7L2 | 9 | AR, Ctnnb1, Epas1, Hdac2, Myc, MylK2, Myo6, Ppargc1a, Tp53 |
| ARNT2 | 8 | Epas1, Gli1, Hif1a, Myh6, Myh7, Vegfa |
| CTNNB1 | 8 | Acta2, Actb, Actc1, Actn4, AR, Epas1, Foxo3, Gli1, Hdac2, Hdac3, Hdac4, Hdac5, Hdac7, Myc, Myf5, Myh3, Myh6, Myl4, MylK, MyoD1, MyoG, NFkB (complex), Rxra, Six1, Sp1, Stat5b, Smarca4, Tcf7l2, Tnnc1, Tp53, Vegfa |
| STAT4 | 8 | Myc, NFkB (complex), Smarca4, Vegfa |
| MYC | 7 | Acta1, Actb, Actn1, Actn4, Aimp2, AR, Ctnnb1, Egr2, Epas1, Foxo3, Gli1, Hdac2, Hdac3, Hdac5, Hif1a, Kdm5a, Myh7, Myl9, Mylpf, Myo1B, Myo1C, NFkB (complex), Rb1, Smarca4, Sp1, Stat4, Stat5b, Tcf7l2, Tnni3, Tnnt3, Tp53, Tpm1, Vegf, Vegfa |
| TP53 | 7 | Acta2, Actb, Actn1, Actn4, Aimp2, AR, Ctnnb1, Egr2, Epas1, Foxo3, Gli1, Hdac2, Hdac3, Hdac5, Hif1a, Myc, Myh9, Myh10, Myh16, Myl4, Myl9, MylK, Myo1c, Myo6, Myo10, MyoD1, Myof, NFkB (complex), Ppargc1a, Rb1, Smarca4, Sp1, Tcf7l2, Tp53, Tpm1, Tpm2, Tpm4, Ucp3, Vegf, Vegfa |
| FOXO3 | 6 | AR, Ctnnb1, Egr2, Hdac2, Hif1a, Mef2c, Mstn, Myc, Myo6, MyoC, MyoD1, NFkB (complex), Ppargc1a, Rb1, Sp1, Tp53, Ucp2, Vegfa |
| EGR2 | 6 | Foxo3, Mef2c, Myc, MyoC, Ucp3, Vegfa |
| NFkB (complex) | 6 | Actb, AR, Ctnn1b, Epas1, Hdac2, Hdac3, Hdac4, Hdac5, Hif1a, Mstn, Myc, MylK, MylK3, Myo1E, MyoD1, Stat4, Tp53, Vegfa |
| RB1 | 6 | Actb, Actc1, Actn2, Actn3, AR, Foxo3, Hdac2, Hdac3, Hif1a, Kdm5a, Mef2c, Myc, Mstn, Myh2, Myh4, Myh6, Myh7, Myh8, Myl1, Myl4, Myl6B, MyoD1, MyoM2, NFkB2, PPargc1a, Ryr1, Smarca4, Sp1, Tnnc1, Tnnc2, Tnni2, Tnnt1, Tp53, Tpm1, Tpm2, Vegfa |
| GLI1 | 6 | Arnt2, AR, Ctnnb1, Hdac2, Myc, Mef2c, Rxra, Smarca4, Tp53, Vegfa |
| MEF2C | 6 | Acta1, Actc1, Actn2, AR, Dmd, Egr2, Epas1, Foxo3, Gli1, Hdac3, Hdac4, Hdac5, Hdac7, Hif1a, Mstn, Myh1, Myh6, Myh7, Myl2, Myl4, Myl7, MylK2, Mylpf, MyoD1, MyoG, MyoM1, MyoM2, MyoT, MyoZ1, MyoZ2, Smarca4, Ppargc1a, Rb1, Sp1, Tnnc1, Tnni2, Tnnt2, Tpm1, Ttn, Vegfa |
| STAT5B | 5 | Actc1, AR, Ctnnb1, Myc, Myh1, Myh6, Myh7, Myl1, Myl2, Myl4, Myl7, NFkB (complex), Pparg, Rxra, Tp53, Tnnc1, Tnni1, Tnnt1, Tpm3 |
| PPARGC1A | 5 | AR, Dmd, Epas1, Foxo3, Hdac5, Hif1a, Mef2c, Mstn, Myh6, Myh7, Myl2, MyoD1, MyoG, NFkB (complex), Rxra, Rb1, Tcf7l2, Tnni1, Tp53, Ucp2, Ucp3, Vegfa |
| MYOD1 | 5 | Acta1, Actc1, AR, Ctnnb1, Dmd, Dysf, Foxo3, Hdac3, Hdac4, Hdac5, Mef2c, Mstn, Myf5, Myf6, Myh2, Myh3, Myh7, Myl1, Myl4, Mylpf, Myo5b, NFkB1, Ppargc1a, Rb1, Rxra, Ryr1, Six1, Smarca4, Sp1, Tnnc1, Tnnc2, Tnni1, Tnni2, Tnnt1, Tnnt2, Tnnt3, Tp53, Tpm2, Ttn, Ucp3 |
| EPAS1 | 5 | AR, Arnt2, Ctnnb1, Hif1a, Mef2c, Myc, Myh4, Myo7a, MyoM2, NFkB (complex), Ppargc1a, Smarca4, Sp1, Tcf7l2, Tnni1, Tp53, Ucp2, Vegf, Vegfa |
| Inhibited TF | Top 25 TFs | Interacts with functionally significant muscle genes: |
| KDM5A | 8 | Actc1, Actn2, Actn3, AR, Hdac2, Myc, Myh2, Myh4, Myh6, Myh7, Myh8, Myl1, Myl4, Myl6b, MyoM2, Rb1, Ryr1, Sp1, Tnnc1, Tnnc2, Tnni2, Tnnt1, Tnnt2, Tpm1, Tpm2, Vegf |
Additional files
-
Supplementary file 1
Details on the total number of reads and aligned reads for every replicate sample.
- https://doi.org/10.7554/eLife.34613.025
-
Supplementary file 2
All transcripts differentially expressed among skeletal muscles.
This table uses a statistical cut-off of FDR < 10−6 for one-way ANOVAs among mouse skeletal muscles and minimum expression >1.0 FPKM in at least one tissue. Alternative filtering options are available on http://muscledb.org.
- https://doi.org/10.7554/eLife.34613.026
-
Supplementary file 3
Top 100 genes with the highest correlation with PC1.
This Table expands on Figure 2D.
- https://doi.org/10.7554/eLife.34613.027
-
Supplementary file 4
Genes comprising the most statistically significant modules in WGCNA analysis for smooth, cardiac, skeletal muscle cluster 1, and skeletal muscle cluster 2.
Modules with the highest positive correlation with tissue identity were selected. The number of genes in each module is variable.
- https://doi.org/10.7554/eLife.34613.028
-
Supplementary file 5
Genes comprising the most statistically significant modules in WGCNA analysis for all skeletal muscles.
Modules with the highest positive correlation with tissue identity were selected. The number of genes in each module is variable. We note that not every skeletal muscle tissue had a statistically significant (p<0.01) module.
- https://doi.org/10.7554/eLife.34613.029
-
Supplementary file 6
Genes with the highest specificity index in every tissue.
- https://doi.org/10.7554/eLife.34613.030
-
Supplementary file 7
Comprehensive list of all novel splicing events detected in mouse skeletal muscle and the muscles in which they are found.
At least 10 reads spanning the novel exon:exon junction needed to be observed for inclusion in this list. All *.bed files are available on NCBI’s GEO.
- https://doi.org/10.7554/eLife.34613.031
-
Supplementary file 8
Comprehensive list of all novel splicing events detected in rat skeletal muscle and the muscles in which they are found.
At least 10 reads spanning the novel exon:exon junction needed to be observed for inclusion in this list. All *.bed files are available on NCBI’s GEO.
- https://doi.org/10.7554/eLife.34613.032
-
Supplementary file 9
Differentially expressed genes annotated as being involved in skeletal muscle disease.
- https://doi.org/10.7554/eLife.34613.033
-
Supplementary file 10
Every unique gene that is a candidate myokine.
This Table is distinct from Figure 7—figure supplement 1 in that no filtering based on differential expression was performed, and the filter for minimal expression is less stringent (i.e. FPKM > 1 instead of FPKM > 10).
- https://doi.org/10.7554/eLife.34613.034
-
Transparent reporting form
- https://doi.org/10.7554/eLife.34613.035
Download links
A two-part list of links to download the article, or parts of the article, in various formats.
Downloads (link to download the article as PDF)
Open citations (links to open the citations from this article in various online reference manager services)
Cite this article (links to download the citations from this article in formats compatible with various reference manager tools)
Transcriptional profiling reveals extraordinary diversity among skeletal muscle tissues
eLife 7:e34613.
https://doi.org/10.7554/eLife.34613


