Structural basis of malodour precursor transport in the human axilla
- University of Oxford, United Kingdom
- University of York, United Kingdom
- Unilever Discover, United Kingdom
Figures
Figure 1
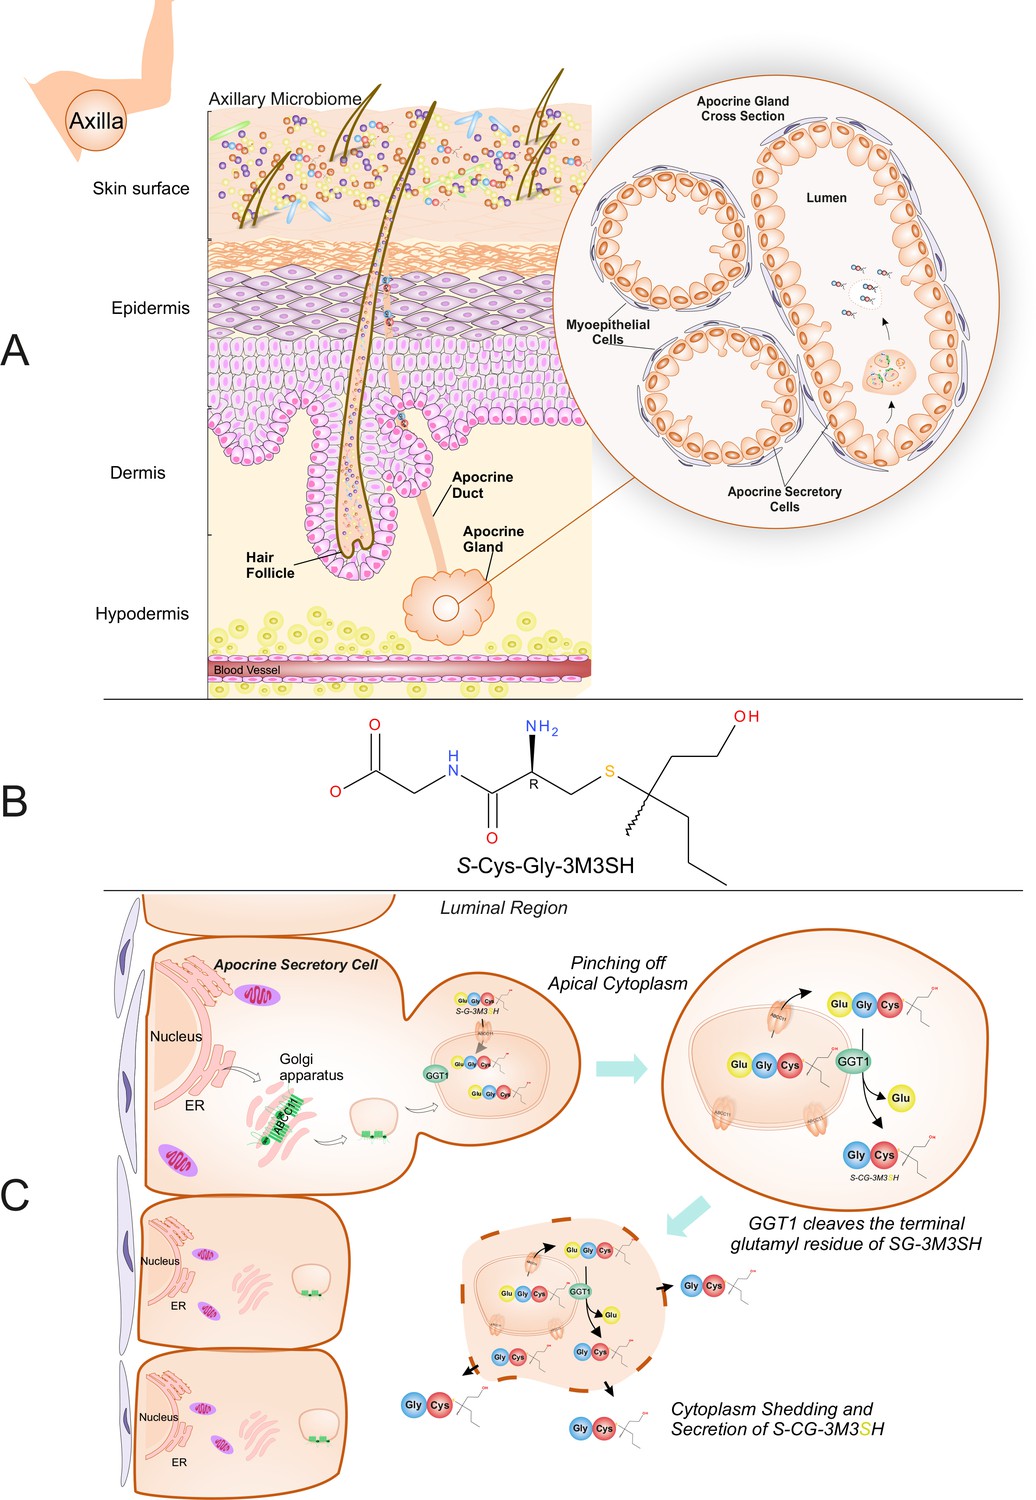
Biochemical route of axillary malodour precursor peptide S-Cys-Gly-3M3SH.
(A) Schematic representation of the axilla. The surface of the skin is composed of the axillary microbiome, typically dominated by either Corynebacterium or Staphylococci. Axillary apocrine glands are subcutaneously located in the hypodermis. Apocrine glands secrete a variety of odourless precursors that are bio-transformed into odorous volatiles by the axillary microbiome. Sulfanylalkanols (e.g. 3-methyl-3-sulfanylhexan-1-ol (3M3SH)) are secreted as cysteinylglycine conjugated peptides (Starkenmann et al., 2005; Emter and Natsch, 2008). Staphylococcus hominis transport and metabolise cysteinylglycine- 3-methyl-3-sulfanylhexan-1-ol (S-Cys-Gly-3M3SH) to liberate the odorous volatile 3M3SH, which is one of the major components of axillary malodour. (B) Chemical structure of the malodour precursor peptide, S-Cys-Gly-3M3SH. (C) Synthesis of S-Cys-Gly-3M3SH. S-Cys-Gly-3M3SH is derived from the glutathione 3-methyl-3-sulfanylhexanol conjugate (SG-3M3SH). SG-3M3SH is actively transported by the ATP-binding cassette transporter sub-family C member 11 (ABCC11) into apocrine secretory vesicles (Baumann et al., 2014b). In the secretory vesicle, S-Gly-3M3SH is bio-transformed by γ-glutamyl transferase 1 (GGT1), which cleaves the terminal glutamyl residue generating S-Cys-Gly-3M3SH. S-Cys-Gly-3M3SH is secreted to the surface of the skin by apocrine secretion, which characteristically involves pinching off the apical cytoplasm and partial shedding releasing intracellular components into the luminal region of the apocrine gland. Upon release the cytoplasm may be recovered and repaired and a new cycle of secretion can occur (Farkaš, 2015).
Figure 2 with 5 supplements
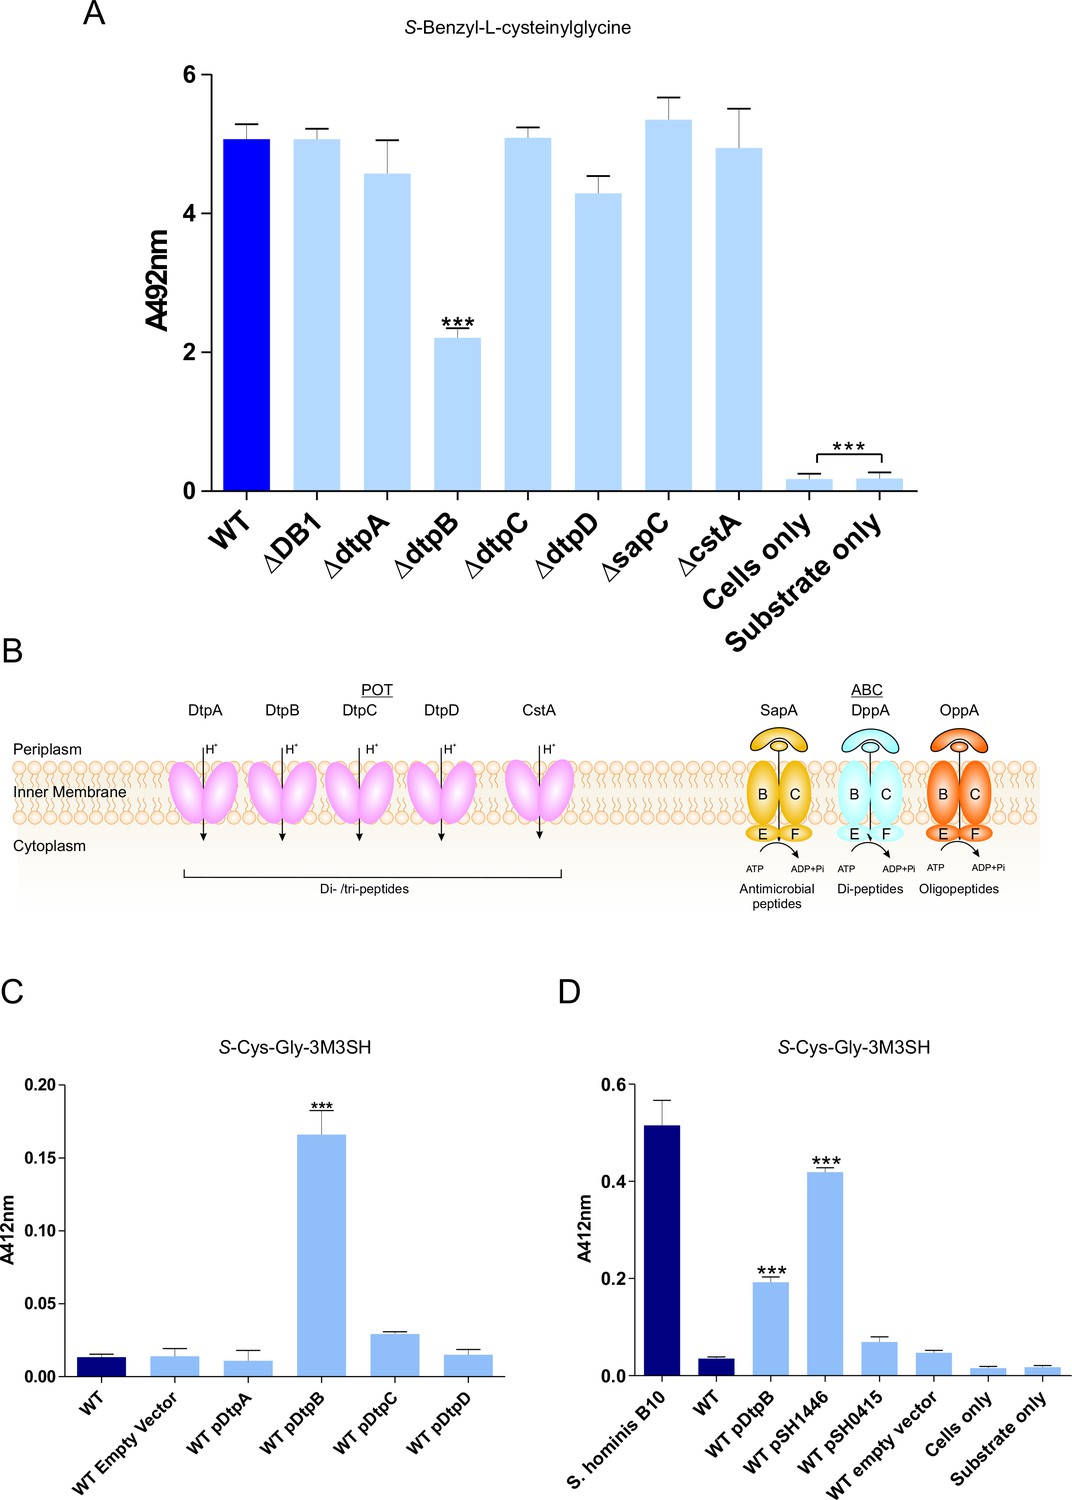
Biotransformation of both model (S-Benzyl-L-cysteinylglycine) and physiological substrate S-Cys-Gly-3M3SH by model organism E.coli K-12.
(A) Biotransformation of S-Benzyl-L-cysteinylglycine by E. coli strains containing deletion in known or predicted peptide transporters. Strain ΔDB1 is an oppA dppA double mutant. Thioalcohol yield (A492) was quantified for each strain using MTS/PMS following 4 hr incubation. (B) Schematic overview of the main peptide transport systems in E. coli. (C) Biotransformation of S-Cys-Gly-3M3SH in E. coli K-12 overexpressing Dtp POT transporter proteins. (D) S-Cys-Gly-3M3SH biotransformation by E. coli K-12 overexpressing S. hominis STAHO0001_1446 (pSH1446) and STAHO0001_0415 (pSH0415). E. coli overexpressing dtpB (pDtpB) is shown for reference. Thioalcohol yield (A412) was quantified using DTNB after 24 hr incubation. Cultures with overexpressing plasmids were pre-induced with 0.0001% L-arabinose overnight. E. coli expressing pBADcLIC2005 with no gene insertion was included as a negative control (Empty vector). Error bars: ±SD (biological triplicates); *p<0.05, **p<0.01, ***p<0.001; One-way ANOVA followed by Dunnett’s Multiple Comparison test.
Figure 2—figure supplement 1
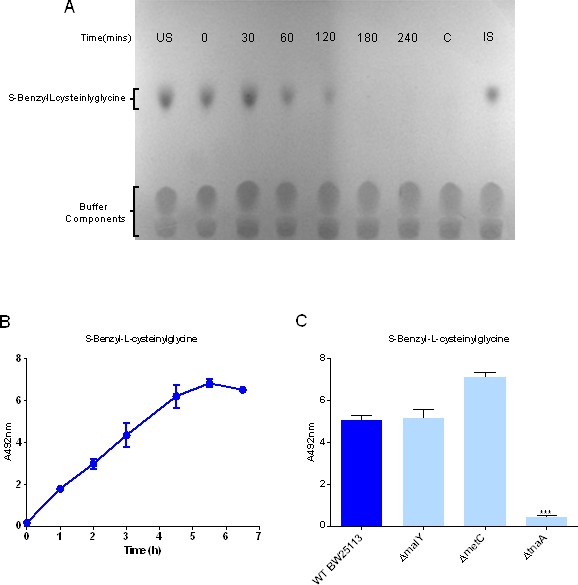
Uptake and biotransformation of thiol-conjugated dipeptides by E.coli K-12.
(A) Thin layer chromatographic analysis of S-Benzyl-L-cysteinylglycine removal by resting E. coli K-12 cells at times indicated up to 240 min. The lane marked ‘US’ is substrate with no cells at time 0 and ‘IS’ is the same sample incubated at 37°C for 5 hr. The lane marked ‘C’ is E. coli cells only incubated for 5 hr in the absence of substrate. (B) Time dependent biotransformation of 2.5 mM S-Benzyl-L-cysteinylglycine by whole cells of E. coli measuring the release of benzyl mercaptan in the supernatant detected using the MTS/PMS assay and measured by the absorbance at 492 nm. Error bars represent standard deviation of three biological replicates. (C) S-Benzyl-L-cysteinylglycine biotransformation by E. coli C-S- β-lyase mutants. Thioalcohol yield (A492) was quantified using MTS/PMS following 4 hr incubation. Error bars represent standard deviation of three biological replicates.
Figure 2—figure supplement 2
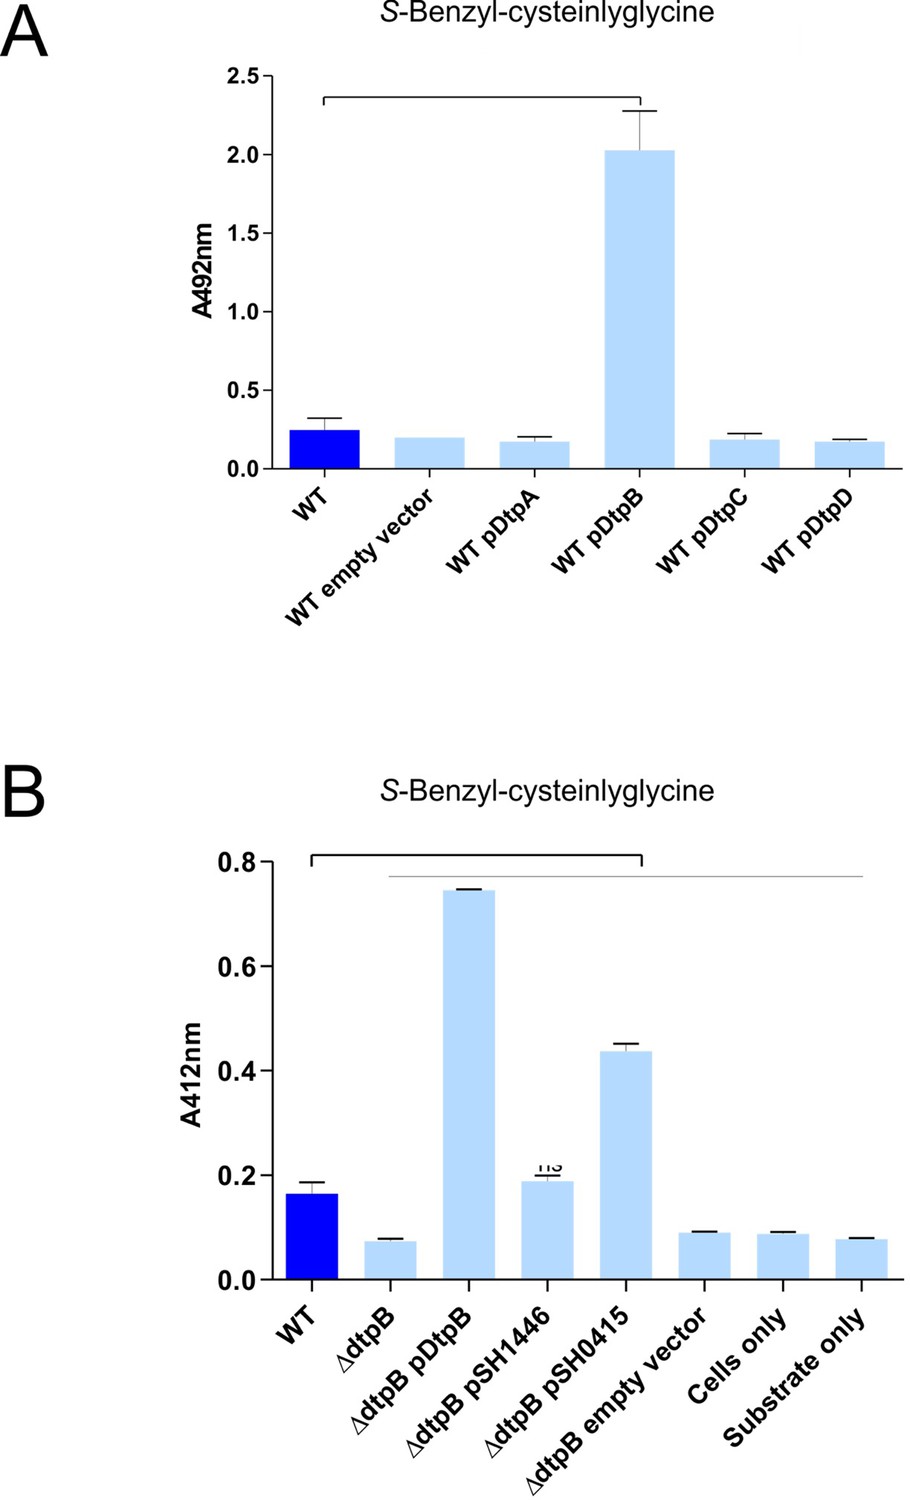
DtpB increases biotransformation of S-Benzyl-L-cysteinylglycine in E. coli K-12, while S. hominis transporter SH1446 does not.
(A) Biotransformation of S-Benzyl-L-cysteinylglycine by E. coli K-12 overexpressing E. coli transporters DtpA, DtpB, DtpC, DtpD. ‘Empty vector’ refers to E. coli expressing pBADcLIC2005 with no gene insertion. Cultures containing strains harbouring plasmids were pre-induced with 0.0001% L-arabinose overnight. 2.5 mM S-Benzyl L-cysteinylglycine was used for all experiments. Thioalcohol yield (A412nm) was quantified using DTNB after 24 hr incubation at 37°C. Cultures with overexpressing plasmids were pre-induced with 0.0001% L-arabinose overnight. E. coli expressing pBADcLIC2005 with no gene insertion was included as a negative control (empty vector). Error bars: ±SD (biological triplicates). (B) Biotransformation of S-Benzyl-L-cysteinylglycine by E. coli strains, following conditions described in part (A), where pSH1446 and pSH0415 are the SH1446 and SH0415 genes cloned into pBADcLIC2005. Error bars: ±SD 635 (biological triplicates).
Figure 2—figure supplement 3

Phylogenetic relationship of staphylococcal SH1446 orthologues.
(A) Genomic context of the S. hominis transporter genes SH1446 and SH0415 in S. hominis SK119. (B) Phylogenetic tree of staphylococci POT transporters. The tree was built using maximum likelihood with best-fit evolutionary model automatically inferred by IQ-TREE v1.5.5 (Trifinopoulos et 632 al., 2015). Blue highlighted subclade denotes malodour producing staphylococci and coloured circle represents presence of two POT’s in the same species.
Figure 2—figure supplement 4
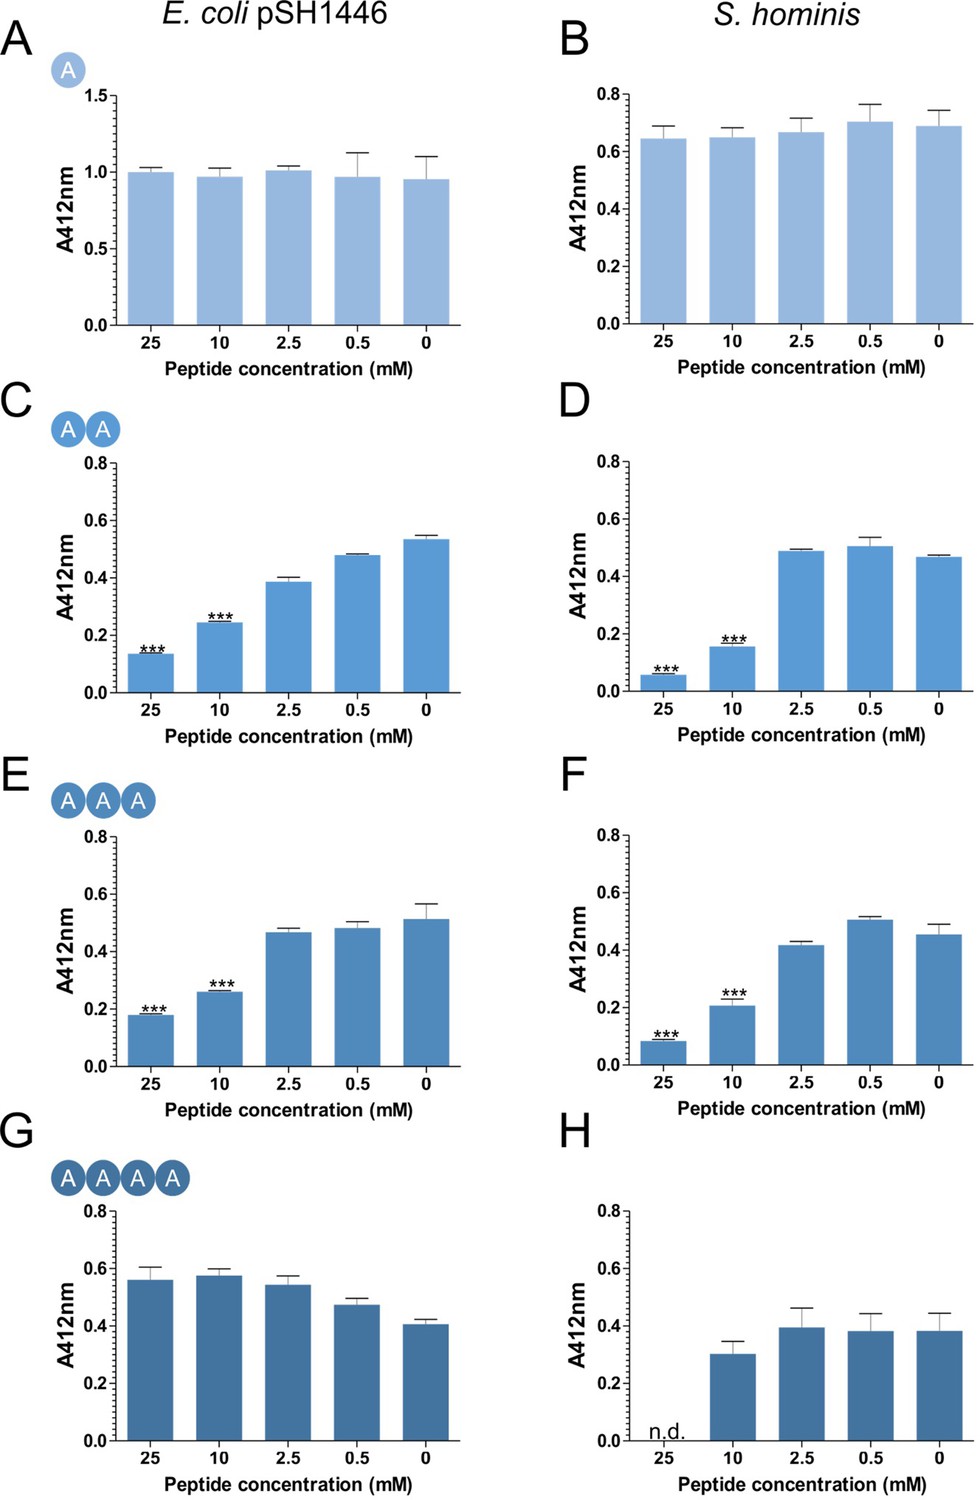
Inhibition of CG-3M3SH biotransformation in the presence of L-Ala peptides.
Biotransformation of CG-3M3SH was determined by the DTNB assay. Cells to an OD600nm five were incubated with 2.5 mM of CG-3M3SH and various concentrations of L-Ala peptide. Thiolacohol yield (A412nm) was quantified after 24 hr at 37°C. E. coli overexpressing SH1446 was pre-induced with 0.0001% arabinose. Results are expressed as mean ± SD of biological triplicates. n.d. indicates not detected, the low pH required to dissolve tetra-Ala inhibited S. hominis resting cells and could not be assayed at 25 mM. Data was analysed using one-way ANOVA followed by Dunnett’s Multiple Comparison test (*p<0.05, **p<0.01, ***p<0.001).
Figure 2—figure supplement 5
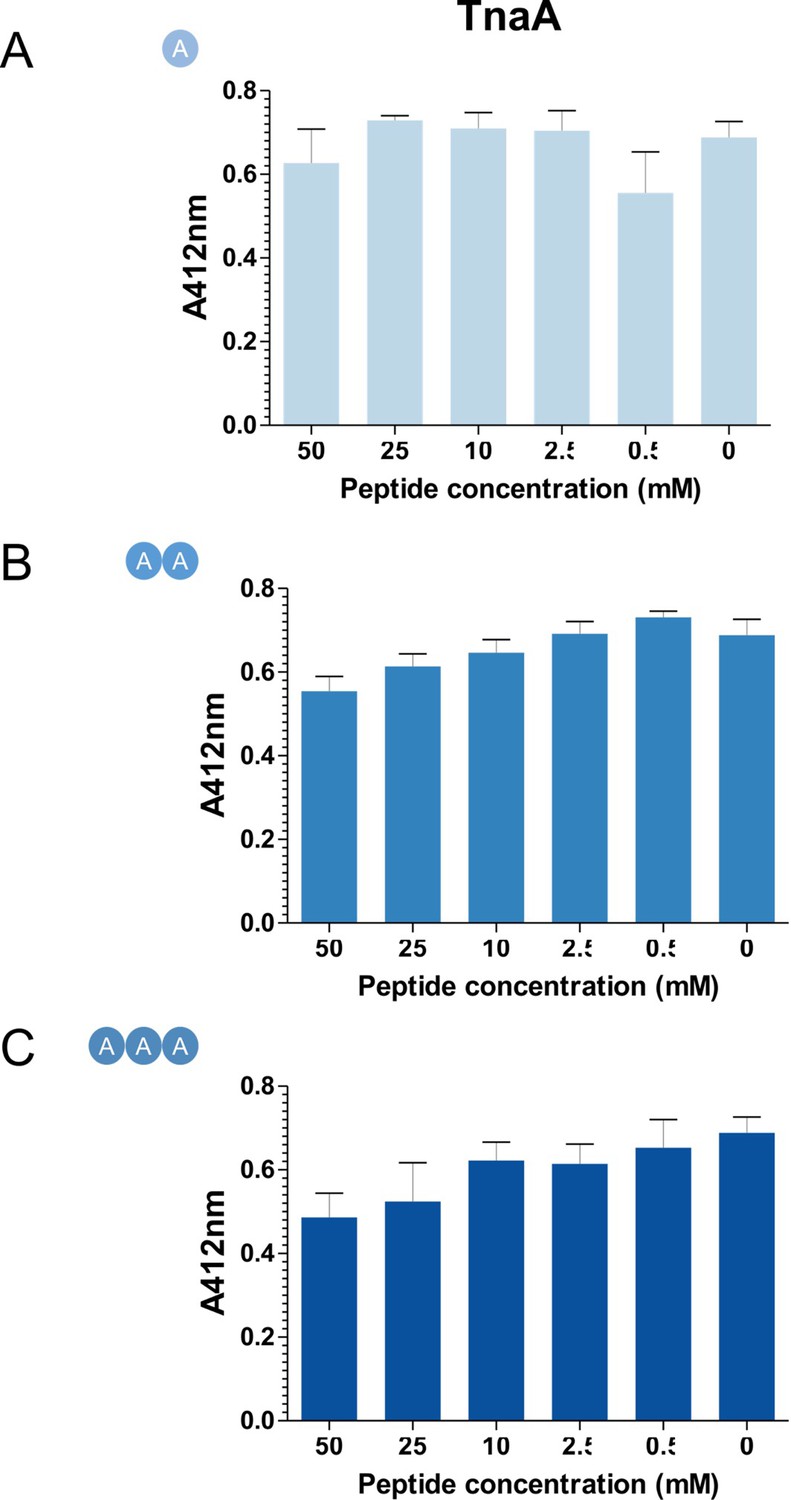
L-Ala peptides do not inhibit in vitro cleavage of Cys-3M3SH by TnaA.
1 μM of purified TnaA and 1 mM Cys-3M3SH substrate was incubated varying concentrations of L-Ala peptides at 37°C for 30 min. 50 μL of the reaction was labelled with DTNB and measured at A412nm. Data are mean of biological triplicates (±SD) and was analysed using one-way ANOVA followed by Dunnett’s Multiple Comparison test (*p<0.05, **p<0.01, ***p<0.001).
Figure 3
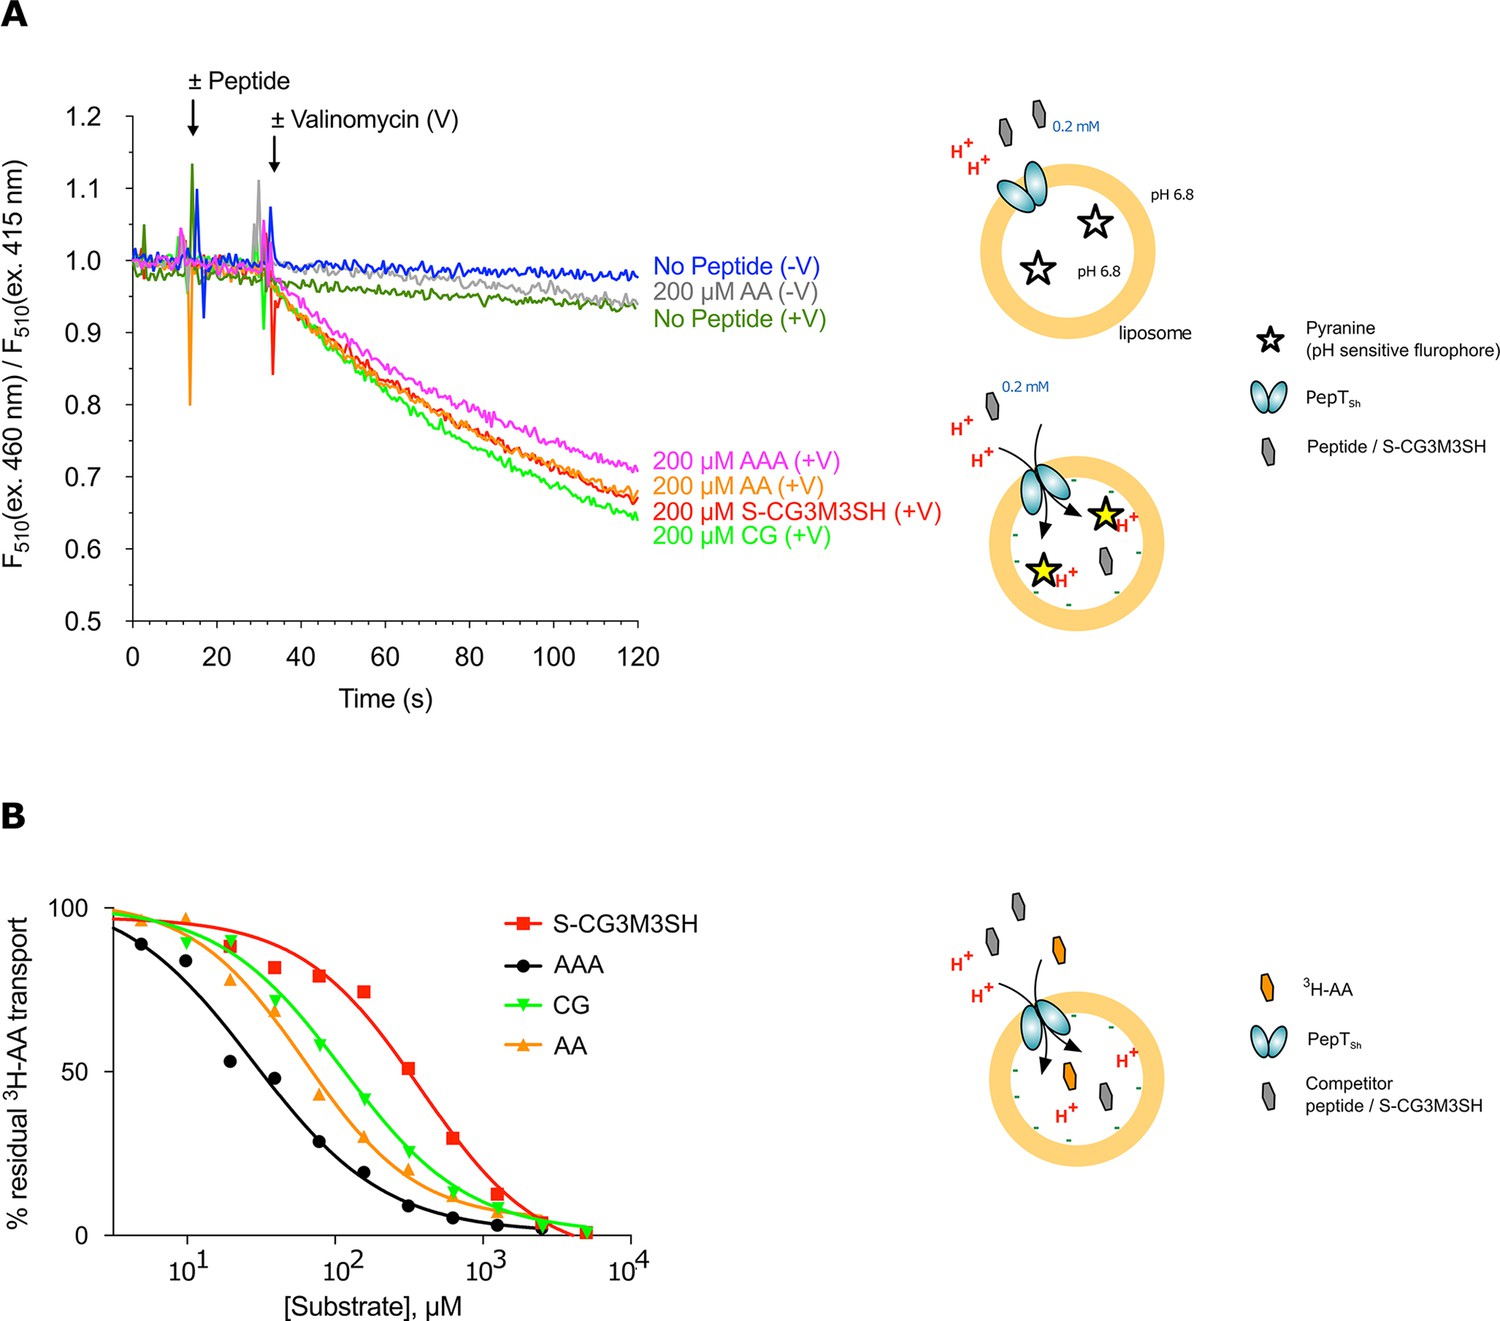
Functional characterisation of PepTSh.
(A) Monitoring proton coupled peptide uptake using a pH sensitive dye. PepTSh was reconstituted into liposomes loaded with pyranine and a high concentration of potassium ions. The external solution contains either peptide, Ala-Ala (orange), Ala-Ala-Ala (purple), Cys-Gly (Green) or S-Cys-Gly-3M3SH (red) and a low potassium concentration. On addition of valinomycin (V) the membrane becomes highly permeable to potassium, generating a hyperpolarised membrane potential (negative inside), which drives the uptake of protons and ligand, protonating the pyranine dye and altering its fluorescent properties. A change in the ratio of fluorescence demonstrates active transport of the ligand. (B) Representative IC50 curves showing the relative affinity of the different ligands shown in A for PepTSh. Assays were set up to measure the ability of competitor peptides to reduce uptake of tritiated di-Alanine (AA) peptide.
Figure 4 with 4 supplements
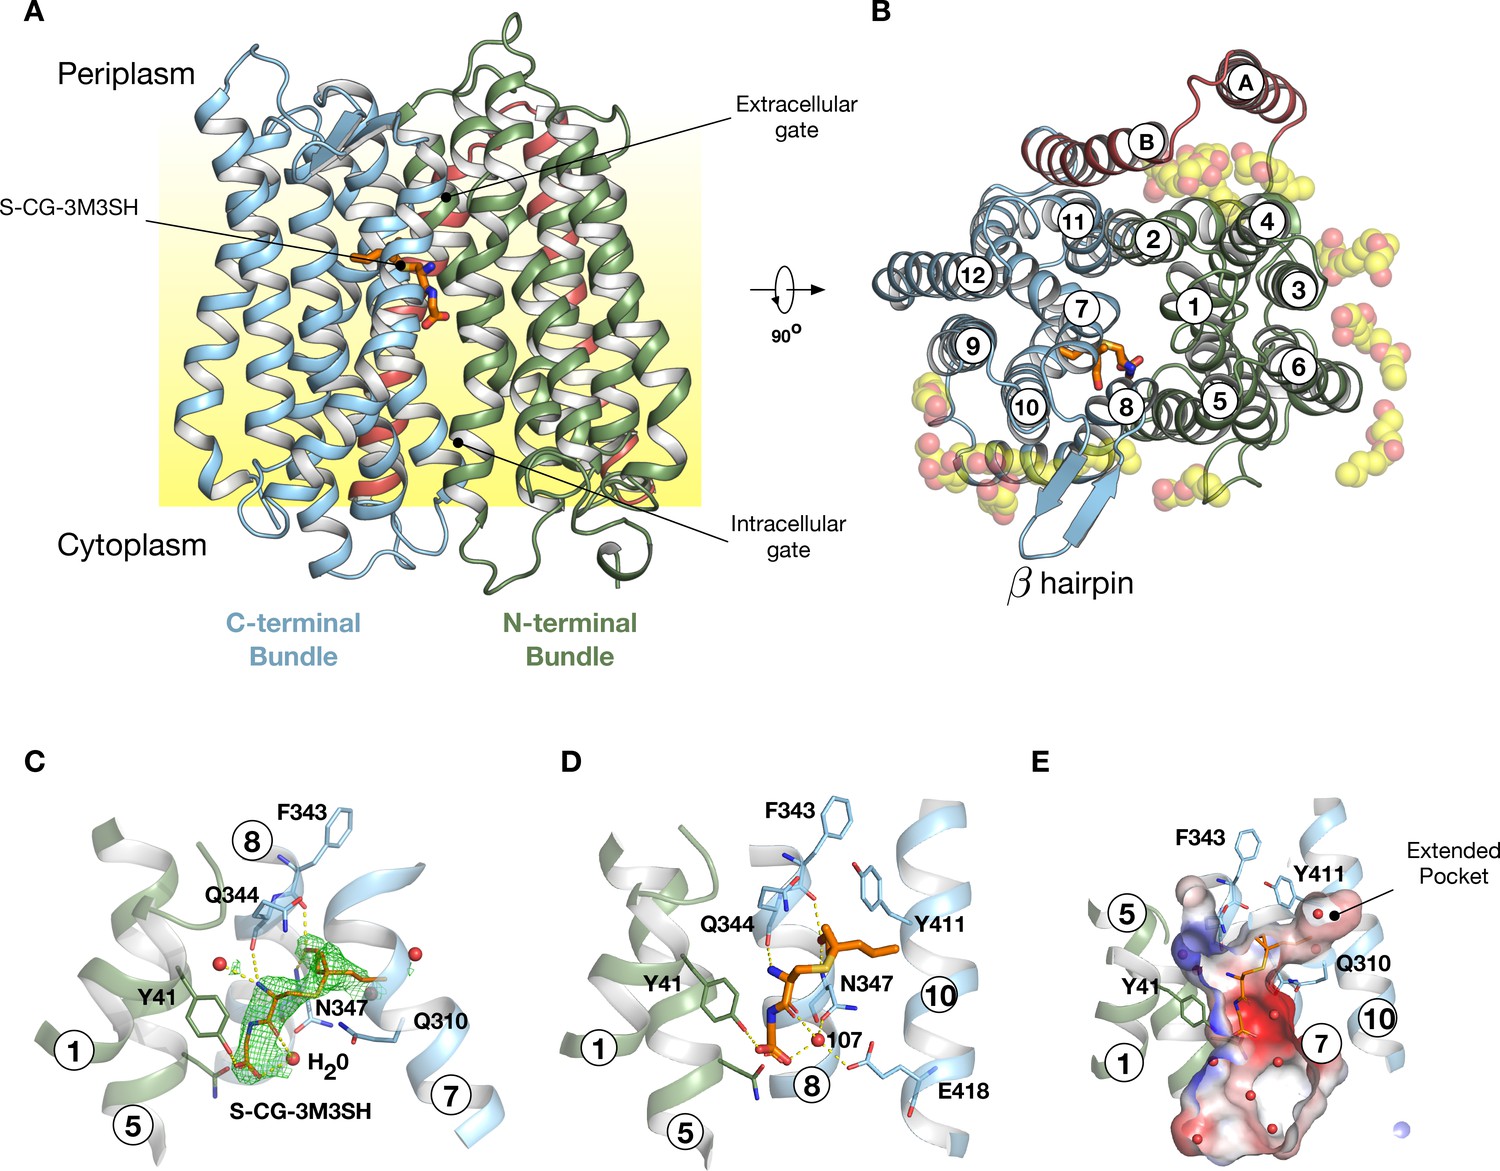
Crystal structure of PepTSh.
(A) Crystal structure of PepTSh shown in the plane of the membrane. Transmembrane helices making up the N-terminal bundle, H1-H6, are coloured green and pack against the C-terminal bundle, helices H7-H12. The bound S-Cys-Gly-3M3SH peptide is shown in sticks. (B) View of A rotated 90 °. The additional helices, HA and HB, can be clearly observed packing to one side of the transporter. The bound lipids are shown as spheres. (C) Zoomed in view of the binding site showing the bound S-Cys-Gly-3M3SH ligand with the mFo-DFc difference electron density map contoured at 3 σ in green mesh. (D) Equivalent view of the binding site showing the location of ordered water molecules in the binding site. (E) View showing the electrostatic surface of the binding site of the transporter with the hydrophobic pocket accommodating the acyl chain of the ligand.
Figure 4—figure supplement 1
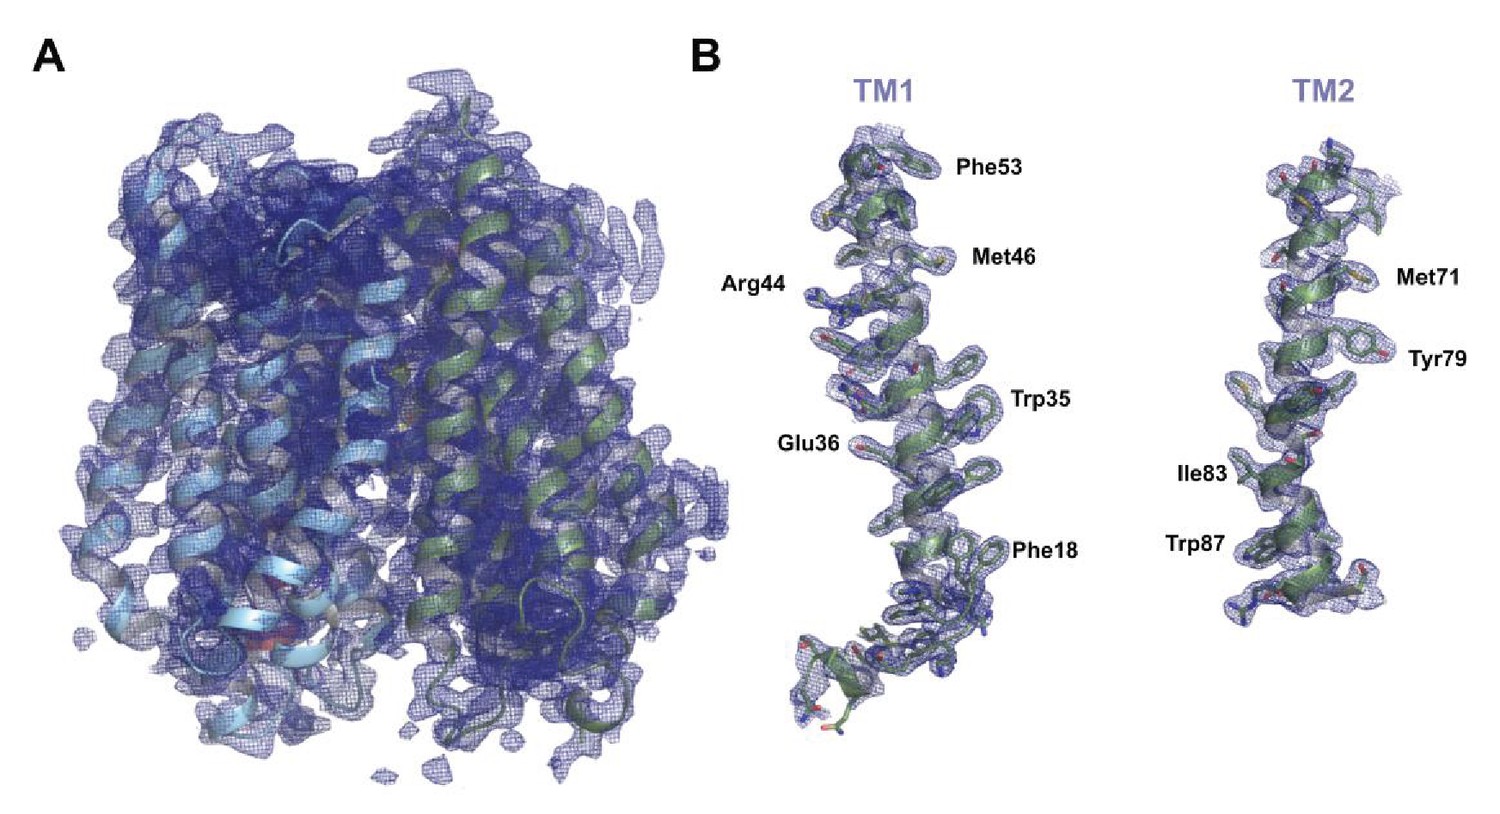
Final refined electron density map for PepTSh.
(A) Final refined 2mFo-DFc electron density map for PepTSh, contoured at 1σ. (B) Zoomed in view of the electron density map for H1 and H2, with specific side chains labelled.
Figure 4—figure supplement 2

Sequence alignment of PepTSh with bacterial species found in the human axilla and human peptide transporters.
Strictly conserved amino acids are shown in red. Similar amino acids are enclosed in blue boxes. The position of Transmembrane helices from PepTSh are highlighted above the protein sequence and coloured according to the structure at the bottom: (A) perspective of the peptide transporter looking down, from the extracellular side of the membrane, (B) cylindrical representation of the transmembrane helices, as viewed from the plane of the membrane, and in the same orientation (C), with cartoon representation of the helices. The conserved motif on helix H10 is highlighted by the dashed black box.
Figure 4—figure supplement 3
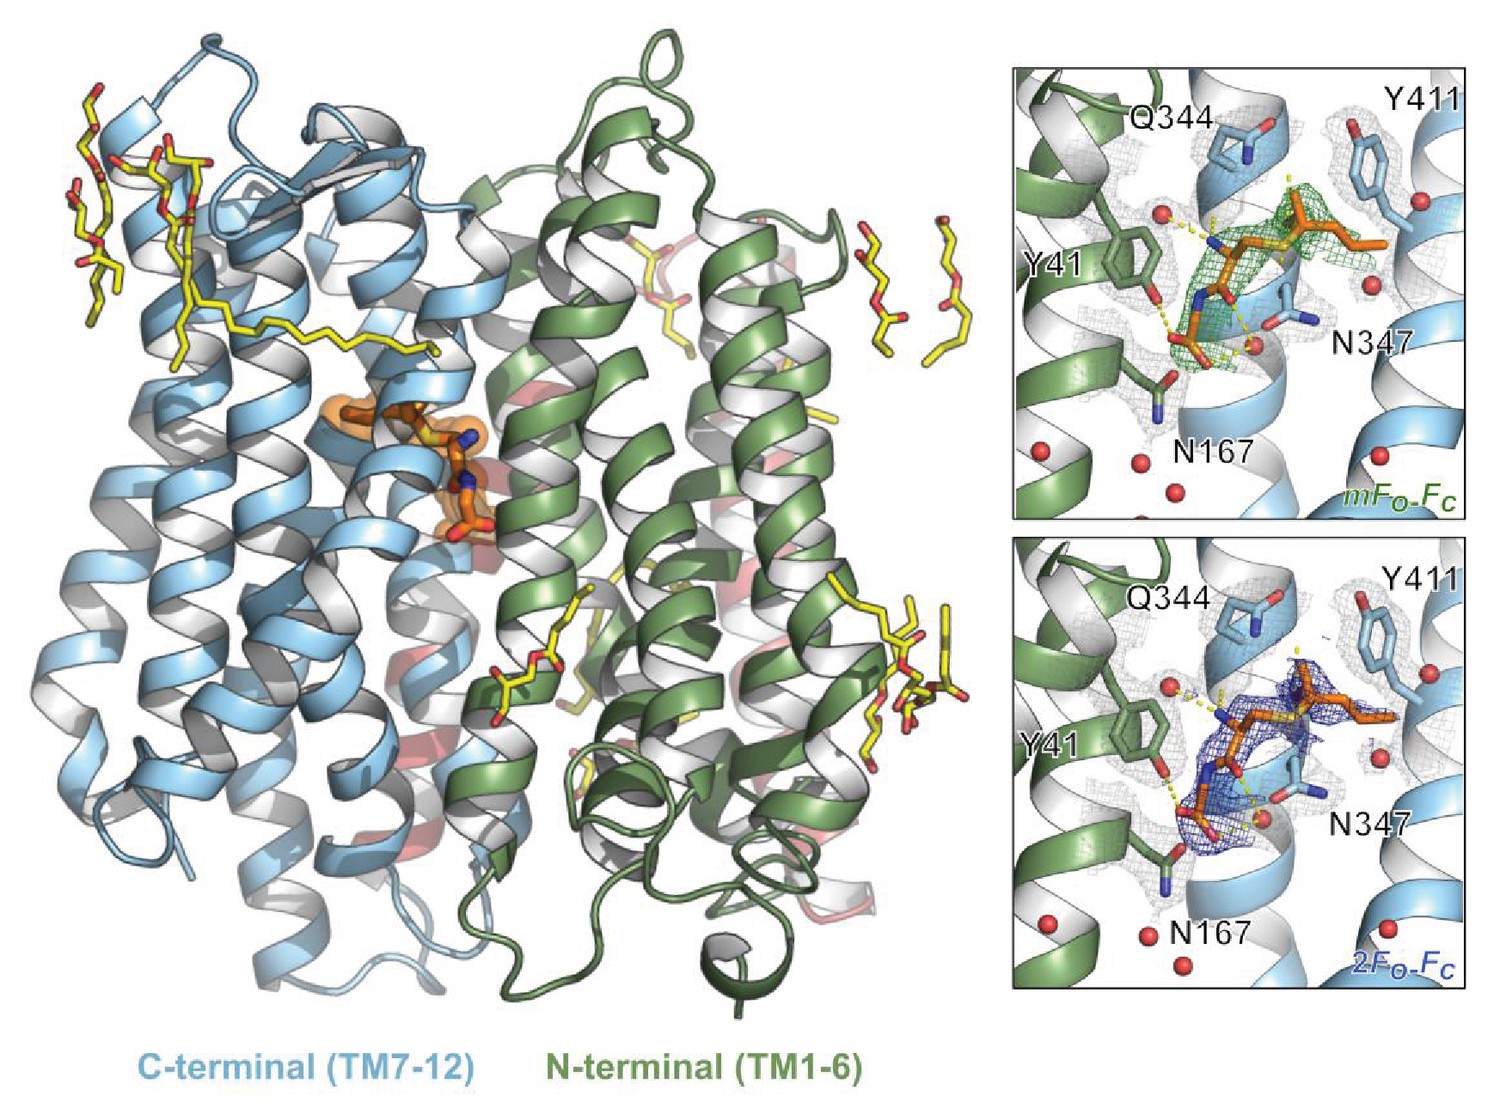
Structure of PepTSh bound to the modified peptide S-Cys-Gly-3M3SH.
Cartoon representation of PepTSh viewed from the plane of the membrane. The N- and C-terminal bundles are coloured green and blue respectively. S-Cys-Gly-3M3SH is modelled as orange sticks against a background of transparent orange spheres showing the molecular volume. Monoolein lipids of varying lengths, as observed by their electron density, are displayed as yellow sticks. Inset: S-Cys-Gly-3M3SH was modelled into experimental difference density (green, mFo–DFc contoured at 3σ) and the final refined density is shown in blue (2mFo–DFc, contoured at 1σ). Key residues in close proximity of S-Cys-Gly-3M3SH are highlighted with their electron density shown in grey, contoured at 1σ. Nearby water molecules were modelled as red spheres.
Figure 4—figure supplement 4
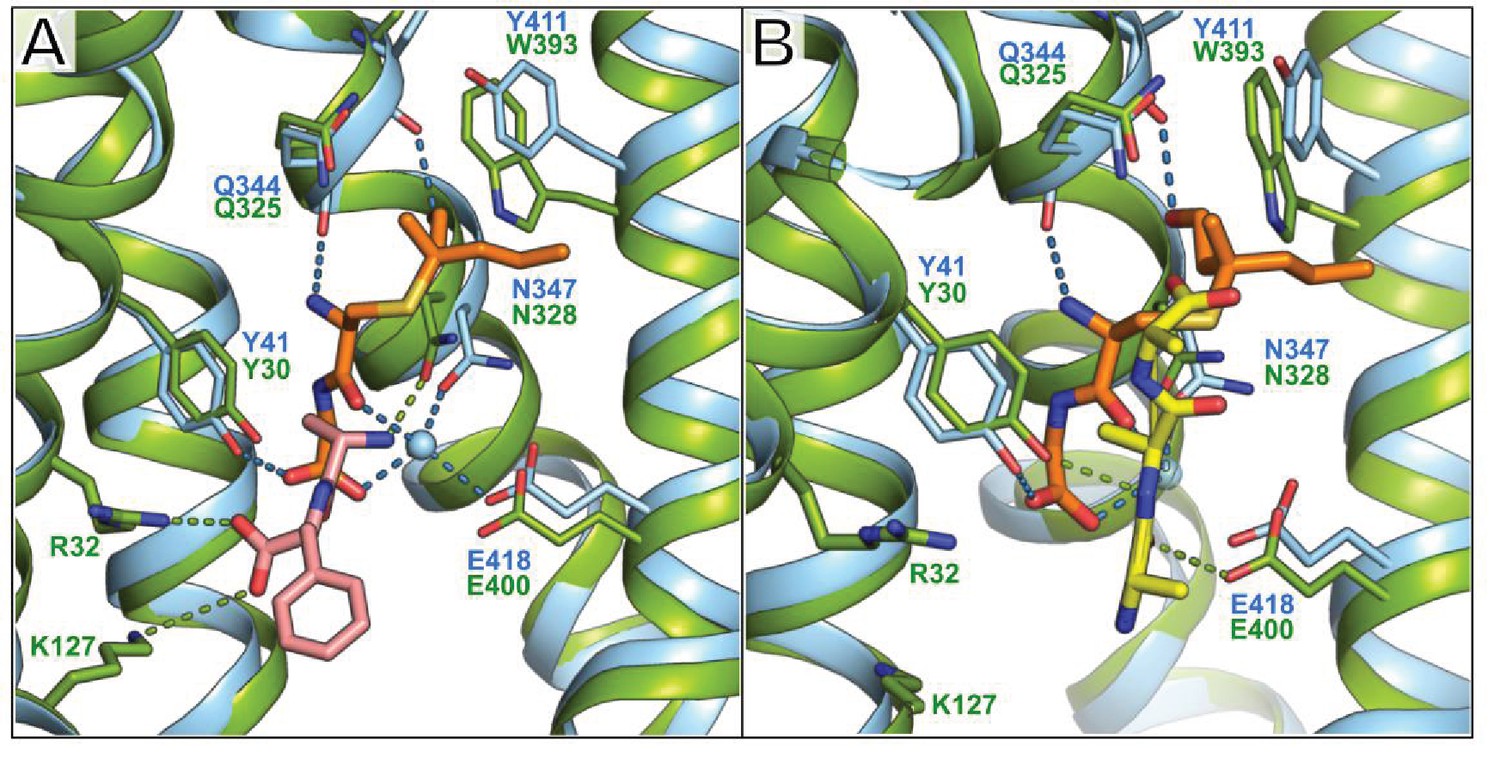
Comparison between the binding position of S-Cys-Gly-3M3SH and the natural di- and tri-peptides co-crystallised with PepTSt.
(A) PepTSh (blue) bound with S-Cys-Gly-3M3SH (orange) overlaid with PepTSt (green) bound with L-Ala-L-Phe (pink sticks) (PDB: 4D2C). (B) Equivalent view of PepTSh in (A) but overlaid with the tri-Ala (yellow sticks) co-crystal structure of PepTSt (PDB: 4D2D). The dipeptide moiety of interacts with the conserved E33xxERxYY41 motif with further interactions through the highly conserved Asn347. Backbone mediated interactions from Gln344 and Phe343 help stabilise the substrate in a vertical orientation.
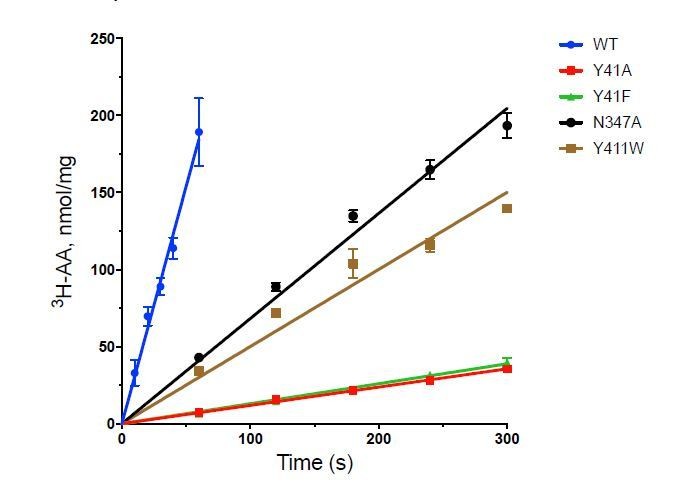
Figure 5
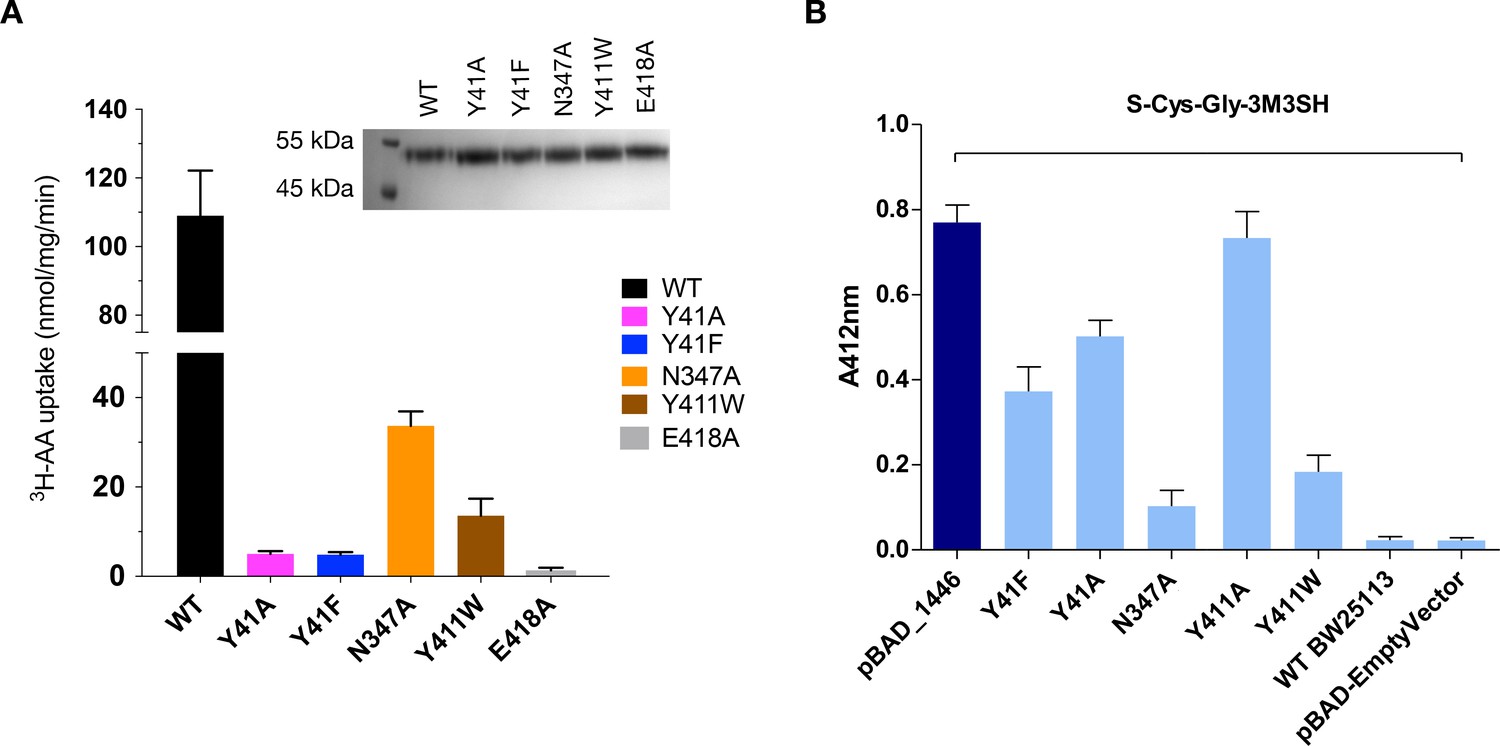
Functional characterisation of binding site residues.
(A) Bar chart showing the di-alanine uptake for the WT and mutant variants of PepTSh. Inset – SDS-PAGE analysis of the reconstituted proteins used in the assay. (B) Biotransformation of S-Cys-Gly-3M3SH by E. coli K-12 (BW25113) overexpressing WT PepTSt (pBAD_1446), or variants indicated, compared to background uptake in non-transformed cells (WT BW25113) and cells harbouring empty plasmid (pBAD-EmptyVector). Error bars: ±SD (biological triplicates).
Figure 6

Overview of transport and intracellular biotransformation of S-Cys-Gly-3M3SH in Staphylococcus hominis.
1. Cys-Gly-(S)−3M3SH is actively transported across the membrane by the di/tri peptide transporter PepTSh along with the movement of protons. 2. A dipeptidase cleaves the terminal glycine residue of S-Cys-Gly-3M3SH producing Cys-(S)−3M3SH. 3. The thiol is liberated from Cys-(S)−3M3SH by a C-S β-lyase that also releases ammonia and pyruvate, the volatile thiol (3M3SH) then diffuses or is exported out the cell. 4.
Author response image 1
Tables
Table 1
Data collection and refinement statistics.
Statistics for the highest-resolution shell are shown in parentheses.
| PepTSh (PDB: 6EXS) | |
|---|---|
| Wavelength | 0.8729 |
| Resolution range | 45.1–2.5 (2.589–2.5) |
| Space group | P 1 21 1 |
| Unit cell | 60.04 55.576 100.866 90 104.749 90 |
| Total reflections | 151797 (14474) |
| Unique reflections | 22501 (2204) |
| Multiplicity | 6.7 (6.6) |
| Completeness (%) | 99.43 (99.73) |
| Mean I/sigma (I) | 9.76 (1.48) |
| Wilson B-factor | 43.87 |
| R-merge | 0.159 (1.28) |
| R-meas | 0.172 (1.39) |
| R-pim | 0.07 (0.54) |
| CC1/2 | 0.997 (0.59) |
| CC* | 0.999 (0.86) |
| Reflections used in refinement | 22504 (2204) |
| Reflections used for R-free | 1137 (110) |
| R-work | 0.21 (0.21) |
| R-free | 0.23 (0.24) |
| CC (work) | 0.88 (0.69) |
| CC (free) | 0.85 (0.52) |
| Number of non-hydrogen atoms | 4063 |
| macromolecules | 3614 |
| ligands | 384 |
| solvent | 65 |
| Protein residues | 487 |
| RMS(bonds) | 0.01 |
| RMS(angles) | 1.04 |
| Ramachandran favored (%) | 98.35 |
| Ramachandran allowed (%) | 1.65 |
| Ramachandran outliers (%) | 0 |
| Rotamer outliers (%) | 1.47 |
| Clashscore | 2.59 |
| Average B-factor | 57.0 |
| macromolecules | 54.72 |
| ligands | 80.53 |
| solvent | 51.2 |
Key resources table
| Reagent type (species) or resource | Designation | Source or reference | Identifiers | Additional information |
|---|---|---|---|---|
| Ggene (Escherichia coli) | dtpA | BW25113 | b1634, ECK1630 | POT transporter family |
| Gene (Escherichia coli) | dtpB | BW25113 | b3496, ECK3481 | POT transporter family |
| Gene (Escherichia coli) | dtpC | BW25113 | b4130, ECK4124 | POT transporter family |
| Gene (Escherichia coli) | dtpD | BW25113 | b0709, ECK0698 | POT transporter family |
| Gene (Escherichia coli) | tnaA | BW25113 | b3708, ECK3701 | Tryptophanase |
| Gene (Staphylococcus hominis) | SH1446 | SK119 | STAHO0001_1446 (GenBank: EEK12089.1) | POT transporter family |
| Gene (Staphylococcus hominis) | SH0415 | SK119 | STAHO0001_0415 (GenBank: EEK11635.1) | MFS transporter family |
| Strain, strain background (Escherichia coli) | BW25113 | Baba et al., 2006 | F-, Δ(araD-araB)567, ΔlacZ4787(::rrnB-3), lambda-, rph-1, Δ(rhaD-rhaB)568, hsdR514 | |
| Strain, strain background (Escherichia coli) | JW1237 | Baba et al., 2006 | ΔoppC::kanR | |
| Strain, strain background (Escherichia coli) | JW3511 | Baba et al., 2006 | ΔdppC::kanR | |
| Strain, strain background (Escherichia coli) | JW1626 | Baba et al., 2006 | ΔdtpA::kanR | |
| Strain, strain background (Escherichia coli) | JW3463 | Baba et al., 2006 | ΔdtpB::kanR | |
| Strain, strain background (Escherichia coli) | JW4091 | Baba et al., 2006 | ΔdtpC::kanR | |
| Strain, strain background (Escherichia coli) | JW0699 | Baba et al., 2006 | ΔdtpD::kanR | |
| Strain, strain background (Escherichia coli) | JW3686 | Baba et al., 2006 | ΔtnaA::kanR | |
| Strain, strain background (Escherichia coli) | JW2975 | Baba et al., 2006 | ΔmetC::kanR | |
| Strain, strain background (Escherichia coli) | JW1614 | Baba et al., 2006 | ΔmalY::kanR | |
| Strain, strain background (Escherichia coli) | JW1285 | Baba et al., 2006 | ΔsapC::kanR | |
| Strain, strain background (Escherichia coli) | JW0590 | Baba et al., 2006 | ΔcstA::kanR | |
| Strain, strain background (Escherichia coli) | ΔoppC | This study. KanR removed from parent strain | ΔoppC | |
| Strain, strain background (Escherichia coli) | ΔdppC | This study. KanR removed from parent strain | ΔdppC | |
| Strain, strain background (Escherichia coli) | ΔdtpA | This study. KanR removed from parent strain | ΔdtpA | |
| Strain, strain background (Escherichia coli) | ΔdtpB | This study. KanR removed from parent strain | ΔdtpB | |
| Strain, strain background (Escherichia coli) | ΔdtpC | This study. KanR removed from parent strain | ΔdtpC | |
| Strain, strain background (Escherichia coli) | ΔdtpD | This study. KanR removed from parent strain | ΔdtpD | |
| Strain, strain background (Escherichia coli) | ΔtnaA | This study. KanR removed from parent strain | ΔtnaA | |
| Strain, strain background (Escherichia coli) | ΔDB1 | This study. KanR removed from parent strain | ΔoppC ΔdppC | |
| Strain, strain background (Staphylococcus hominis) | SK119 | Taxonomy ID: 629742 (Accession: PRJNA34087) | ||
| Strain, strain background | C43(DE3) | Miroux and Walker, 1996 | ||
| Strain, strain background | pWaldo-GFPe | Drew et al., 2001 | ||
| Genetic reagent (Escherichia coli) | pBADcLIC2005 | Geertsma and Poolman, 2007 | pBAD vector modified with LIC cassette, PBAD | |
| Genetic reagent (Escherichia coli) | pKD46 | Datsenko and Wanner, 2000 | Contains KanR cassette | |
| Genetic reagent (Escherichia coli) | pCP20 | Cherepanov and Wackernagel, 1995 | FLP+, pSC101 origin, λ cI857+, λ pR Repts, AmpR, CmR | |
| Recombinant DNA reagent | pBADcLIC-dtpA | This study. Cloned using primers in Supplementary file 1 | ||
| Recombinant DNA reagent | pBADcLIC-dtpB | This study. Cloned using primers in Supplementary file 1 | ||
| Recombinant DNA reagent | pBADcLIC-dtpC | This study. Cloned using primers in Supplementary file 1 | ||
| Recombinant DNA reagent | pBADcLIC-dtpD | This study. Cloned using primers in Supplementary file 1 | ||
| Recombinant DNA reagent | pBADcLIC-SH0415 | This study. Cloned using primers in Supplementary file 1 | ||
| Recombinant DNA reagent | pBADcLIC-SH1446 | This study. Cloned using primers in Supplementary file 1 | ||
| Peptide, recombinant protein | SH1446 | This study. Purified from E. coli BW25113 containing pBADcLIC-SH1446 | ||
| Peptide, recombinant protein | TnaA | This study. Purified from E. coli BW25113 containing pBADcLIC-TnaA | ||
| Chemical compound, drug | S-Cys-Gly-3M3SH | Peakdale Molecular (UK) | Custom made malodour substrates | |
| Chemical compound, drug | L-Ala | Sigma-Aldrich (St. Louis, MO, USA) | A7627 | |
| Chemical compound, drug | L-Ala-Ala | Sigma-Aldrich (St. Louis, MO, USA) | A9502 | |
| Chemical compound, drug | L-Ala-Ala-Ala | Sigma-Aldrich (St. Louis, MO, USA) | A9627 | |
| Chemical compound, drug | L-Ala-Ala-Ala-Ala | Cambridge Biosciences | H-1260.0250 | |
| Chemical compound, drug | n-Decyl-β-D-maltopyranoside | Anatrace | D322LA | |
| Chemical compound, drug | n-Dodecyl-β-D-maltoside | Anatrace | D310LA | |
| Chemical compound, drug | Nickel-NTA Superflow resin | ThermoFisher | 88221 |
Additional files
-
Supplementary file 1
List of strains used in this study
- https://doi.org/10.7554/eLife.34995.019
-
Supplementary file 2
List of plasmids used in this study
- https://doi.org/10.7554/eLife.34995.020
-
Supplementary file 3
List of oligonucleotides used in this study
- https://doi.org/10.7554/eLife.34995.021
-
Transparent reporting form
- https://doi.org/10.7554/eLife.34995.022
Download links
A two-part list of links to download the article, or parts of the article, in various formats.
Downloads (link to download the article as PDF)
Open citations (links to open the citations from this article in various online reference manager services)
Cite this article (links to download the citations from this article in formats compatible with various reference manager tools)
Structural basis of malodour precursor transport in the human axilla
eLife 7:e34995.
https://doi.org/10.7554/eLife.34995


