Single-color, ratiometric biosensors for detecting signaling activities in live cells
- University of California, San Diego, United States
- Johns Hopkins University, United States
- Johns Hopkins University School of Medicine, United States
- University of Maryland Baltimore, United States
Figures
Figure 1 with 8 supplements
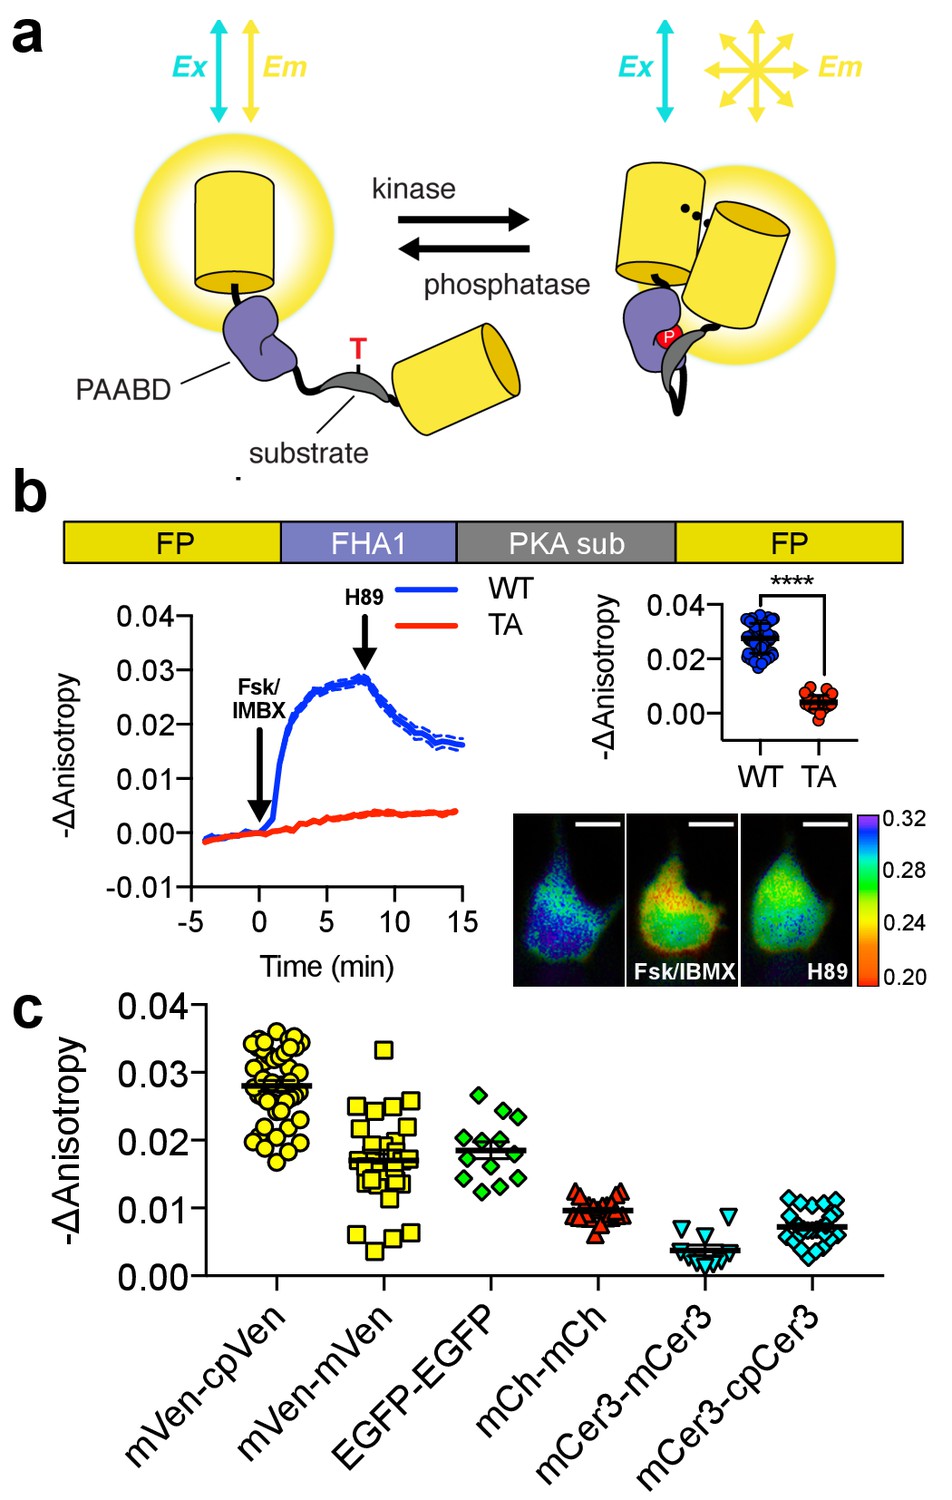
Design and characterization of FLARE AKAR.
(a) Schematic of a kinase activity FLARE (b) Diagram illustrating domain structure of FLARE-AKAR (top). Time-course of mean fluorescence anisotropy of Venus-cp172Venus FLARE-AKAR wild type (blue, N = 44) and kinase insensitive T-to-A mutant (red, N = 38) expressed in HEK293T cell, stimulated with 50 μM forskolin and 100 μM IBMX at t = 0 min, and 20 μM H-89 at t = 24 min (left). Dashed lines above and below represent standard error of the mean. Changes in anisotropy upon Fsk/IBMX stimulation for both FLARE-AKAR WT and T-to-A mutant (upper right, two-tailed t-test, p<0.0001), calculated as the difference between the mean anisotropy from t = 5 min to t = 7.5 min and the mean anisotropy of the baseline before drug addition. The mean for each is shown, with the error reflecting the standard error of the mean. Representative anisotropy pseudocolor image before Fsk/IBMX stimulation (t = 0 min), after Fsk/IBMX stimulation (t = 7.5 min), and after inhibition of PKA with H-89 (t = 24 min) (lower right) (c) Comparison of the magnitude of the anisotropy change for different color variants of FLARE-AKAR upon stimulation with Fsk/IBMX including Venus-cp172Venus AKAR (N = 44), Venus-Venus FLARE AKAR (N = 32), EGFP-EGFP FLARE AKAR (N = 13), mCh-mCh FLARE AKAR (N = 22), mCerulean3 FLARE-AKAR (N = 10), and mCerulean3-cp173Cerulean FLARE-AKAR (N = 26). The mean for each is shown, with the error reflecting the standard error of the mean.
-
Figure 1—source data 1
FLARE AKAR characterization.
(a) Sheet 1, Figure 1b Time Course. Time course for mVenus-cp17Venus FLARE AKAR, wild type and kinase-inactive threonine-alanine (TA) mutant. (b) Sheet 2, Figure 1b Summary: Comparison of magnitude of responses for individual cells for Venus-cp172Venus FLARE AKAR, wild type and kinase-inactive threonine-alanine (TA) mutant, as well as statistics comparing the two groups. (c) Sheet 3, Figure 1c. Summary of magnitude of responses for various color variants of FLARE AKAR after stimulation with forskolin and IBMX.
- https://cdn.elifesciences.org/articles/35458/elife-35458-fig1-data1-v3.xlsx
Figure 1—figure supplement 1
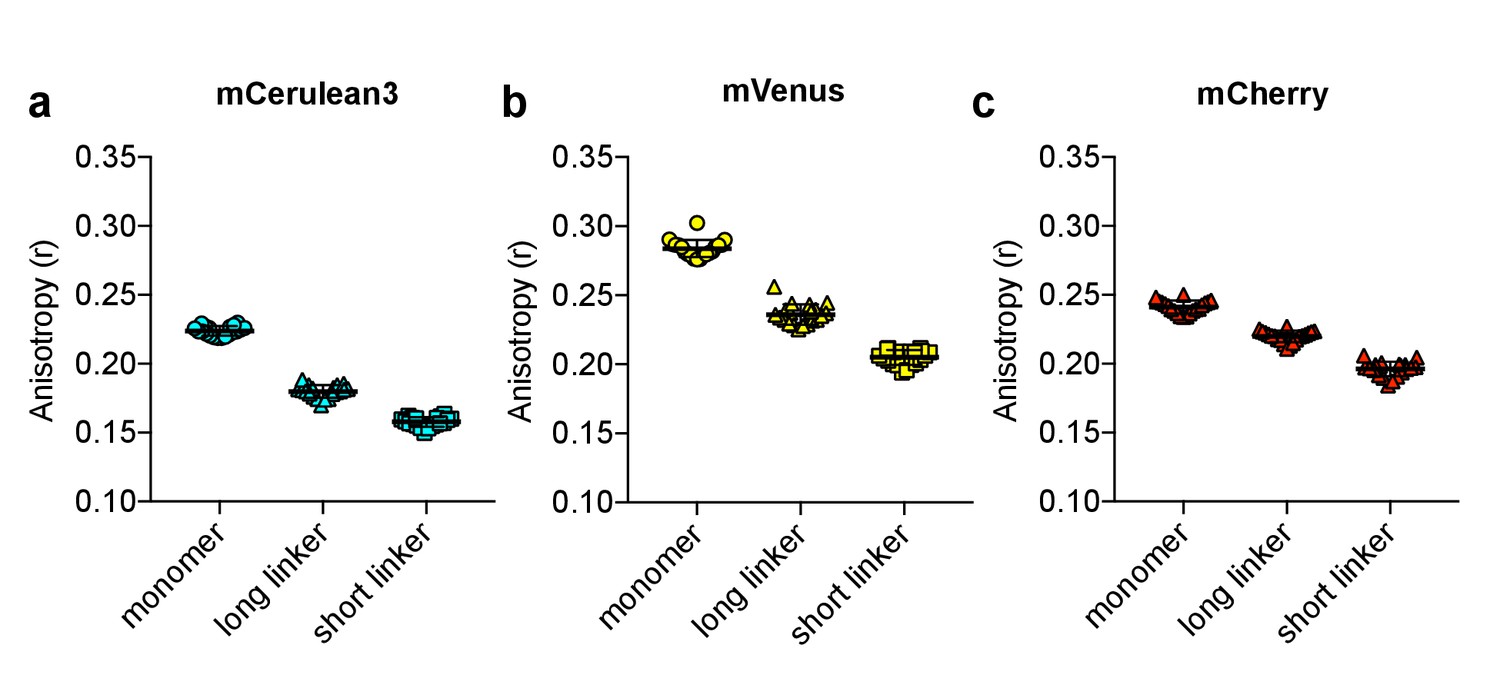
Anisotropy vs. intramolecular distance.
Anisotropy measurements of monomer, as well as tandem dimers separated by either a long (44 amino acid) or a short (10 amino acid) linker, of (a) mCerulean3, (b) mVenus, and (c) mCherry. The mean for each is shown, with the error reflecting the standard error of the mean.
Figure 1—figure supplement 2
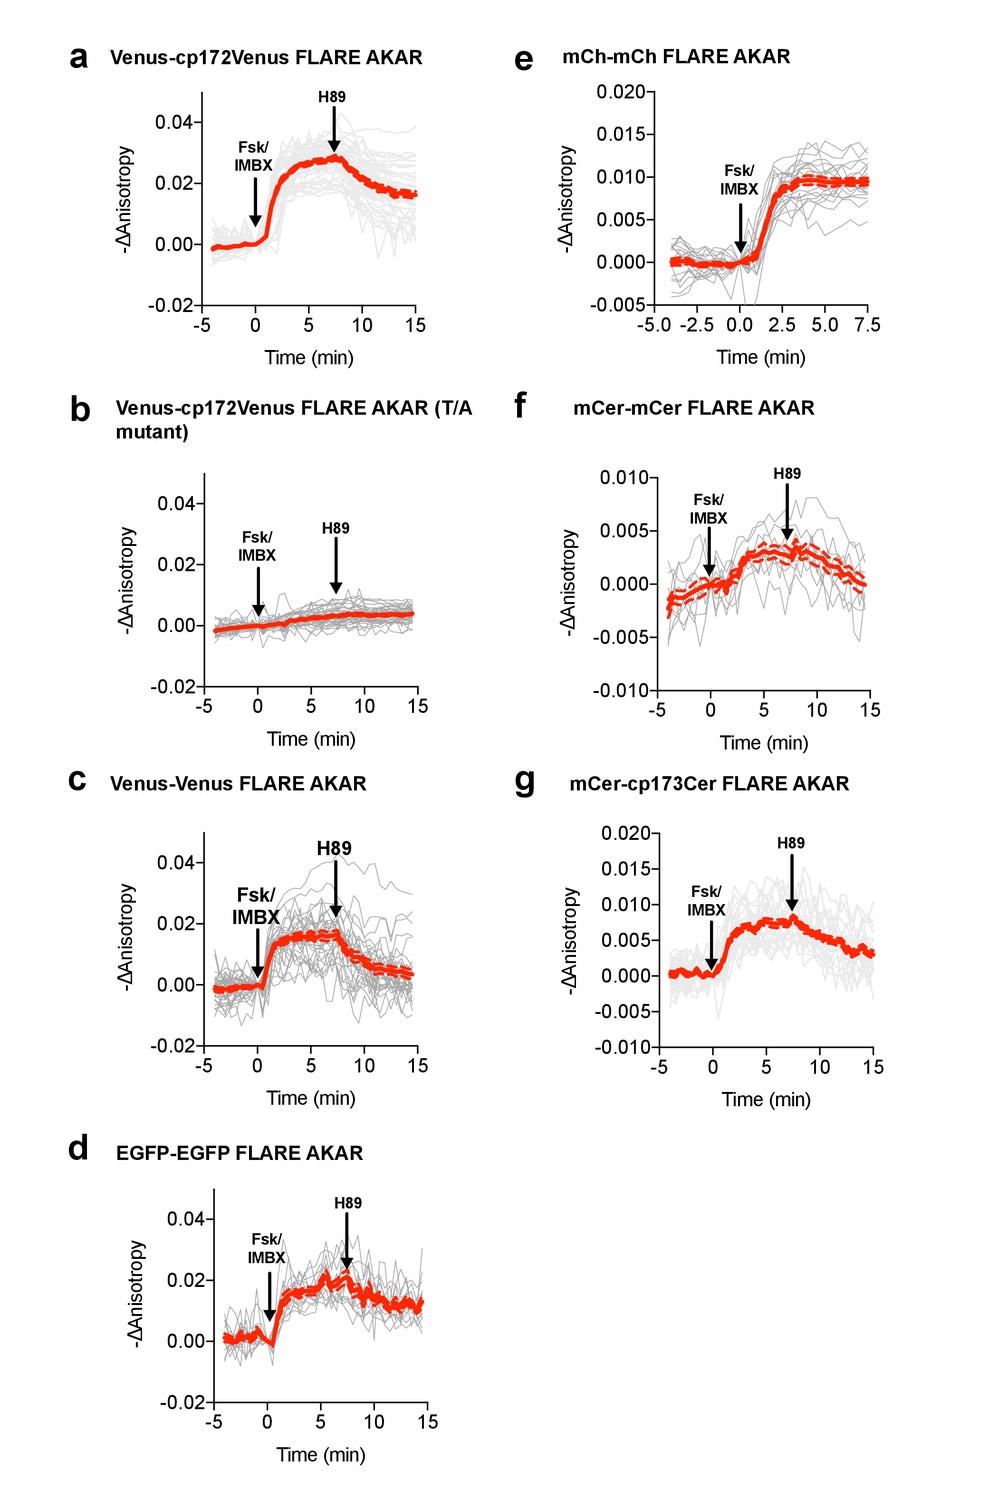
Individual and average traces for FLARE-AKAR panel.
Individual and average traces for FLARE-AKAR variants, including (a) Venus-cp172Venus AKAR (N = 44), (b) Venus-cp172Venus FLARE-AKAR T/A mutant (N = 38), (c) Venus-Venus FLARE AKAR (N = 32), (d) EGFP-EGFP FLARE AKAR (N = 13), (e) mCh-mCh FLARE AKAR (N = 22), (f) mCerulean3-mCerulean3 FLARE-AKAR (N = 10), and (g) mCerulean3-cp173Cerulean FLARE-AKAR (N = 26). Gray lines are individual cell traces, while the red solid line is the average curve. Red dotted lines represent the average curve plus or minus the standard error of the mean.
Figure 1—figure supplement 3

Anisotropy change vs expression level.
Scatter plots showing the relationship between the magnitude of the anisotropy change after treatment with 50 μM forskolin and 100 μM IBMX and the initial intensity for (a) Venus-cp172Venus FLARE AKAR and (b) mCherry-mCherry FLARE AKAR, in HEK293T cells. The magnitude of the signal was calculated by taking the mean anisotropy from t = 5 min to t = 7.5 min and subtracting the mean anisotropy of the baseline before drug addition.
Figure 1—figure supplement 4
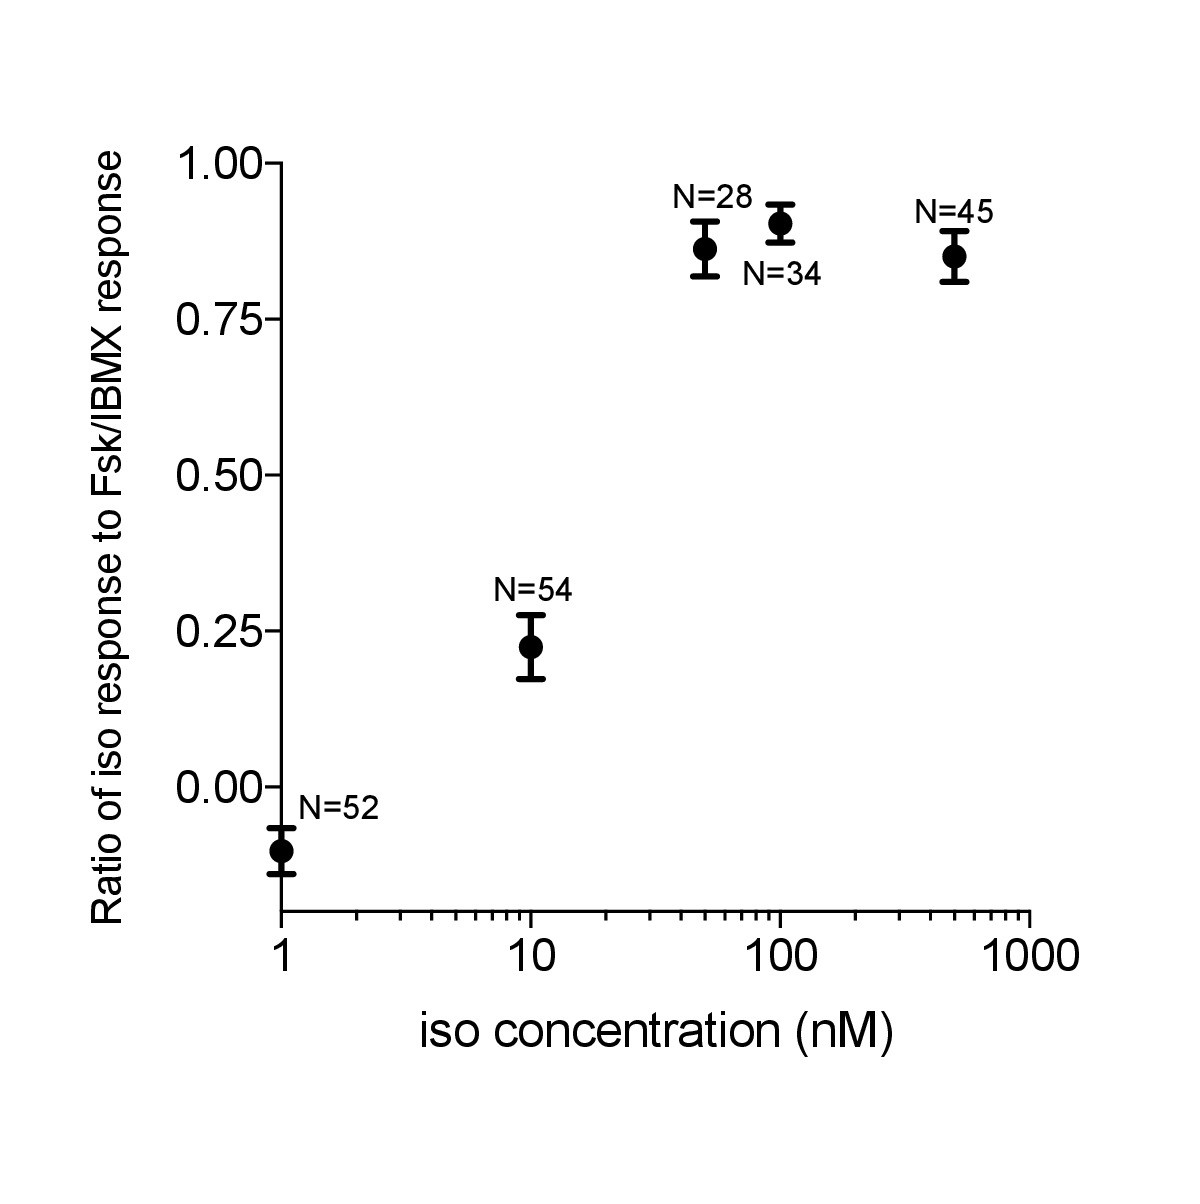
Venus-cp172Venus FLARE-AKAR isoproterenol dose response.
HEK293T cells were transiently transfected with Venus-cp172Venus FLARE-AKAR, and stimulated with varying doses of isoproterenol, followed by maximal stimulation with 50 μM forskolin and 100 μM IBMX. The ratio of the anisotropy decrease following isoproterenol dose to that after Forskolin and IBMX stimulation vs. the isoproterenol dose is plotted.
Figure 1—figure supplement 5
Characterization of the chromophore-dead FLARE AKAR mutant.
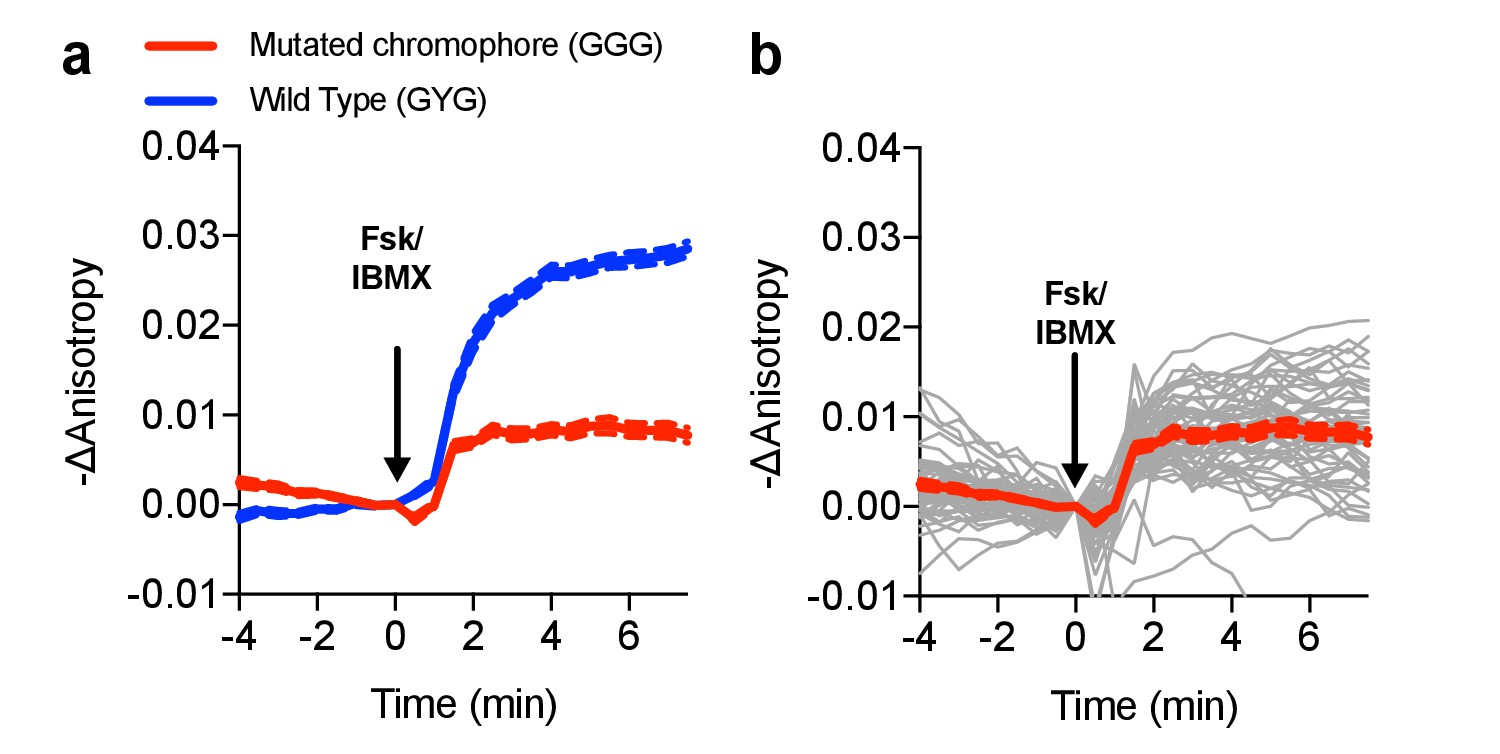
(a) Comparison of Venus-cp172Venus FLARE AKAR responses of the wild type sensor and a mutant sensor in which the chromophore of the C-terminal cp172Venus was mutated from GYG to GGG (N = 53), expressed in HEK293T cells and treated with 50 μM forskolin and 100 μM IBMX. (b) Individual cell traces for Venus-cp172Venus FLARE AKAR (GGG mutant). The red curve represents the mean for all the cell traces, with the dotted lines above and below reflecting the standard error of the mean.
Figure 1—figure supplement 6
Direct comparison of mCherry-mCherry FLARE-AKAR and heteroFRET AKAR4.
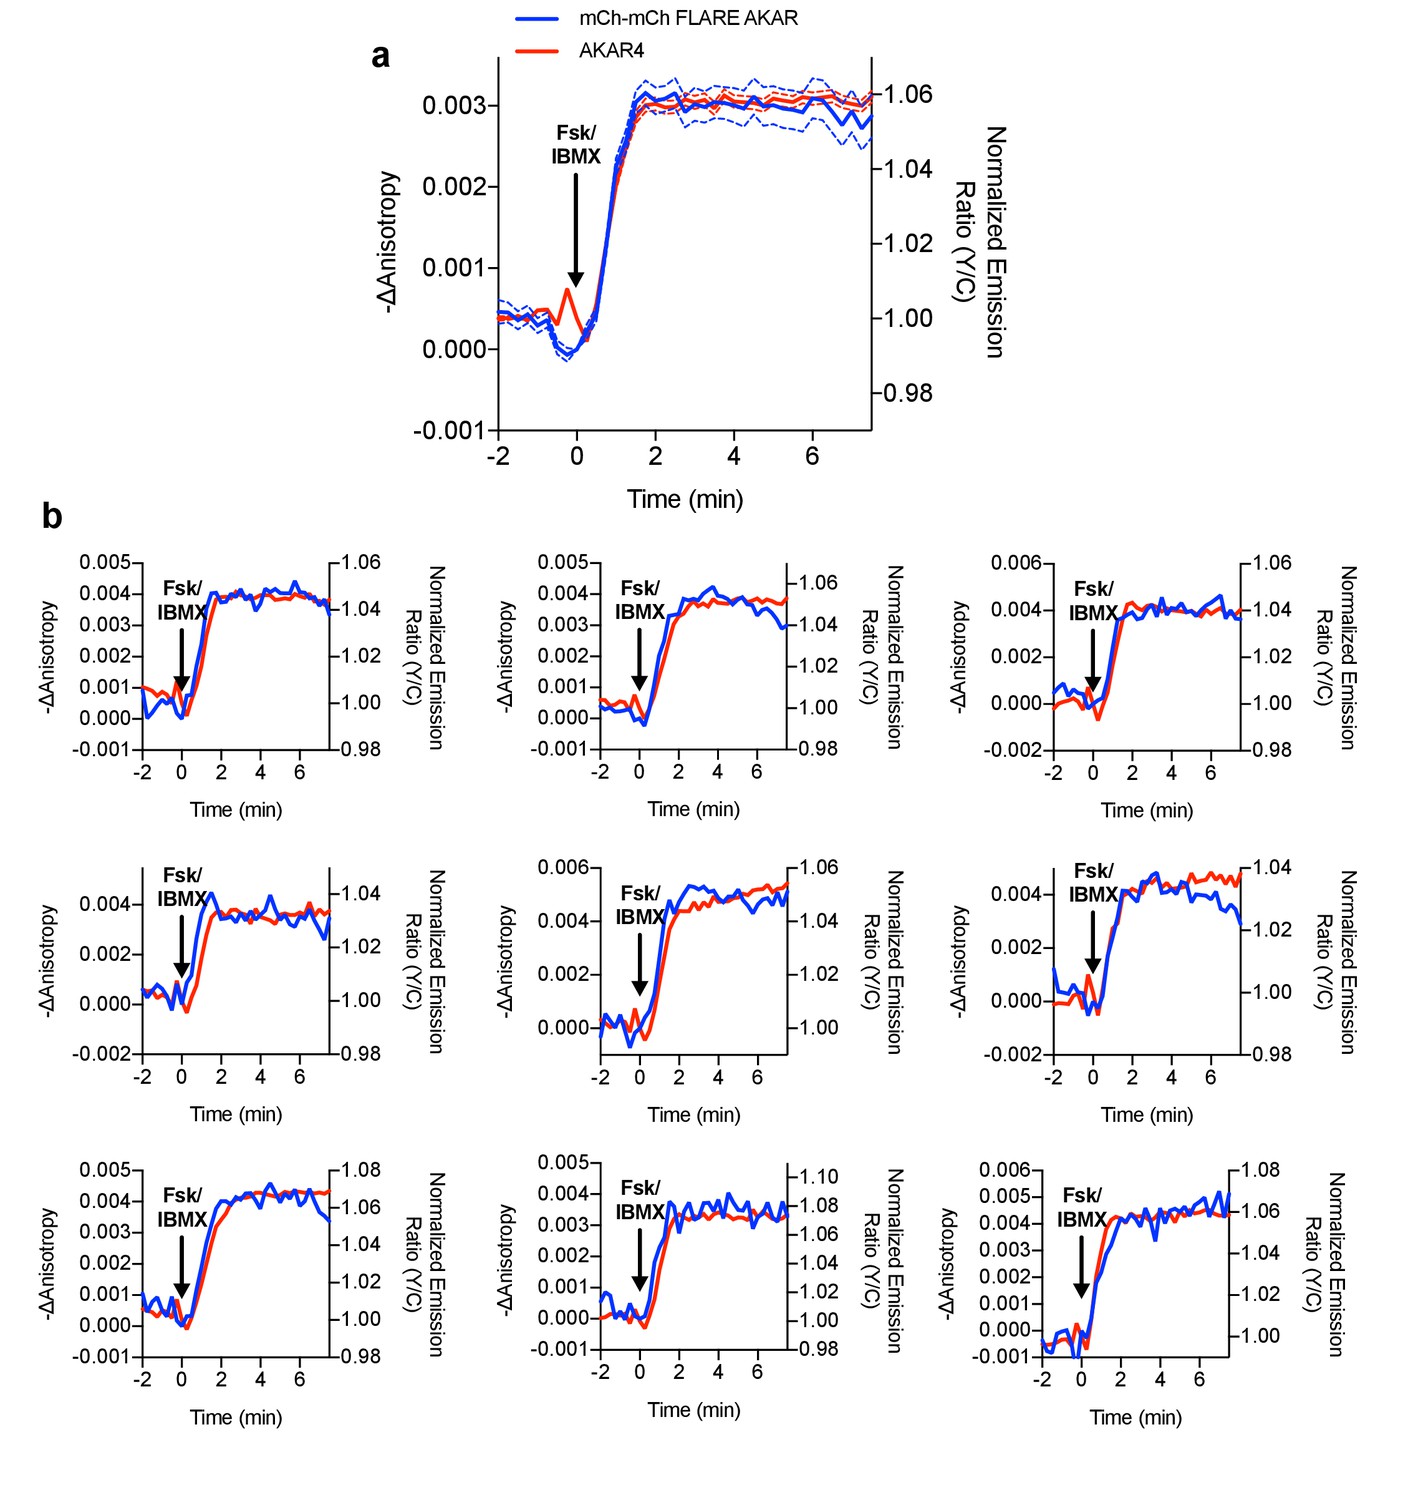
mCherry-mCherry FLARE-AKAR and AKAR4 were co-expressed in HEK293T cells, which were stimulated with 50 μM forskolin and 100 μM IBMX at t = 0 min (N = 74). (a) Average anisotropy traces for mCherry-mCherry FLARE AKAR and average normalized emission ratio traces are shown for AKAR4. The dashed lines above and below the curve represent the standard error of the mean. (b) Nine representative cell traces showing both mCherry-mCherry FLARE AKAR and AKAR4 traces for the above experiment.
Figure 1—figure supplement 7
Subcellular targeted FLARE-AKARs.
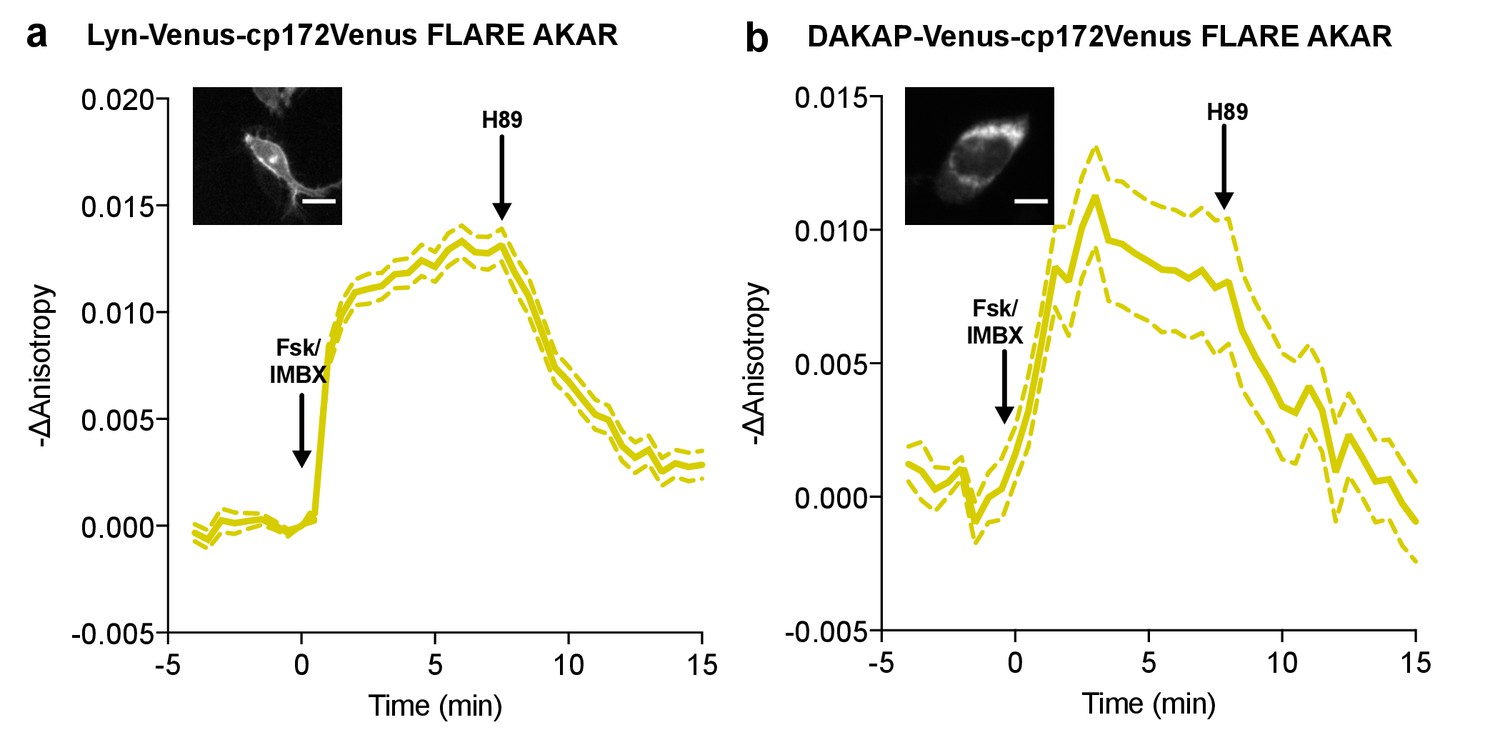
Average anisotropy traces of Venus-cp172Venus FLARE AKAR subcellularly targeted to (a) the plasma membrane with the Lyn-kinase targeting motif (N = 77) (b) the mitochondrial membrane with the targeting sequence from DAKAP (N = 32), expressed in HEK293T cells stimulated with 50 μM forskolin and 100 μM IBMX at t = 0 min, and 20 μM H89 at t = 7.5 min. Scale bars are 10 μm. Dashed lines above and below the curves reflect the standard error of the mean.
Figure 1—figure supplement 8
Differential PKA activity kinetics in the cytosol and the nucleus.
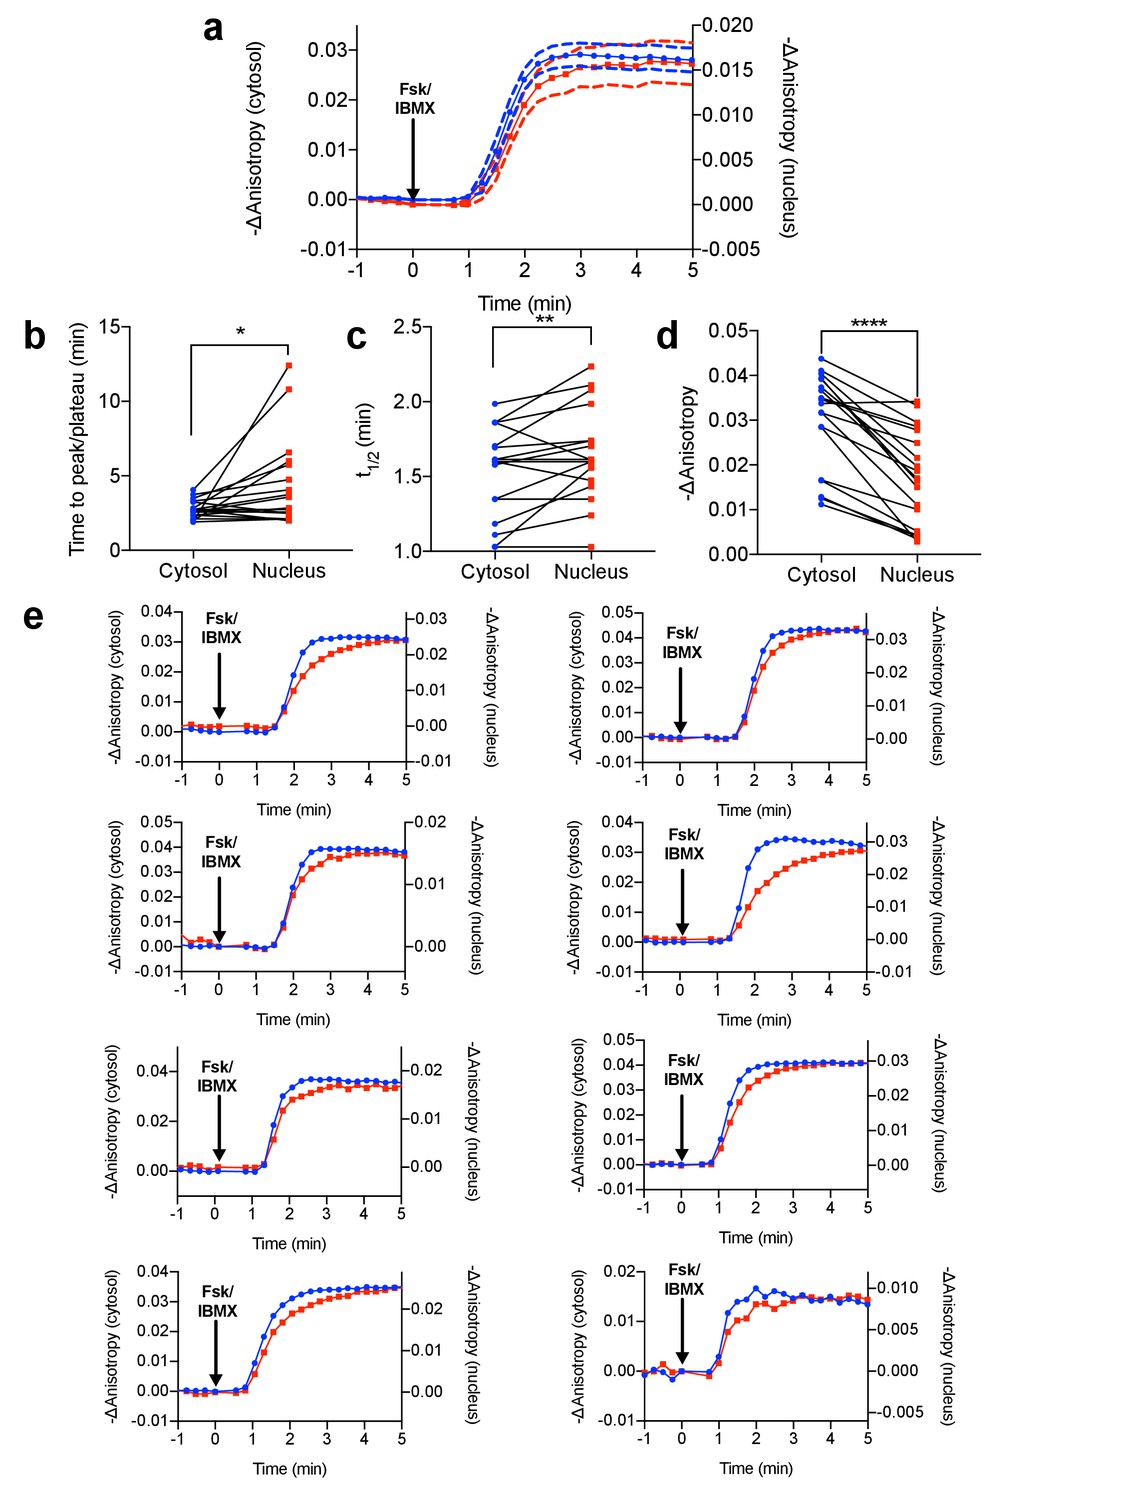
(a) Comparison of Venus-cp172Venus FLARE AKAR anisotropy changes in the cytosol and the nucleus in HeLa cells treated with 50 μM forskolin and 100 μM IBMX (N = 19). Dashed lines above and below the curves reflect the standard error of the mean. (b) Comparison of the time for the anisotropy change to peak or plateau in the cytosol and the nucleus (two-tailed paired T-test, p=0.0295). (c) Comparison of the time for the anisotropy change to reach half of the peak (t1/2) in the cytosol and the nucleus (two-tailed paired T-test, p=0.0065). (d) Comparison of the magnitude of the anisotropy change in the cytosol and the nucleus (two-tailed, paired T-test, p<0.0001). (e) Eight representative anisotropy time traces for individual cells, comparing the cytosolic and nuclear anisotropies.
Figure 2 with 4 supplements
A panel of kinase activity and activation biosensors.
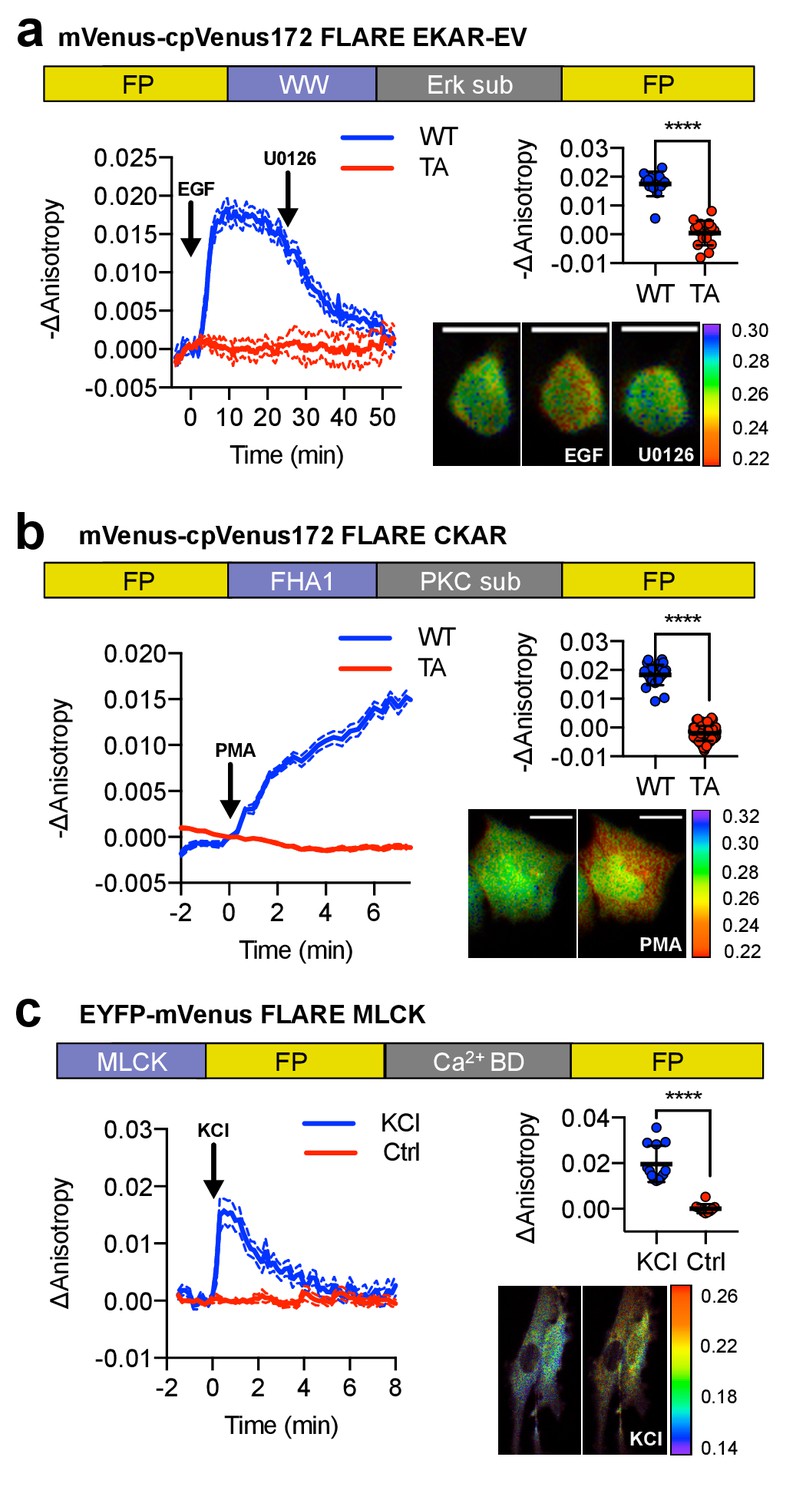
(a) Domain structure of FLARE-EKAR-EV (above). Time-course of mean fluorescence anisotropy of Venus-cp172Venus FLARE-EKAR-EV WT (blue, N = 13) and kinase-insensitive mutant (red, N = 16) expressed in HEK293T cell, with addition of 100 ng/mL EGF at t = 0 min and 20 μM U0126 at t = 25 min (left). Summary of anisotropy changes (upper right, two-tailed t-test, p<0.0001), calculated as the difference between the mean anisotropy from t = 10 min to t = 15 min and the mean anisotropy of the baseline before drug addition. The mean is shown, with the error reflecting the standard error of the mean. Representative anisotropy pseudocolor image before EGF stimulation (t = 0 min), after EGF stimulation (t = 25 min), and after inhibition of MEK with U0126 (t = 47.5 min) (lower right). (b) Domain structure of FLARE-CKAR (above). Time-course of fluorescence anisotropy of Venus-cp172Venus FLARE-CKAR WT (blue, N = 26) and kinase-insensitive mutant (red, N = 119) with addition of 100 ng/mL phorbol 12-myristate 13-acetate (PMA) at t = 0 min. Summary of response magnitudes (upper right, two-tailed t-test, p<0.0001), calculated as the difference between the mean anisotropy from t = 10 to t = 11.33 min and the mean anisotropy of the baseline before drug addition. The mean is shown, with the error reflecting the standard error of the mean. Representative anisotropy pseudocolor image before PMA addition (t = 0 min) and after PMA addition (t = 15 min). (c) Domain structure of FLARE-MLCK (top). Anisotropy time course of a representative REF52 cell expressing YFP-Venus FLARE-MLCK treated with 30 mM KCl at t = 0 (N = 13, blue), or vehicle control (N = 10). Summary of anisotropy changes, calculated as the mean difference between the anisotropy at t = 0.333 min and the anisotropy of the baseline, before KCl addition (upper right, two-tailed t-test, p<0.0001). Representative pseudocolor anisotropy images before and after KCl treatment (lower right). Dashed lines above and below time course traces reflect the standard error of the mean. FP, fluorescent protein; CaM BD, MLCK calmodulin-binding domain.
-
Figure 2—source data 1
FLARE kinase biosensor panel.
(a) Sheet 1, Figure 2a. Time course for Venus-cp172Venus FLARE EKAR, both wild type and kinase-inactive (TA) mutant. (b) Sheet 2, Figure 2a. Comparison of magnitudes of anisotropy changes for Venus-cp172Venus FLARE EKAR, both wild type and kinase-inactive (TA) mutant, of upon EGF addition, and relevant statistical tests to compare the two variants. (c) Sheet 3, Figure 2—figure supplement 1c. Changes of magnitudes of anisotropy change for various FLARE EKAR variants upon EGF addition. (d) Sheet 4, Figure 2b. Time course for Venus-cp172Venus FLARE CKAR, both wild type and kinase-inactive (TA) mutant. (e) Sheet 5, Figure 2b. Comparison of magnitudes of anisotropy changes for Venus-cp172Venus FLARE EKAR, both wild type and kinase-inactive (TA) mutant, of upon EGF addition, and relevant statistical tests to compare the two variants. (f) Sheet 6, Figure 2—figure supplement 2. Time courses for CKAR1 and CKAR2. (g) Sheet 7, Figure 2—figure supplement 3c. Changes of magnitudes of anisotropy change for various FLARE CKAR variants upon PMA addition. (h) Sheet 8, Figure 2c. Time course for FLARE MLCK, with either addition of KCl and vehicle only control. (i) Sheet 9, Figure 2c. Summary for magnitude of responses for FLARE MLCK.
- https://cdn.elifesciences.org/articles/35458/elife-35458-fig2-data1-v3.xlsx
Figure 2—figure supplement 1
FLARE-EKAR characterization.
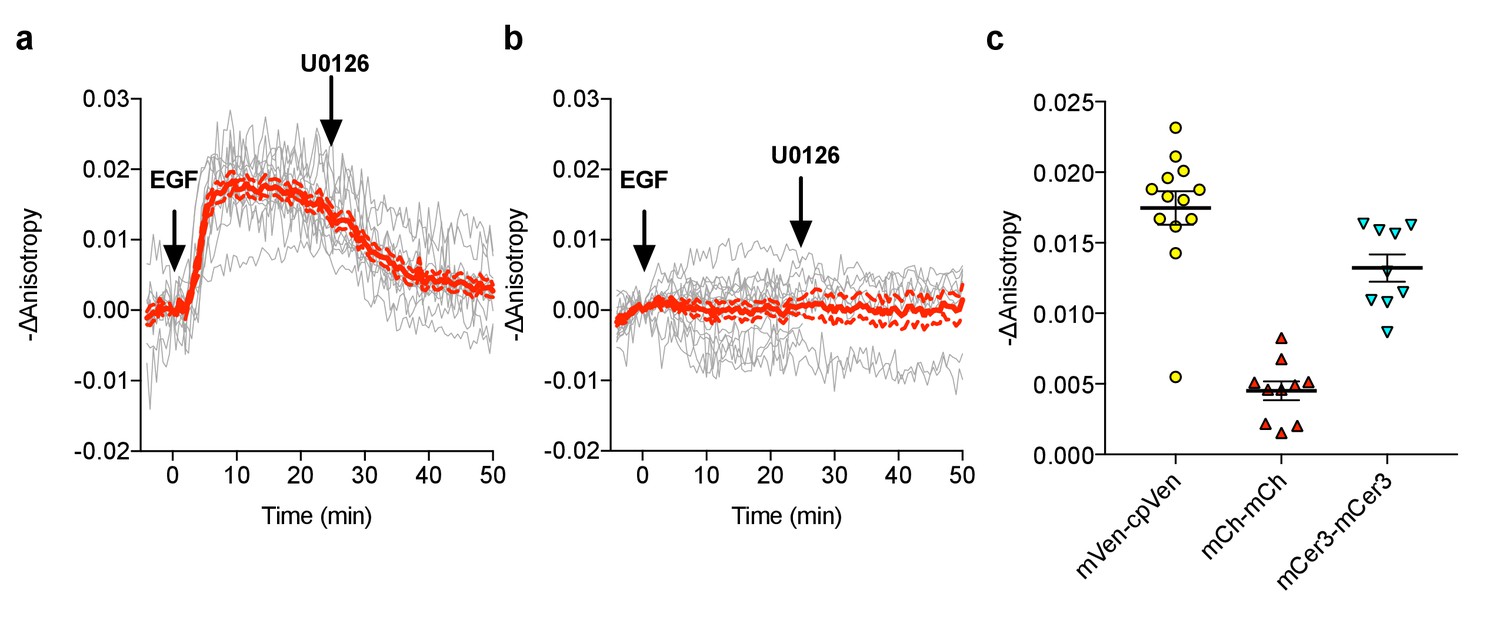
(a) Individual (gray) and average (red) cell traces for Venus-cp172Venus FLARE EKAR (N = 13), expressed in HEK293T cells and treated with 100 ng/mL epidermal growth factor (EGF) at t = 0 min and the MEK inhibitor U0126 at t = 25 min. (b) Individual (gray) and average (red) cell traces for Venus-cp172Venus FLARE EKAR with a threonine-to-alanine (T–to–A) at the phosphorylation site (N = 16), expressed in HEK293T cells and treated with 100 ng/mL epidermal growth factor (EGF) at t = 0 min and the MEK inhibitor U0126 at t = 25 min. (c) A summary of anisotropy changes for various color-variants of FLARE-EKAR, upon stimulation with 100 ng/mL EGF. The magnitude of the signal was calculated by taking the mean anisotropy from t = 10 min to t = 15 min and subtracting the mean anisotropy of the baseline before drug addition.
Figure 2—figure supplement 2
Characterization of the CKAR2 hetero-FRET biosensor.
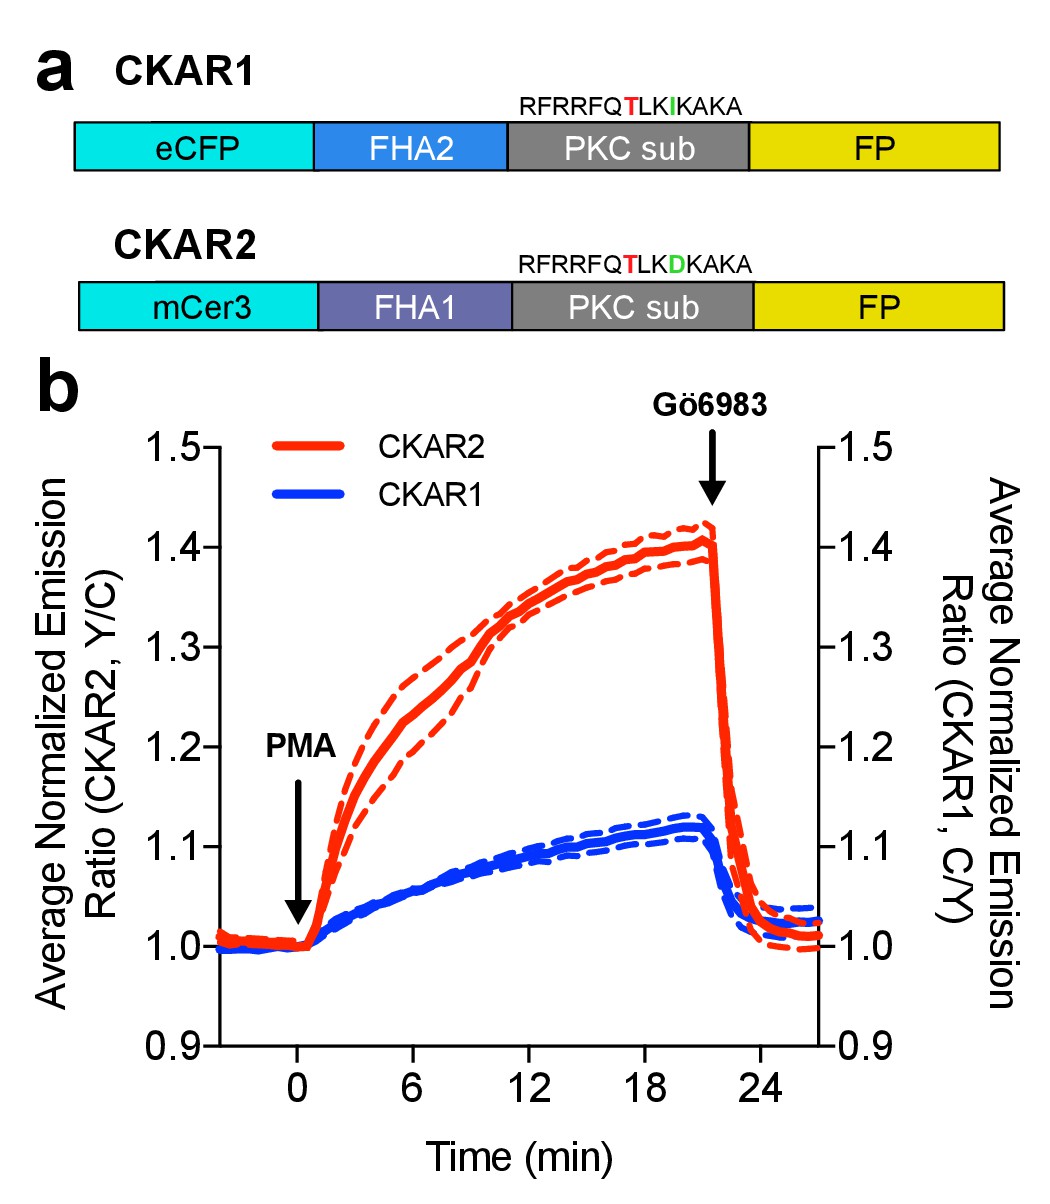
(a) Comparison of CKAR1 and CKAR2 domain structures. (b) Comparison of FRET responses of CKAR1 and CKAR2 expressed in HeLa cells to Protein Kinase C (PKC) stimulation with 50 ng/mL phorbol 12-myristate 13-acetate (PMA) as well as PKC inhibition with 1 μM Gö6983. Curves here represent mean curves from one representative experiment with biological replicates N = 7 for CKAR1 and N = 4 for CKAR2; the experiment was repeated three times.
Figure 2—figure supplement 3

FLARE CKAR characterization.
(a) Individual (gray) and average (red) cell traces for Venus-cp172Venus FLARE CKAR (N = 26), expressed in HEK293T cells treated with 50 ng/mL PMA at t = 0 min. Dotted lines above and below the curves reflect the standard error of the mean. (b) Individual (gray) and average (red) cell traces for the kinase-inactive mutant of Venus-cp172Venus FLARE CKAR (TA mutant) (N = 119), expressed in HEK293T cells treated with 50 ng/mL PMA at t = 0 min. (c) A summary of anisotropy changes for various color-variants of FLARE-ICUE in HEK293T cells upon stimulation with 50 ng/mL PMA. The magnitude of the signal was calculated by taking the mean anisotropy from t = 10 min to t = 11.33 min and subtracting the mean anisotropy of the baseline before drug addition.
Figure 2—figure supplement 4
FLARE MLCK characterization.
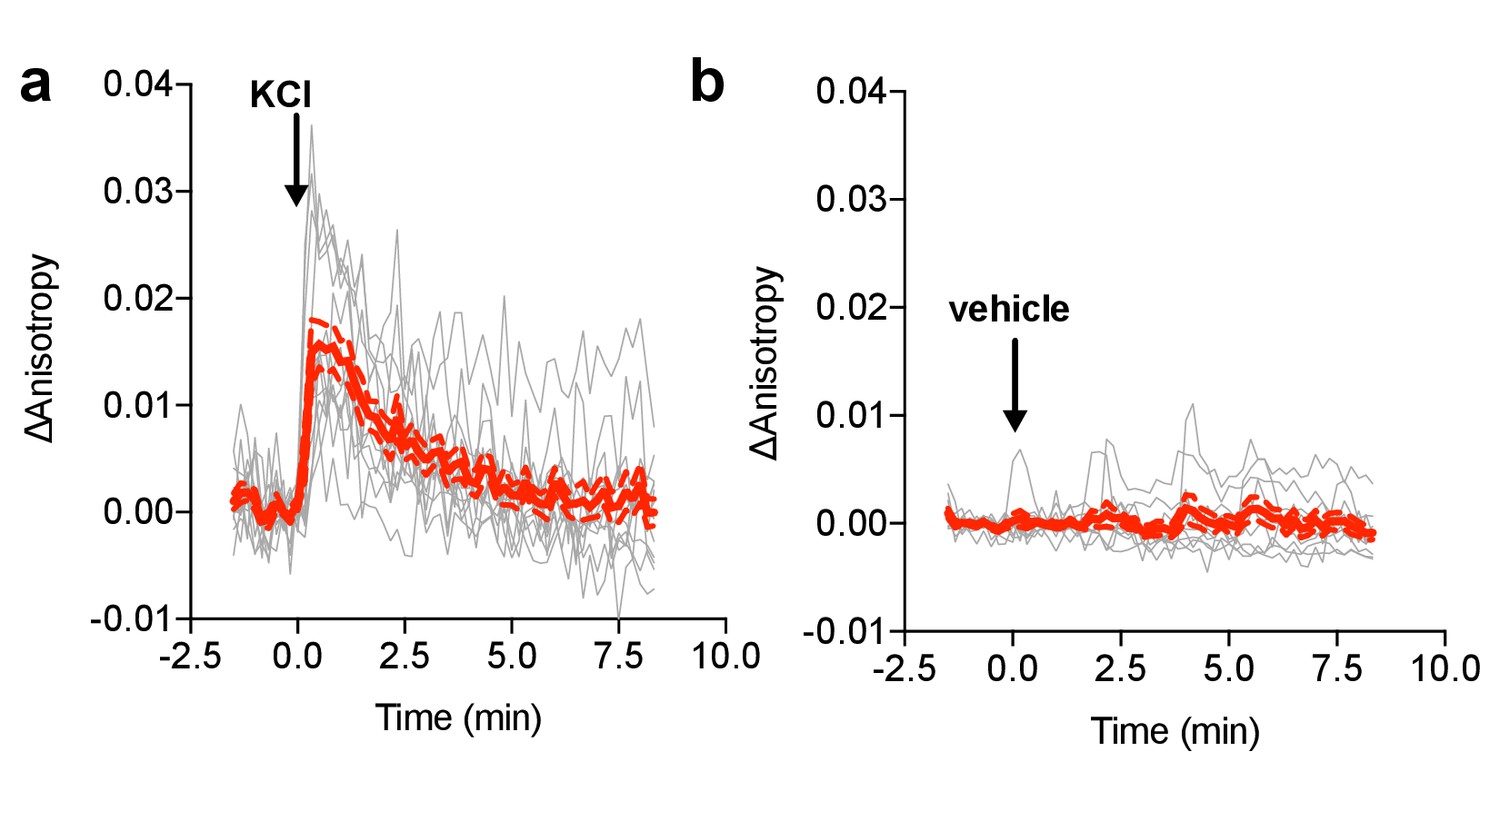
(a) Individual (gray) and average (red) cell traces for FLARE MLCK (N = 13) with KCl added at t = 0 min (N = 13). (b) Individual (gray) and average (red) cell traces for FLARE-MLCK with vehicle only added at t = 0 min (N = 10). The dashed lines above and below the red curve reflect the standard error of the mean. The magnitude of the signal was calculated by taking the Δanisotropy at t = 0.33 min and subtracting the mean Δanisotropy of the baseline before drug addition.
Figure 3 with 4 supplements
Design and characterization of FLARE second messenger biosensors.
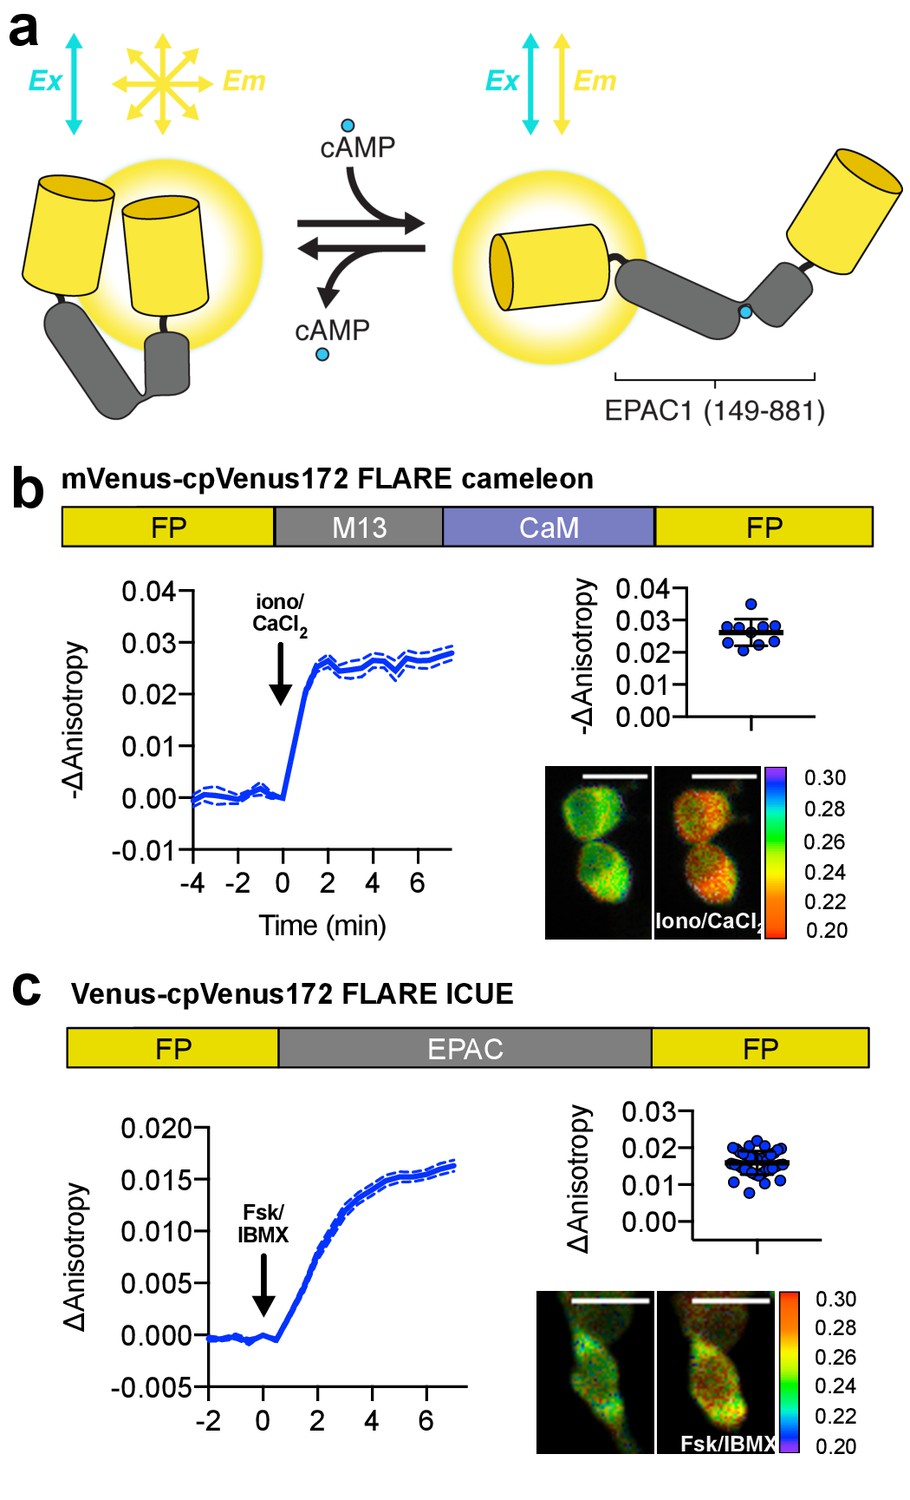
(a) Schematic of FLARE ICUE cAMP biosensor. (b) Domain structure of FLARE-Cameleon (top). Time-course of mean fluorescence anisotropy of Venus-cp172Venus FLARE-Cameleon (N = 10) with addition of 1 μM ionomycin and 5 mM CaCl2. Summary of anisotropy changes after 1 μM ionomycin and 5 mM CaCl2 (upper right) calculated as the difference between the mean anisotropy from t = 5 min to t = 7.5 min and the anisotropy of the baseline before drug addition Representative anisotropy pseudocolor image before and after 1 μM ionomycin and 5 mM CaCl2 addition. (c) Domain structure of the cAMP biosensor FLARE-ICUE (top). Time-course of mean fluorescence anisotropy of Venus-cp172Venus FLARE-ICUE (N = 40) with addition of 50 μM forskolin and 100 μM IBMX at t = 0 (left). Summary of anisotropy changes after 50 μM forskolin and 100 μM IBMX with respect to baseline (upper right), calculated as the difference between the mean anisotropy from t = 5 min to t = 7.5 min and the anisotropy of the baseline before drug addition. Representative anisotropy pseudocolor image before (t = 0 min) and after (t = 7.5) stimulation with Fsk/IBMX (lower right). Dashed lines above and below time course reflect standard error of the mean.
-
Figure 3—source data 1
FLARE second messenger biosensor panel.
(a) Sheet 1, Figure 3b. Time course for Venus-cp172Venus FLARE Cameleon. (b) Sheet 2, Figure 3b. Summary of magnitude of responses for Venus-cp172Venus FLARE Cameleon upon addition of calcium chloride and ionomycin. (c) Sheet 3, Figure 3—figure supplement 1b. Summary of magnitudes of responses for various FLARE Cameleon variants upon addition of calcium chloride and ionomycin. (d) Sheet 4, Figure 3—figure supplement 2. In vitro calibration of Venus-cp172Venus FLARE Cameleon, both raw data and sigmoidal curve fits. (e) Sheet 5, Figure 3—figure supplement 3. Summary of magnitude of anisotropy changes for CFP FLARE D1ER upon addition of ionomycin and three different doses of calcium. (f) Sheet 6, Figure 3c. Time course for Venus-cp172Venus FLARE ICUE. (g) Sheet 7, Figure 3c Summary of magnitudes of changes in anisotropy for Venus-cp172Venus FLARE ICUE upon addition of forskolin and IBMX.
- https://cdn.elifesciences.org/articles/35458/elife-35458-fig3-data1-v3.xlsx
Figure 3—figure supplement 1
Characterization of FLARE Cameleon.
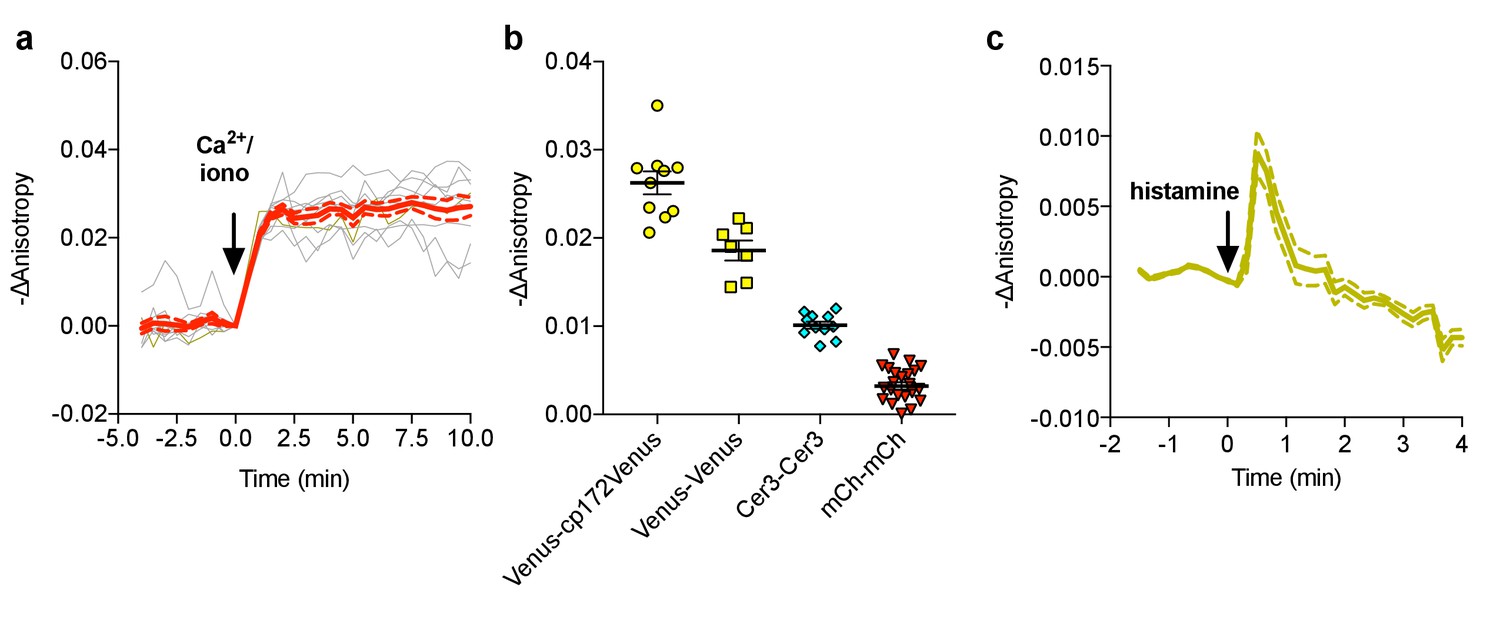
(a) Individual (gray) and average (red) cell traces for Venus-cp172 FLARE Cameleon (N = 10). (b) A summary of anisotropy changes for various color-variants of FLARE-Cameleon in HEK293T cells upon stimulation with 1 μM ionomycin and 5 mM calcium chloride. The mean for each is shown, with the error reflecting the standard error of the mean. The magnitude of the signal was calculated by taking the mean anisotropy from t = 5 min and t = 7.5 min and subtracting the mean anisotropy of the baseline before drug addition. (c) Average anisotropy trace for Venus-cp172Venus FLARE-Cameleon expressed in HeLa cells upon stimulation with histamine (100 μM). Dotted lines above and below the curves reflect the standard error of the mean.
Figure 3—figure supplement 2

In vitro calibration of purified Venus-cp172 FLARE-Cameleon.
Anisotropy vs. calcium concentration calibration curves of purified Venus-cp172Venus Cameleon for (a) 25°C (b) 32°C, and (c) 37°C.
Figure 3—figure supplement 3
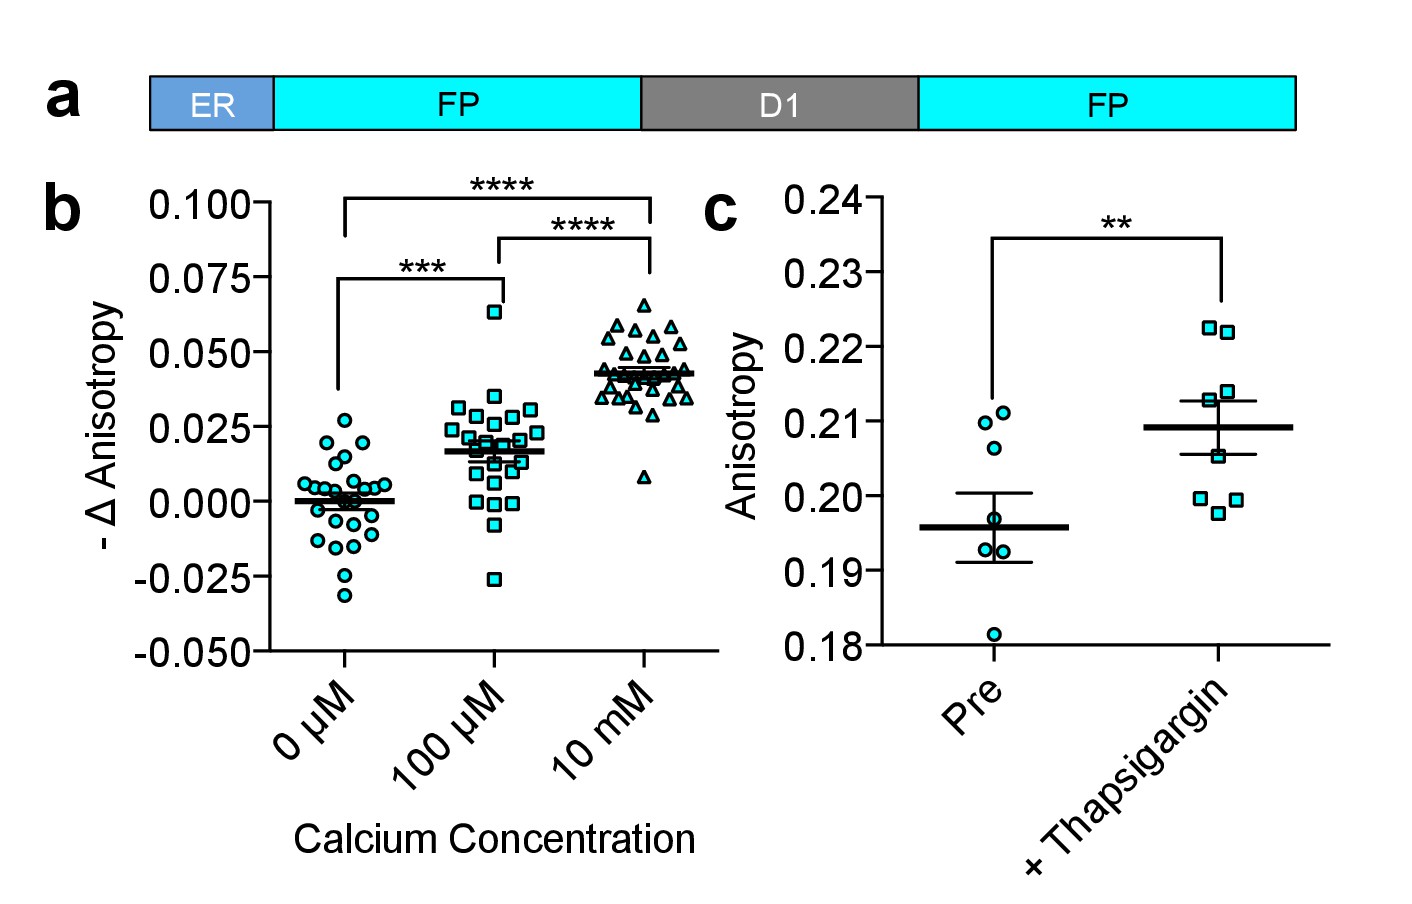
Characterization of CFP FLARE-D1ER.
(a) Schematic of the ER calcium sensor. (b) REF52 cells expressing CFP FLARE D1ER were permeabilized using 5 μM ionomycin and equilibrated with 3 mM EGTA to remove Ca2+ or the indicated Ca2+ concentration. Fluorescence anisotropy values were normalized to the Ca2+-free condition. Statistical significance was assessed using an ANOVA and Tukey Multiple comparison test (***p<0.001, ****p≤0.0001). (c) REF52 cells expressing CFP FLARE D1ER were treated with thapsigargin (1 uM, 5 min), to reduce ER Ca2+ levels (N = 8, **p<0.01 by t-test). The mean for each of the above is shown, with the error reflecting the standard error of the mean.
Figure 3—figure supplement 4
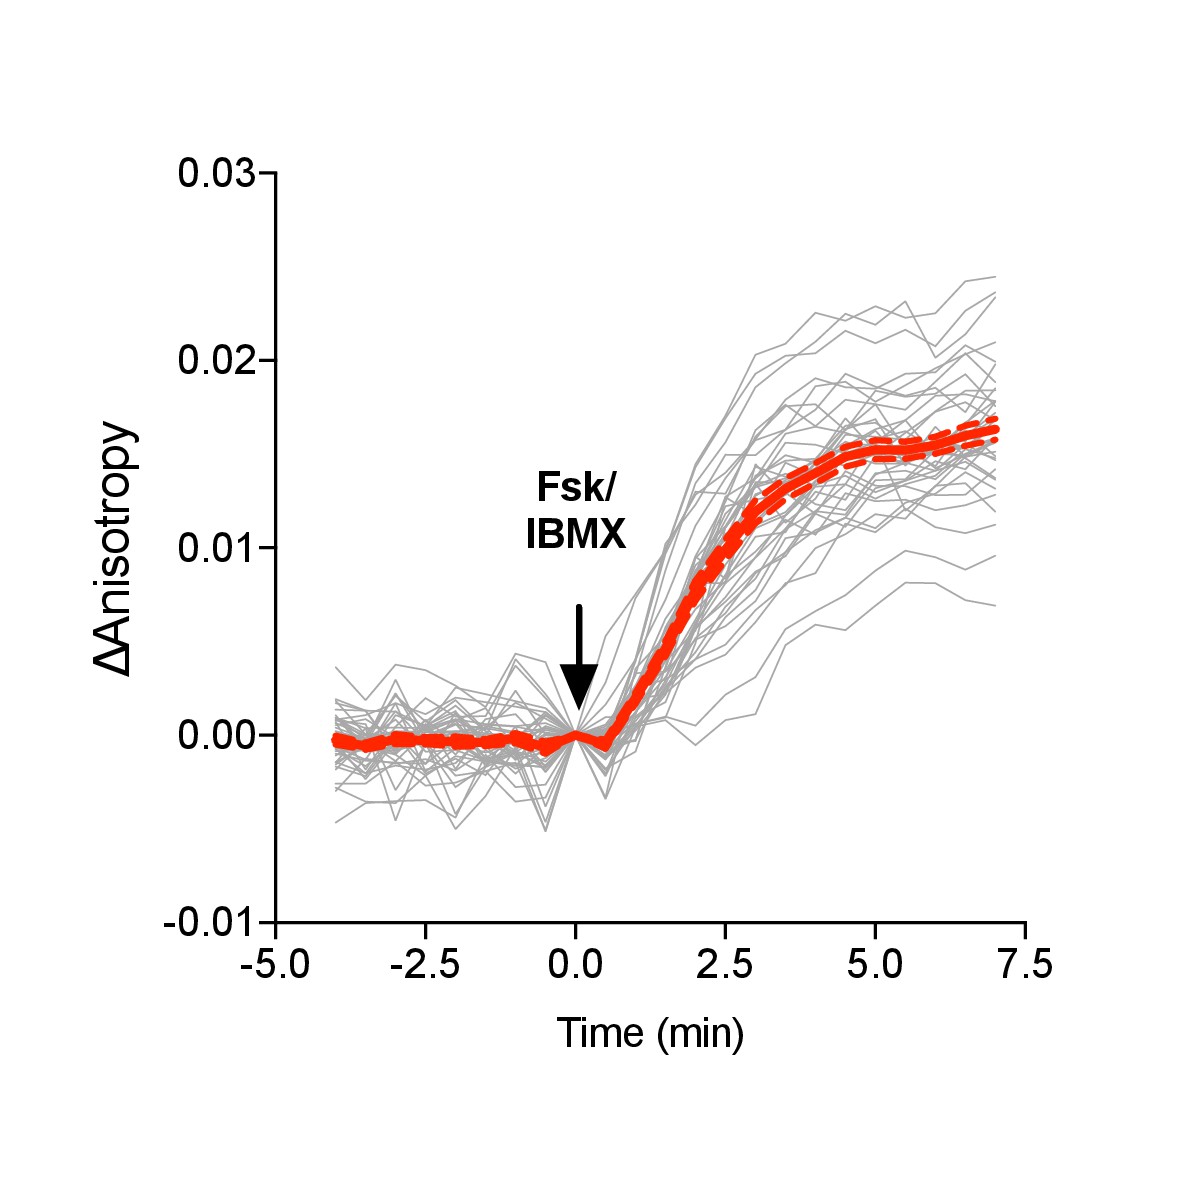
Venus-cp172Venus FLARE ICUE single cell traces.
(a) Individual (gray) and average (red) cell traces for Venus-cp172Venus FLARE-ICUE (N = 40). Dashed lines above and below the average curve reflect the standard error of the mean.
Figure 4 with 5 supplements

Multiparameter Imaging with FLAREs.
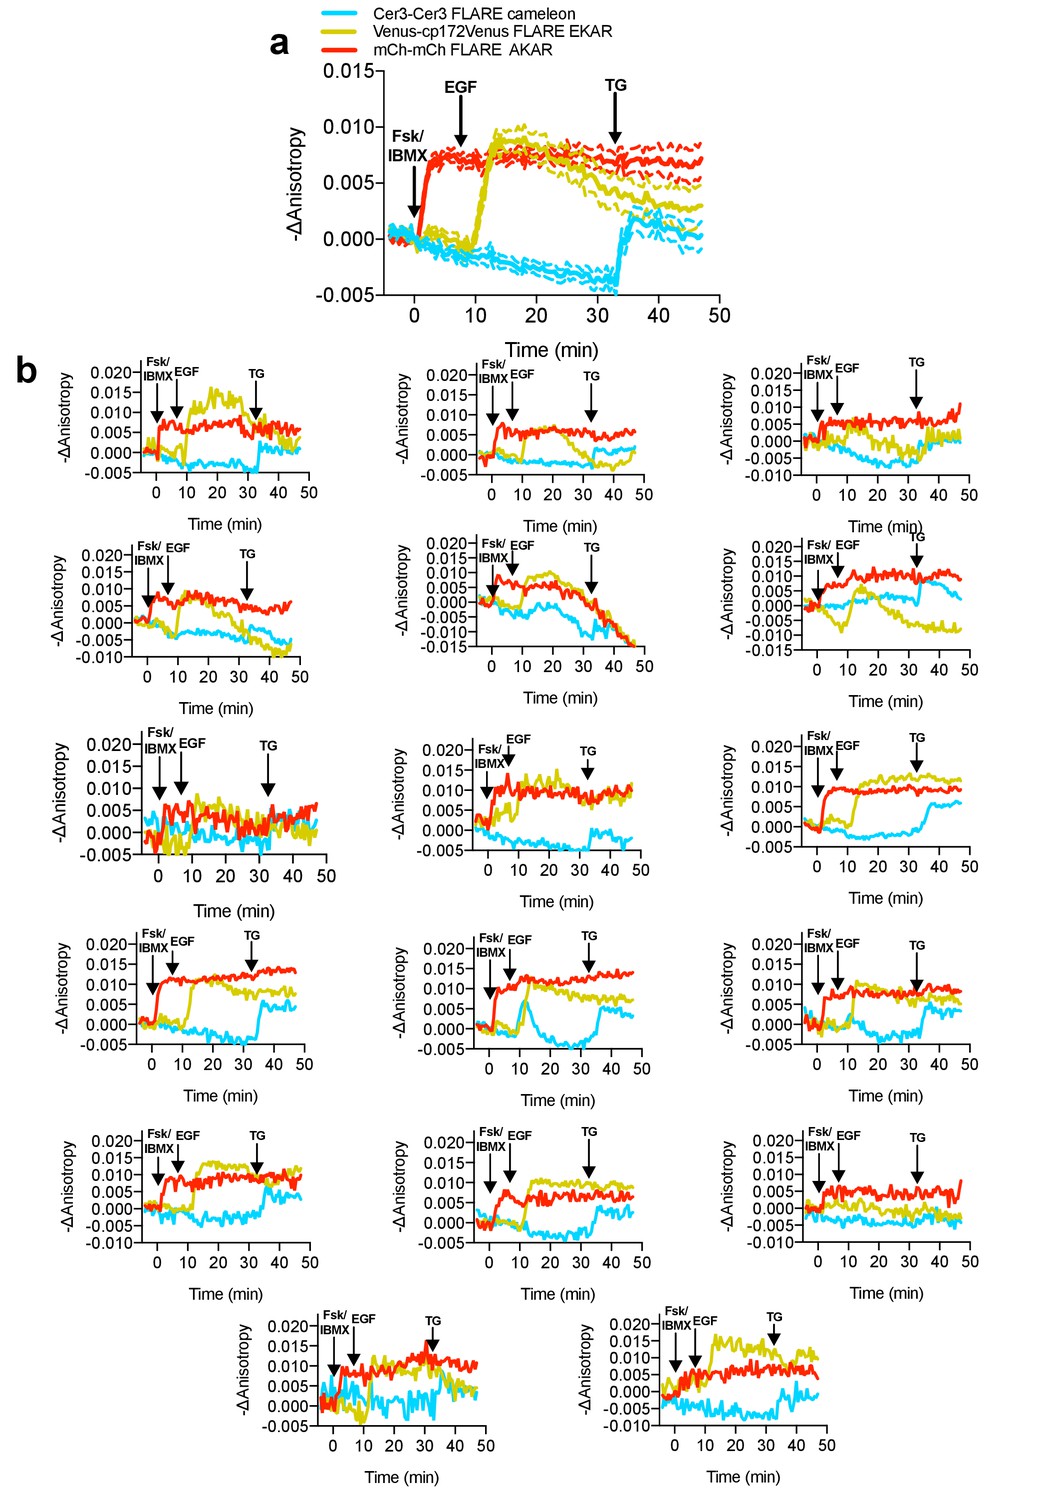
(a) Time-course of a representative HEK293T cell co-expressing mCherry-mCherry FLARE-AKAR, mVenus-cp172Venus FLARE-EKAR-EV, and mCerulean3-mCerulean3 FLARE-Cameleon, with 50 μM forskolin and 100 μM IBMX added at t = 0 min, 100 ng/mL EGF at t = 7.5 min, and 1 μM thapsigargin added at t = 32.5 min (N = 17). (b) Anisotropy response of a representative MIN6 cell co-expressing Cerulean3-Cerulean3 FLARE-Cameleon and Venus-cp172Venus FLARE-ICUE, showing robust oscillations after stimulation with TEA at t = 0 min (N = 19). (c) Venus-cp172Venus FLARE-Cameleon anisotropy time-course in REF52 cells co-expressing the sensor and either mCherry-tagged humanized channel rhodopsin2 (blue-curve) or mCherry alone (red-curve), with periodic illumination with 455 nm light (indicated by cyan shading). (d) Purified mVenus and mCherry proteins were placed in separate capillary tubes and imaged with 855 nm and 1200 nm two-photon excitation. Plasmids encoding Venus-cp172Venus FLARE-Cameleon and mCherry-mCherry FLARE-AKAR were electroporated into the skeletal muscle of the foot of a live mouse for in vivo imaging. Below are Z-stack projections of skeletal muscle co-expressing these two sensors, excited with 855 nm (left) and 1200 nm (right) light. (e) Electrical stimulation decreased fluorescence anisotropy in the 855 nm channel, consistent with increased cytoplasmic Ca2+ (left) (two-tailed T-test, p=0.0037). Intraperitoneal injection of isoproterenol activates mCherry-mCherry FLARE AKAR (two-tailed T-test, p=0.0239), as indicated by decreased anisotropy in the 1200 nm channel (right). The mean for each is shown, with the error reflecting the standard error of the mean.
-
Figure 4—source data 1
Multiparameter imaging of FLAREs.
(a) Sheet 1, Figure 4a. Time course for multiplexed imaging of mCherry-mCherry FLARE AKAR, Venus-cp172Venus FLARE EKAR, and mCer3-mCer3 FLARE Cameleon, expressed in HEK293T cells and treated with forskolin and IBMX, EGF, and thapsigargin at t = 0 min, t = 7.5 min, and t = 32.5 min, respectively. (b) Sheet 2, Figure 4b. Time course for Venus-cp172Venus FLARE ICUE and mCer3-mCer3 FLARE Cameleon in Min6 cells, treated with TEA at t = 0 min. (c) Sheet 3, Figure 4c. Time course for Venus-cp172Venus FLARE Cameleon co-expressed with mCherry tagged hChR2-ER or mCherry alone. (d) Sheet 4, Figure 4e. Summary data of 2-photon in vivo imaging of Venus-cp172Venus FLARE Cameleon and mCherry-mCherry FLARE AKAR, in the muscle cells in the feet of live mice.
- https://cdn.elifesciences.org/articles/35458/elife-35458-fig4-data1-v3.xlsx
Figure 4—figure supplement 1
Average and single cell traces for multiplexed imaging of PKA activity, Erk activity, and calcium in HEK293-T cells.
(a) Average cell traces for mCherry-mCherry FLARE-AKAR, Venus-cp172Venus FLARE-EKAR, and mCer3-mCer3 FLARE Cameleon, expressed in HEK293T cells, and stimulated with 50 μM forskolin and 100 μM IBMX at t = 0 min, 100 ng/mL EGF at t = 7.5 min, and 1 μM thapsigargin at t = 32.5 min. (Dashed lines reflect the standard error of the mean). (b) Single-cell anisotropy traces for above experiment.
Figure 4—figure supplement 2
Multiplexed monitoring of PKA activity, Erk activity, and calcium in HeLa cells, with histamine stimulation.
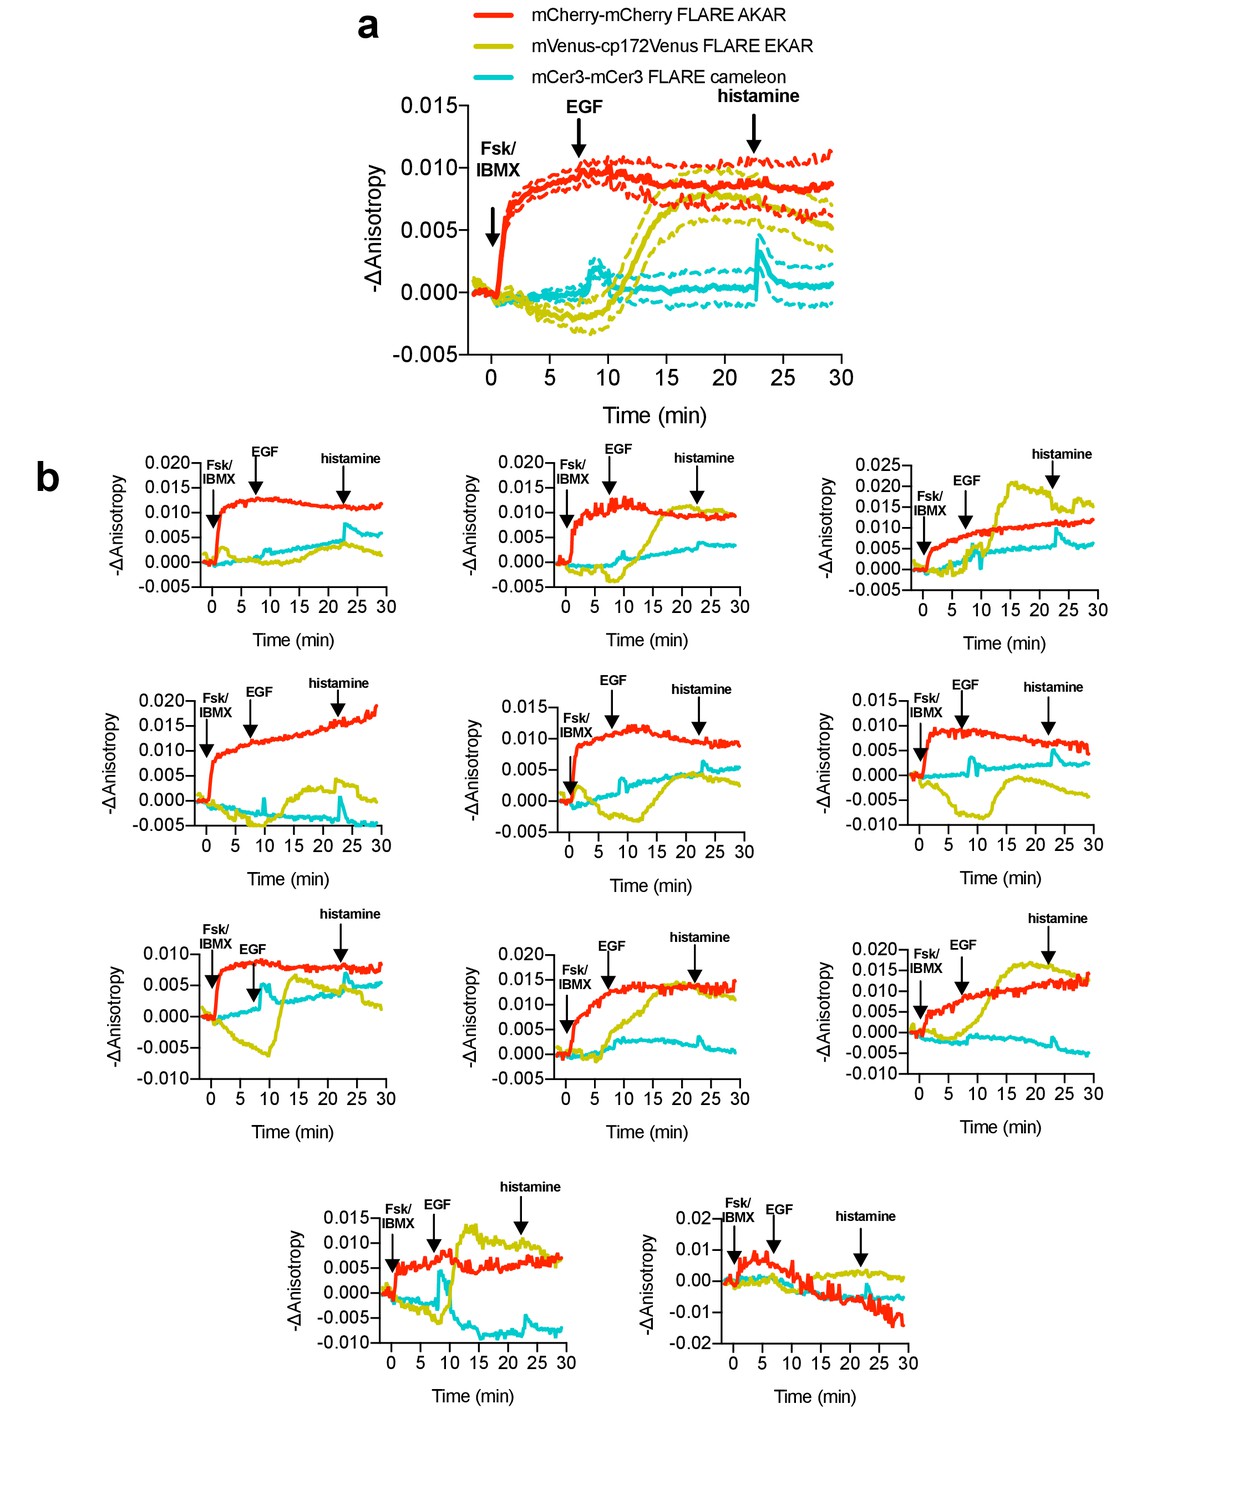
(a) Average cell traces for mCherry-mCherry FLARE-AKAR, Venus-cp172Venus FLARE-EKAR, and mCer3-mCer3 FLARE Cameleon, expressed in HeLa cells, and stimulated with 50 μM forskolin and 100 μM IBMX at t = 0 min, 100 ng/mL EGF at t = 7.5 min, and 100 μM histamine at t = 32.5 min (N = 11). (Dashed lines reflect the standard error of the mean). In the cyan channel, transient decreases in anisotropy can be observed both after both EGF and histamine stimulation. (b) Representative cell anisotropy traces for above experiment.
Figure 4—figure supplement 3
Simultaneous monitoring of PKA and calcium in live cells with FLAREs using isoproterenol stimulation.
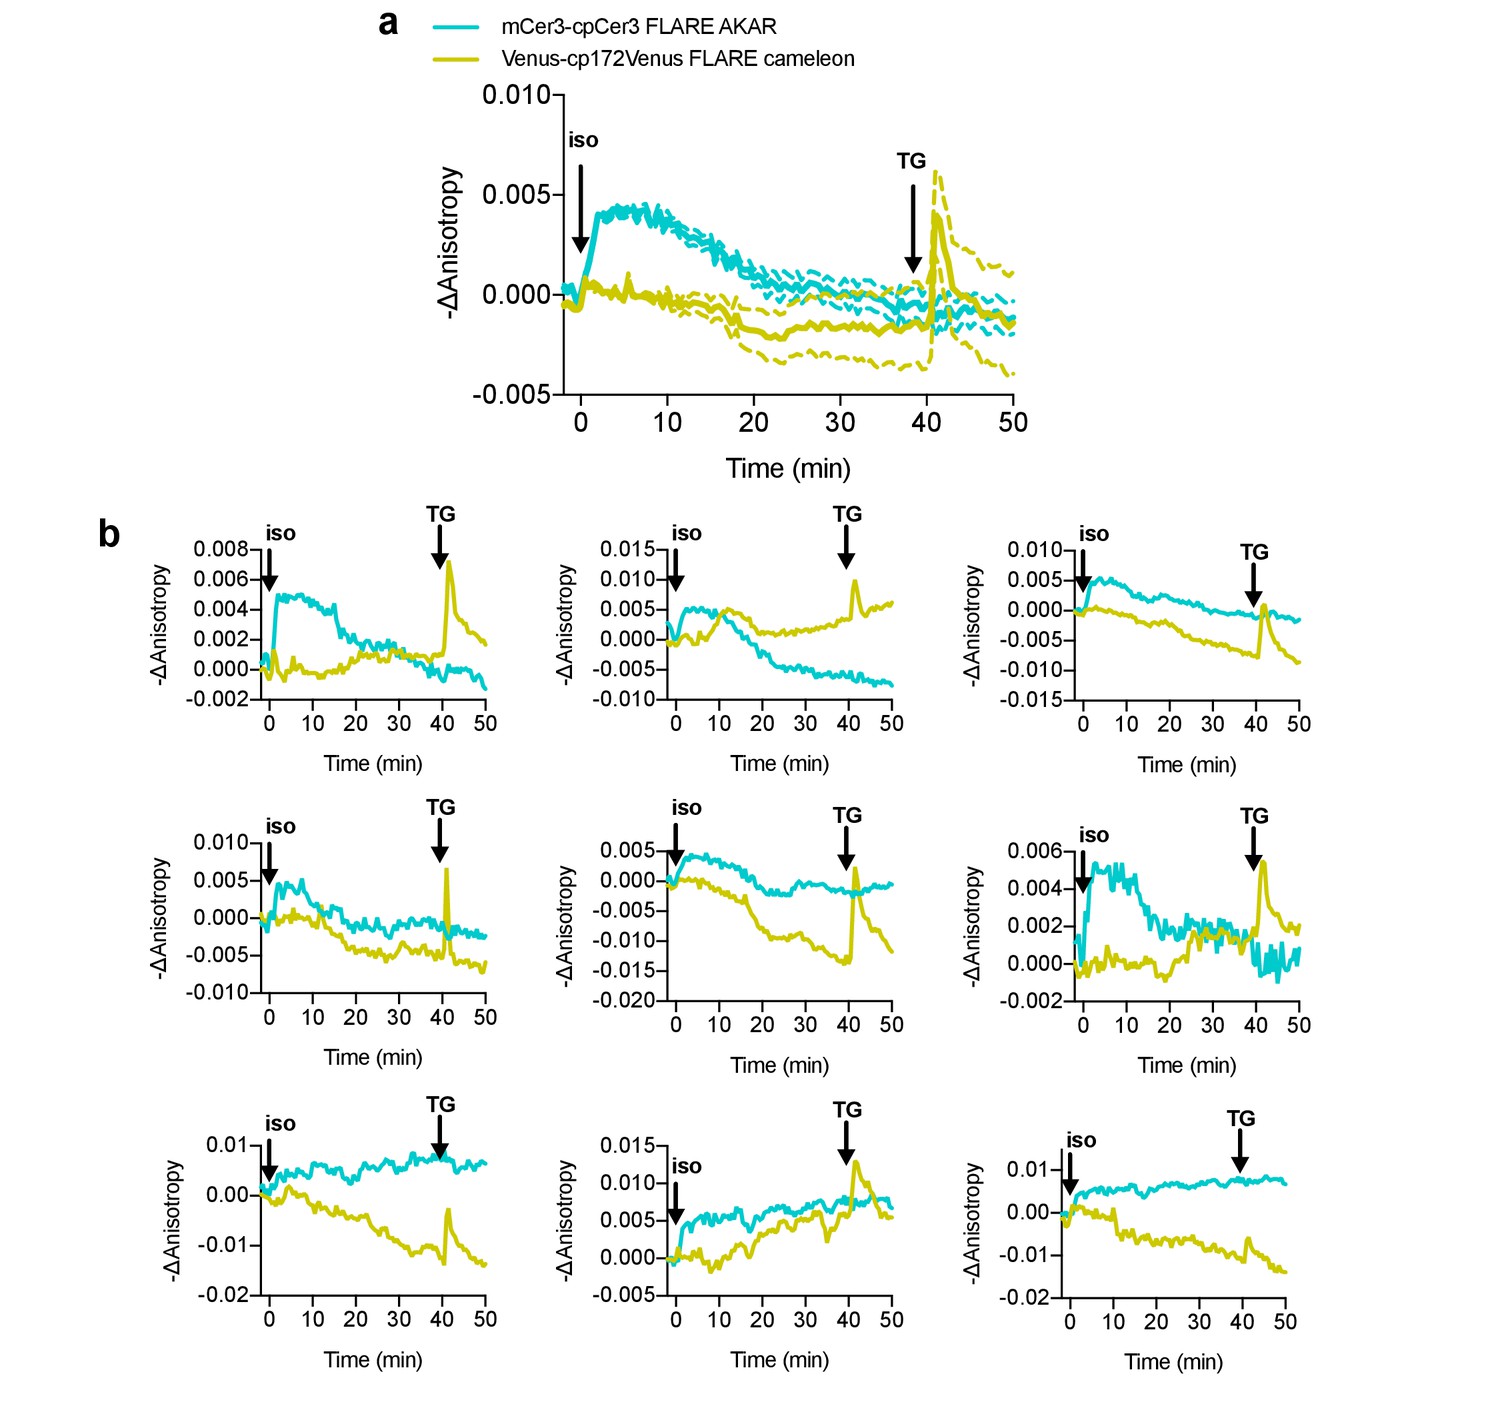
(a) Average cell traces for mCerulean3-mCerulean3 FLARE-AKAR, and mVenus-cp172Venus FLARE Cameleon, expressed in HEK293T cells, and stimulated with 100 nM isoproterenol at t = 0 min and 1 μM thapsigargin at t = 40 min (N = 28). Dashed lines reflect the standard error of the mean. (b). Representative cell anisotropy traces for above experiment.
Figure 4—figure supplement 4
Monitoring calcium and cAMP oscillations in pancreatic β cells.
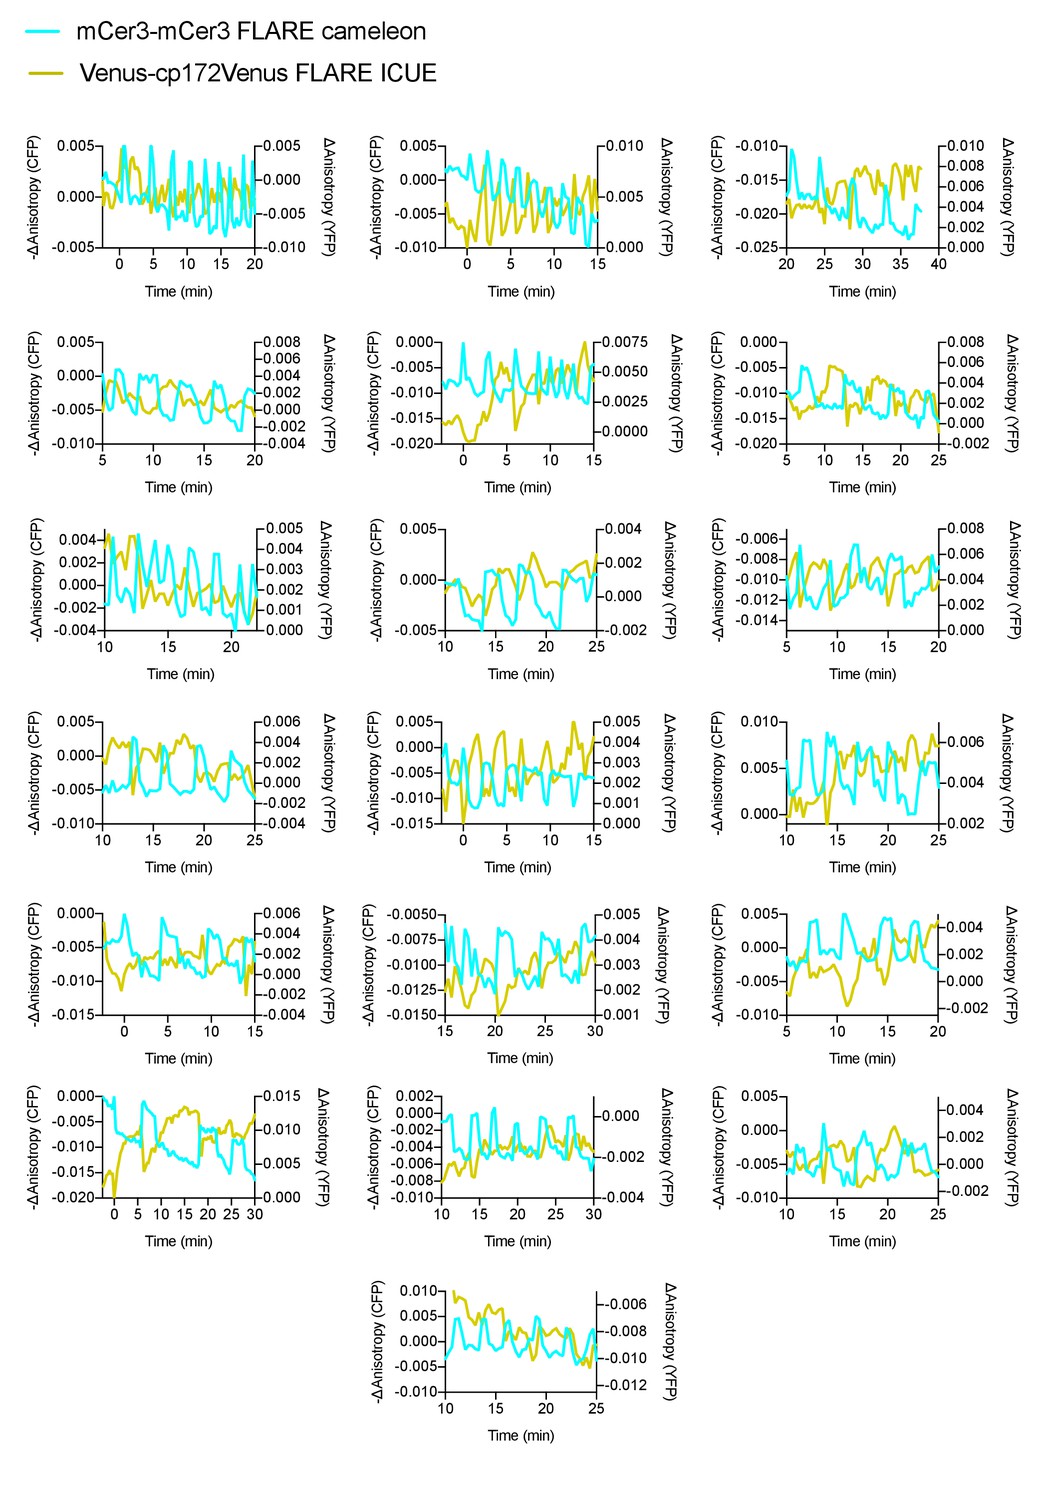
Additional cell traces for mCer3-mCer3 FLARE-Cameleon and Venus-cp172Venus ICUE, coexpressed in MIN6 cells, showing out of phase oscillations upon stimulation with TEA (N = 19).
Figure 4—figure supplement 5
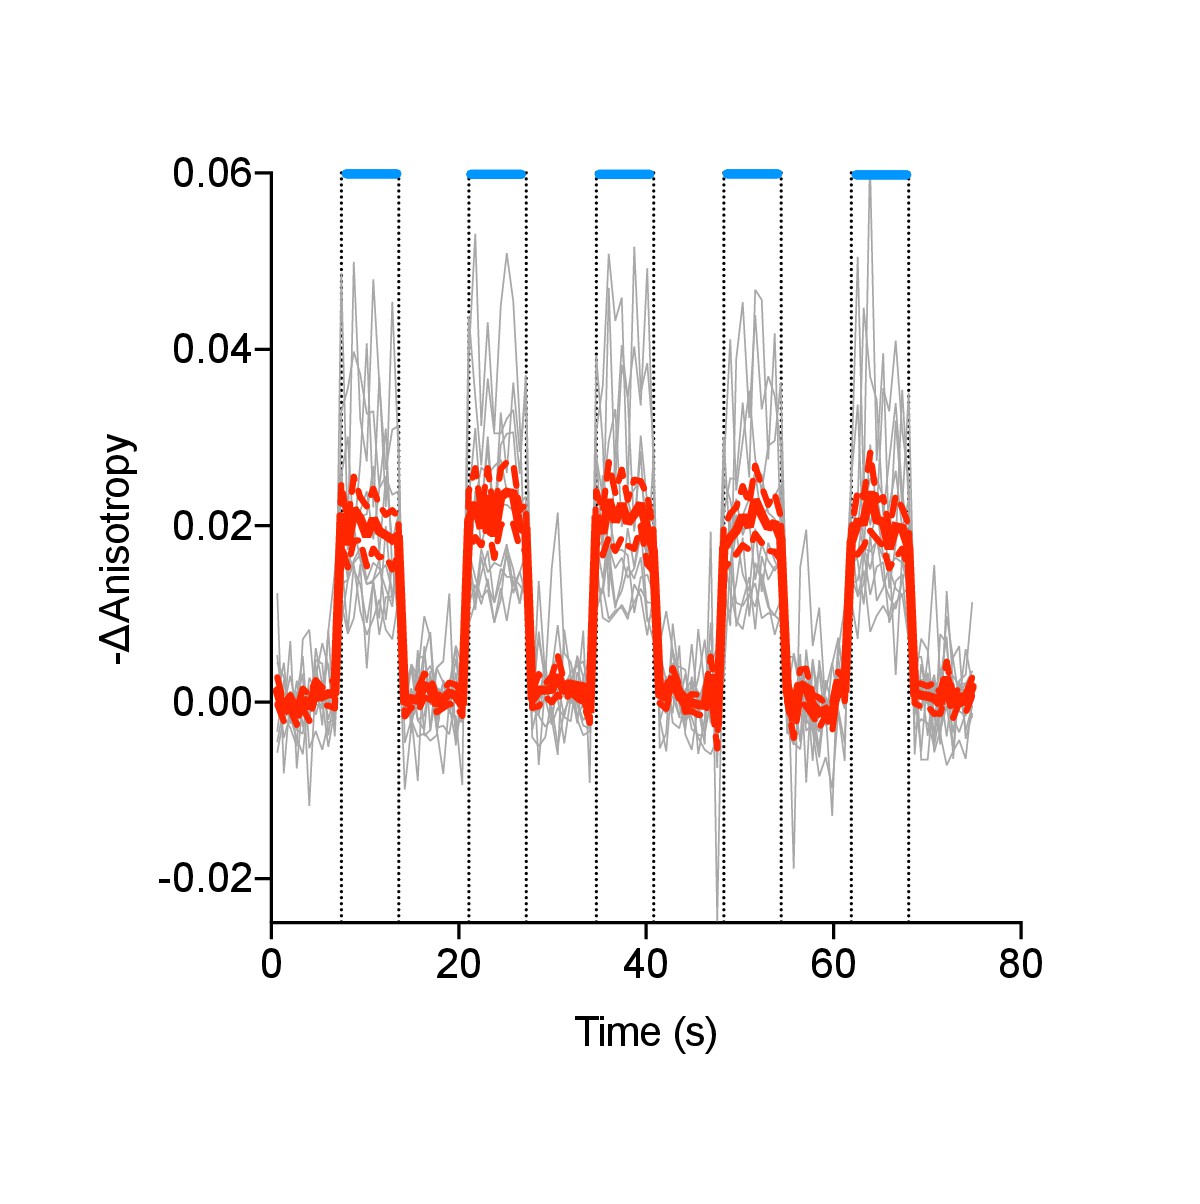
Individual (gray) and average (red) cell traces for Venus-cp172Venus FLARE AKAR co-expressed with hChR2-ER, with intermittent exposures to 455 nm light (N = 11).
Dashed lines reflect the standard error of the mean.
Author response image 1
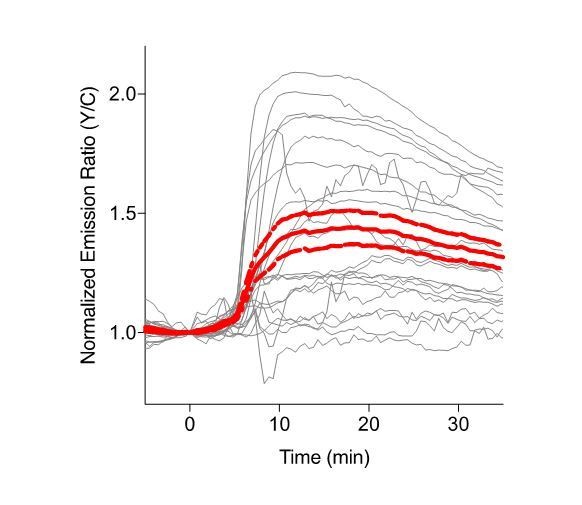
Single cell traces of EKAR2.3-EV, in HEK cells.EKAR2.3-EV with a nuclear exclusion sequence was expressed in HEK cells, and cells were stimulated with 100ng/mL epidermal growth factor (EGF) at t=0.
Author response image 2
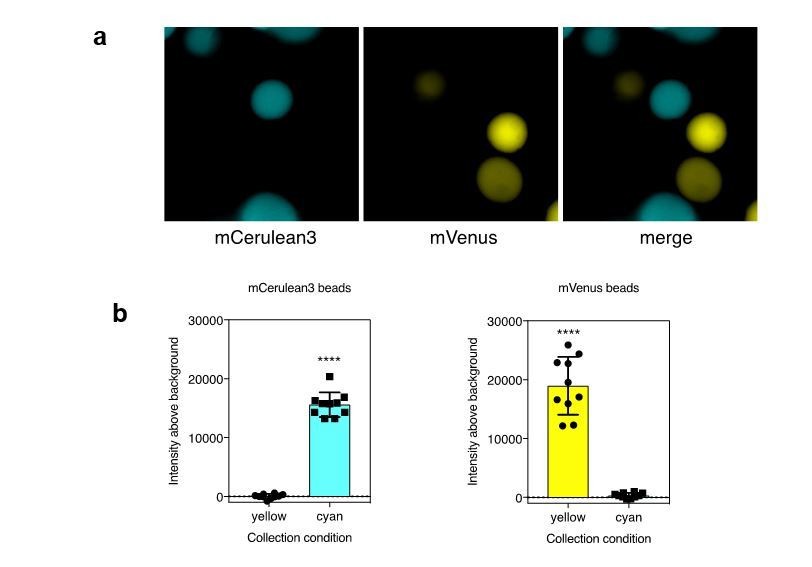
a). Agarose beads were separately labeled with recombinant mCerulean3 or mVenus. Imaging was performed using collection conditions specific for mCerulean3 or mVenus. b). The fluorescence intensity above background was measure for CFP and YFP labeled beads in each channel (n=10 beads per fluorescent protein; ****, p < 0.0001 by t-test.
Tables
Table 1
Signal to noise ratios for FLARE biosensors.
| Sensor | Signal to noise ratio (± SEM) |
|---|---|
| Venus-cp172Venus FLARE AKAR | 32 ± 2.0 (N = 32) |
| mVenus-mVenus FLARE AKAR | 10 ± 1.6 (N = 32) |
| EGFP-EGFP FLARE AKAR | 6 ± 0.6 (N = 32) |
| mCherry-mCherry FLARE AKAR | 14 ± 1.5 (N = 22) |
| mCerulean3-mCerulean3 FLARE AKAR | 3 ± 0.5 (N = 10) |
| mCerulean3-cp173 Cerulean3 FLARE AKAR | 5 ± 0.3 (N = 26) |
| Venus-cp172Venus FLARE EKAR | 17 ± 3.1 (N = 8) |
| mCherry-mCherry FLARE EKAR | 4 ± 0.8 (N = 10) |
| mCerulean3-mCerulean3 FLARE EKAR | 9 ± 2.3 (N = 9) |
| Venus-cp172Venus FLARE CKAR | 27 ± 3.3 (N = 26) |
| mCherry-mCherry FLARE CKAR | 14 ± 3.0 (N = 8) |
| mCerulean3-mCerulean3 FLARE CKAR | 9 ± 1.7 (N = 6) |
| FLARE-MLCK | 8 ± 0.8 (N = 13) |
| Venus-cp172Venus FLARE Cameleon | 19 ± 4.8 (N = 10) |
| mCherry-mCherry FLARE Cameleon | 5 ± 0.8 (N = 23) |
| mCerulean3-mCerulean3 FLARE Cameleon | 9 ± 1.5 (N = 11) |
| Venus-cp172 Venus FLARE ICUE | 19 ± 1.2 (N = 40) |
Key resources table
| Reagent type (species) or resource | Designation | Source or reference | Identifiers |
|---|---|---|---|
| Cell Line (Homo sapiens) | HEK293-T | RRID:CVCL_0063 | |
| Cell Line (Homo sapiens) | HeLa | RRID:CVCL_0030 | |
| Cell Line (Mus musculus) | Min6 | RRID:CVCL_0431 | |
| Cell Line (Rattus norvegicus) | REF-52 | RRID:CVCL_6848 | |
| Chemical Compound, Drug | Forskolin | LC Laboratories | F9929 |
| Chemical Compound, Drug | 3-Isobutyl-1-methylxanthine (IBMX) | Sigma | I5879 |
| Chemical Compound, Drug | H-89 | LC Laboratories | H5239 |
| Chemical Compound, Drug | Epidermal Growth Factor (EGF) | Sigma | E9644 |
| Chemical Compound, Drug | U0126 | Sigma | U120 |
| Chemical Compound, Drug | Phorbol 12-Myristate 13-Acetate (PMA) | LC Laboratories | P-1680 |
| Chemical Compound, Drug | Tetraethylammonium chloride (TEA) | Sigma | T2265 |
| Chemical Compound, Drug | ionomycin | EMD Millipore | 407951 |
| Chemical Compound, Drug | thapsigargin | Cayman Chemical | 10522 |
| Chemical Compound, Drug | histamine | Sigma | H7250 |
| Commerical Kit | Lipofectamine-2000 | Invitrogen | 11668019 |
| Commerical Kit | Polyjet | SignaGen | SL100688 |
| Recombinant DNA Reagent | pCDNA3 AKAR4 | PMID: 20838685 | |
| Recombinant DNA Reagent | pCDNA3 EKAR-EV | PMID: 21976697 | |
| Recombinant DNA Reagent | pCDNA3 CKAR1 | PMID: 12782683 | |
| Recombinant DNA Reagent | FRET MLCK sensor | PMID: 15071183 | |
| Recombinant DNA Reagent | pCDNA3 YC3.6 Cameleon | PMID: 10051607 | |
| Recombinant DNA Reagent | pCDNA3 ICUE3 | PMID: 19603118 | |
| Strain (Escherichia coli) | BL-21 Codon Optimized Plus | New England Biolabs | C2527 |
| Software | FIJI | RRID:SCR_014294 | |
| Software | MetaFluor | RRID:SCR_002285 | |
| Software | Micromanager | RRID:SCR_000415 | |
| Software | Zeiss Actiovision | RRID:SCR_002677 | |
| Software | MATLAB | RRID:SCR_001622 | |
| Software | GraphPad Prism | RRID:SCR_002798 |
Additional files
Download links
A two-part list of links to download the article, or parts of the article, in various formats.
Downloads (link to download the article as PDF)
Open citations (links to open the citations from this article in various online reference manager services)
Cite this article (links to download the citations from this article in formats compatible with various reference manager tools)
Single-color, ratiometric biosensors for detecting signaling activities in live cells
eLife 7:e35458.
https://doi.org/10.7554/eLife.35458


