Human axial progenitors generate trunk neural crest cells in vitro
- The University of Sheffield, United Kingdom
- High Performance Computing and Networking Institute, National Research Council of Italy, Italy
- Technische Universität Dresden, Germany
- University of Sheffield, United Kingdom
- University of Cambridge, United Kingdom
- Max Delbrück Center for Molecular Medicine, Germany
- The Francis Crick Institute, United Kingdom
- University of Edinburgh, United Kingdom
Figures
Figure 1 with 1 supplement
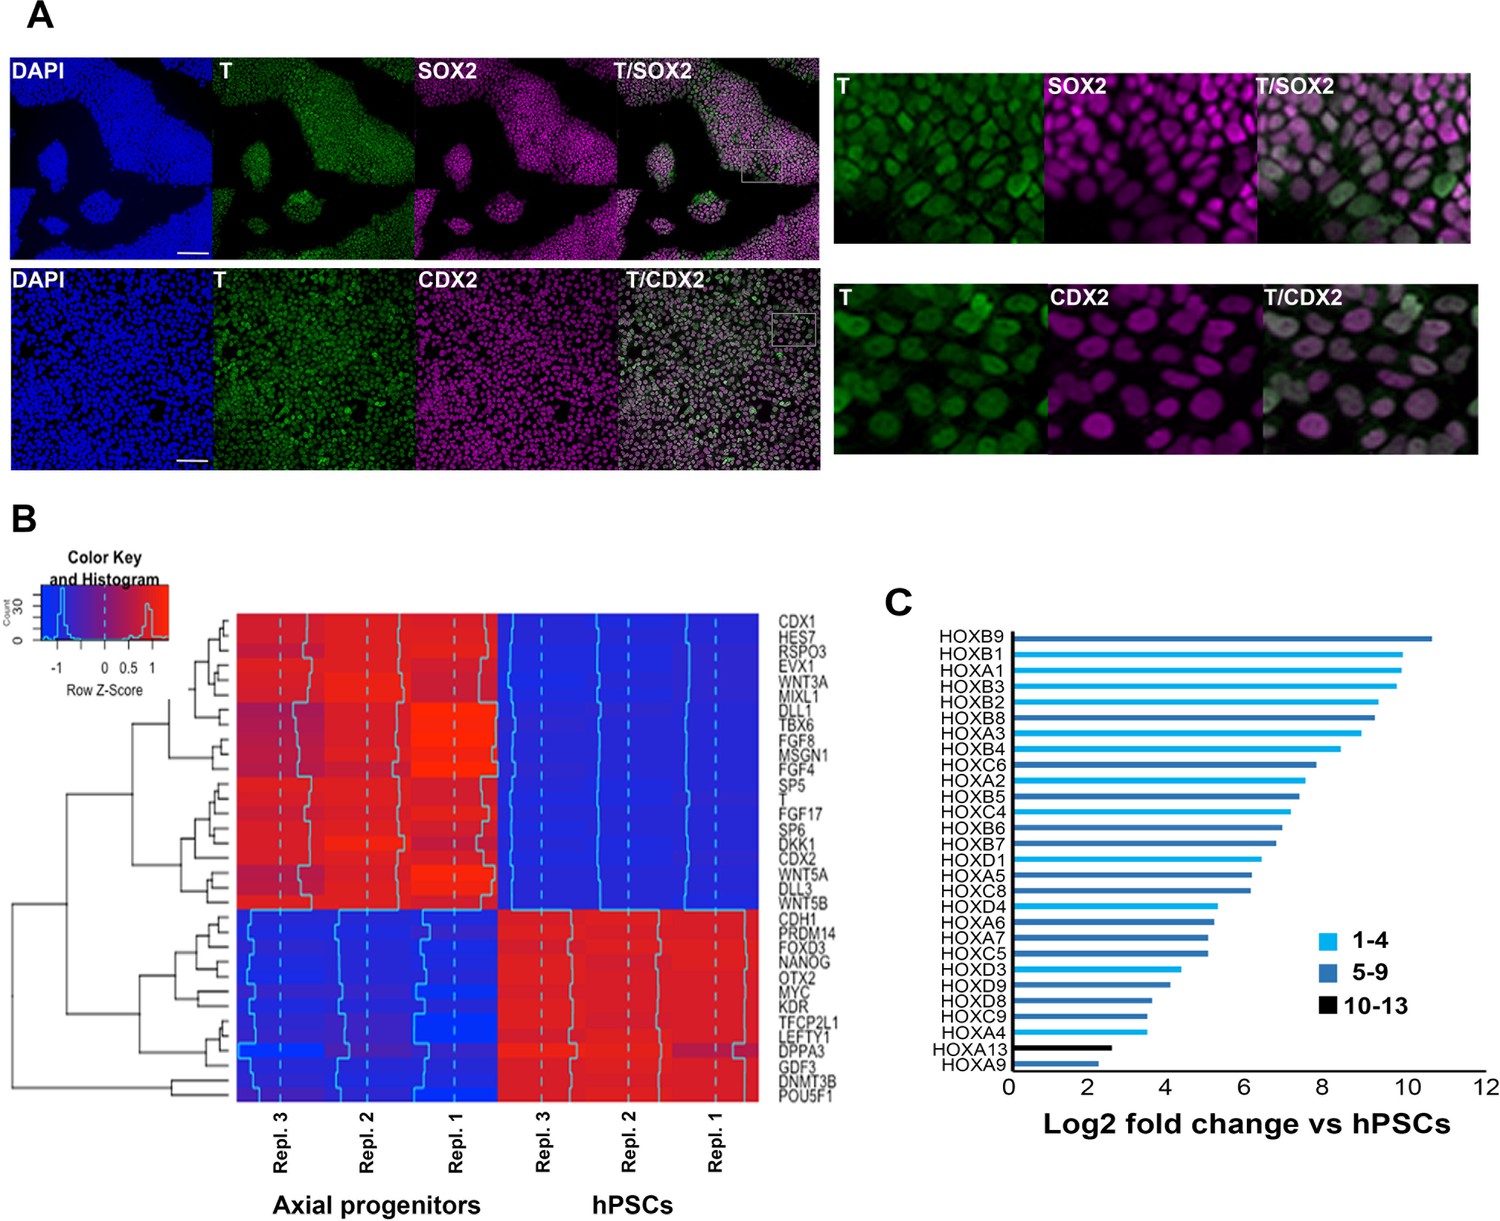
Transcriptome analysis of in vitro-derived human axial progenitors.
(A) Immunofluorescence analysis of expression of indicated markers in day 3 hPSC-derived axial progenitors. Magnified regions corresponding to the insets are also shown. Scale bar = 100 µm. (B) Heatmap showing the expression values of selected markers in three independent axial progenitor and hPSC sample replicates. The expression values (FPKM) were scaled to the row mean. The color key relates the heat map colors to the standard score (z-score). (C) Induction of all significantly upregulated HOX transcripts in axial progenitors relative to hPSCs. Paralogous HOX groups corresponding to different axial levels such as cervical (groups 1–4), brachial/thoracic (groups 5-9)and lumbosacral (groups 10-13) are indicated.
Figure 1—figure supplement 1
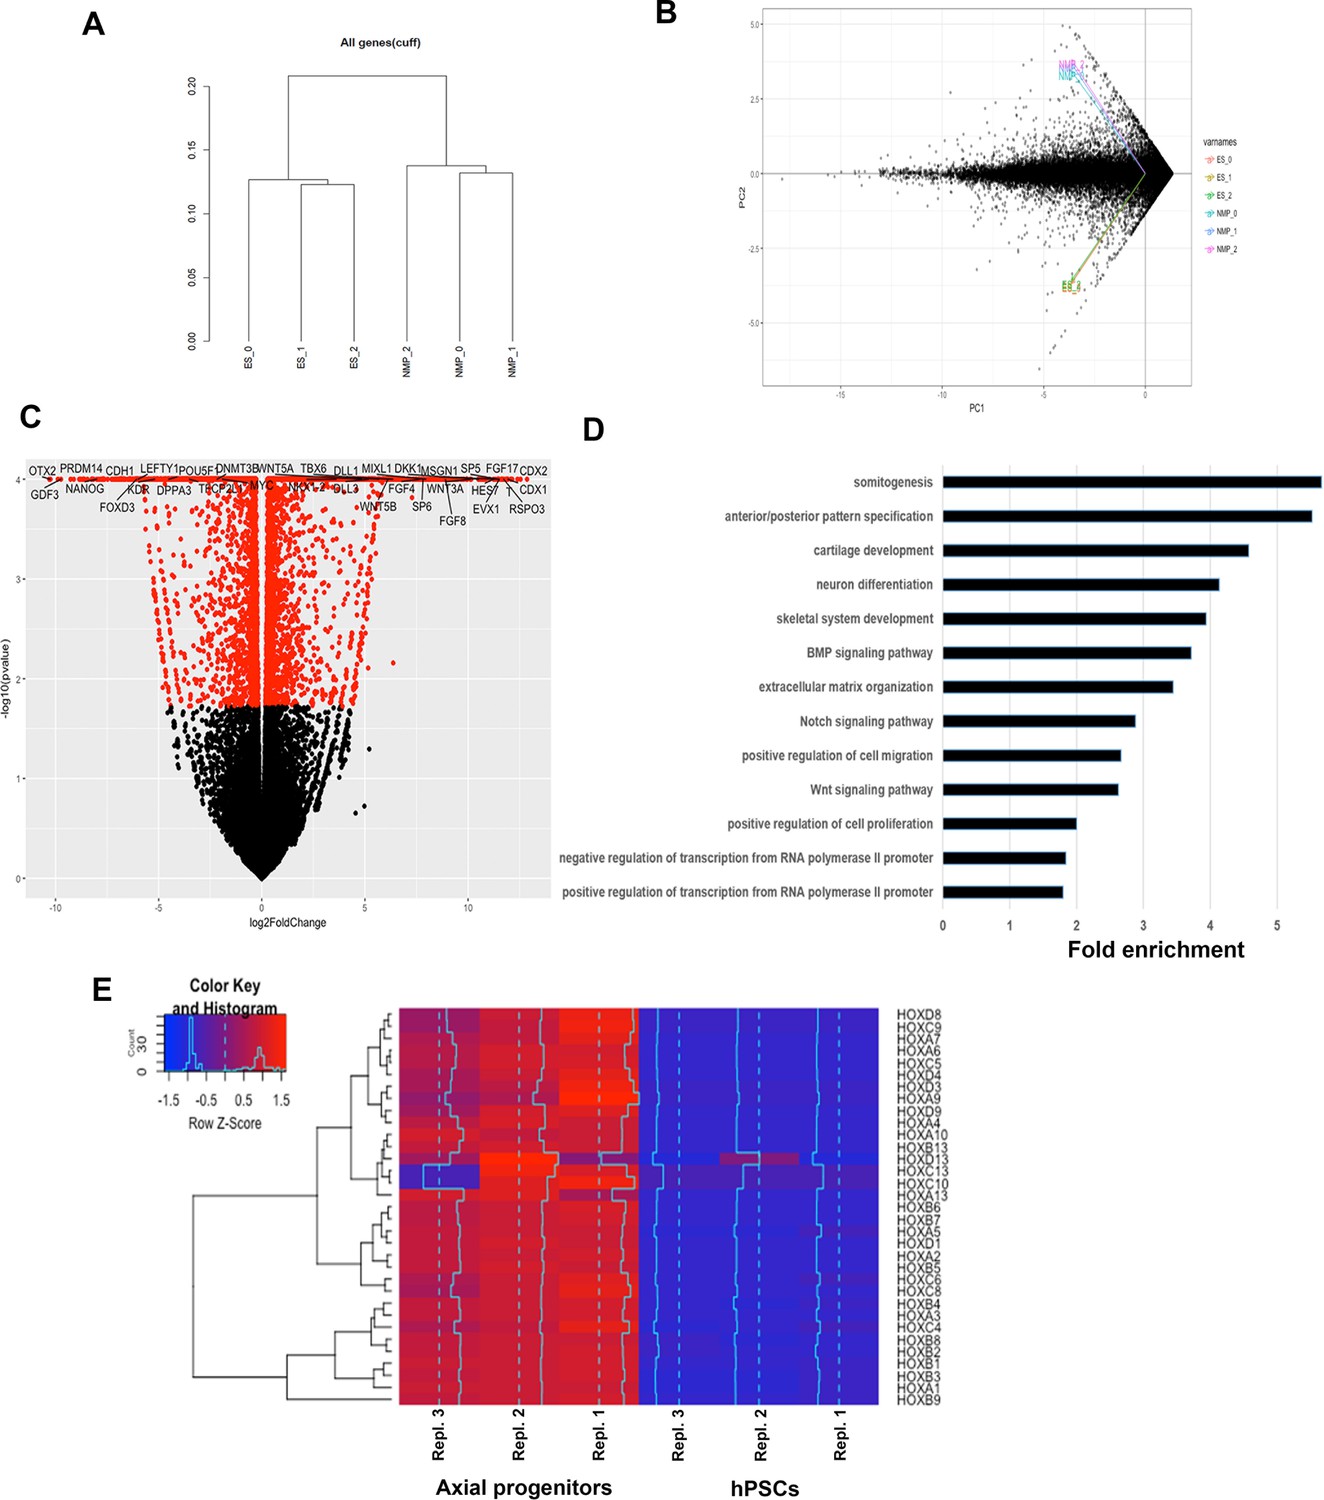
RNASeq analysis of in vitro-derived axial progenitors.
(A) Dendrogram showing the clustering of the individual axial progenitor (NMP) and hESC sample replicates based on RNAseq expression data. (B) Principal Component Analysis (PCA) plot indicates a good separation, in terms of gene expression, between the two conditions and a good replication among samples. (C) Volcano plot reporting pvalue (y axis) as a function of log2 fold change (x axis) between the axial progenitor and hPSC groups. The red dots depict significant genes (pvalue <= 0.05). Top differentially expressed transcriptional regulators of axis elongation and WNT/FGF/NOTCH/RA signalling pathway components are shown. (D) Top gene ontology groups significantly enriched in axial progenitors vs hPSCs. (E) Hierarchical clustering heatmap showing the expression values of HOX genes in axial progenitor and hPSC sample replicates. The expression values (FPKM) were scaled to the row mean. The color key relates the heat map colors to the standard score (z-score).
Figure 2 with 1 supplement
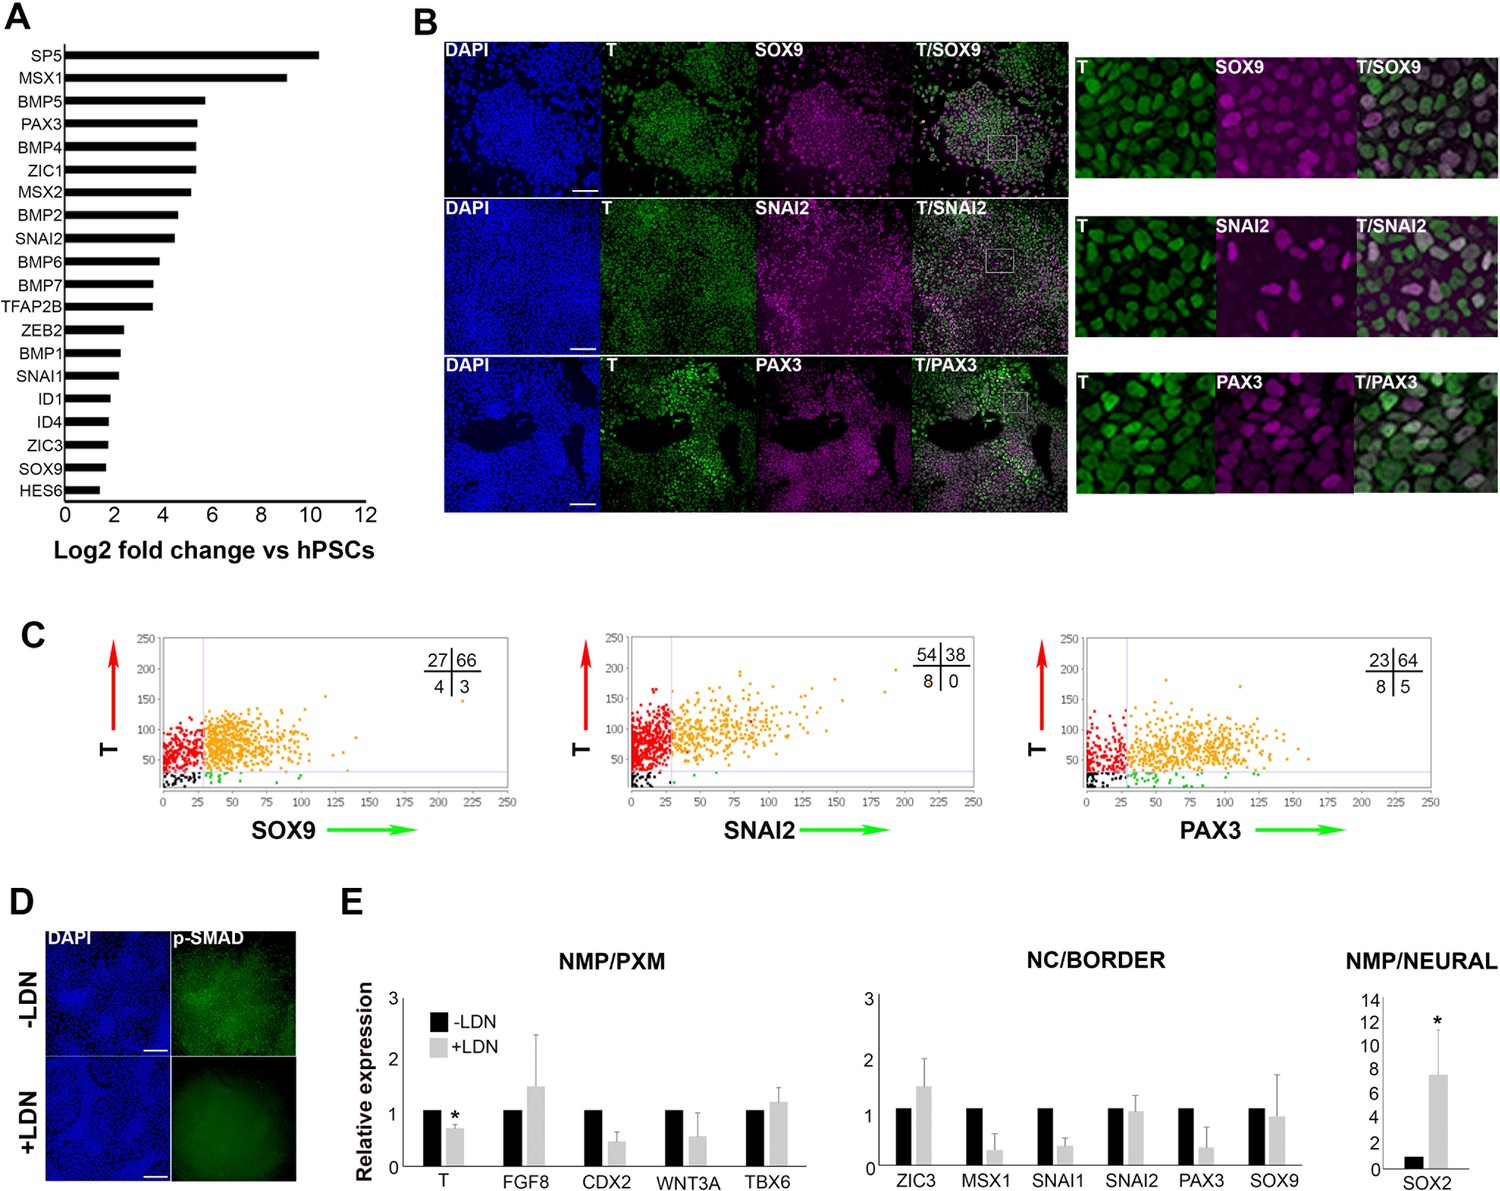
Human axial progenitor cultures exhibit a neural crest/border signature.
(A) Log-fold induction of representative neural crest/neural plate border and BMP-associated transcripts in axial progenitors compared to hESCs. (B) Immunofluorescence analysis of expression of indicated markers in axial progenitors. Magnified regions corresponding to the insets are also shown. Scale bar = 100 µm. (C) Graphs showing the correlation of indicated NC/border markers with T in hPSC-derived (MasterShef7 line) axial progenitors. Each graph corresponds to one scored representative random field and reflects the results from the analysis of 3–5 random fields. Numbers in each quadrant represent percentages of cells belonging to different categories. Numbers of nuclei analysed in each graph: N = 785 (T-SOX9), N = 940 (T-SNAI2), N = 720 (T-PAX3). (D) Immunofluorescence analysis of expression of phosphorylated SMAD1/5 (p-SMAD) in the presence and absence of the BMP inhibitor LDN193189 (LDN). Scale bar = 100 µm. (E) qPCR expression analysis of indicated markers in axial progenitors in the presence (+) or absence (-) of LDN. Error bars = S.D. (n = 3). In all cases nuclei were counterstained with DAPI. PXM, paraxial mesoderm; NC, neural crest. *p<0.05, Paired t-test.
-
Figure 2—source data 1
Raw data for Figure 2.
- https://doi.org/10.7554/eLife.35786.007
Figure 2—figure supplement 1
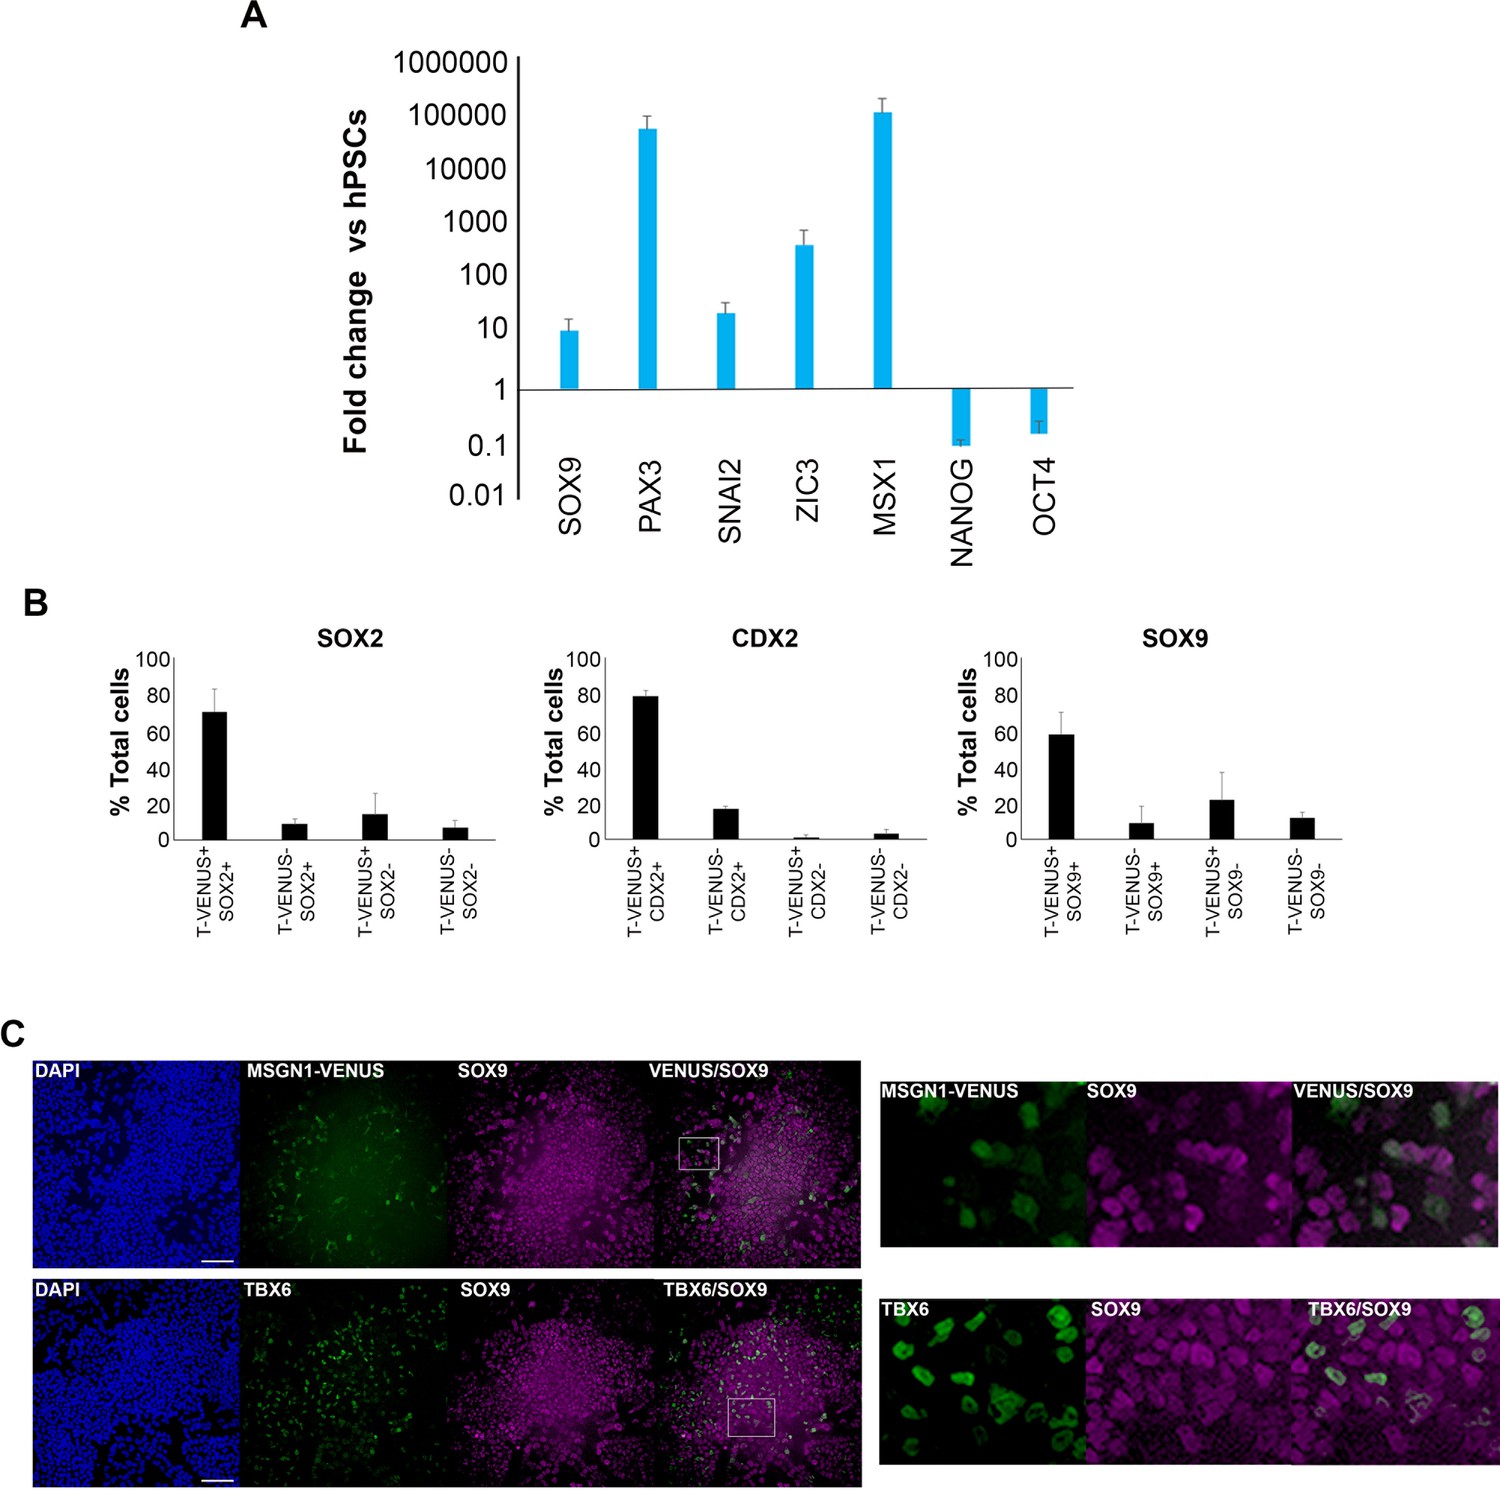
Dissecting the expression of neural crest/border markers in cultures of in vitro-derived axial progenitors.
(A) qPCR expression analysis of indicated NC/border and pluripotency markers in axial progenitors vs hPSCs. Error bars = S.E.M. (n = 3). (B) Quantification of cells marked by different combinations of T-VENUS and indicated NMP/NC-border marker expression in day three axial progenitor cultures derived from a T-VENUS hPSC reporter line (parental line = H9). The data in the graph were obtained after scoring 8–10 random fields per experiment (three independent replicates). The error bars/standard deviation represent the variation across all fields and three experiments. Error bars = s.d. (C) Immunofluorescence analysis of SOX9 expression together with MSGN1-VENUS (top) and TBX6 (bottom) in axial progenitors derived from a MSGN1-VENUS or wild type hPSCs respectively. Scale bar = 100 µm.
-
Figure 2—figure supplement 1—source data 1
Raw data for Figure 2—figure supplement 1.
- https://doi.org/10.7554/eLife.35786.006
Figure 3 with 3 supplements
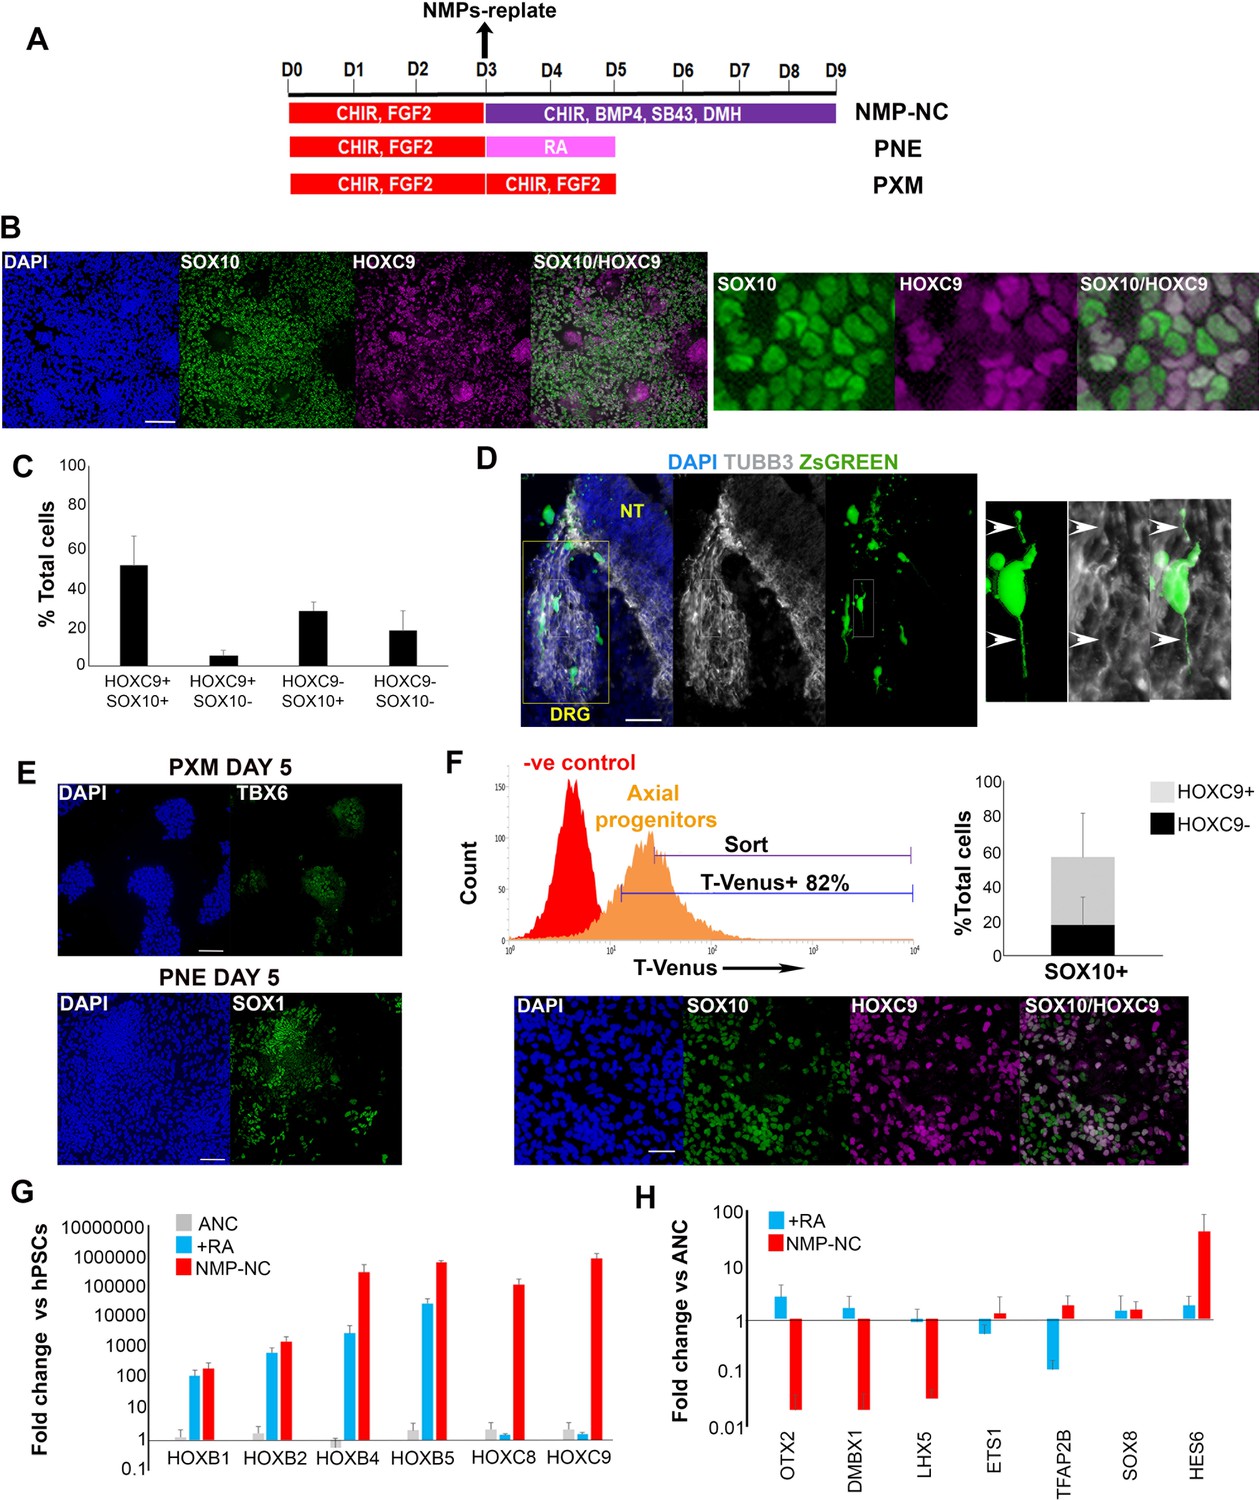
In vitro-derived axial progenitors generate trunk neural crest efficiently.
(A) Diagram depicting the culture conditions employed to direct trunk NC, posterior neurectoderm (PNE) and paraxial mesoderm (PXM) differentiation from hPSC-derived axial progenitors. (B) Immunofluorescence analysis of the expression of the definitive NC marker SOX10 and the thoracic/trunk marker HOXC9 in trunk NC cells derived from axial progenitors after 8 days of differentiation (NMP-NC, see Figure 3A). A magnified region corresponding to the inset is also shown. Scale bar = 100 µm. (C) Quantification of cells marked by different combinations of HOXC9 and SOX10 expression in day eight trunk NC cultures derived from axial progenitors following image analysis. The data in the graph were obtained after scoring three random fields per experiment (two independent replicates) that is a total of 6 fields for two experiments and the error bars/standard deviation represent the variation across all 6 fields and two experiments. Total number of cells scored = 5366, average number of cells/field = 894, error bars = s.d. (D) Immunofluorescence analysis of ZsGREEN and TUBB3 expression in a section of a chick embryo grafted with ZsGREEN+ human axial progenitor-derived trunk NC cells. The DRG region is marked by a yellow box. The images on the right are magnifications of the region marked by the white inset within the DRG region. Arrowheads mark co-localisation of the ZsGREEN and TUBB3 proteins in a donor cell derived, DRG-localised neurite. V, ventral neural tube. Scale bar = 100 µm. (E) Immunofluorescence analysis of TBX6 (left) or SOX1 (right) expression in axial progenitors treated with CHIR-FGF2 (pro-PXM conditions) and RA (pro-PNE conditions) respectively. Scale bar = 100 µm. (F) Top left: Representative FACS histogram indicating the gated T-VENUS +hPSC derived axial progenitors as well as its flow-sorted fraction (‘sort’) which was subsequently plated in NC-inducing conditions. Top right: Average percentage of SOX10+ cells (in relation to HOXC9 expression) following 5 day differentiation of sorted T-VENUS+ axial progenitors in NC-inducing conditions, immunostaining and image analysis. The data in the graph were obtained after scoring 8–10 random fields per experiment (N = 5). The error bars/standard deviation represent the variation across all fields and five experiments. Error bars = s.d. Bottom: A representative field depicting immunofluorescence analysis of SOX10 and HOXC9 expression in NC cells derived from sorted T-VENUS+ axial progenitors. Scale bar = 100 µm. (G) qPCR expression analysis of indicated HOX genes in hPSC-derived anterior cranial (ANC), retinoic acid (RA)-treated NC (+RA), and axial progenitor-derived NC cells (NMP-NC) relative to hPSCs. Error bars = S.E.M. (n = 3). (H) qPCR expression analysis of indicated NC markers in +RA and axial progenitor-derived NC cells relative to untreated anterior cranial NC cells. Error bars = S.E.M. (n = 3).
-
Figure 3—source data 1
Raw data for Figure 3.
- https://doi.org/10.7554/eLife.35786.015
Figure 3—figure supplement 1
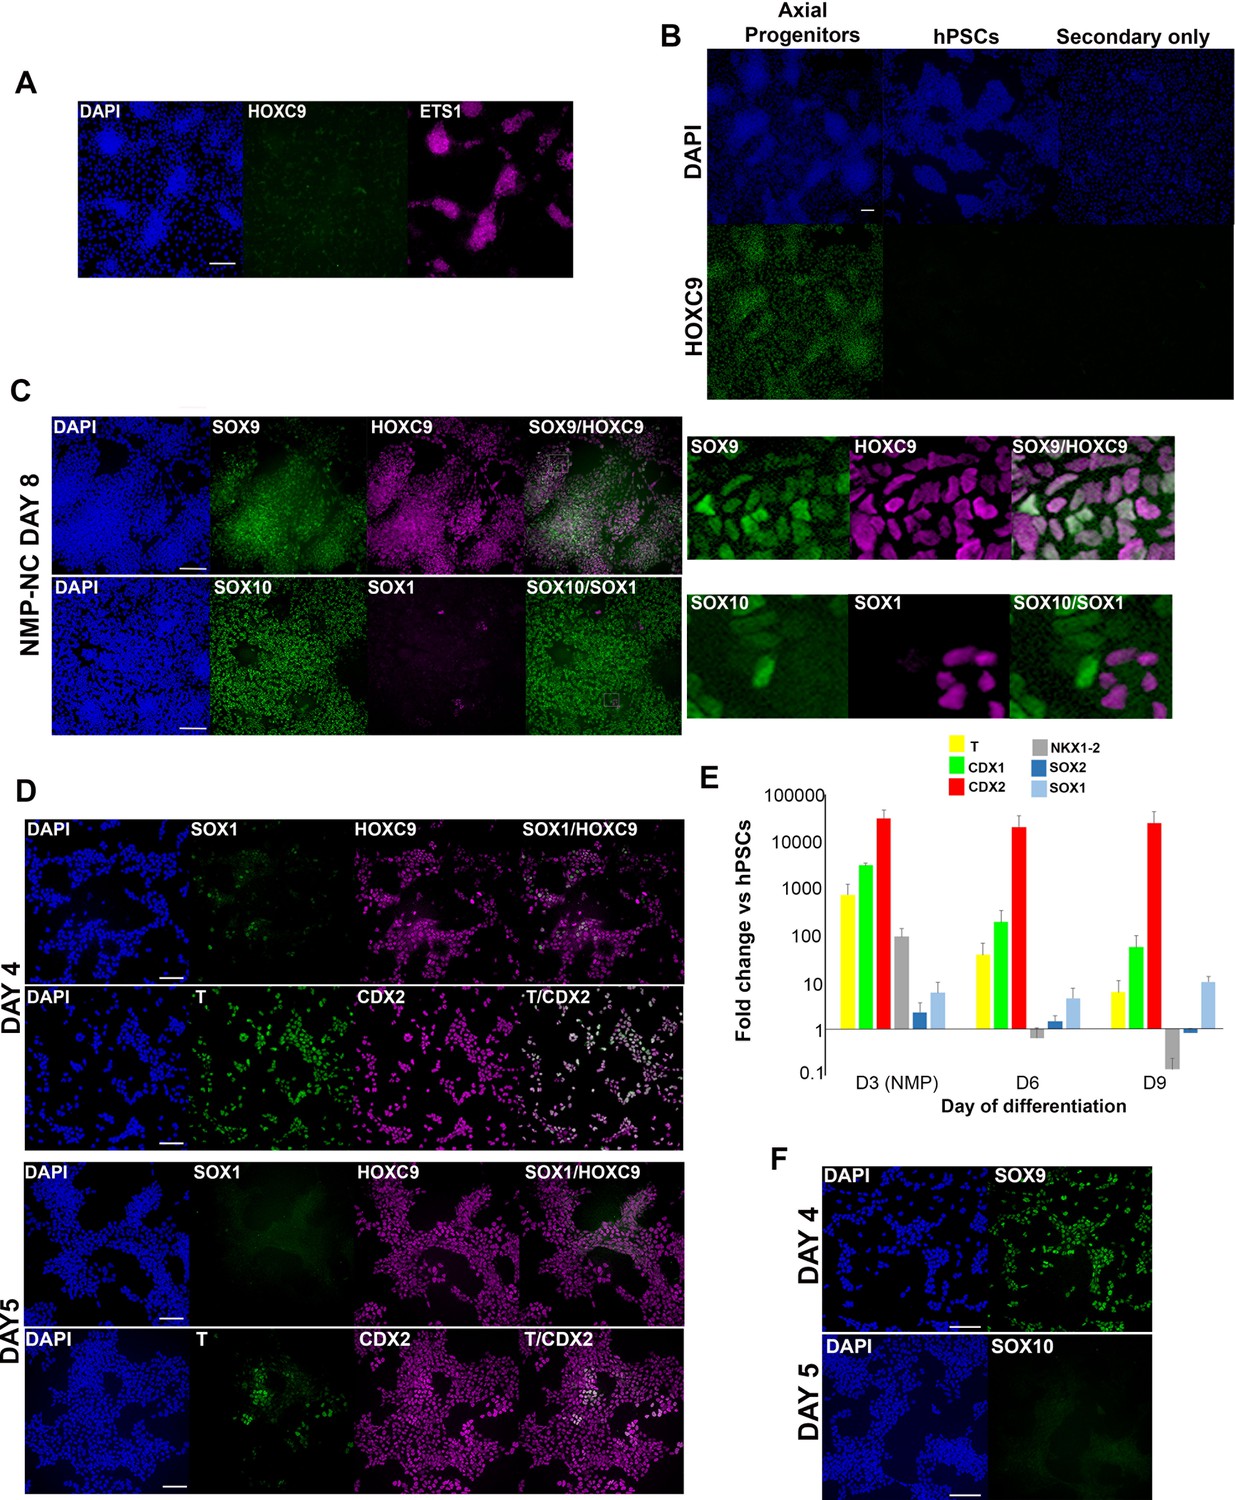
Dynamics of trunk neural crest differentiation from axial progenitors.
(A) Immunofluorescence analysis of HOXC9 and ETS1 expression in cranial NC cells generated from hPSCs as described in (Hackland et al., 2017). Scale bar = 100 µm. (B) Immunofluorescence analysis of HOXC9 expression in day 3 hPSC-derived axial progenitors (=positive control, see Figure 1C, Figure 1—figure supplement 1), undifferentiated hPSCs and differentiated hPSCs incubated only with the corresponding secondary antibody. Scale bar = 100 µm. (C) Immunofluorescence analysis of the expression of the NC markers SOX10/SOX9, neural marker SOX1 and the thoracic/trunk marker HOXC9 in trunk NC cells derived from axial progenitors after 8 days of differentiation. Magnified regions corresponding to the insets are also shown. Note that the SOX10/SOX1 image set and the HOXC9/SOX10 set in Figure 3B correspond to the same cells. Scale bar = 100 µm. (D) Immunofluorescence analysis of indicated markers one (day 4 of differentiation) or two (day 5 of differentiation) days after re-plating axial progenitors into NC inducing conditions. Scale bar = 100 µm. (E) qPCR expression analysis of indicated axial progenitor (NMP) and neural markers during differentiation toward TNC. Error bars = s.e.m. (n = 3) (F) Immunofluorescence analysis of indicated NC markers one (day 4 of differentiation) or two (day 5 of differentiation) days after re-plating axial progenitors into NC inducing conditions. Scale bar = 100 µm.
-
Figure 3—figure supplement 1—source data 1
Raw data for Figure 3—figure supplement 1.
- https://doi.org/10.7554/eLife.35786.010
Figure 3—figure supplement 2
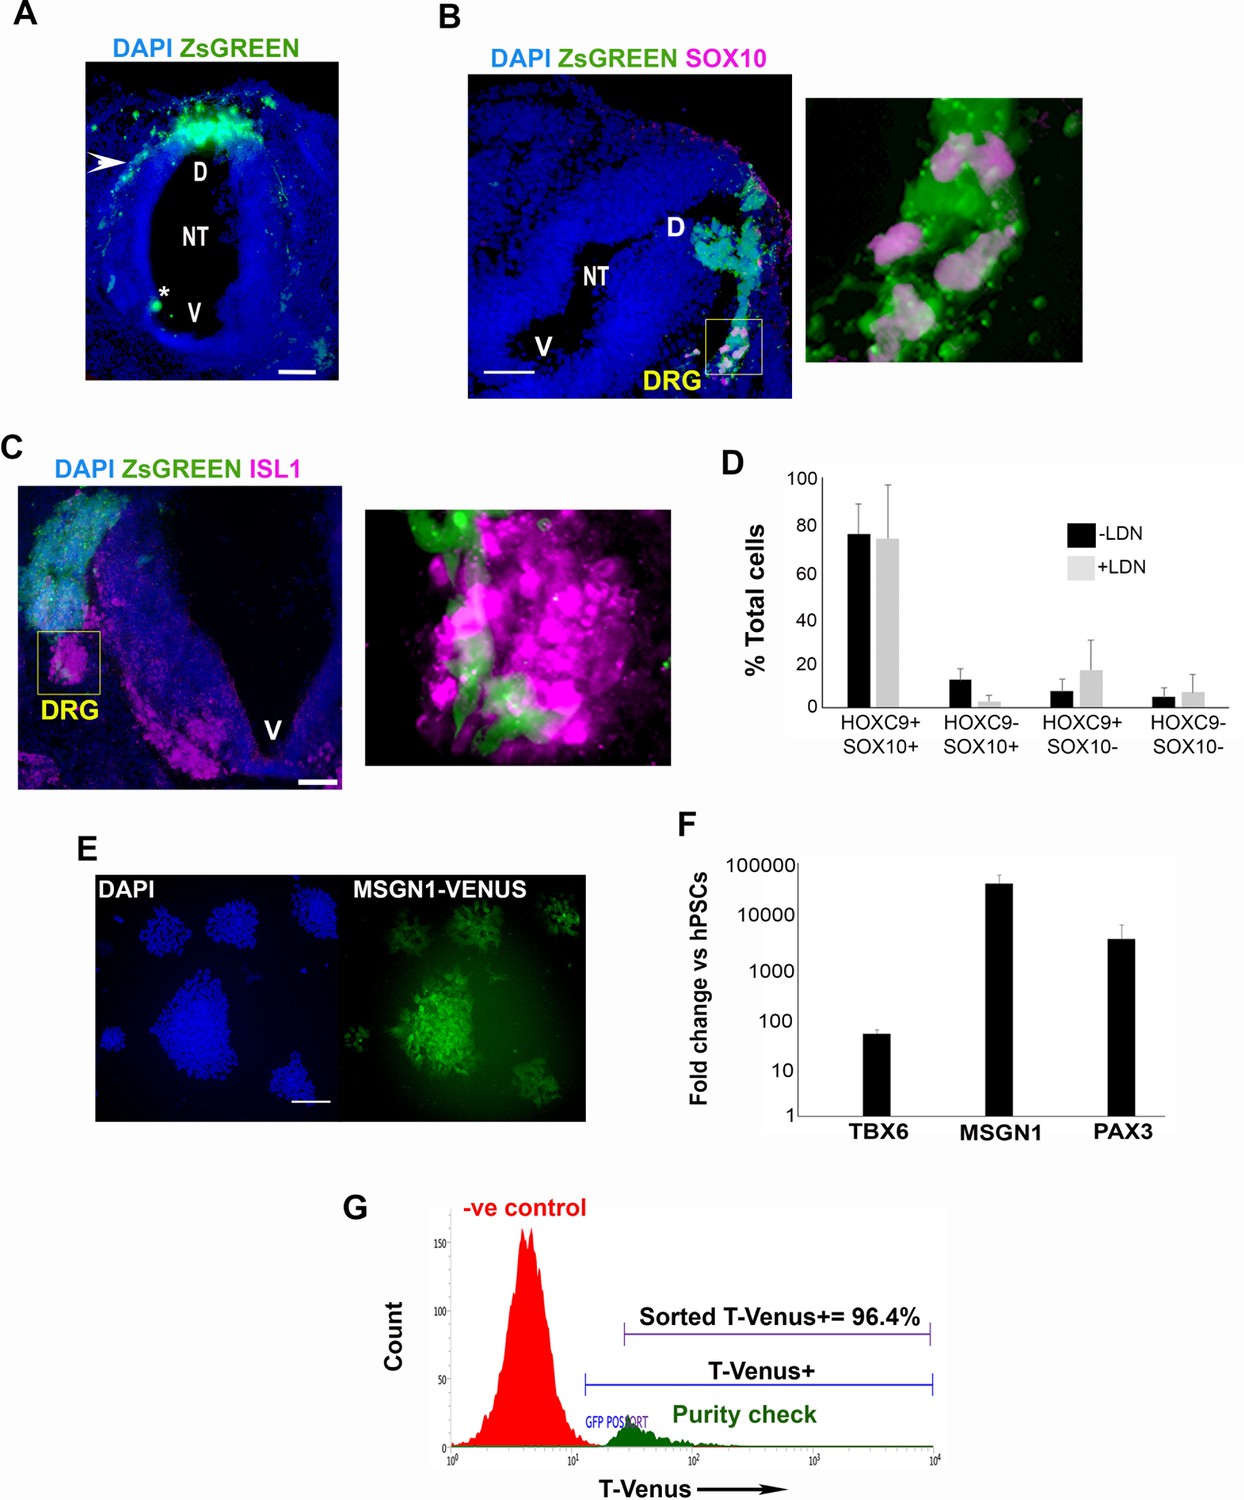
Characterisation of hPSC- derived axial progenitor differentiation products.
(A) Representative section of a chick embryo grafted with ZsGREEN+ human axial progenitor-derived trunk NC cells. The arrowhead indicates a migratory stream of donor human trunk NC cells emerging from the graft site on the dorsal neural tube. Nuclei were counterstained with DAPI. The asterisk marks debris. NT, neural tube; D, dorsal; V, ventral. (B) Immunofluorescence analysis of ZsGREEN and SOX10 expression in a section of a chick embryo grafted with ZsGREEN+ human axial progenitor-derived trunk NC cells. The image on the right is a magnification of the DRG region marked by the box. Note that the anti-SOX10 antibody used detects specifically the human SOX10 protein. V, ventral neural tube. Scale bar = 100 µm. (C) Immunofluorescence analysis of ZsGREEN and ISL1 expression in a section of a chick embryo grafted with ZsGREEN+ human axial progenitor-derived trunk NC cells. The image on the right is a magnification of the DRG region marked by the box. V, ventral neural tube. Scale bar = 100 µm. (D) Quantification of cells marked by different combinations of HOXC9 and SOX10 expression in day eight trunk NC cultures derived from axial progenitors cultured in the presence or absence of LDN during their induction from hPSCs. The data in the graph were obtained after scoring 8–10 random fields per experiment (three independent replicates). The error bars/standard deviation represent the variation across all fields and three experiments. Error bars = s.d. (E) Immunofluorescence analysis of MSGN1-VENUS expression in human axial progenitor-derived PXM cells. Scale bar = 100 µm. (F) qPCR expression analysis of indicated paraxial mesoderm (PXM) markers following differentiation of human axial progenitors toward PXM as indicated in Figure 3A. Error bars = s.d. (n = 2). (G) Representative purity check of sorted T-VENUS+ axial progenitors.
-
Figure 3—figure supplement 2—source data 1
Raw data for Figure 3—figure supplement 2.
- https://doi.org/10.7554/eLife.35786.012
Figure 3—figure supplement 3
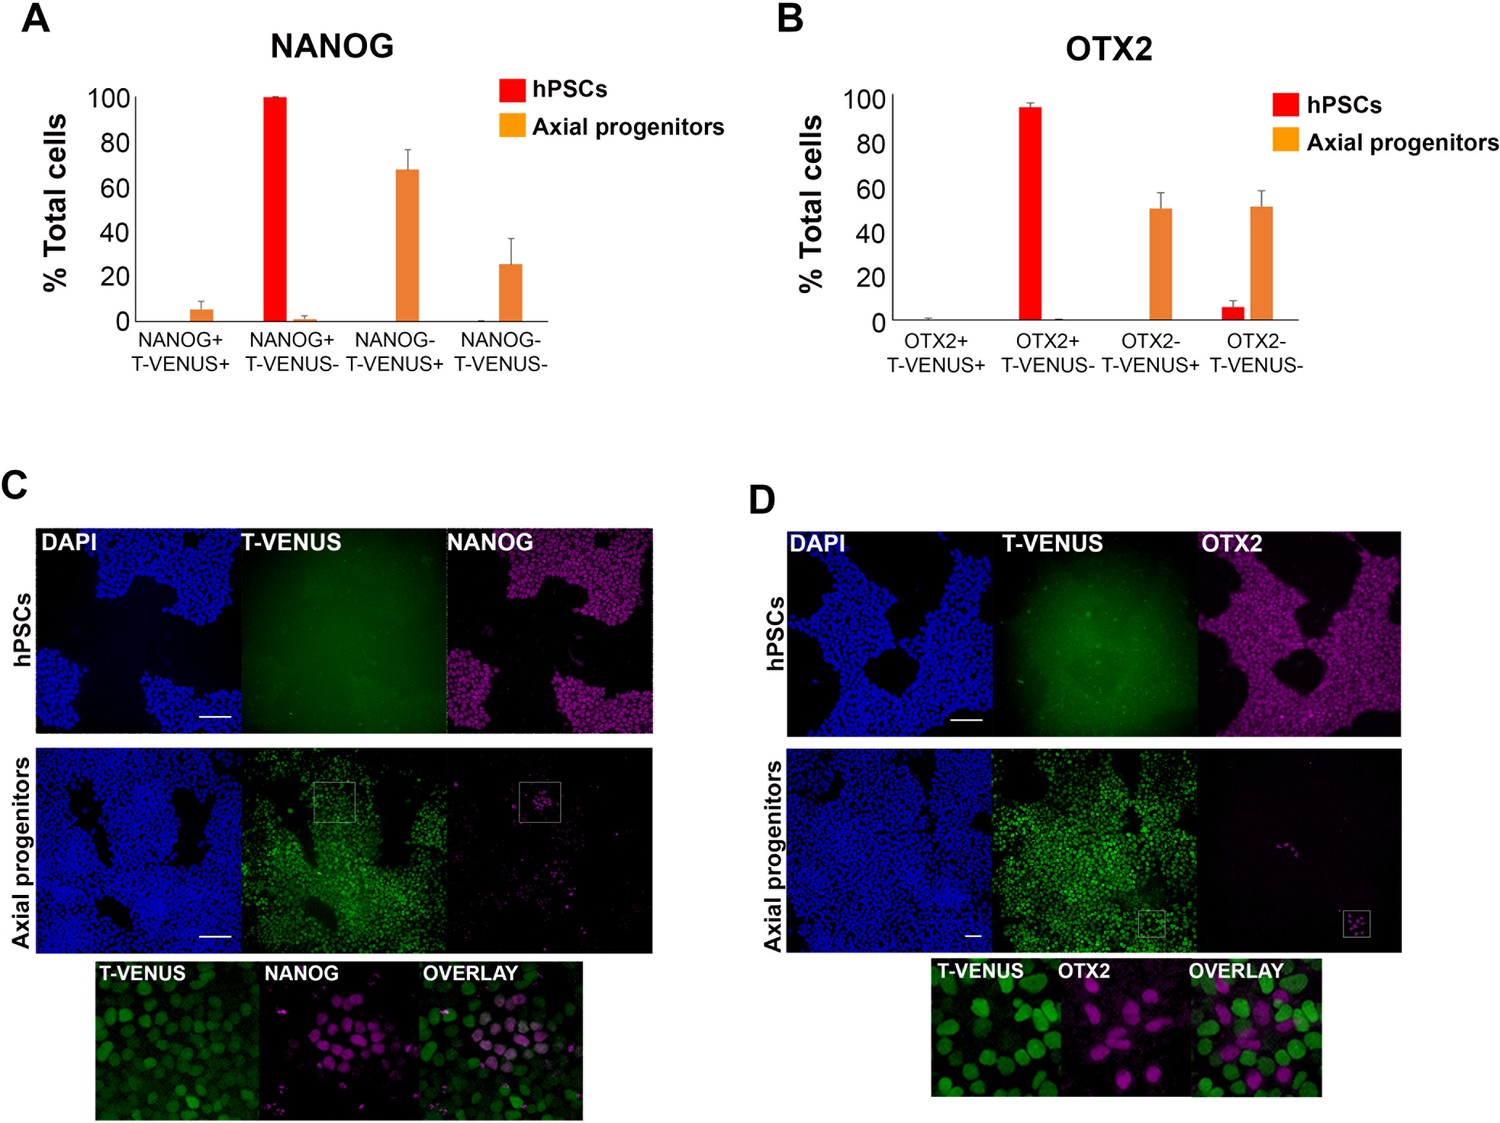
Quantification of pluripotency marker expression in hPSC-derived axial progenitors.
Quantification of cells marked by different combinations of NANOG(A) or OTX2 (B) and T-VENUS expression in undifferentiated hPSCs and axial progenitors. The data in the graph were obtained after scoring 8–10 random fields per experiment (three independent replicates). The error bars/standard deviation represent the variation across all fields and three experiments. Error bars = s.d. (C-D) Images showing rare NANOG+ (C) and OTX2+ (D) cells present in axial progenitor cultures expressing low levels or no T-VENUS respectively. Magnified regions corresponding to the insets are also shown. Scale bar = 100 µm.
-
Figure 3—figure supplement 3—source data 1
Raw data for Figure 3—figure supplement 3.
- https://doi.org/10.7554/eLife.35786.014
Figure 4 with 1 supplement
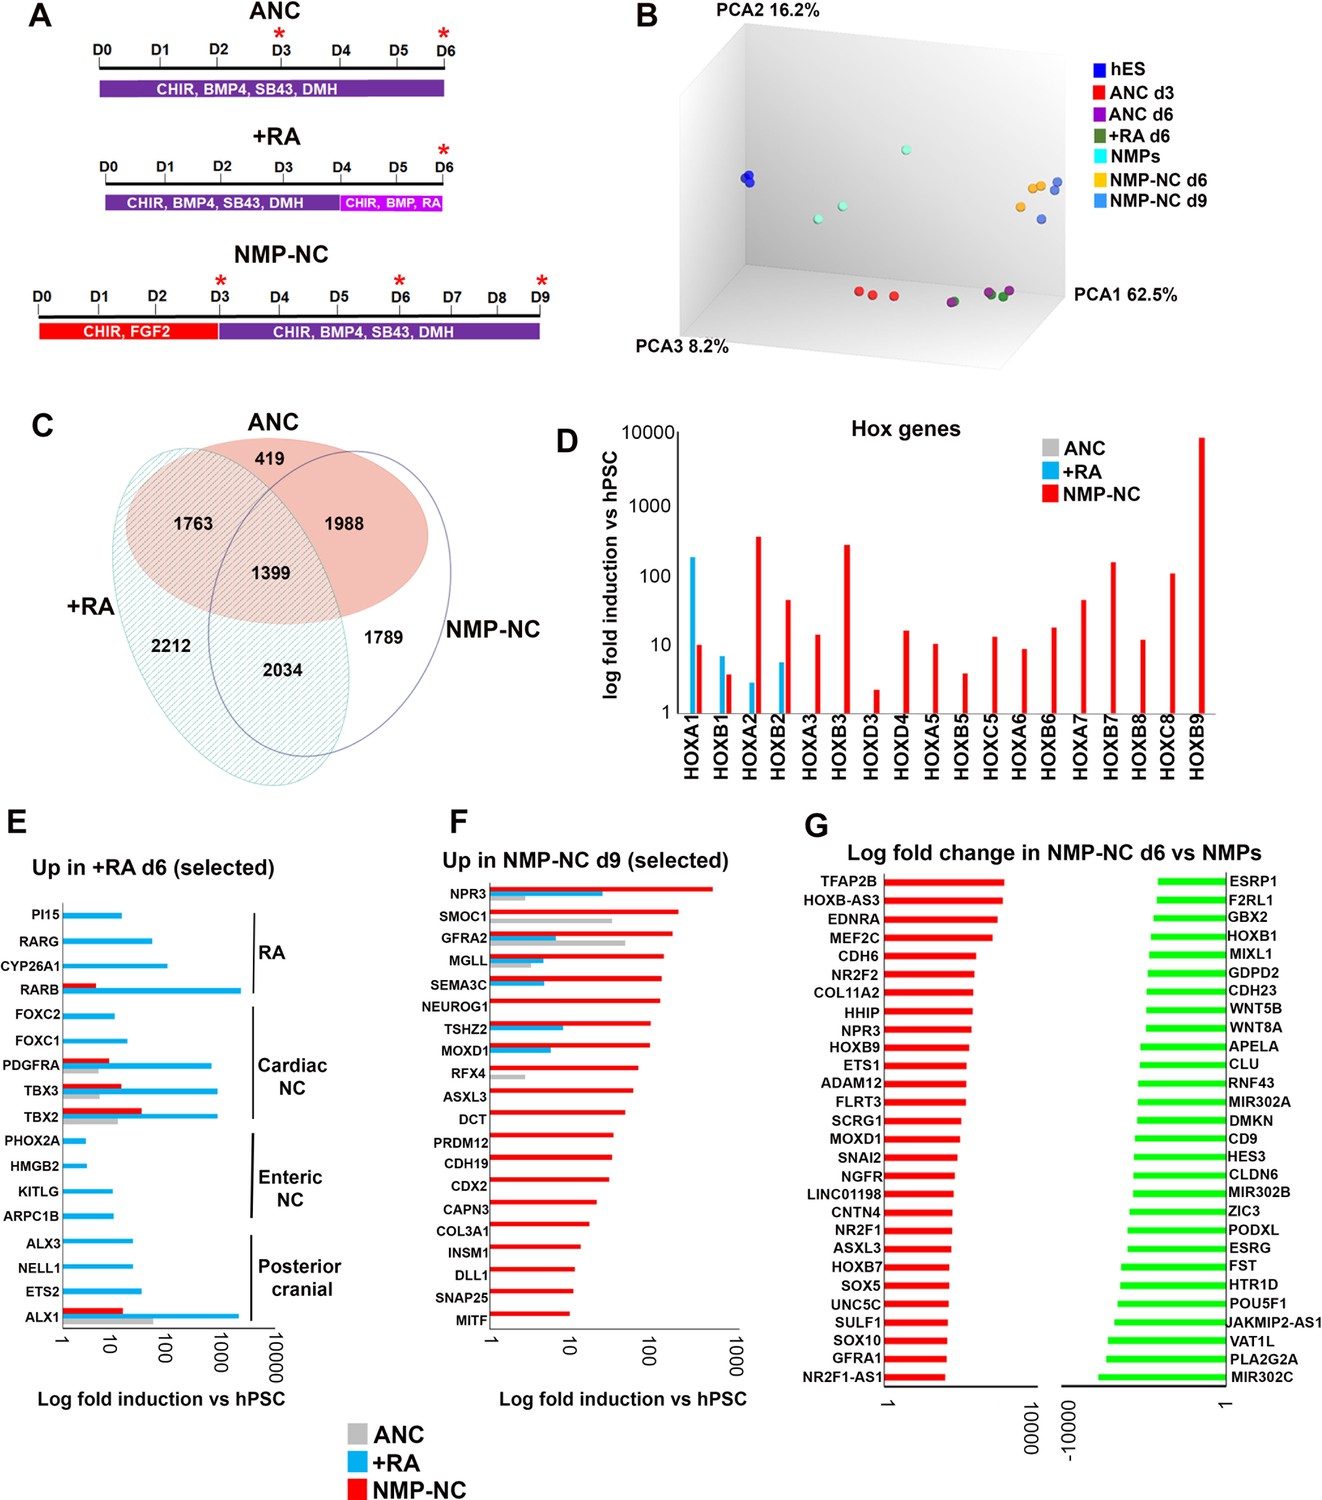
Transcriptome analysis of in vitro derived neural crest cells corresponding to distinct axial levels.
(A) Diagrams showing the culture conditions employed for generating NC cells of distinct axial identities using hPSCs. Asterisks indicate the timepoints used for sample harvesting and transcriptome analysis. D, day of differentiation. ANC, Anterior neural crest. (B) Principal component analysis depicting variance between different samples used for microarray analysis (timepoints shown in A). (C) Venn diagram showing the overlap between all significantly upregulated (≥2 fold relative to undifferentiated hESCs, FDR ≤ 0.05) in each indicated NC group. (D) Log fold induction of selected HOX genes in indicated NC populations relative to hPSCs. (E) Log fold induction of representative significantly upregulated (≥2 fold relative to undifferentiated hPSCs, FDR ≤ 0.05) transcripts marking day 6 RA-treated NC cells. (F) Log fold induction of representative significantly upregulated (≥2 fold relative to undifferentiated hPSCs, FDR ≤ 0.05) transcripts marking day nine axial progenitor-derived NC cells. (G) Log fold changes in the expression of the most-upregulated and most-downregulated transcripts in day six axial progenitor-derived NC precursors compared to d3 hPSC-derived axial progenitors.
Figure 4—figure supplement 1
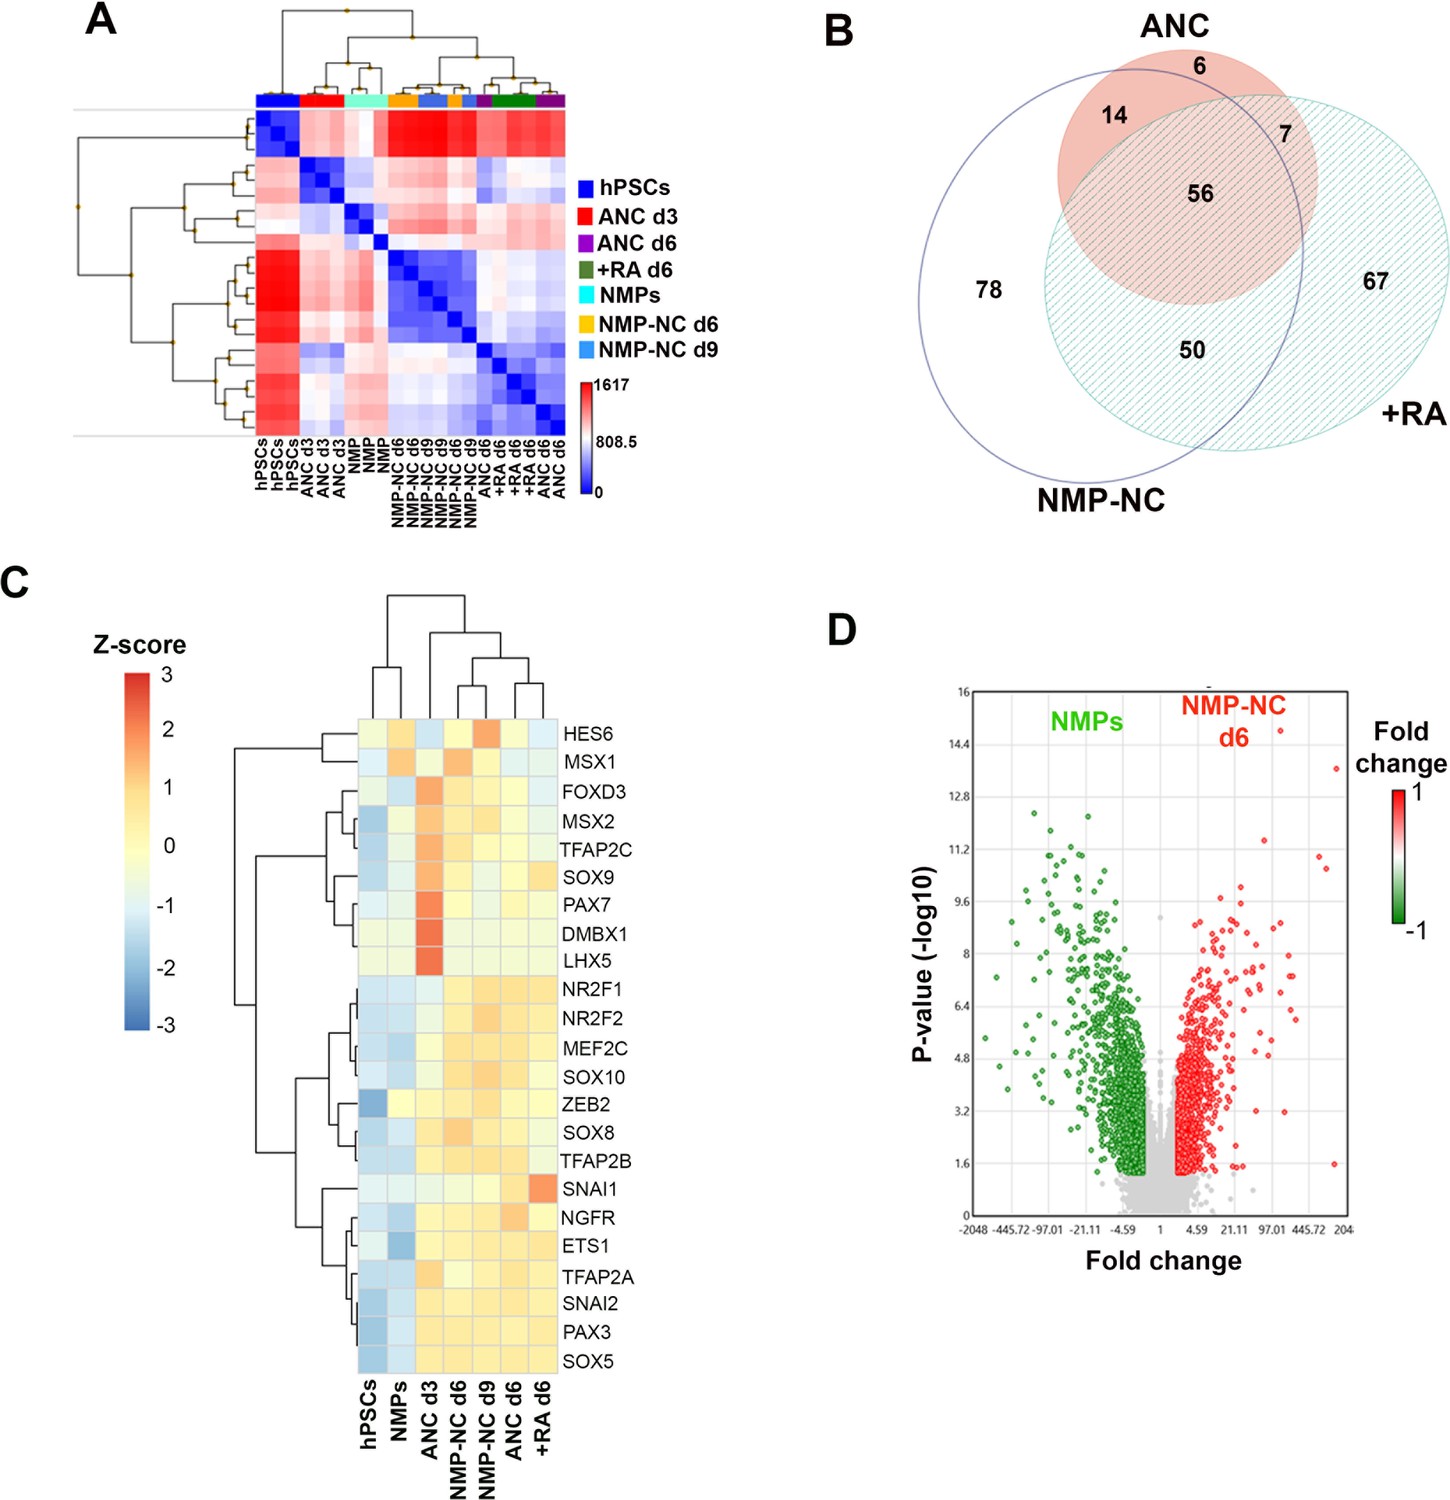
Microarray analysis of hPSC-derived neural crest cells of distinct axial identities.
(A) Heatmap showing Pearson’s signal correlation between indicated samples. (B) Venn diagram showing the overlap between transcription factors (TFs) enriched (≥2 fold relative to undifferentiated hPSCs, FDR ≤ 0.05) in each indicated NC group of distinct axial identity. The detailed list of all TFs can be found in Supplementary file 3. (C) Heatmap showing relative expression of representative NC markers in NC populations of distinct axial identity, their precursors and hPSCs. (D) Volcano plot depicting upregulated (red) and downregulated (green) genes in d6 trunk NC precursors (NMP-NC) vs axial progenitors (=NMPs).
Figure 5 with 1 supplement

Axial progenitor-derived trunk neural crest is an optimal source of sympathoadrenal cells.
(A) Diagram depicting the culture conditions employed to direct axial progenitors (‘NMPs’) toward trunk NC and subsequently sympathoadrenal progenitors (SAP) and sympathetic neurons. (B) FACS analysis of PHOX2B-GFP expression in SAP cells derived from axial progenitors as shown in A. Below: Immunofluorescence analysis of PHOX2B-GFP and PHOX2B protein expression following antibody staining. Scale bar = 100 µm. (C) Quantification of d18 differentiated cells positive for the indicated markers in relation to PHOX2B-GFP expression following antibody staining. In each case four randomly selected representative fields were used to obtain the average number of cells/marker. Total numbers of cells scored: GATA3 (N = 3003), ASCL1 (N = 2575), ISL1 (N = 2963). (D) Immunofluorescence analysis of PHOX2B-GFP together with the indicated markers in day 18 differentiated SAP/sympathetic neurons derived from axial progenitors as shown in A. Scale bar = 100 µm. (E) qPCR expression analysis of indicated SAP/sympathetic neuron markers in d12 and d18 cultures. Error bars = S.E.M. (n = 3). (F) Voltage responses of hPSC-derived sympathetic neurons (after day 19 of differentiation) to current injection. Type I and Type II cells were current clamped and hyperpolarising (negative) and depolarising (positive) current steps were applied (the current injected is shown next to the traces). The resulting membrane potential responses of the cells to these current injections are shown, the traces are overlaid. (G) Analysis of catecholamine production in hPSC-derived sympathetic neurons (after day 19 of differentiation) using a commercial ELISA kit (n = 2). NE, norepinephrine; DA dopamine.
-
Figure 5—source data 1
Raw data for Figure 5.
- https://doi.org/10.7554/eLife.35786.020
Figure 5—figure supplement 1
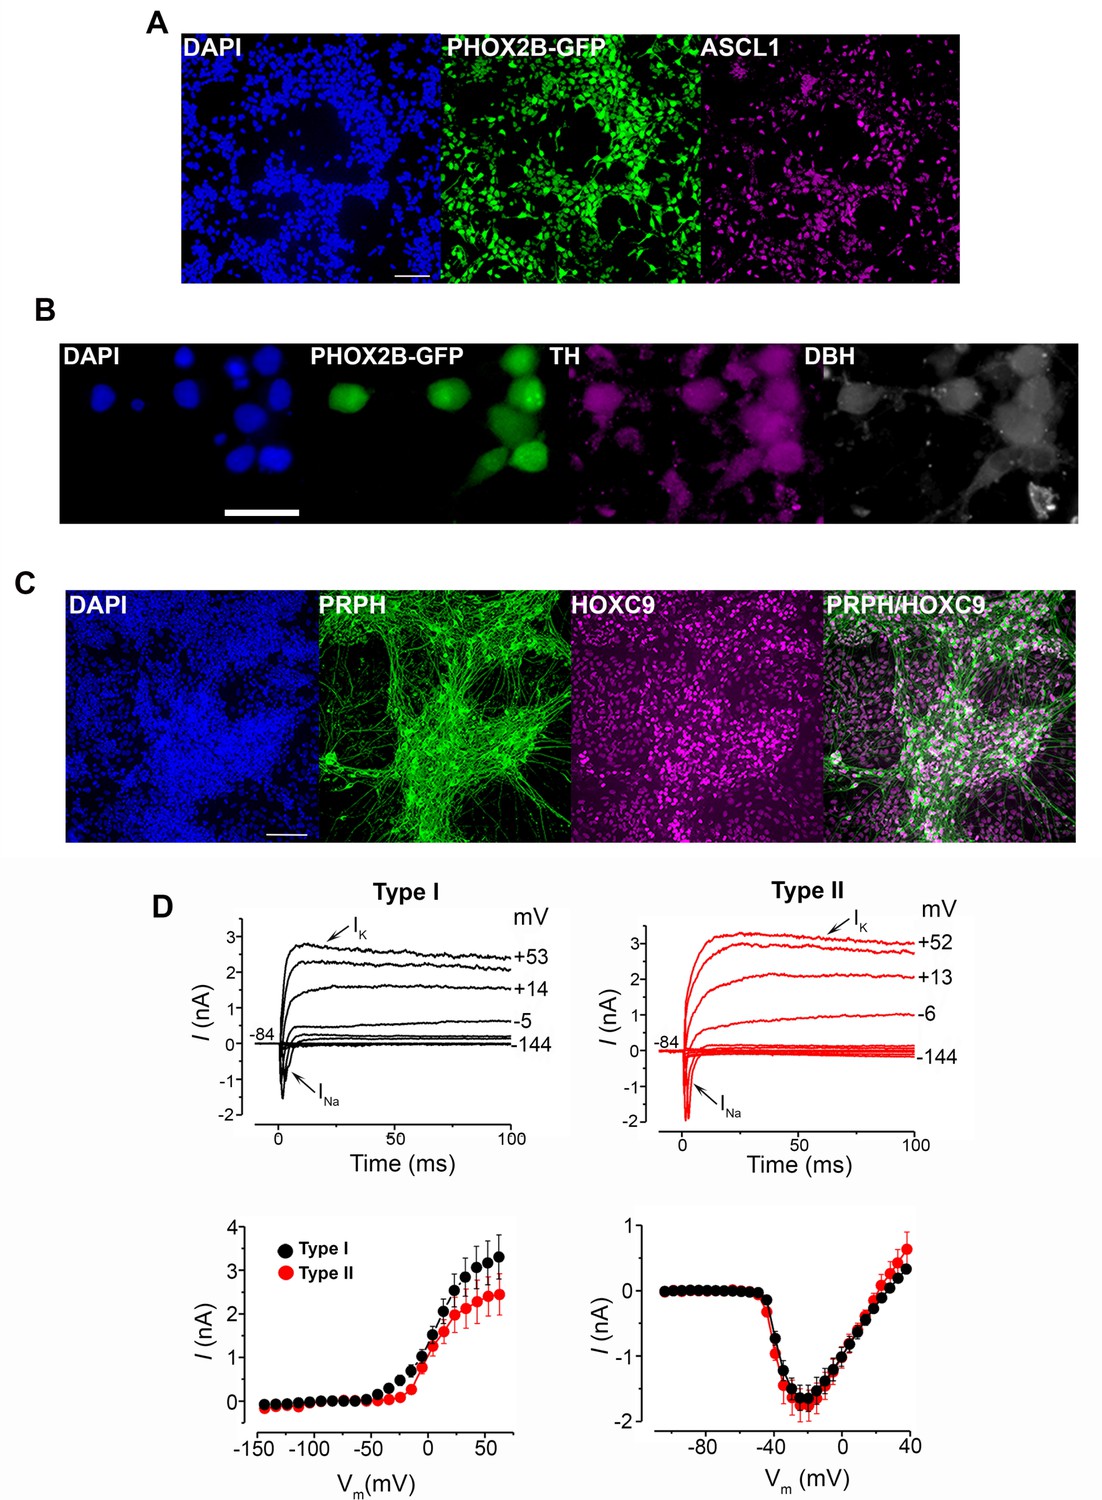
Characterisation of axial progenitor-derived sympathoadrenal progenitors and sympathetic neurons.
(A) Immunofluorescence analysis of PHOX2B-GFP and ASCL1 expression in d12 SAP cells derived from axial progenitors as shown in Figure 5A. Scale bar = 100 µm. (B) Immunofluorescence analysis of DBH, TH and PHOX2B-GFP expression in d 30 sympathetic neurons derived from axial progenitors. Scale bar = 50 µm. (C) Immunofluorescence analysis of PRPH and HOXC9 expression in d19 sympathetic neurons derived from axial progenitors as shown in Figure 5A. Scale bar = 100 µm. (D) Top panels, voltage clamp membrane currents from a Type I (left) and a Type II (right) hPSC-derived sympathetic neuron, elicited by hyperpolarizing and depolarising voltage steps (10 mV nominal decrements) from –84 mV. Actual test potentials reached are shown by some of the traces. INa indicates the initial rapidly inactivating inward Na+ current and IK shows the delayed-rectifier outward K+ current. The bottom panels show average steady-state (left panel) or peak inward (right panel) current-voltage curves from Type I (black, n = 7) and Type II (red, n = 4) hPSC-derived sympathetic neurons. Steady-state current values were measured towards the end of the traces shown in the upper panels, and inward current values were measured at the peak to isolate the Na+ current. Error bar = s.e.m.
Figure 6
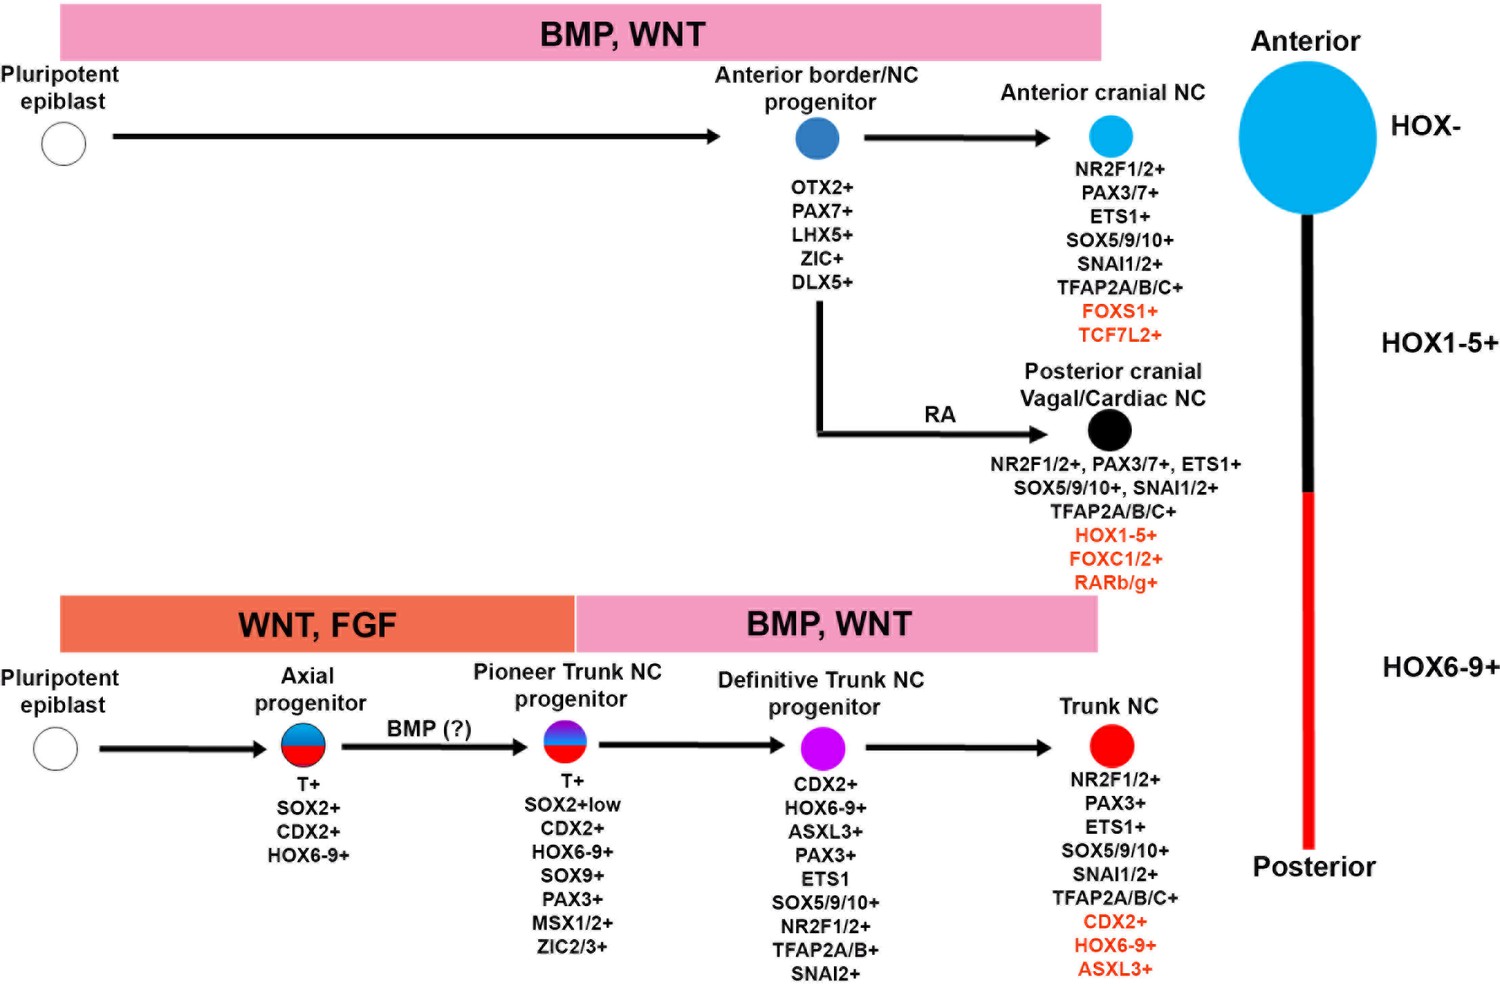
A-P patterning of in vitro derived human NC cells.
Diagrammatic model summarising our findings on the in vitro generation of NC subtypes of distinct A-P identity from hPSCs. Examples of unique genes that were found to mark each NC population exclusively are shown in red.
Tables
Key resources table
| Reagent type (species) or resource | Designation | Source or reference | Additional information |
|---|---|---|---|
| cell line (Homo Sapiens) | T-VENUS | 68 | Parental hES cell line = H9 |
| cell line (Homo Sapiens) | SOX10-GFP | 15 | Parental hES cell line = H9 |
| cell line (Homo Sapiens) | PHOX2B-GFP | 18 | Parental hES cell line = H9 |
| cell line (Homo Sapiens) | MSGN1-VENUS | Unpublished | Not previously described, parental line = NCRM1 iPSCs (source = NIH) |
| cell line (Homo Sapiens) | Sox2-GFP | 44 | Parental hES cell line = Shef4 |
| cell line (Homo Sapiens) | MIFF1 | 102 | iPSC line from healthy donor |
| cell line (Homo Sapiens) | SFCi55-ZsGr | 64 | iPSC line from healthy donor containing a constitutive fluorescent ZsGreen reporte |
| cell line (Homo Sapiens) | MasterShef7 | 44 | Wild type hES cell line |
Additional files
-
Supplementary file 1
Significantly up- and downregulated transcripts, GO enrichment and TF signatures from RNAseq analysis
- https://doi.org/10.7554/eLife.35786.022
-
Supplementary file 2
List of genes upregulated in different NC populations and GO enrichment analysis
- https://doi.org/10.7554/eLife.35786.023
-
Supplementary file 3
List of transcription factors shared between different NC populations
- https://doi.org/10.7554/eLife.35786.024
-
Supplementary file 4
List of all genes up- and down-regulated in indicated NC populations and their progenitors.
- https://doi.org/10.7554/eLife.35786.025
-
Supplementary file 5
List of primers
- https://doi.org/10.7554/eLife.35786.026
-
Transparent reporting form
- https://doi.org/10.7554/eLife.35786.027
Download links
A two-part list of links to download the article, or parts of the article, in various formats.
Downloads (link to download the article as PDF)
Open citations (links to open the citations from this article in various online reference manager services)
Cite this article (links to download the citations from this article in formats compatible with various reference manager tools)
Human axial progenitors generate trunk neural crest cells in vitro
eLife 7:e35786.
https://doi.org/10.7554/eLife.35786


