Timing of ESCRT-III protein recruitment and membrane scission during HIV-1 assembly
- The Rockefeller University, United States
- Hofstra University, United States
Figures
Figure 1 with 8 supplements
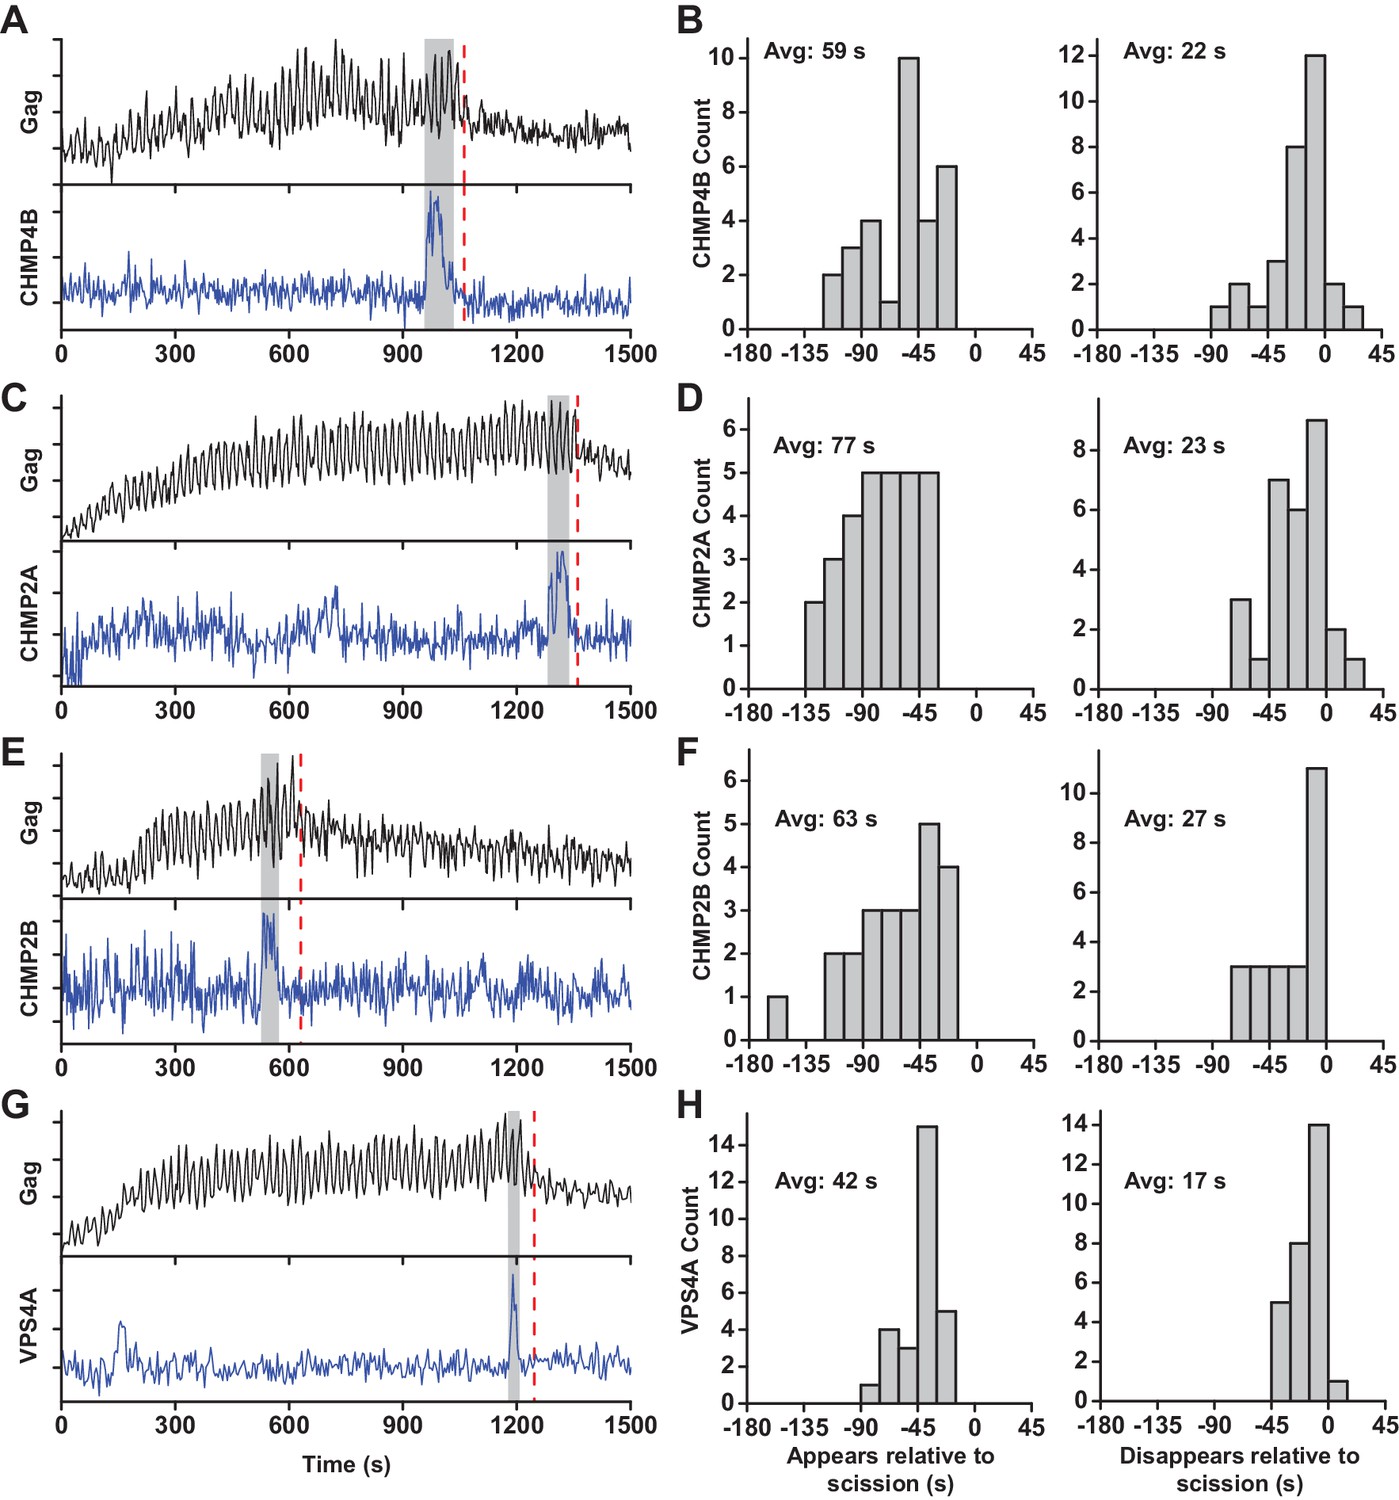
ESCRT-IIIs and VPS4A transiently recruited prior to scission.
(A) Example trace of Gag-pHluorin assembling into single VLP while the pCO2 in the imaging media was repeatedly switched between 0% and 10% every 10 s. Moment of scission is indicated by red dashed line. CHMP4B-mCherry was temporarily recruited (indicated by grey zone) to the site of VLP assembly following the loss of pH modulation sensitivity. (B) Histograms of appearance and disappearance of CHMP4B prior to scission. (C-H) Example traces and histograms of appearance and disappearance, relative to scission of the VLP, for mCherry-CHMP2A (C and D), mCherry-CHMP2B (E and F) and mCherry-VPS4A (G and H).
Figure 1—figure supplement 1
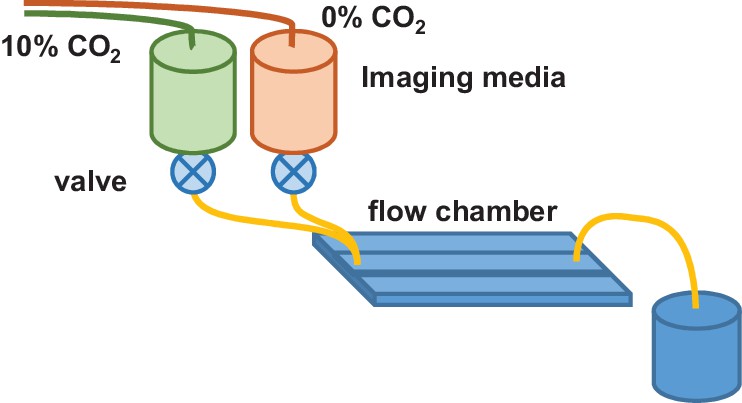
Flow chamber configuration for ESCRT-III assisted membrane scission studies.
Imaging media in reservoirs was preequilibrated with gas containing 0 and 10% CO2 (balanced with air). During assembly of single HIV particles in cells, the imaging media was modulated between reservoirs, enabling detection of scission of the VLP from the cell.
Figure 1—figure supplement 2
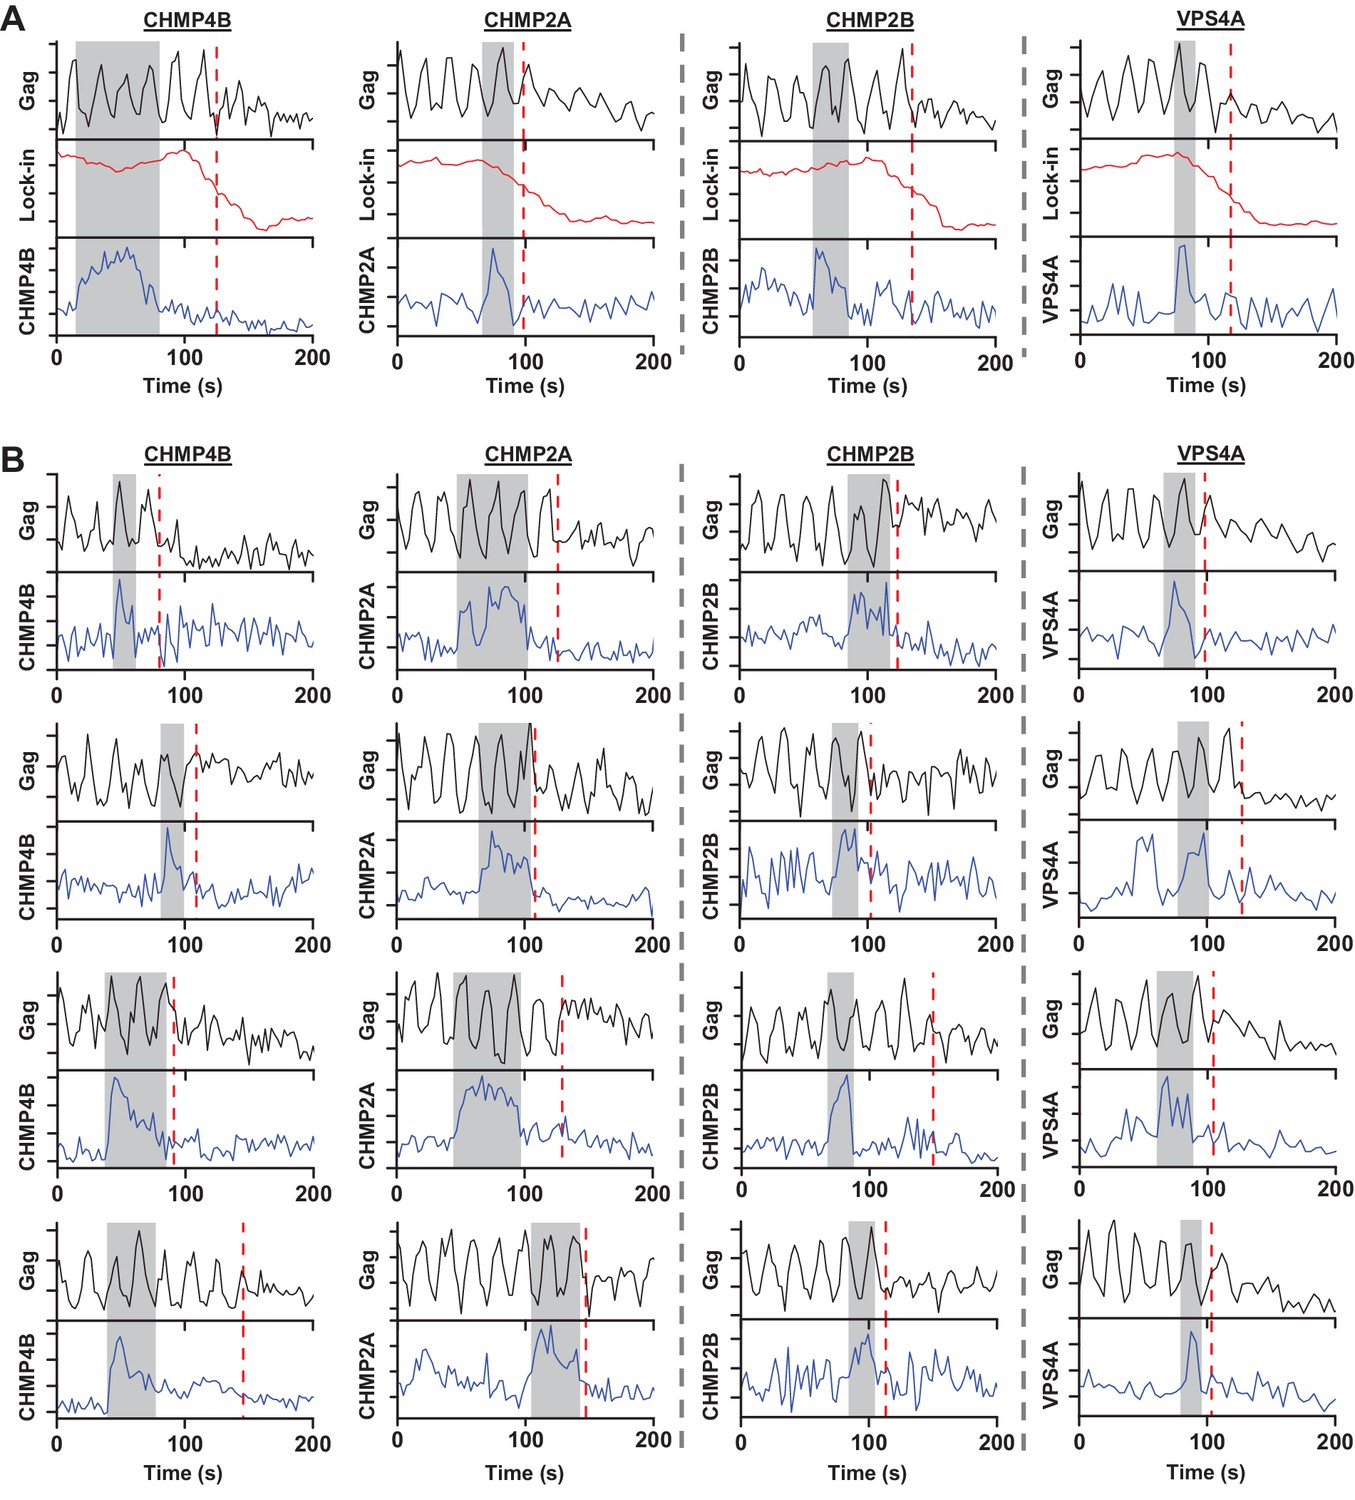
Example traces of scission relative to recruitment of ESCRT-III or VPS4A.
(A) Gag-pHluorin was observed as pCO2 was cycled between 0 and 10% every 10 s. VLP scission time (red dashed line) was characterized by half drop in lock-in signal. mCherry-CHMP4B, mCherry-CHMP2A, mCherry-CHMP2B and mCherry-VPS4A recruitment (left to right panels, recruitment highlighted in grey) were simultaneously monitored during Gag assembly. (B) Additional traces of VLP scission during recruitment of mCherry-CHMP4B, mCherry-CHMP2A, mCherry-CHMP2B, and mCherry-VPS4A (left to right columns).
Figure 1—figure supplement 3
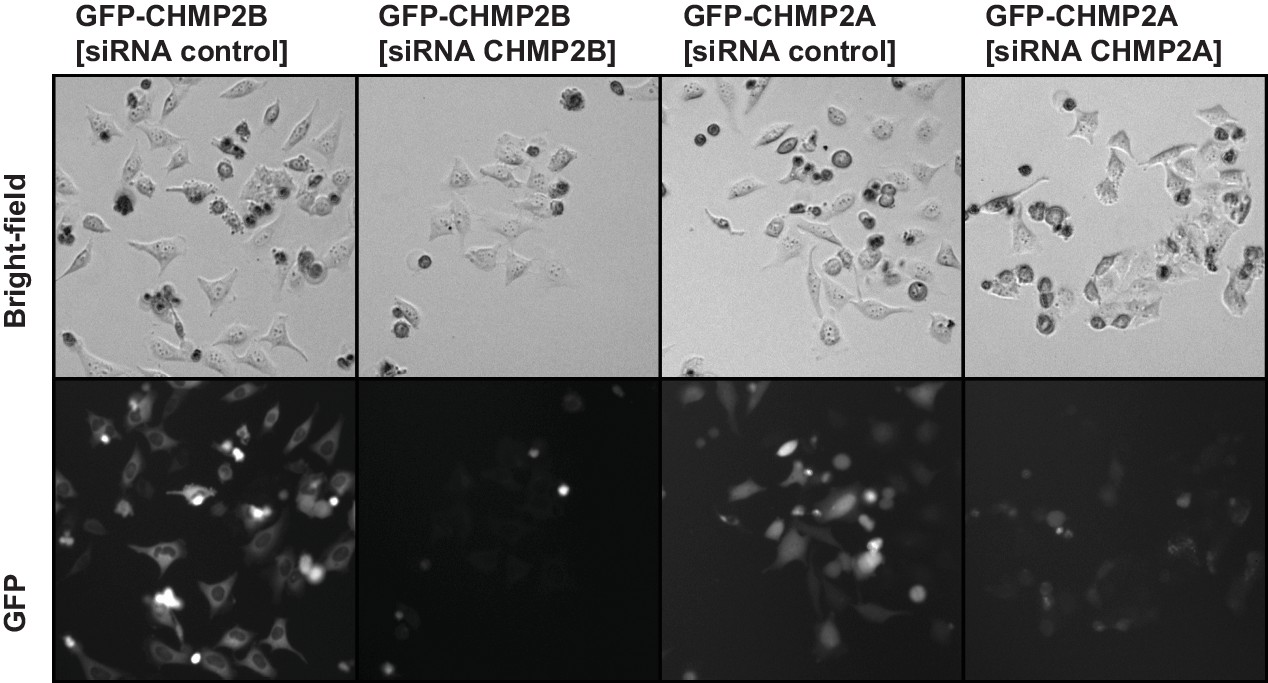
Knockdown of CHMP2A or CHMP2B by siRNA.
HeLa cell lines stably expressing either mEGFP-CHMP2A or mEGFP-CHMP2B were transfected with siRNA to either CHMP2A or CHMP2B or a control siRNA. 48 hr after transfection, presence of tagged ESCRT was significantly reduced and resulted in fewer cells, presumably because of decreased cell division.
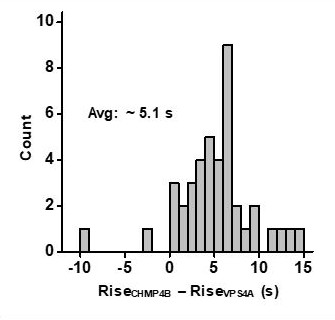
Figure 1—figure supplement 4
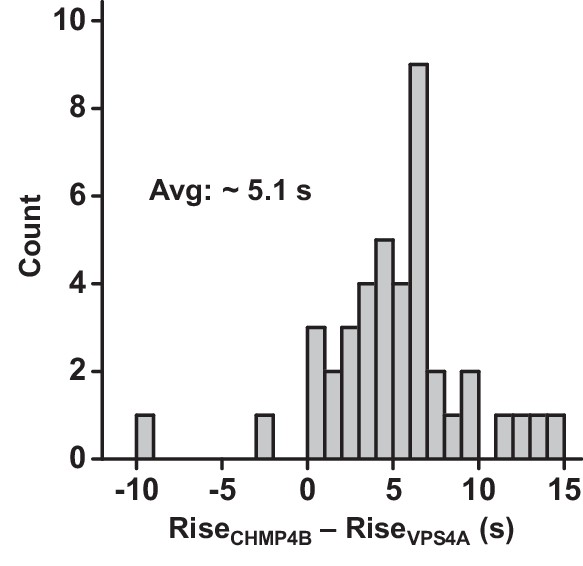
CHMP4B was recruited prior to VPS4A.
The times associated with the rising fluorescence edge of VPS4A and CHMP4B were compared relative to each other. CHMP4B appeared on average 5.1 s prior to VPS4A.
Figure 1—video 1
Gag-pHluorin (left side of video) and mCherry-CHMP4B (right side) were imaged while the CO2 in the media was modulated between 0 and 10% every 10 s.
https://doi.org/10.7554/eLife.36221.008
Figure 1—video 2
Example of individual puncta of Gag-pHluorin assembly (left side, CO2 switching every 10 s) with mCherry-CHMP4B (right side) recruitment.
CHMP4B begins to appear at 13:29 min.
Figure 1—video 3
Gag-pHluorin (top of video) and mCherry-VPS4A (bottom) were imaged while the CO2 in the media was modulated between 0 and 10% every 10 s.
https://doi.org/10.7554/eLife.36221.010
Figure 1—video 4
Example of individual puncta of Gag-pHluorin assembly (left side, CO2 switching every 10 s) with mCherry-VPS4A (right side) recruitment.
VPS4A begins to appear at 20:49 min.
Figure 2 with 2 supplements
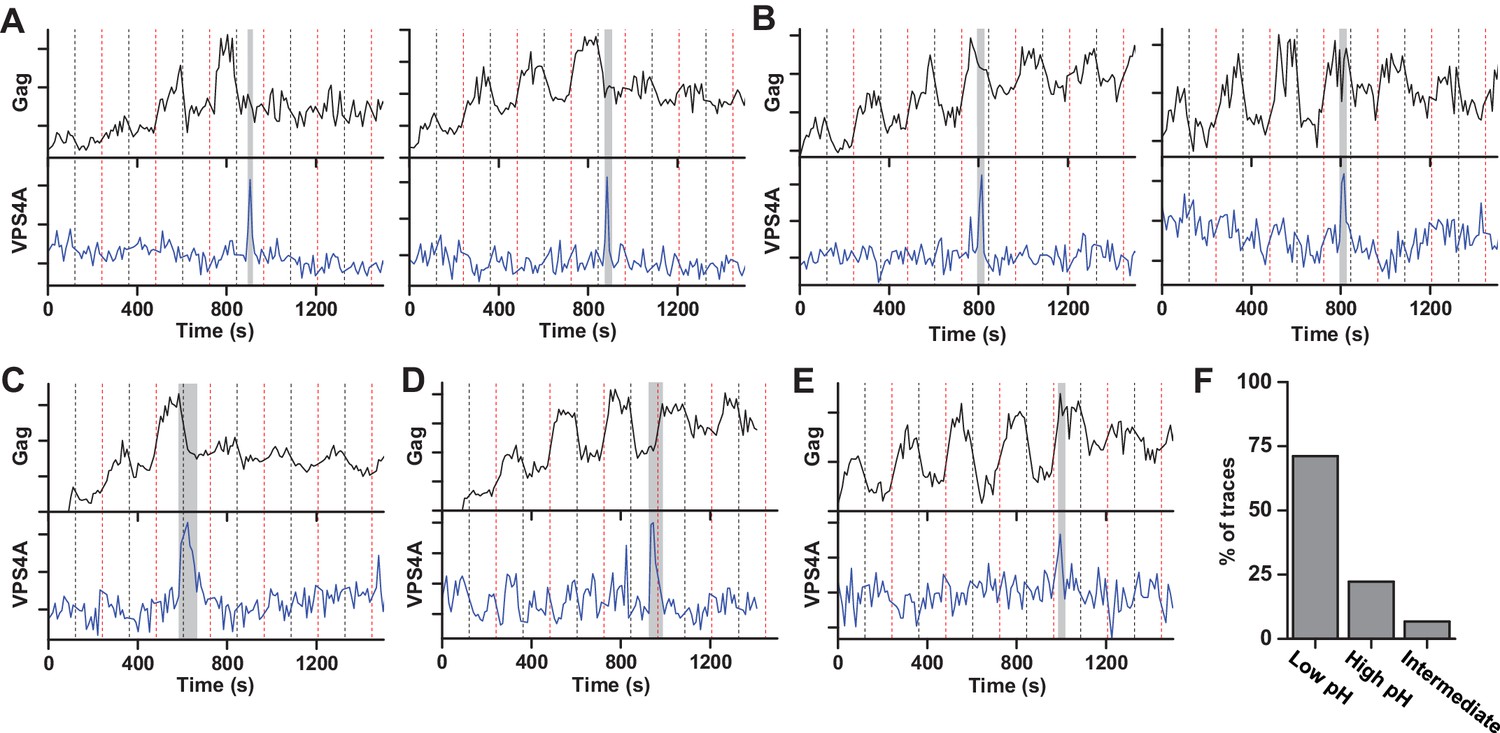
Scission more likely at lower cytoplasmic pH.
(A) Example traces of Gag-pHluorin assembly while pCO2 was switched every 120 s between 0% (red dashed line, greater fluorescence emission) and 10% (black dashed line, lower fluorescence emission). In these traces the fluorescence intensity became fixed in the low pH state (10% pCO2) after reaching an assembly plateau. VPS4A appeared and disappeared during the first low pH state. (B) Examples in which fluorescence intensity became fixed in the high pH state (0% pCO2). VPS4A appeared and disappeared during the first trapped high pH state. (C) Example in which fluorescence became fixed in low pH state. VPS4A disappeared during the first trapped low pH state, but appeared during the previous high pH state. (D) Example in which fluorescence became fixed in high pH state. VPS4A disappeared during the first trapped high pH state, but appeared during the previous low pH state. (E) Example trace in which fluorescence intensity because fixed in an intermediate state. (F) Bar graph of cytoplasmic pH condition in which scission occurs (N = 45). Scission is ~3-fold more likely at low pH (10% pCO2) compared to high pH (0% pCO2) condition. A small percentage of VLPs were trapped in an intermediate state.
Figure 2—video 1
Gag-pHluorin (left side of video) and mCherry-VPS4A (right side) were imaged while the CO2 in the media was modulated between 0 and 10% every 120 s.
https://doi.org/10.7554/eLife.36221.013
Figure 2—video 2
Example of individual puncta of Gag-pHluorin assembly (left side, CO2 switching every 120 s) with mCherry-VPS4A (right side) recruitment.
VPS4A begins to appear at 14:33 min.
Figure 3
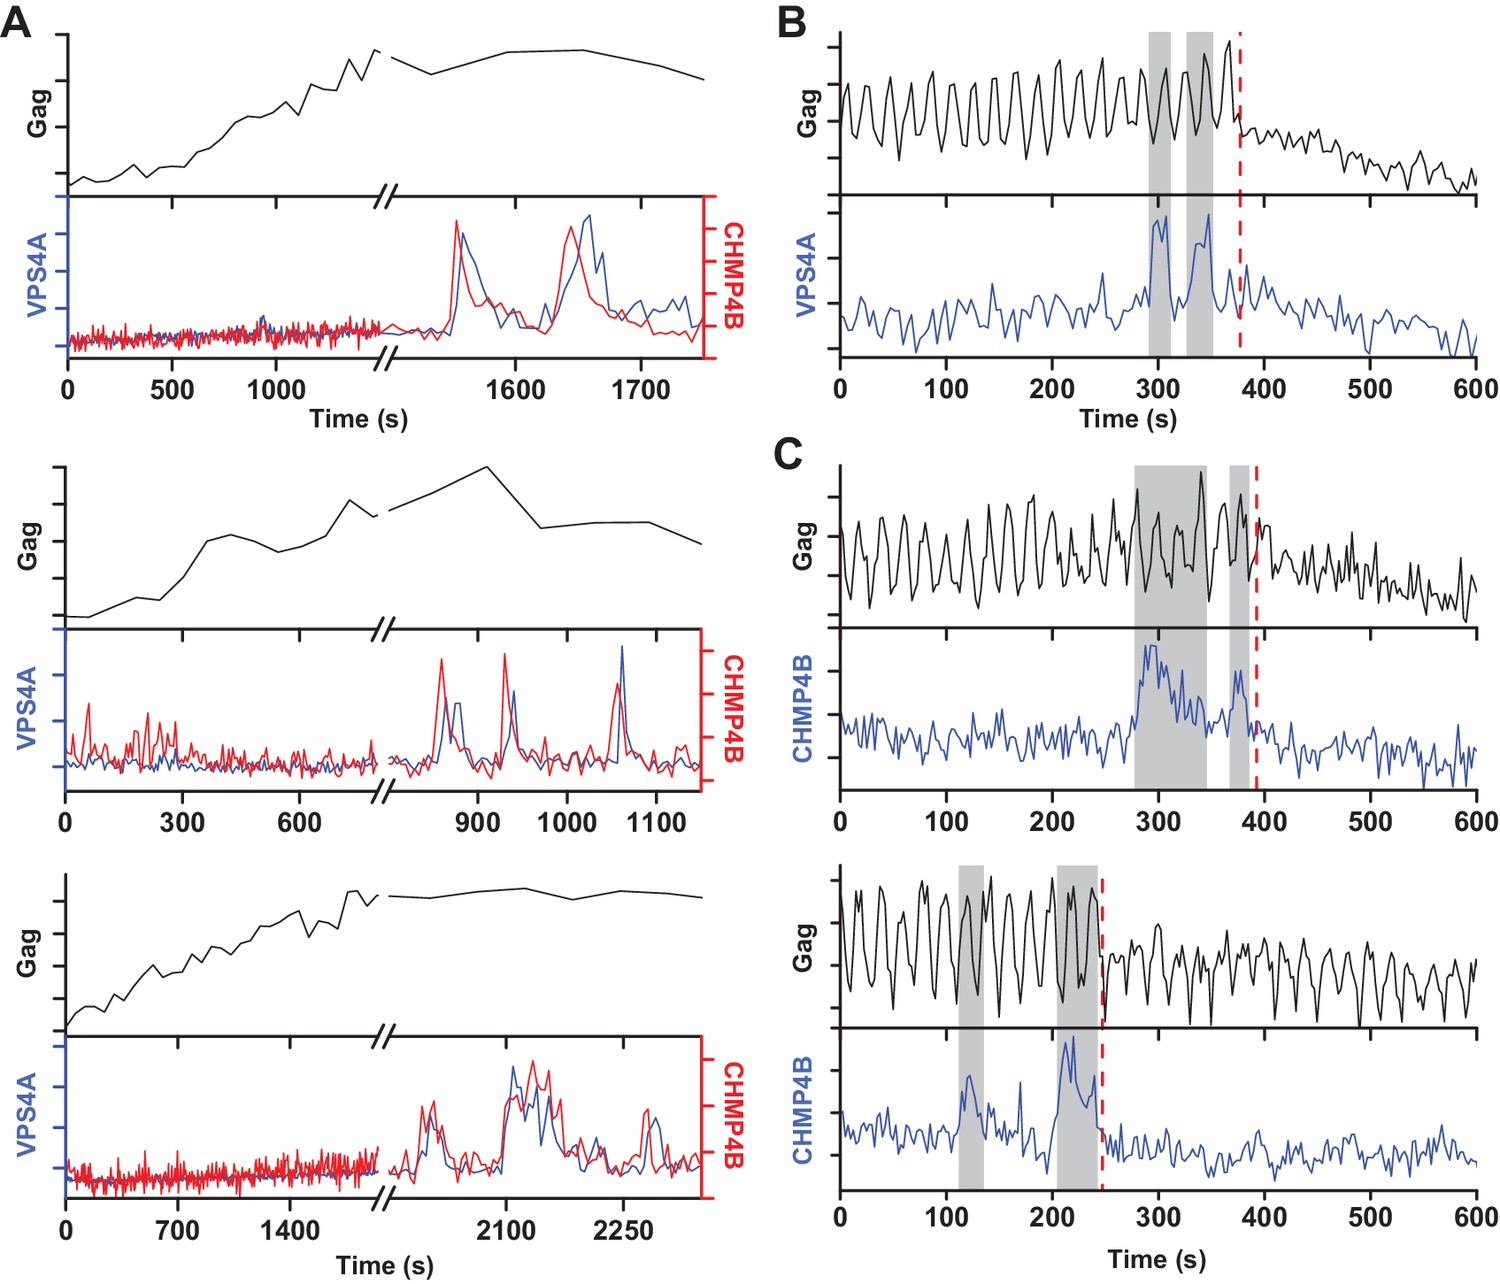
A new round of ESCRT-III recruitment required following failed scission event.
(A) Example traces of multiple waves of VPS4A and CHMP4B recruited following cessation of Gag accumulation. (B) Example trace of multiple recruitments of VPS4A prior to scission (red dashed line). (C) Example traces of multiple recruitments of CHMP4B prior to scission (red dashed line).
Figure 4 with 4 supplements
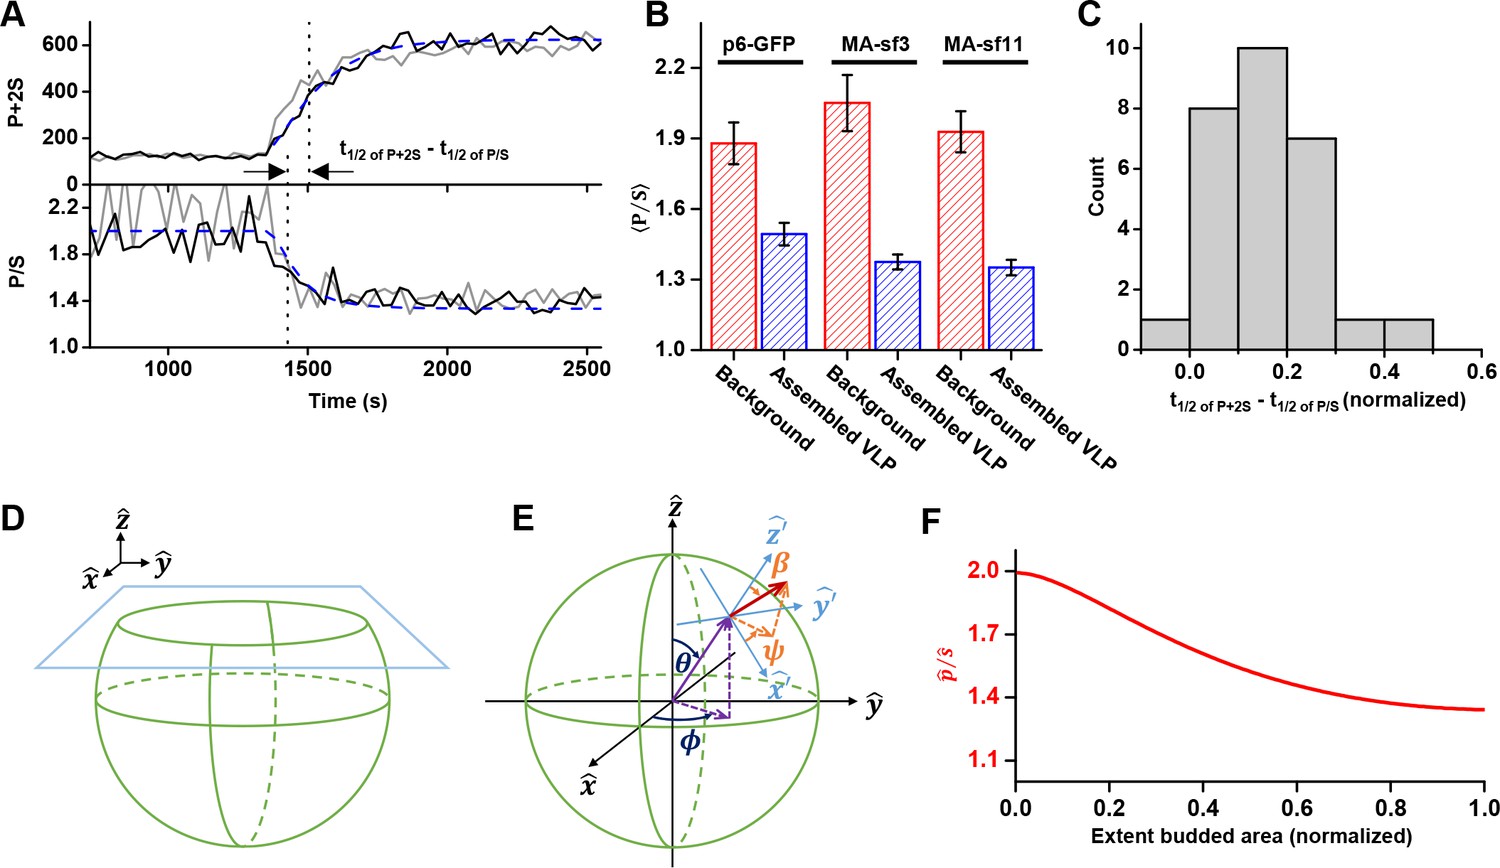
Structural changes in VLPs throughout Gag accumulation.
(A) Example traces of wild-type Gag-GFP (black line, sf3 in Matrix of Gag) and Gag-∆p6 (grey line, missing ESCRT-I recruiting p6 domain) assembling into single VLPs. Images were collected every 30 s with excitation illumination polarized either perpendicular () or parallel () to the glass surface. Total Gag characterized by P+2S (top) and relative average dipole orientation by P/S (bottom). P+2S from wild-type Gag was fit to an exponential and used to predict an expected P/S (blue dashed line) assuming membrane bending throughout assembly. (B) Comparison of average P/S from all traces before VLP assembly (membrane background) and after VLP assembly (plateau region) for three different tagged versions of wild-type Gag. p6-GFP (N = 8), MA-sf3 (N = 9), and MA-sf11 (N = 7). Error bars represent s.d. (C) To compare the evolution of VLP structure to the assembly of Gag the time for each assembly trace was normalized from 0 (beginning of Gag assembly) to 1 (end of Gag assembly). A normalized time difference for each trace between Gag half assembly [½ (P+2S)max] and the dipole half drop [½ (P/S)max] was found and all normalized differences were compiled into a histogram. (D) Illustration of sphere budding from flat membrane. (E) Illustration of coordinate system with θ and ϕ representing position on the sphere and β and ψ representing orientation of excitation dipole. (F) Predicted P/S when β = 45°, background intensity is 45% of full assembly intensity, and evanescent field penetration depth is the same as the radius of the VLP.
Figure 4—figure supplement 1
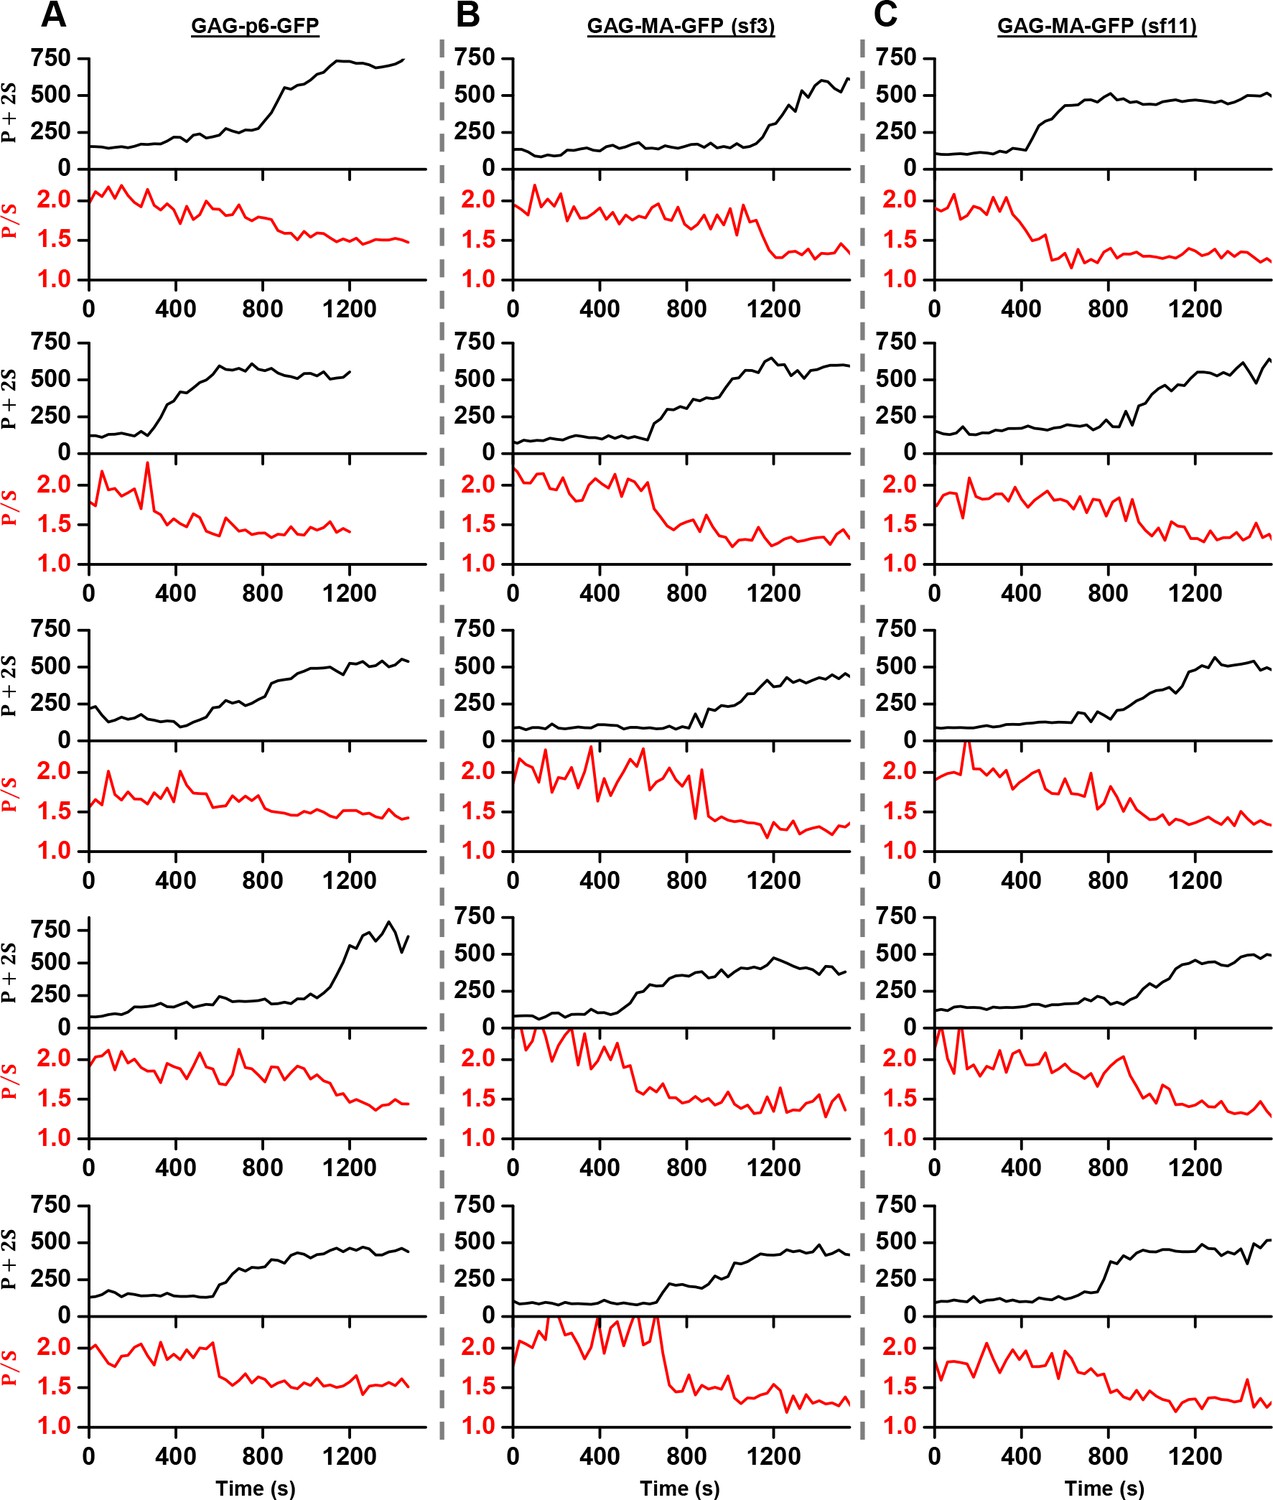
Example traces of Gag accumulation (quantified as P+2S) and fluorophore polarization (quantified as P/S) during VLP assembly.
Three different tagging schemes were used: labeled with mEGFP after p6 domain at carboxy terminal of Gag (A), labeled with circularly permutated GFP variant three in matrix of Gag (B), labeled with circularly permutated GFP variant 11 in matrix of Gag (Pédelacq et al., 2006) (C).
Figure 4—figure supplement 2
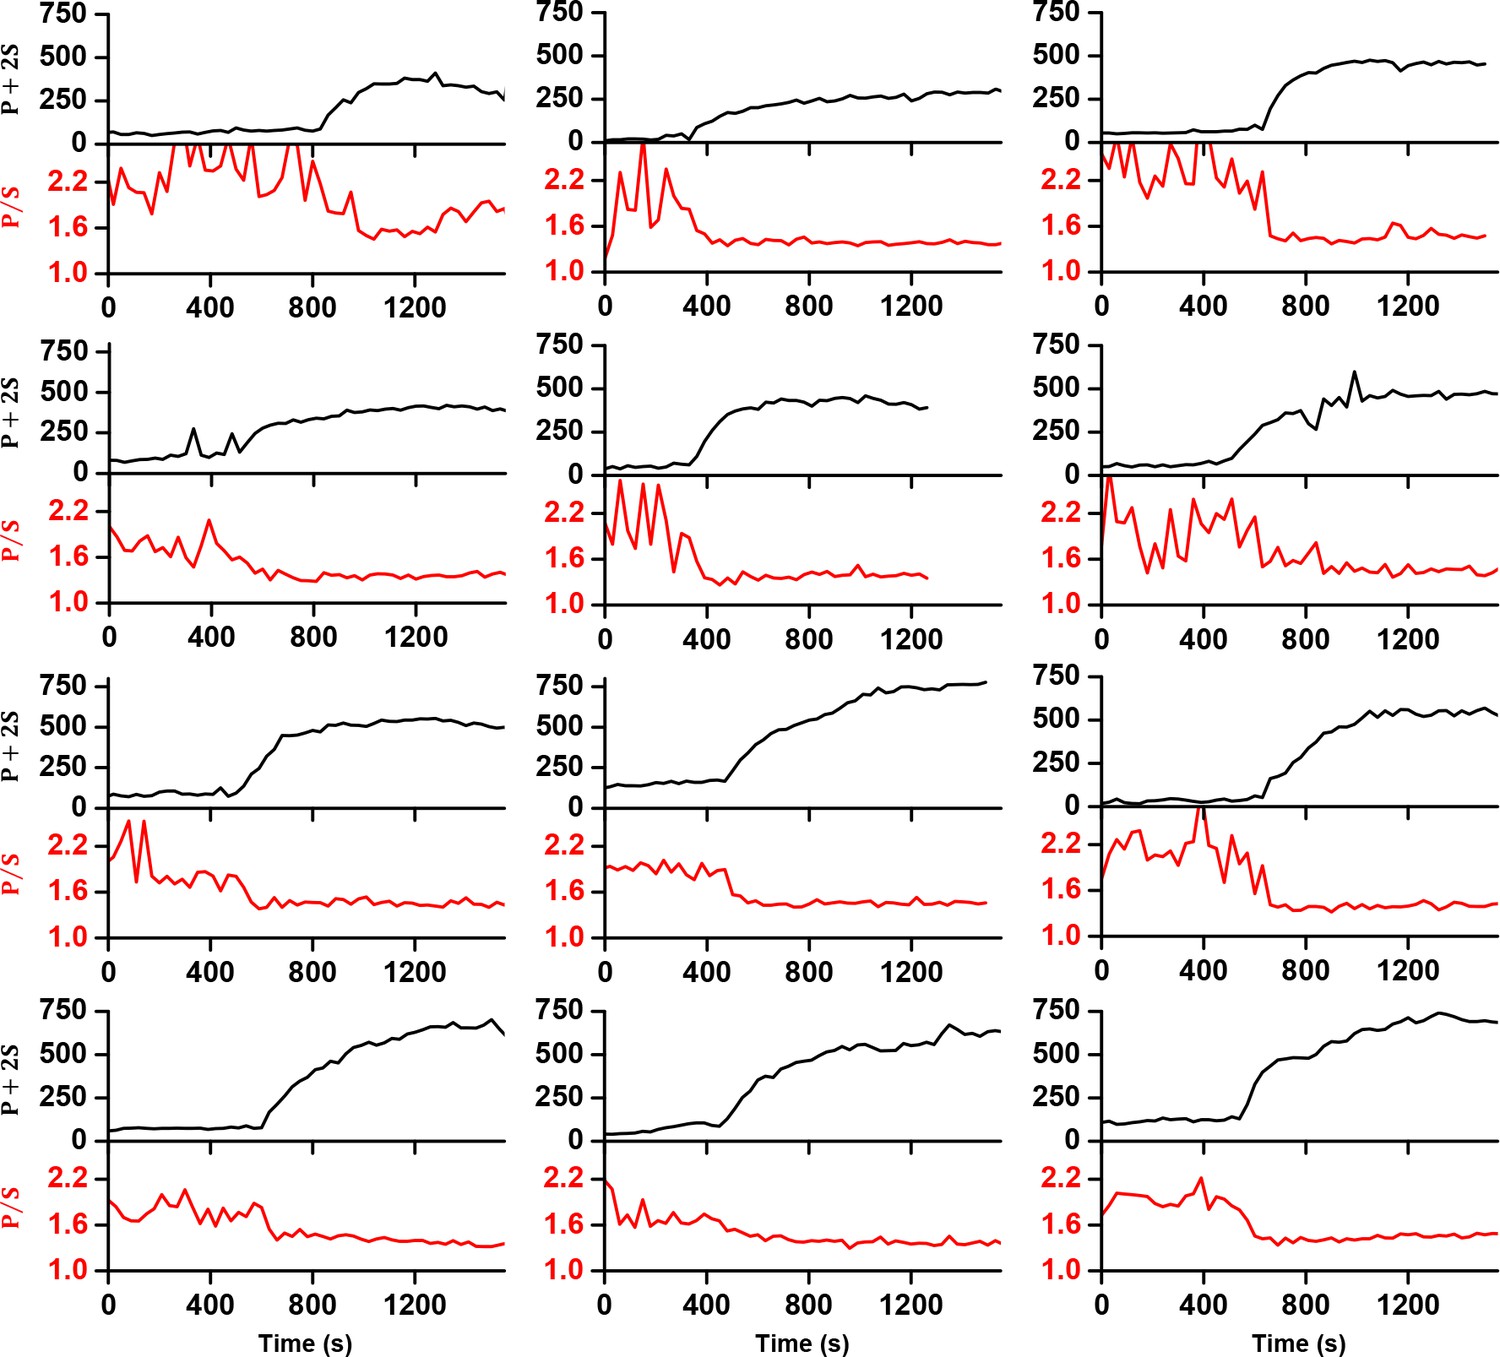
Example traces of Gag-∆p6-mEGFP accumulation (quantified as P+2S) and fluorophore polarization (quantified as P/S) during VLP assembly.
https://doi.org/10.7554/eLife.36221.018
Figure 4—video 1
Images of Gag-mEGFP were acquired with excitation perpendicular (P) or parallel (S) to the glass surface.
Left side of video is calculated P+2S (quantification of Gag intensity) and right side is ratio image P/S (measurement of structure).
Figure 4—video 2
Example of individual puncta of Gag-mEGFP with P/S and P+2S images.
https://doi.org/10.7554/eLife.36221.020
Figure 5
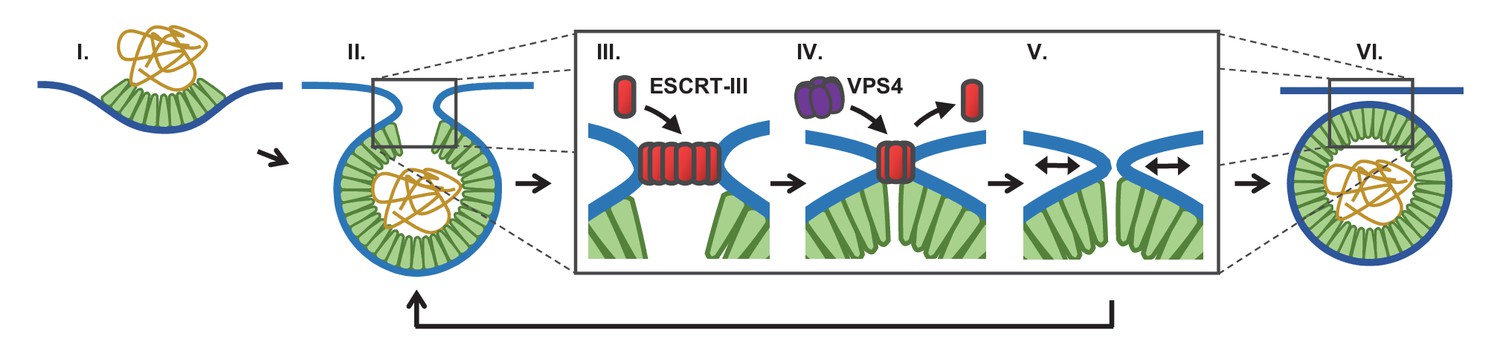
Proposed temporal model of ESCRT-III-mediated scission of HIV from cell plasma membrane.
(I) The viral particle structure changes throughout accumulation of Gag until (II) a spherical topology prevents incorporation of additional Gags. (III) ESCRT-IIIs (examples: CHMP2, CHMP4) are recruited to the neck and polymerize, with (IV) removal by VPS4 resulting in constriction of the neck. (V) After removal of all ESCRT-IIIs the narrow neck undergoes spontaneous fission, (VI) freeing the virus. If membrane fission does not occur a new round of ESCRT-III recruitment is required (V→ II).
Author response image 1
Measurement of the lag in the rise to ½ max between CHMPB and VPS4A in HEK293T cells.
https://doi.org/10.7554/eLife.36221.023Tables
Key resources table
| Reagent type (species) or resource | Designation | Source or reference | Identifiers | Additional information |
|---|---|---|---|---|
| Cell line (H. sapiens) | HEK-293T | Bieniasz Lab | ||
| Cell line (H. sapiens) | HeLa | ATCC | ||
| Transfected construct (HIV-1, A. victoria) | Gag-mEGFP | Bleck et al. (2014) | ||
| Transfected construct (HIV, A. macrodactyla) | Gag-mTagBFP | Bleck et al. (2014) | ||
| Transfected construct (A. victoria, H. sapiens) | pLNCX2-mEGFP-VPS4A | Bleck et al. (2014) | ||
| Transfected construct (A. marginale, H. sapiens) | pLNCX2-mCherry-CHMP4B | Bleck et al. (2014) | ||
| Transfected construct (HIV) | Gag∆p6 | Bleck et al. (2014) | ||
| Transfected construct (HIV) | pCR3.1/Syn-Gag | Jouvenet et al. (2008) | ||
| Transfected construct (HIV, A. victoria) | pCR3.1/Syn-Gag-pHluorin | Jouvenet et al. (2008) | ||
| Transfected construct (A. marginale, H. sapiens) | pLNCX2-mCherry-CHMP2A | This study | CHMP4B in pLNCX2-mCherry- CHMP4B was replaced by CHMP2A from HEK293T cDNA library | |
| Transfected construct (A. marginale, H. sapiens) | pLNCX2-mCherry-CHMP2B | This study | CHMP4B in pLNCX2-mCherry- CHMP4B was replaced by CHMP2B from HEK293T cDNA library | |
| Transfected construct (A. marginale, H. sapiens) | pLNCX2-mCherry-CHMP2A- siRNAres | This study | added six silent point mutations to pLNCX2-mCherry-CHMP2A using site directed mutagenesis | |
| Transfected construct (A. marginale, H. sapiens) | pLNCX2-mCherry-CHMP2B- siRNAres | This study | added six silent point mutations to pLNCX2-mCherry-CHMP2B using site directed mutagenesis | |
| Transfected construct (A. marginale, H. sapiens) | pLNCX2-mEGFP-CHMP2A | This study | replaced mCherry in pLNCX2- mCherry-CHMP2A with EGFP (pEGFP-N1, Clontech) | |
| Transfected construct (A. marginale, H. sapiens) | pLNCX2-mEGFP-CHMP2B | This study | replaced mCherry in pLNCX2- mCherry-CHMP2B with EGFP (pEGFP-N1, Clontech) | |
| Transfected construct (A. marginale, H. sapiens) | pLNCX2-mCherry-VPS4A | This study | replaced mEGFP in pLNCX2- mCherry-VPS4A (Bleck et al., 2014) with mCherry (pmCherry- N1, Clontech) | |
| Transfected construct (HIV, A. victoria) | Gag-∆p6-mEGFP | This study | p6 domain removed from Gag-mEGFP using site directed mutagensis | |
| Transfected construct (HIV, A. victoria) | Gag-MA-sf3 | This study | sf3 GFP (Pédelacq et al., 2006) inserted in pCR3.1/Syn-Gag | |
| Transfected construct (HIV, A. victoria) | Gag-MA-sf11 | This study | sf11 GFP (Pédelacq et al., 2006) inserted in pCR3.1/Syn-Gag | |
| Sequence-based reagent | CHMP2A DsiRNA | Integrated DNA Technologies | 5'-AAGAUGAAGAGGAG AGUGAUGCUdGdT-3' | |
| Sequence-based reagent | CHMP2A DsiRNA (reverse) | Integrated DNA Technologies | 5'-ACAGCAUCACUCUC CUCUUCAUCUUCC-3' | |
| Sequence-based reagent | CHMP2B DsiRNA | Integrated DNA Technologies | 5'-GGAACAGAAUCGAG AGUUACGAGdGdT-3' | |
| Sequence-based reagent | CHMP2B DsiRNA (reverse) | Integrated DNA Technologies | 5'-ACCUCGUAACUCUC GAUUCUGUUCCUU-3' | |
| Chemical compound, drug | DMEM | Thermo Fisher Scientific | #11965 | |
| Chemical compound, drug | FBS | MilliporeSigma | #F4135 | |
| Chemical compound, drug | HEPES | MilliporeSigma | #H3375 | |
| Software, algorithm | Metamorph | Molecular Devices | version 7.8.10 | |
| Software, algorithm | ImageJ | Schneider et al. (2012) | version Fiji | |
| Software, algorithm | LabView | National Instruments | version 2013 | |
| Software, algorithm | Microscope-Control | Johnson, 2018c) | LabView Code | |
| Software, algorithm | Average-puncta-center | Johnson, 2018a) | LabView Code | |
| Software, algorithm | Puncta-Fit | Johnson, 2018d) | LabView Code | |
| Software, algorithm | CO2-switch-analysis | Johnson, 2018b) | LabView Code |
Additional files
-
Transparent reporting form
- https://doi.org/10.7554/eLife.36221.022
Download links
A two-part list of links to download the article, or parts of the article, in various formats.
Downloads (link to download the article as PDF)
Open citations (links to open the citations from this article in various online reference manager services)
Cite this article (links to download the citations from this article in formats compatible with various reference manager tools)
Timing of ESCRT-III protein recruitment and membrane scission during HIV-1 assembly
eLife 7:e36221.
https://doi.org/10.7554/eLife.36221


