Unexpected similarities between C9ORF72 and sporadic forms of ALS/FTD suggest a common disease mechanism
- Columbia University, United States
- New York Genome Center, United States
- Columbia University Medical Center, United States
Figures
Figure 1 with 1 supplement

Patient stratification into like-control and like-C9 groups by aberrant splicing of known hnRNP H-target exons.
(a) List of hnRNP H target exons, separated into enhanced and repressed categories. (b) (Top) Simplified diagram of enhanced and repressed exons with relative binding of hnRNP H (H1). (Bottom) Depiction of expected product when H1 levels are at normal physiological levels (above dashed line) or low (hnRNP H deficient; below dashed line). (c–e) Representative PCR gels of all patient samples for two enhanced exons (ARRB2 and PPP1R12C) and one repressed exon (OS9). Pink boxes show samples F09-F13 that consistently exhibited large magnitudes of change in inclusion. (f) Graph of CSS by group: nonALS, C9ALS, like-control and like-C9. Each point represents the CSS of an individual patient. Red dashed line marks the cutoff of 3 standard deviations below the control mean. Error bars are plotted to the SEM. (g) Comparison of percent exon inclusion of 18 hnRNP H-target exons between like-control and like-C9 patient replicate values. Exons are ordered by enhanced exons (KIF1C-PCBP2) followed by repressed exons (RPL10-HNRPDL). Error bars are plotted to the SEM. (t test p value: *=0.05, **=<0.01, ***=<0.0001, ****=<0.0001).
Figure 1—figure supplement 1

RT-PCR of hnRNP H target genes.
(a–q) Representative PCR gels from all genes that are significantly altered between like-control and like-C9. In some instances, single samples failed to amplify thus leading to blank lanes. All reactions were repeated and re-run individually or in small groups (data not shown). Loading convention is gel 1: sALS 1–28, gel 2: sALS 29–41; FTD 1–15. Sample information can be found in Supplementary file 1A. Arrows indicate the position of exon inclusion (top) and exclusion (bottoms) products.
Figure 2 with 1 supplement
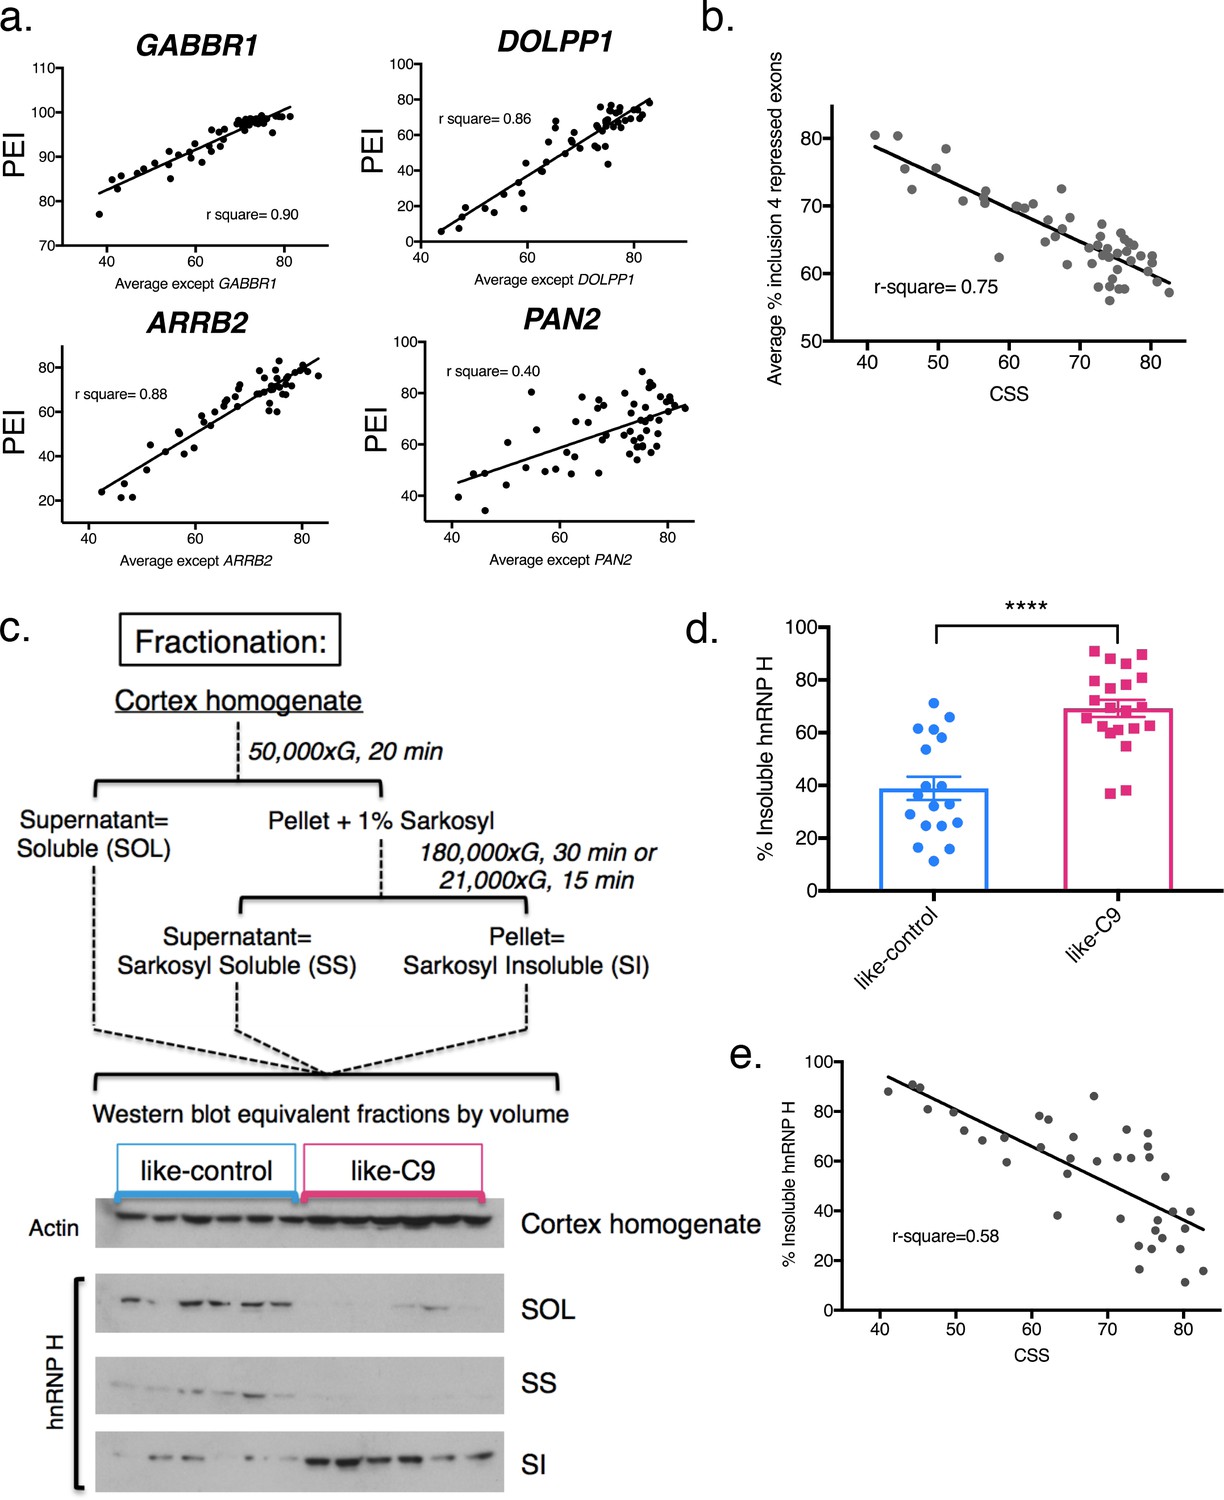
Differential concentration of hnRNP H due to insolubility explains graded splicing dysregulation in patient brains.
(a) Linear regression of percent exon inclusion (PEI) for each enhanced target exon compared to the average inclusion of all other enhanced exons. Clockwise from upper left: GABBR1, DOLPP1, PAN2, ARRB2, with r-square = 0.90, 0.86, 0.40, 0.88, respectively. (b) Linear regression of percent exon inclusion for the average of four repressed target exons compared to the average inclusion of all enhanced exons. R-square = 0.75. (c) (Upper) Diagram of biochemical fractionation and resultant fractions. (Lower) Representative example of 6 like-control and six like-C9 samples, western blotted for actin (cortex homogenate fraction) and hnRNP H (SOL, SS, SI). (d) Summary graph percent insoluble hnRNP H in motor cortex of like-controls versus like-C9s. Samples for which motor cortex was unavailable were excluded from this analysis. Each point represents a single patient with replicate values. Error bars are plotted to the SEM. (t test p value: *=0.05, **=<0.01, ***=<0.0001, ****=<0.0001). (e) Linear regression of percent insoluble hnRNP H compared to CSS, r-square = 0.58.
Figure 2—figure supplement 1

Linear regression of hnRNP H enhanced exons.
(a–j) Linear regression all remaining genes not shown in Figure 2a. Percent exon inclusion (PEI) for each hnRNP H-target exon is plotted as a Y-coordinate compared to the average percent inclusion of all other hnRNP H-enhanced exons. R-square values are displayed.
Figure 3
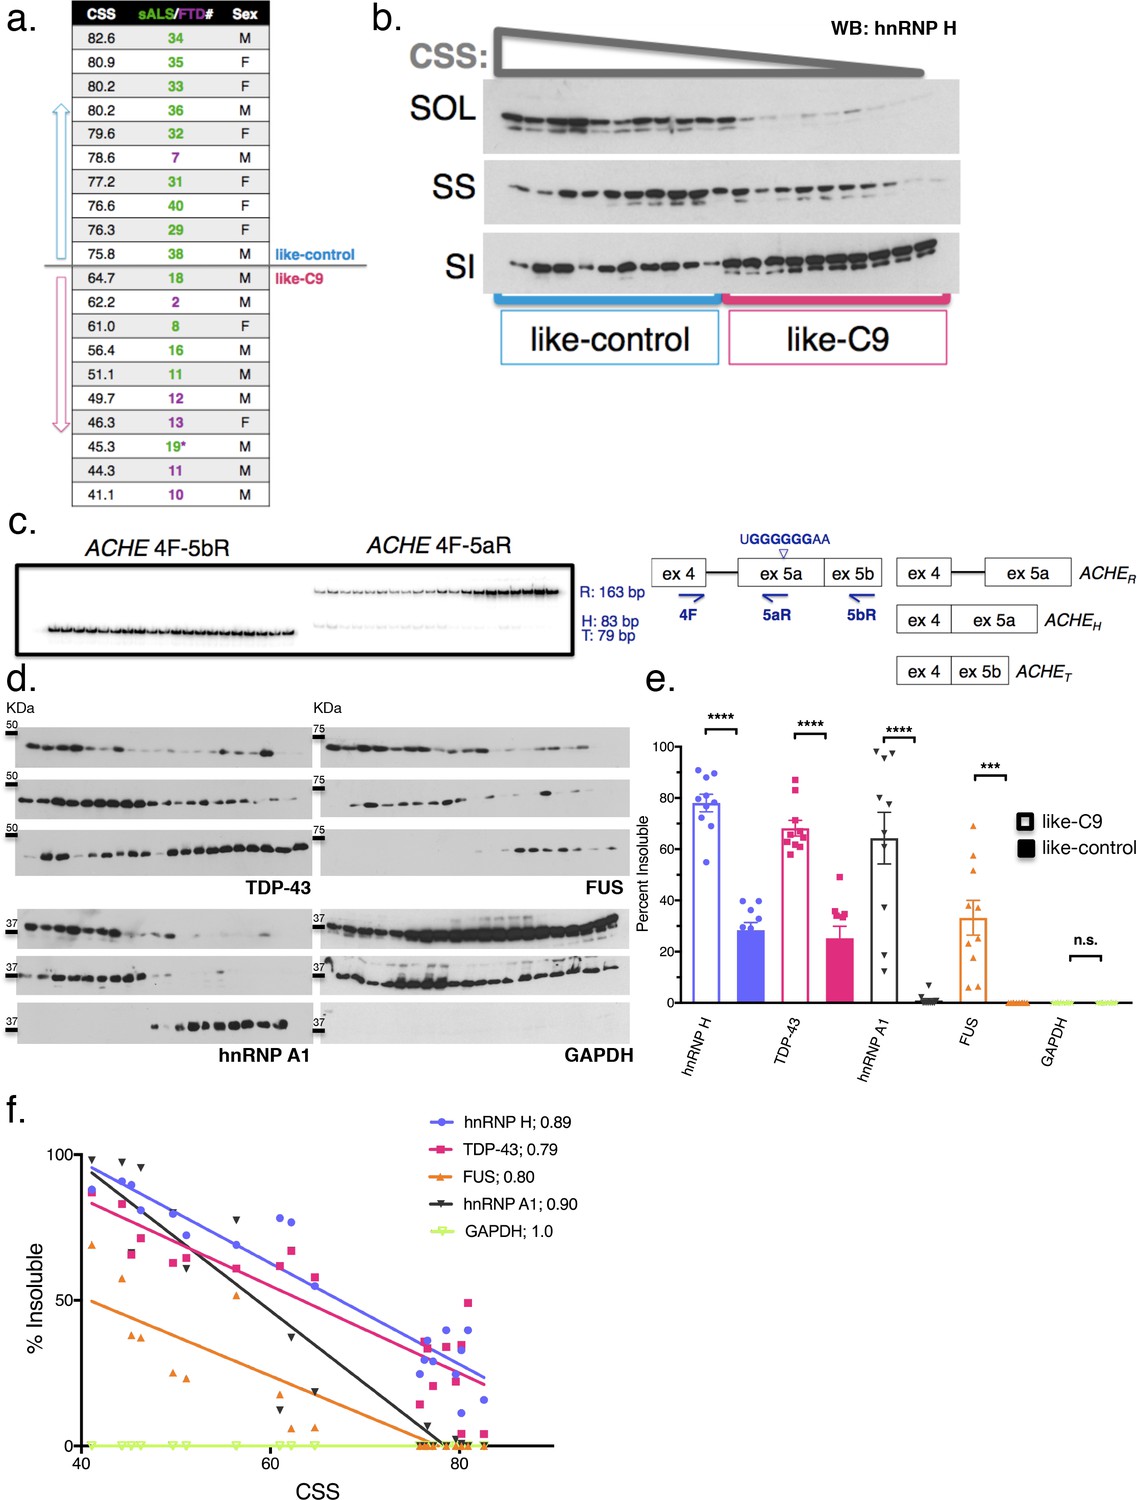
Insolubility of hnRNP H correlates with insolubility of additional RBPs.
(a) CSS scores and identifiers for 10 most like-control and 10 most like-C9 patients for which motor cortex was available. These patients were loaded in this descending order for all parts of this figure. (b) Fractionation (180,000 x G) of 20 sALS-FTD patients blotted for hnRNP H. SOL = soluble, SS = sarkosyl soluble and SI = sarkosyl insoluble. (c) Left: gel of ACHE alternative splicing in 20 sALS-FTD patients, loaded in order of highest to lowest CSS. PCR products are identified at right. Right: diagram of primers used and hnRNP H binding motif. (d) Fractionation shown in (b) with western blotting for the following targets (clockwise from upper-left): TDP-43, FUS, GAPDH, hnRNP A1. Each target is shown with three panels representing SOL, SS and SI, from top to bottom. (e) Quantification of percent insoluble protein (180,000 x G) in these 20 cases, with replicate values. Error bars are plotted to the SEM. (t test p value: *=0.05, **=<0.01, ***=<0.0001, ****=<0.0001). (f) Linear regression of percent insoluble hnRNP H, TDP-43, FUS, hnRNP A1 and GAPDH for 20 sALS-FTD patients, plotted against CSS. R-square is listed in legend.
Figure 4 with 2 supplements
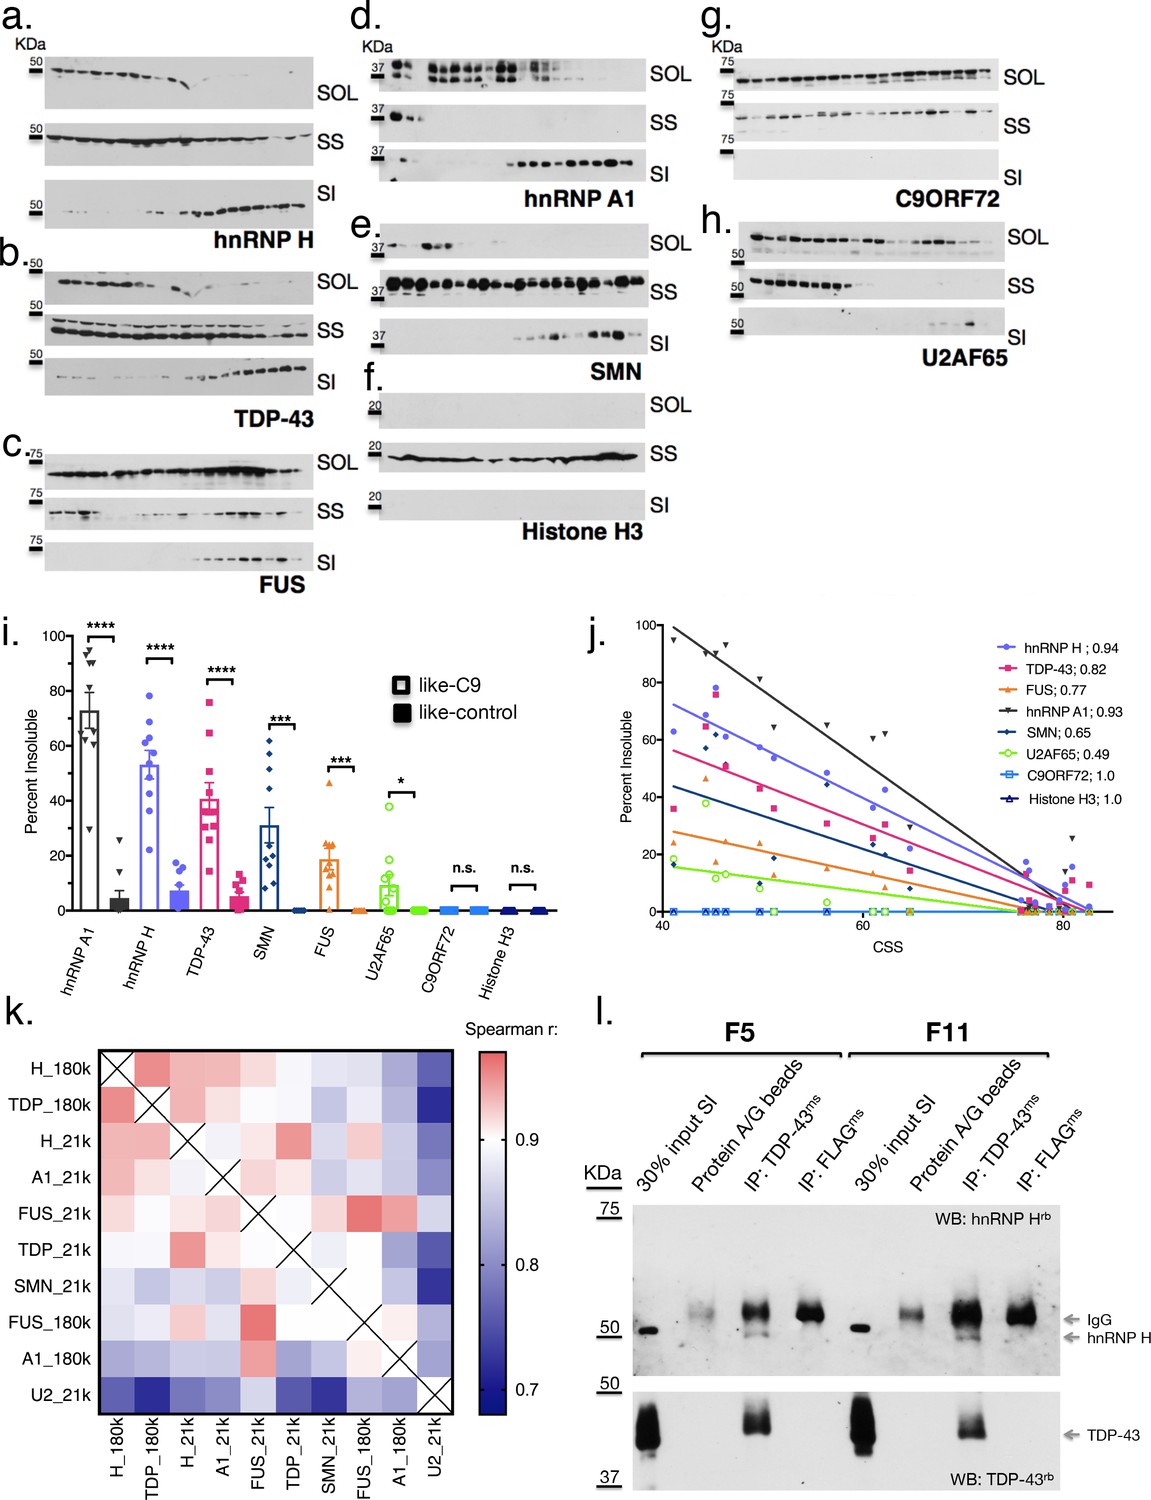
Like-control ALS/FTD patients have undetectable levels of insoluble RBPs after low-speed fractionation.
(a–h) Low-speed (21,000 x G) fractionation experiment with 20 patients listed in Figure 3a. Western blot hnRNP H (a), TDP-43 (b), FUS (c), hnRNP A1 (d), SMN (e), Histone H3 (f), C9ORF72 (g), U2AF65 (h). SOL = soluble, SS = sarkosyl soluble, SI = sarkosyl insoluble. (i) Quantification of low-speed centrifugation of 20 patients with replicate values. Error bars are plotted to the SEM. (j) Linear regression of percent insoluble protein for targets in (a–h) plotted against CSS. R-square is listed. (k) Heatmap of spearman correlation coefficients for each pairwise comparison of percent insoluble protein at 180,000 or 21,000 x G (180 k and21k, respectively). (l) Western blots of hnRNP H (top) and TDP-43 (bottom) following IP with protein A/G magnetic beads alone, TDP-43 antibody, or control (FLAG) antibody from two patient brains (F5 and F11). The abbreviations ms and rb stand for mouse antibody and rabbit antibody, respectively. Protein species are indicated by arrows at right, and positions of size markers are shown on the left.
Figure 4—figure supplement 1

Insoluble hnRNP H and TDP-43 correlate in C9 patient brains.
Representative western blot of 21,000 x G motor cortex fractionation from eight controls (six nonALS and two SOD1 ALS) and 14 C9+ ALS/FTD patients. Membranes are shown from top-bottom: cortex homogenate (western blot actin), Sarkosyl insoluble fraction (western blot hnRNP H), and same membrane (western blot TDP-43), with arrows differentiating TDP-43 from residual hnRNP H signal.
Figure 4—figure supplement 2
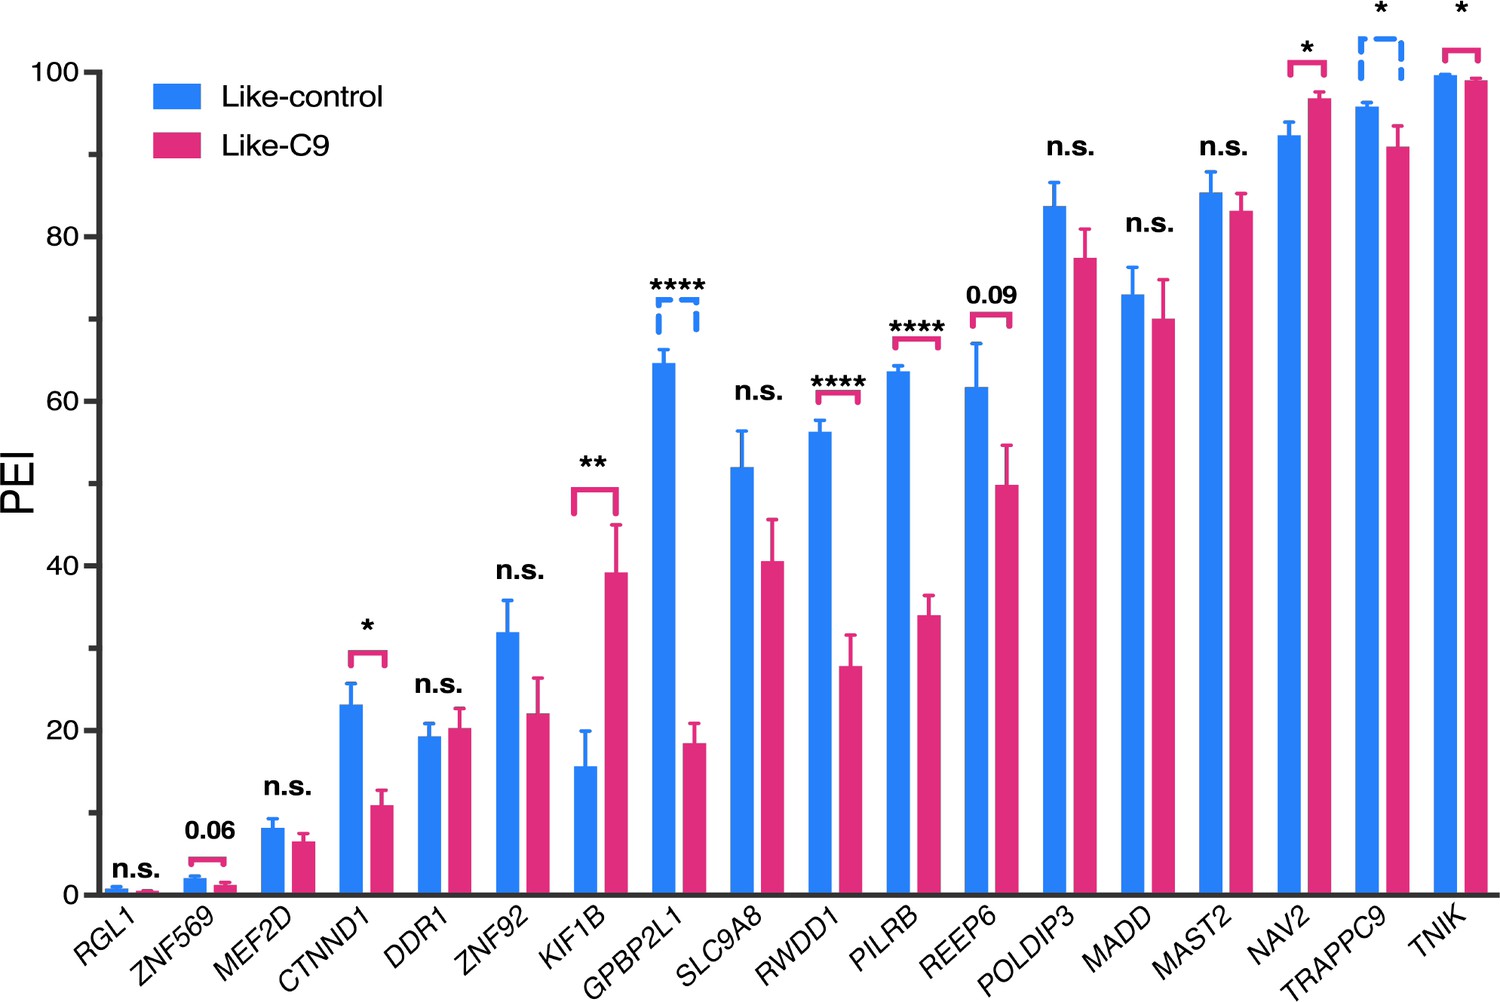
Quanitification of TDP-43 splicing targets.
Summary quantification of rt-PCR of 18 TDP-43 splicing targets with six most like-control (highest CSS) and six most like-C9 (lowest CSS) patients. Signifcant events, using a more permissive cutoff (p<0.10, t test) are indicated with a bracket that is pink if the direction of change indicates TDP-43 LOF in like-C9, or blue and dashed if the direction of change indicates TDP-43 LOF in like-control. (p value: *=0.05, **=<0.01, ***=<0.0001, ****=<0.0001; values between 0.05 and 0.10 are displayed numerically).
Figure 5 with 1 supplement
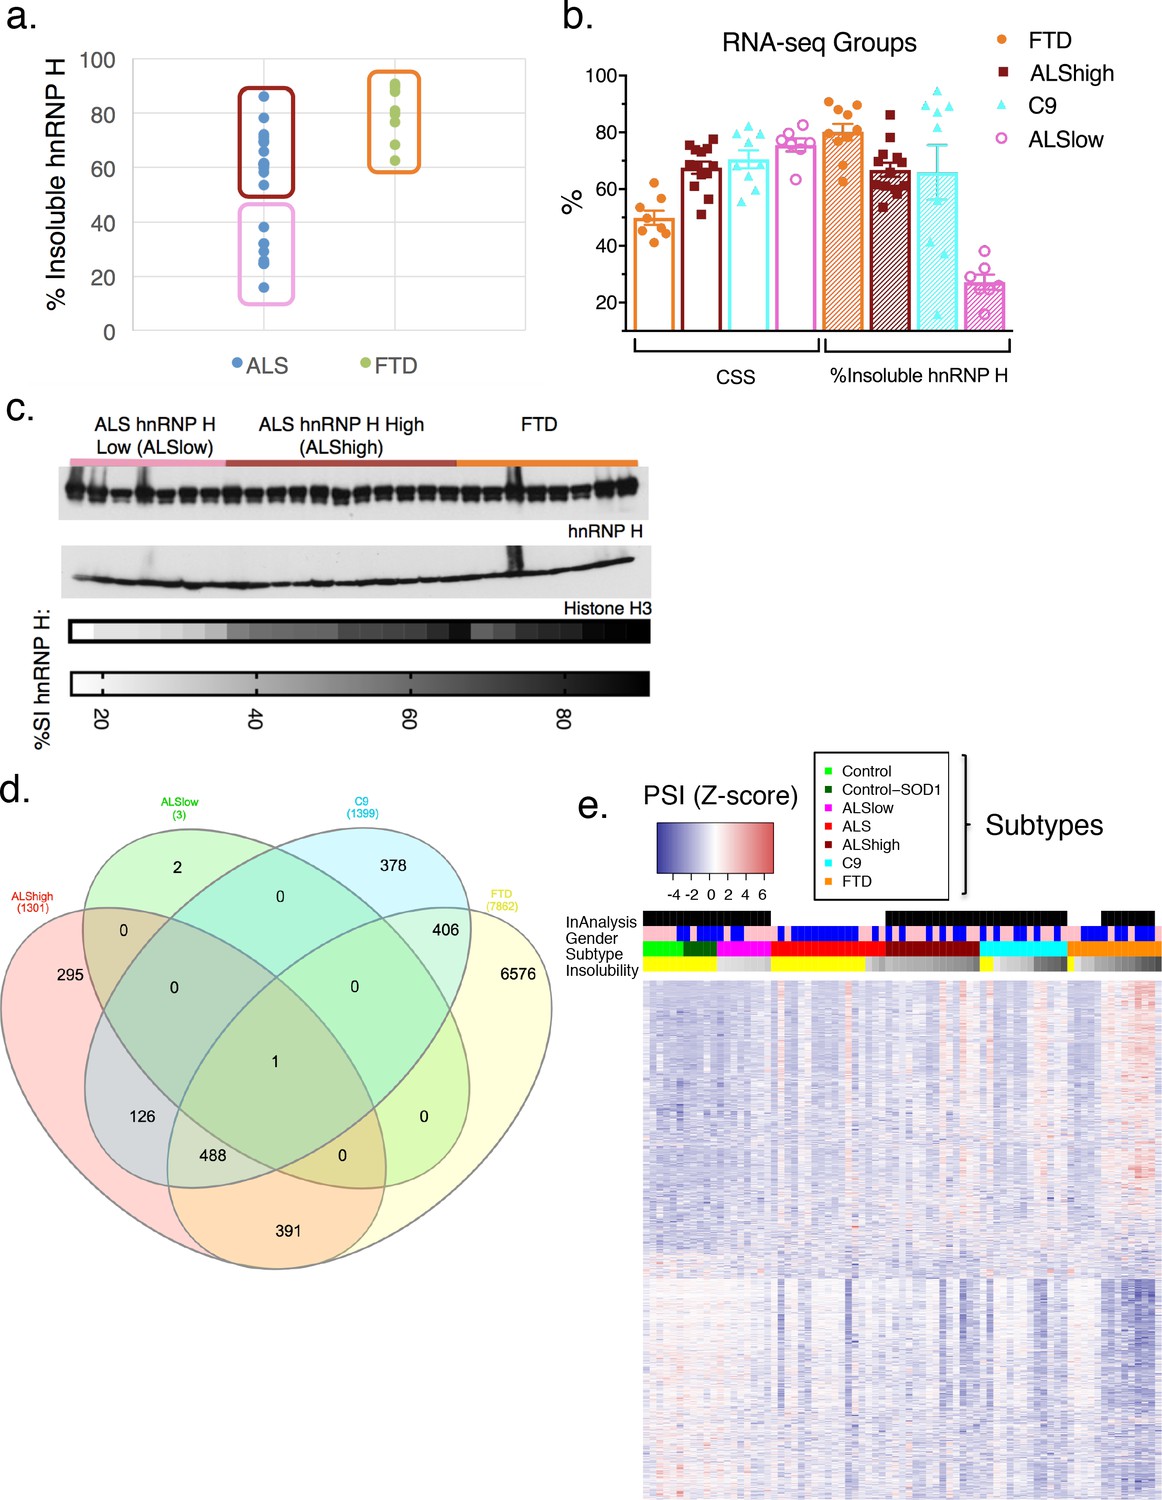
hnRNP H insolubility defines patient groupings for RNA-sequencing analysis.
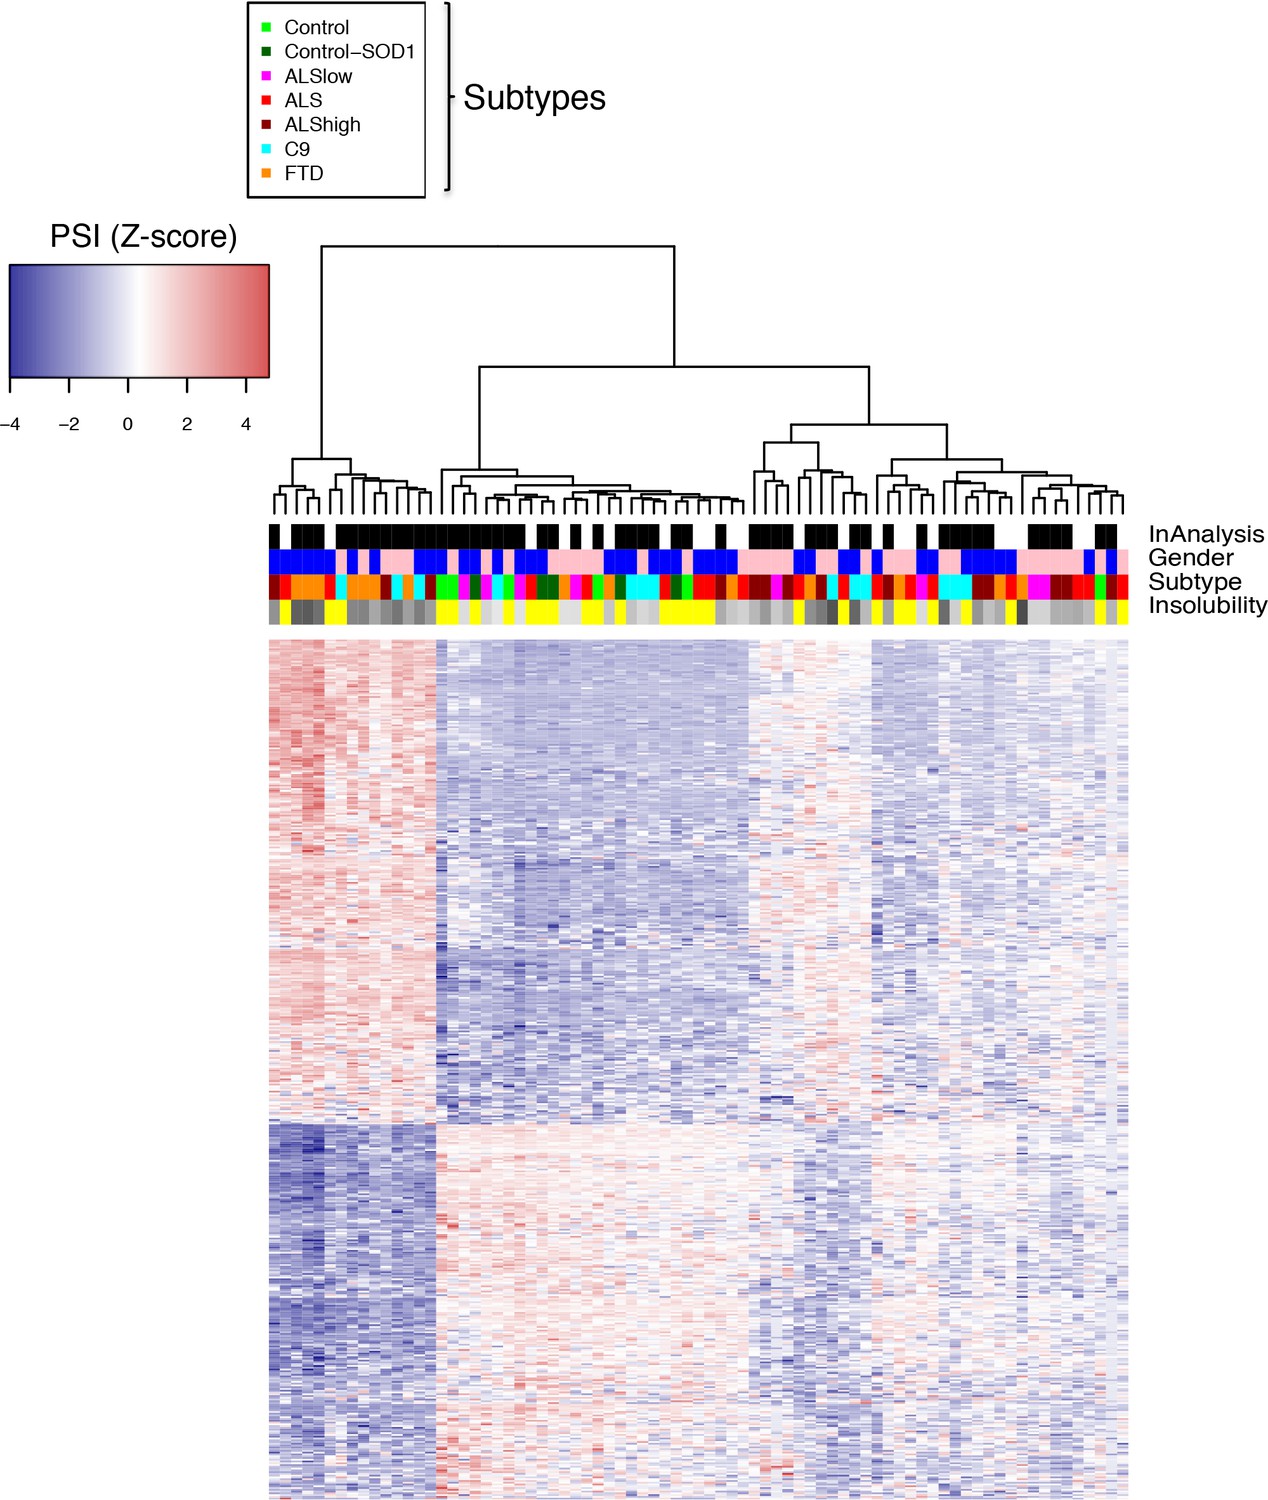
(a) Percent insoluble hnRNP H of 28 samples in RNA-seq analysis reveals 50% as a natural boundary between ALSlow (7 patients) and ALShigh (13 samples) samples. Percent insoluble hnRNP H of FTD patients (8 patients) is also shown. (b) RNA-seq groups plotted by CSS and percent insoluble hnRNP H. All samples used in RNA-seq differential splicing (DS) analysis groups are shown. (c) Western blots of hnRNP H (top) and histone H3 (middle) from whole-tissue homogenates from cerebellum of 26/28 samples used in RNA-seq analysis. Two ALShigh cases (s1 and s20) were excluded in order to fit all samples on one gel. Grayscale heatmap displays percent insoluble hnRNP H (bottom). (d) Venn diagram of all splicing events found to be significantly different between each patient RNA-seq group and the combined control/SOD1ALS group with PSI magnitude filtering (|∆PSI| ≥ 0.1). (e) Heatmap of all events in (d), except for the 6576 events found to have significant DS exclusively in FTD. Blue-red color scale represents Z-score for normalized PSI. Four rows above heatmap display whether each sample was included in the groupings used for the identification of DS events, termed 'In analysis' (black = yes, white = no), gender (pink = female, blue = male), Patient subtype (see key), and percent insolubility hnRNP H (180,000 x G), ranging from light (low insolubility) to dark (high insolubility) gray. Yellow is shown for cases without insolubility data. Patients are arranged by subtype, with increasing insolubility from left to right, where data is available.
Figure 5—figure supplement 1

DS events without filtering.
Venn diagram of all events found to be significantly different between each group and the combined control/SOD1ALS group with no PSI magnitude filtering.
Figure 6 with 5 supplements
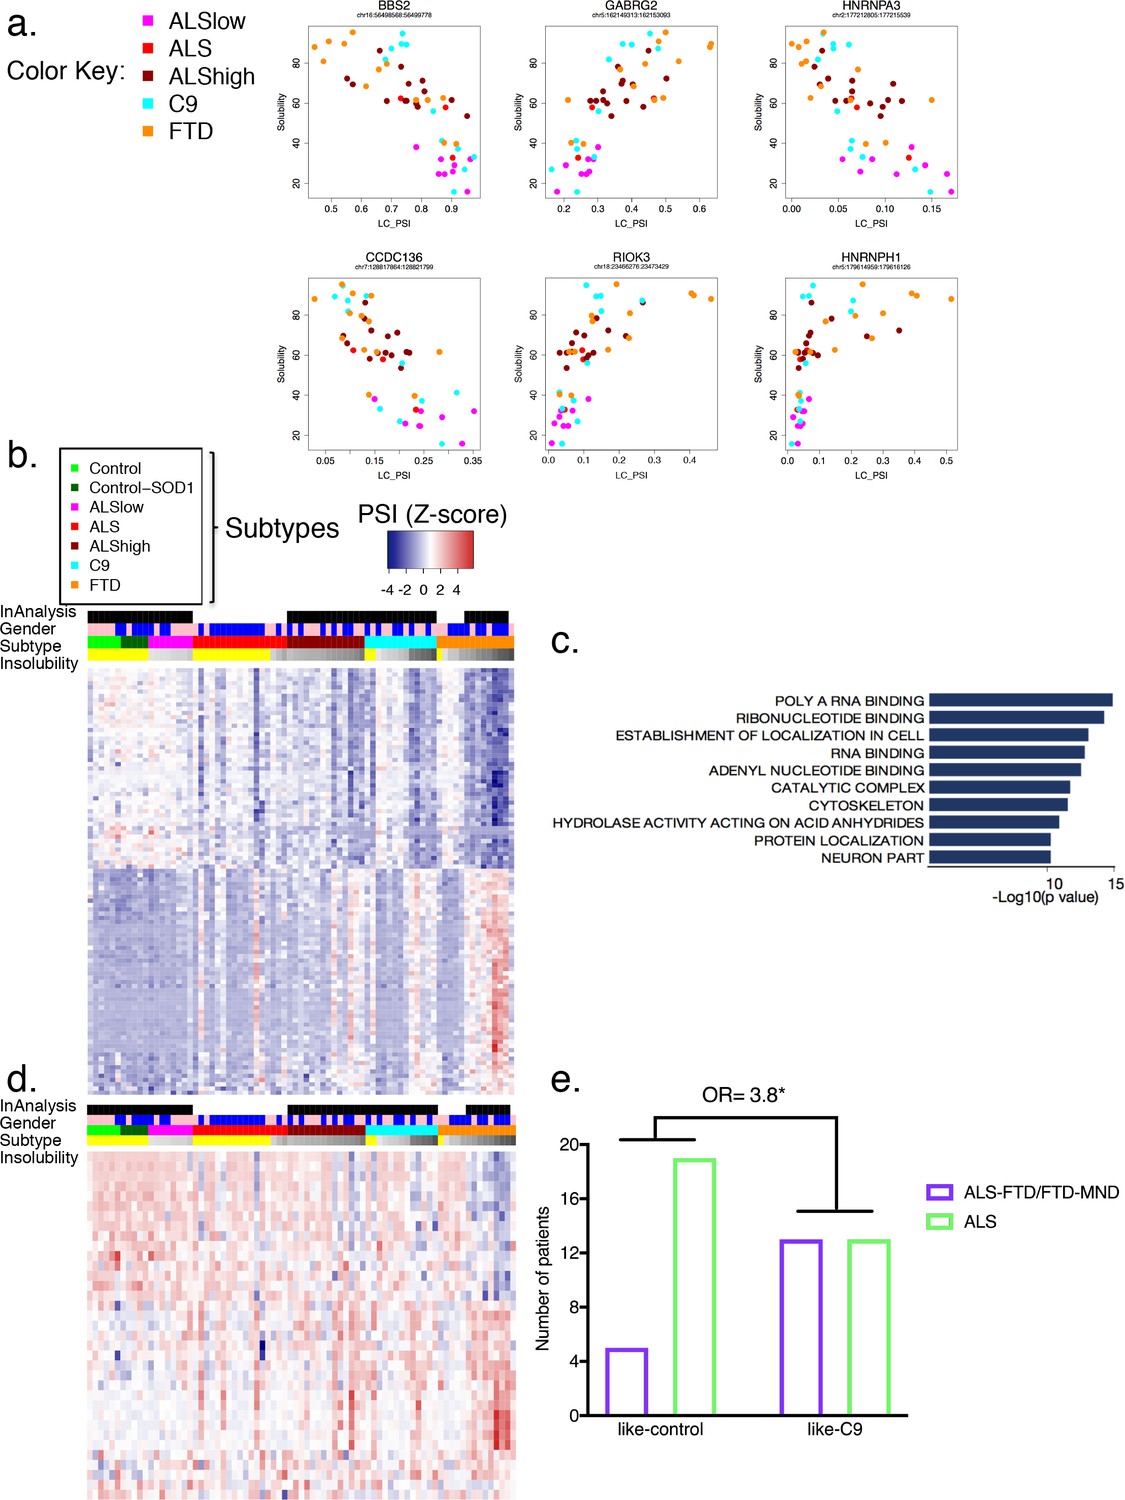
Global splicing differences correlate to hnRNP H insolubility.
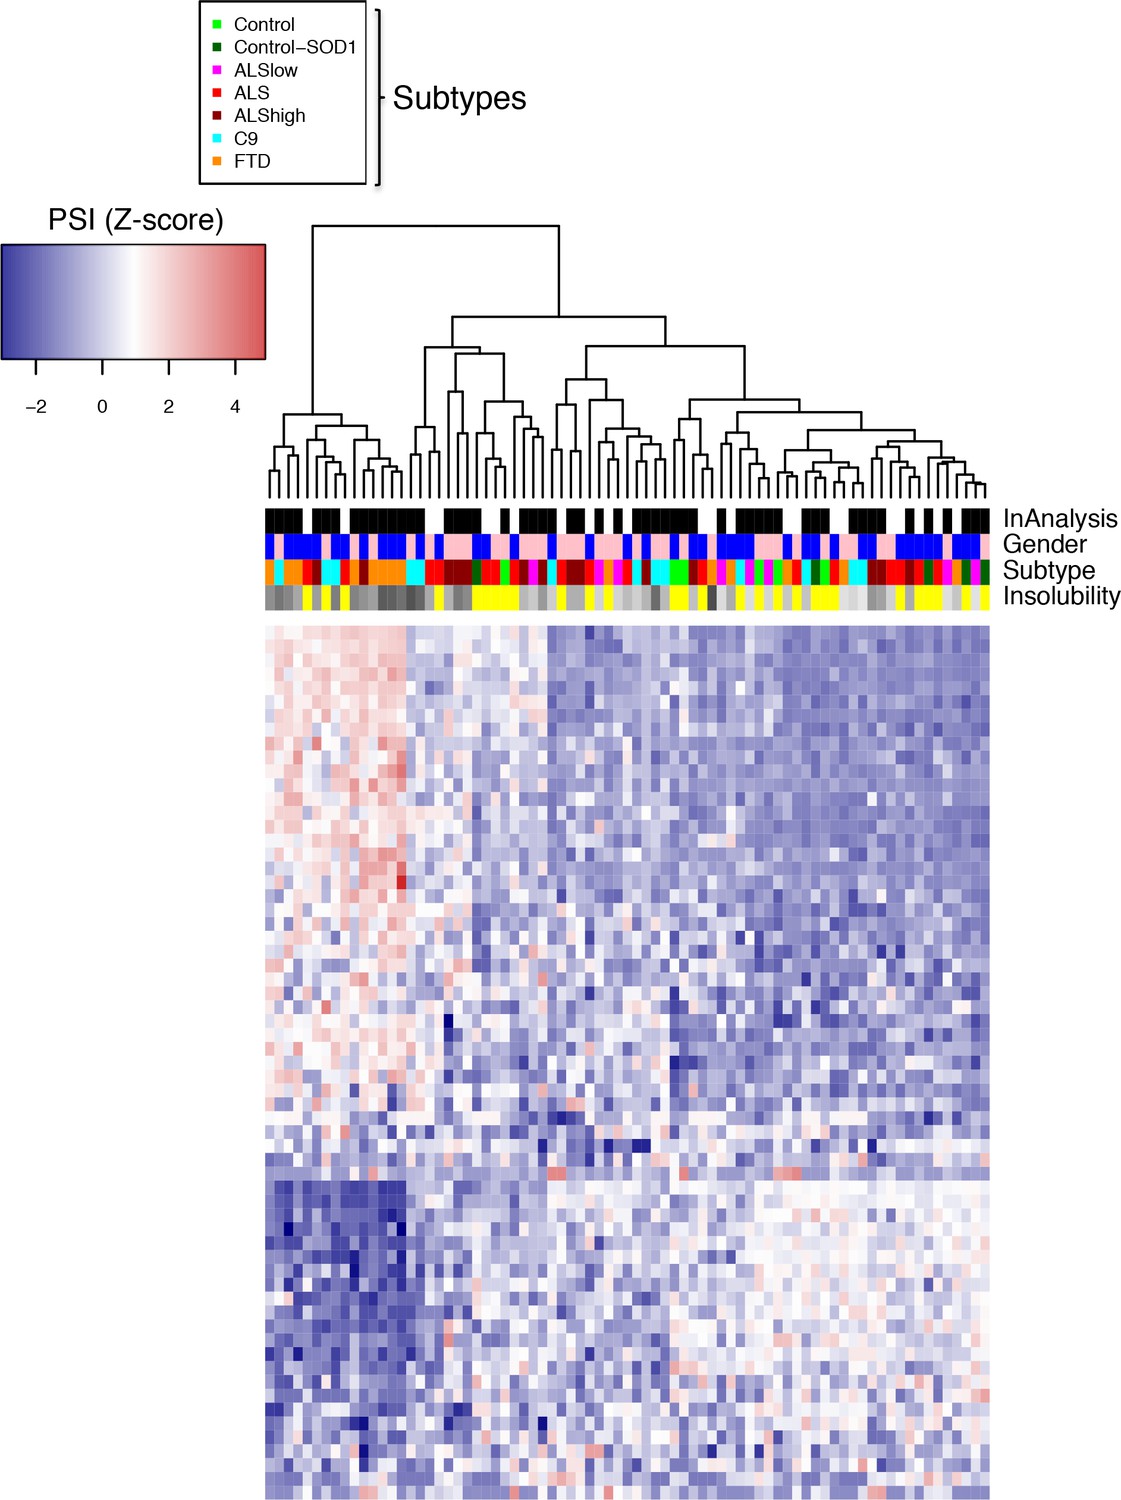
(a) Examples of events amongst the 100-most correlated to insolubility, with Leafcutter (LC) PSI plotted on the X-axis and insolubility (%) on the Y-axis. DS events are shown for the following genes (clockwise, from upper left): BBS2, GABRG2, HNRNPA3, HNRNPH1, RIOK3 and CCDC136 (events listed in Supplementary file 1C). (b) Heatmap of 100 events most correlated/anti-correlated (absolute value Spearman coefficient) with hnRNP H insolubility. Blue-red color scale represents Z-score for normalized PSI. Four rows above heatmap display whether each sample was included in the groupings used for the identification of DS events, termed 'In analysis' (black = yes, white = no), gender (pink = female, blue = male), Patient subtype (see key), and percent insolubility hnRNP H (180,000 x G), ranging from light (low insolubility) to dark (high insolubility) gray. Yellow is shown for cases without insolubility data. Patients are arranged by subtype, with increasing insolubility from left to right, where data is available. (c) Gene set enrichment analysis of top 200 dysregulated splicing events correlated to hnRNP H insolubility. (d) Heatmap of significant DS events that occur in a set of common splicing factor genes, simplified to the single most changed event per gene (hnRNPs, SR proteins, ALS-related RBPs or SMN; events listed in Supplementary file 1D). The same four rows apply as in (b). (e) Bar graph depicting that patients like-C9 are 3.8-times more likely to have symptoms of FTD than patients like-control (Fisher’s exact test, Odds ratio (OR) = 3.8, p=0.032).
Figure 6—figure supplement 1
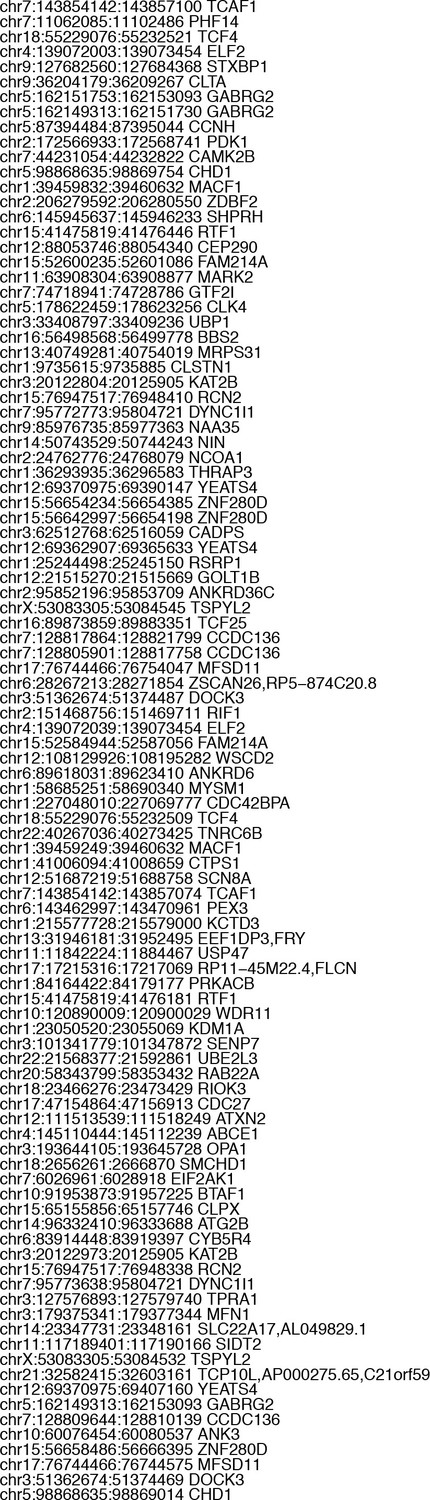
Events in Figure 6b heatmap as they appear in order.
All coordinates are mapped to GRCh38/hg38.
Figure 6—figure supplement 2
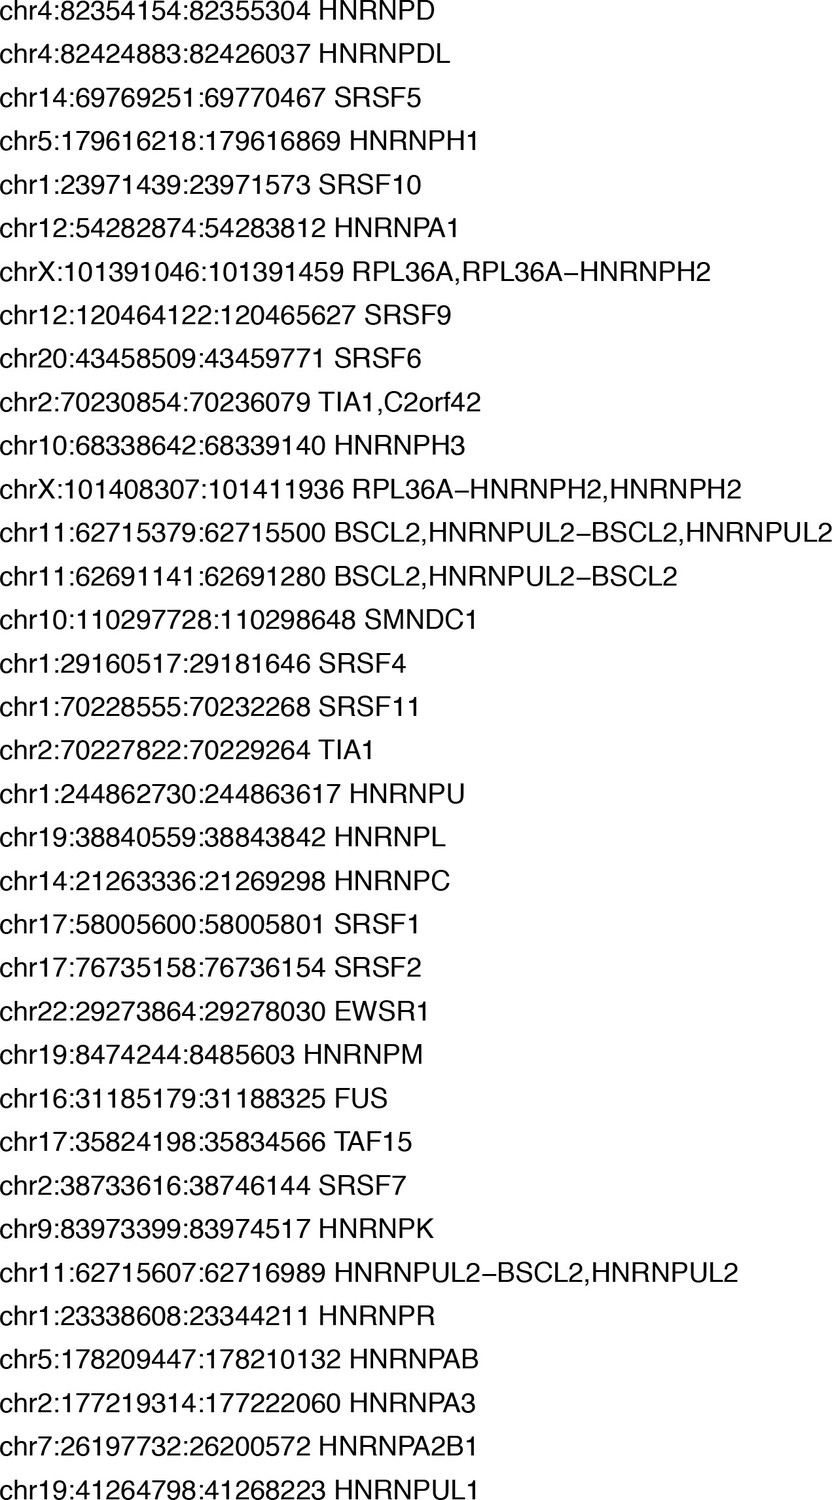
Events in Figure 6d heatmap as they appear in order.
All coordinates are mapped to GRCh38/hg38.
Figure 6—figure supplement 3
Heatmap of intersecting events.
Heatmap of 489 (488 between FTD, C9 and ALShigh plus one between all four groups) overlapping events from Figure 5d, with hierarchical clustering. Blue-red color scale represents Z-score for normalized PSI. Four rows above heatmap display whether each sample was included in the groupings used for the identification of DS events, termed 'In analysis' (black = yes, white = no), gender (pink = female, blue = male), patient subtype (see key), and percent insolubility hnRNP H (180,000 x G), ranging from light (low insolubility) to dark (high insolubility) gray. Yellow is shown for cases without insolubility data.
Figure 6—figure supplement 4
Heatmap of subtype-specific DS events.
Heatmap of non-intersecting events (Figure 5d) comprised of the top 20 events (magnitude |∆PSI|) from each group (FTD, C9, ALShigh), and all three events from ALSlow. Patients are arranged according to vertical dendogram. Blue-red color scale represents Z-score for normalized difference in PSI. Four rows above heatmap display whether each sample was included in the groupings used for the identification of DS events, termed 'In analysis' (black = yes, white = no), gender (pink = female, blue = male), Patient subtype (see key), and percent insolubility hnRNP H (180,000 x G), ranging from light (low insolubility) to dark (high insolubility) gray. Yellow is shown for cases without insolubility data.
Figure 6—figure supplement 5
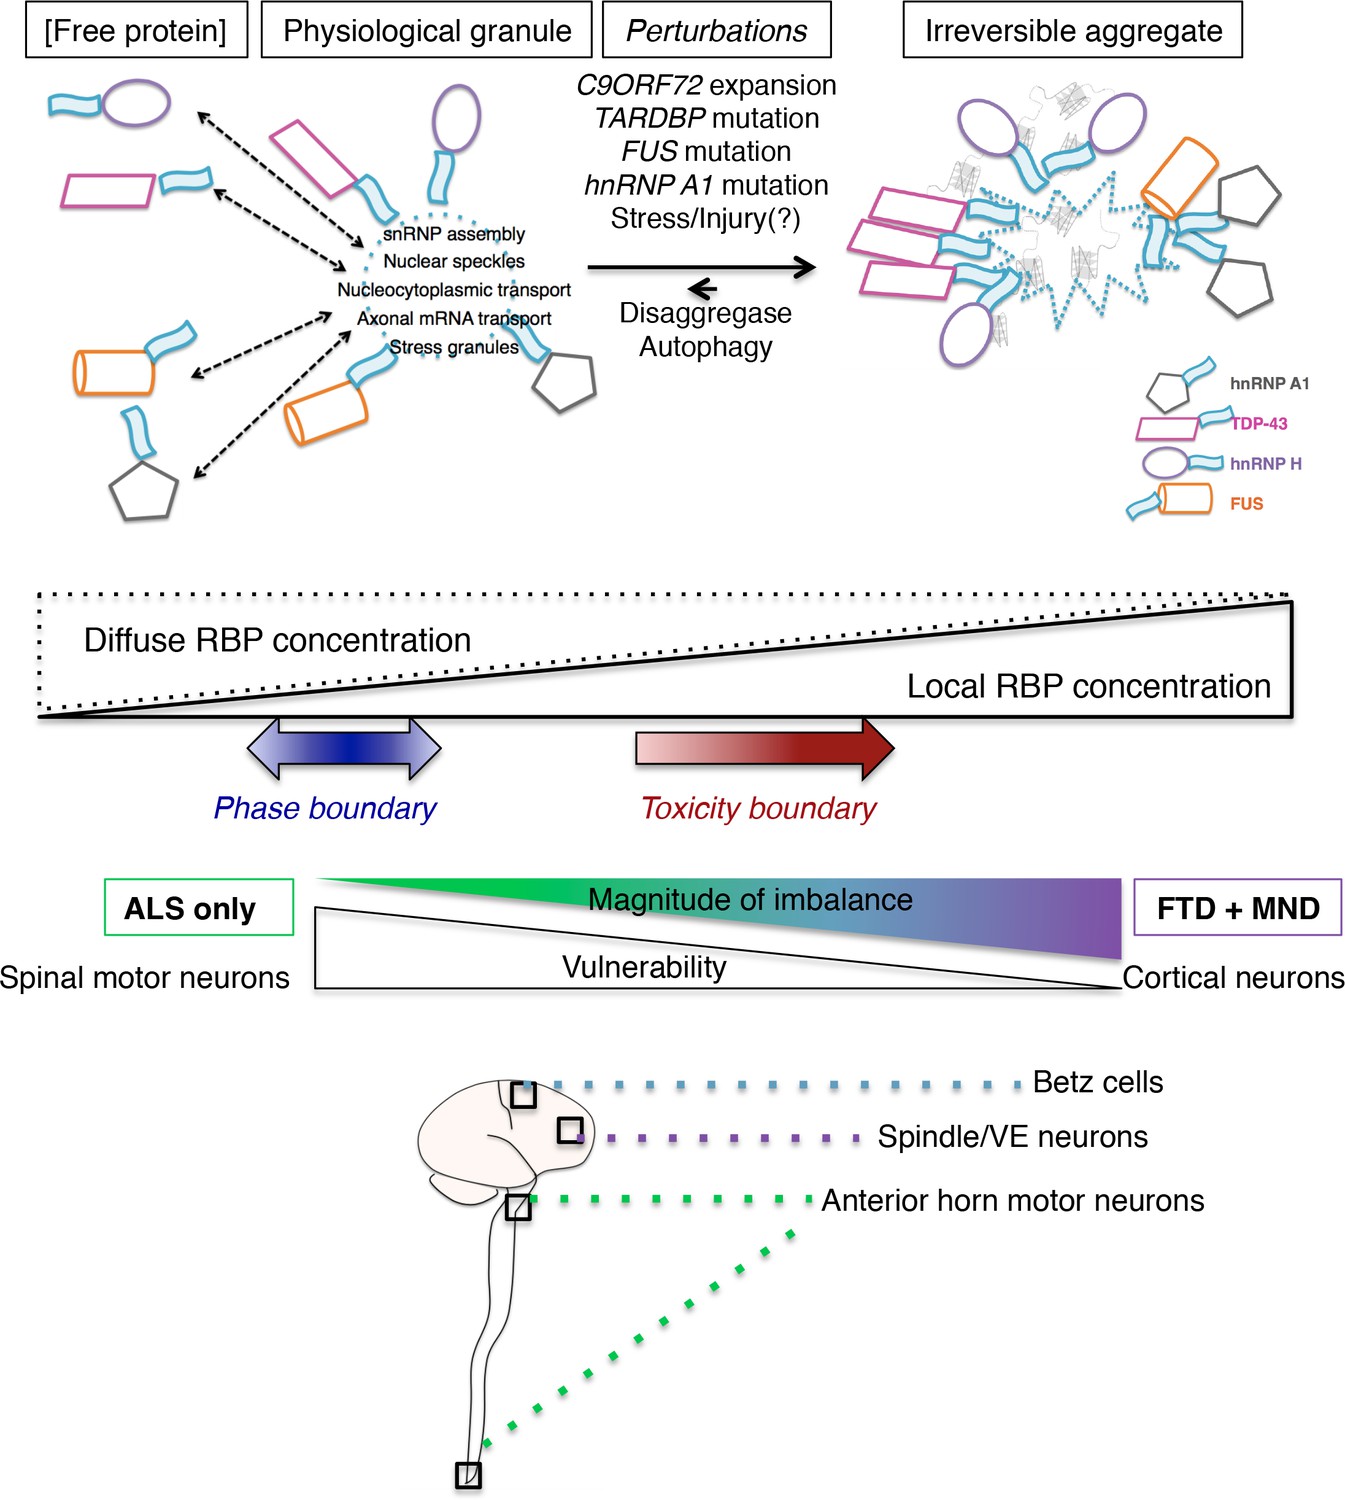
A model for a multi-RBP proteinopathy and splicing dysregulation as a common mechanism underling ALS/FTD pathogenesis.
A model of a multi-RBP proteinopathy, where several disease-related proteins (hnRNP H, TDP-43, FUS, hnRNP A1) can exist in different states: free/soluble, phase separated into reversible granules, and trapped in overly mature granules or aggregated RNA/protein assemblies. The relative balance of these states can be influenced by known ALS/FTD mutations, or normal fluctuations due to experience, thus altering the cellular distribution of RBPs between diffuse and localized/sequestered states. We envision a theoretical ‘toxicity boundary’ beyond which RBPs are disproportionately in the highly concentrated state, and functional levels of soluble protein are low. We propose that the distance past this boundary, or magnitude of the imbalance between free and local RBP concentrations, is correlated to a greater involvement of cortical neuron dysfunction, whereas mild imbalance is sufficient only to cause MN death. Thus our model implies a gradient in vulnerability, with spinal MNs being more sensitive to this imbalance than cortical MNs, which are more vulnerable than neurons (such as spindle/VE (Von economo)) that are predominantly affected in FTD.
Tables
Key resources table
| Reagent type (species) or resource | Designation | Source or reference | Identifiers | Additional information |
|---|---|---|---|---|
| Biological sample (human) | Patient brains samples | NA | All identifiers are provided in Supplementary file 1A | |
| Antibody | hnRNP H (rabbit) | Bethyl, A300-511 | ||
| Antibody | hnRNP H (rabbit, Co-IP) | ThermoFisher, PA5-27610 | ||
| Antibody | TDP-43 (rabbit) | Proteintech, 10782–2-AP | ||
| Antibody | TDP-43 human specific (mouse) | Proteintech, 60019–2-Ig | ||
| Antibody | hnRNP A1 (mouse) | Sigma, 4B10 | ||
| Antibody | FUS (mouse) | Santa Cruz Biotechnologies, H-6 | ||
| Antibody | GAPDH (rabbit) | Sigma, G9545 | ||
| Antibody | U2AF65 (mouse) | Sigma, U4758 | ||
| Antibody | SMN (mouse) | Sigma, S2944 | ||
| Antibody | Histone H3 (rabbit) | Abcam, 1791 | ||
| Antibody | FLAG-M2 (mouse) | Sigma, F1804 | ||
| Antibody | Actin (rabbit) | Sigma, A2066 | ||
| Antibody | C9ORF72 (rabbit) | Novus, 1086CGP | ||
| Software, algorithm | Leafcutter | Li et al. (2018) |
Additional files
-
Supplementary file 1
(A) Patient clinical information. (B) All significant DS events with greater than 10% difference in PSI. All events found to be significantly different between each patient group (FTD, ALShigh, ALSlow, C9) and control (|∆PSI| ≥ 0.1). Events are arranged from greatest to smallest difference in ∆PSI, with ∆PSI values listed. Events without significant change in a given group are denoted with zeroes. All coordinates are mapped to GRCh38/hg38. (C) Significant DS events most correlated to hnRNP H insolubility. Events and spearman rank correlation coefficients are provided. All coordinates are mapped to GRCh38/hg38. (D) Significant DS events occurring in common RBP genes. All events occurring in a set of common splicing factor genes (hnRNPs, SR proteins, ALS-related RBPs or SMN) amongst the events found to be significantly different between each patient group (FTD, ALShigh, ALSlow, C9) and control (no PSI filter). Events without significant change in a given group are denoted with zeroes. All coordinates are mapped to GRCh38/hg38. (E) NYGC ALS Consortium Members.
- https://doi.org/10.7554/eLife.37754.018
-
Transparent reporting form
- https://doi.org/10.7554/eLife.37754.019
Download links
A two-part list of links to download the article, or parts of the article, in various formats.
Downloads (link to download the article as PDF)
Open citations (links to open the citations from this article in various online reference manager services)
Cite this article (links to download the citations from this article in formats compatible with various reference manager tools)
Unexpected similarities between C9ORF72 and sporadic forms of ALS/FTD suggest a common disease mechanism
eLife 7:e37754.
https://doi.org/10.7554/eLife.37754


